12 GHz Radio-Holographic surface measurement of the RRI 10.4 m telescope
Abstract
A modern Q-band low noise amplifier (LNA) front-end is being fitted to the 10.4 m millimeter-wave telescope at the Raman Research Institute (RRI) to support observations in the 40-50 GHz frequency range. To assess the suitability of the surface for this purpose, we measured the deviations of the primary surface from an ideal paraboloid using radio holography. We used the 11.6996 GHz beacon signal from the GSAT3 satellite, a 1.2 m reference antenna, commercial Ku-band Low Noise Block Convereters (LNBC) as the receiver front-ends and a Stanford Research Systems (SRS) lock-in amplifier as the backend. The LNBCs had independent free-running first local oscillators (LO). Yet, we recovered the correlation by using a radiatively injected common tone that served as the second local oscillator. With this setup, we mapped the surface deviations on a grid and measured an rms surface deviation of m with a measurement accuracy of m.
Raman Research Institute, Bangalore 560 080, INDIA
Email: {ramesh, sureshv, sharathbr}@rri.res.in
1. Introduction
RRI has a mm-wave Leighton telescope, of 10.4 m diameter with 81 hexagonal panels (Sridharan 1993). It is being rejuvenated to undertake Q-band observations at 43 GHz. This requires the surface rms error to be below m in order to have an aperture efficieny better than 50%, as given by Ruze’s relation: (Ruze 1966). Radio holographic surface measurement was carried out in Aug-Sep 2007 to measure the surface rms error, and to identify panels that may need correction. In this poster paper, we report the details of this experiment, analyse the data, discuss the results and present our conclusions.

2. Experimental setup
The key idea in Radio Holography is to measure the complex beam pattern. Its fourier transform yields the aperture plane field (APF) distribution. Surface deviations can be calculated from the phases of the APF (Bracewell 1965). The signal-to-noise ratio (SNR) required to measure the surface deviation to an accuracy of m over pixels is proportional to (Scott 1977). For Ku-band ( = 25 mm), the SNR should be 1600 to achieve a measurement accuracy of atleast m.
Both the test (10.4 m) and the reference (1.2 m) antennas were fitted with satellite TV low-noise block converters (LNBCs) as front-ends (see Fig. 1). A 11.315 GHz reference tone was radiatively fed to both the antennas for use as second LOs to remove the effects of the free-running first LOs in the LNBCs. A tracking phase locked loop (PLL) improves the SNR by locking to the signal from the reference antenna down-converted and filtered to 57.5 MHz. On both the chains, signals are down-converted to below 100 kHz and fed to the test (10.4 m) and reference (1.2 m) inputs of the SRS lock-in amplifier (analog correlator). The correlation amplitudes and phases were digitized with a 12 bit analog-to-digital converter (ADC) and recorded in the control computer every 100 ms.
Software was developed to automatically raster-scan the region of interest. Calibration and scan data from the two position encoders and ADCs were recorded. In addition, satellite drift had to be compensated at regular intervals.
3. Observations
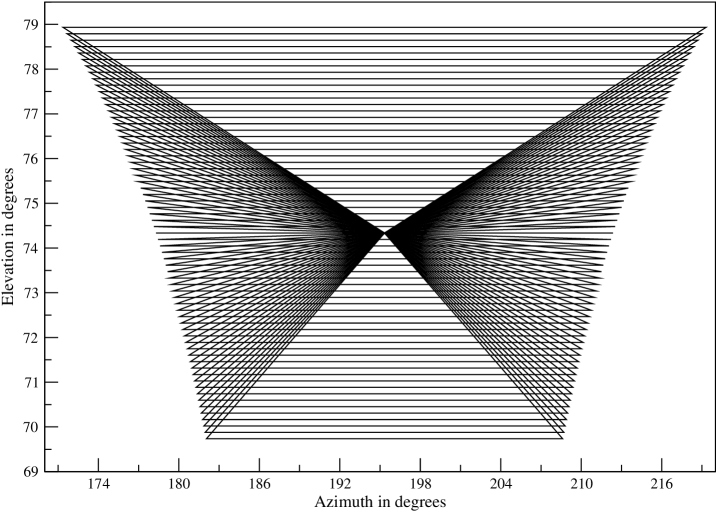
The 11.6996 GHz beacon signal from EDUSAT (Orbital slot: 74∘°E longitude, translates to El: 74.40∘° & Az: 195.75∘) was observed. The correlation co-efficients between the two antennas were recorded on the fly. The map spans in real space in both azimuth (Az) & elevation (El) about the satellite position as shown in Fig. 2(a). The critical sampling at 11.7 GHz is and the measured beam width is . Since the number of pixels across the dish is 64 (a map of ), a spatial resolution of 16 cm was achieved, which is 1/6th the size of one panel in the dish. Each observation lasted 7-8 hrs which includes 65 Az scans, 11 satellite pointings and 8 to 9 repeats of central block of 5 scans. Four independent observations were carried out, all leading to the same results. All the observations were conducted during night to ensure system stability.
4. Results & Conclusions
The effect of free runnning local oscillators in LNBC was solved by radiatively injecting a tone. The effect of satellite drifting was removed by pointing to the satellite every 30 minutes. An SNR 5000 was achieved by making the receiver chain robust, repeating and co-adding the central block scans & using satellite pointing data for amplitude and phase calibration.
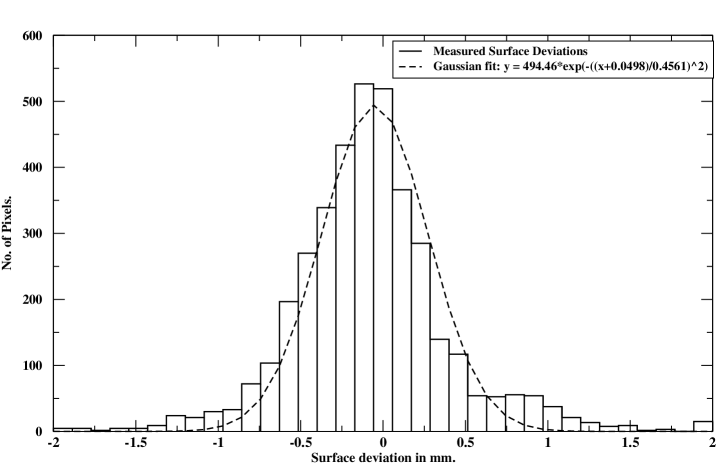
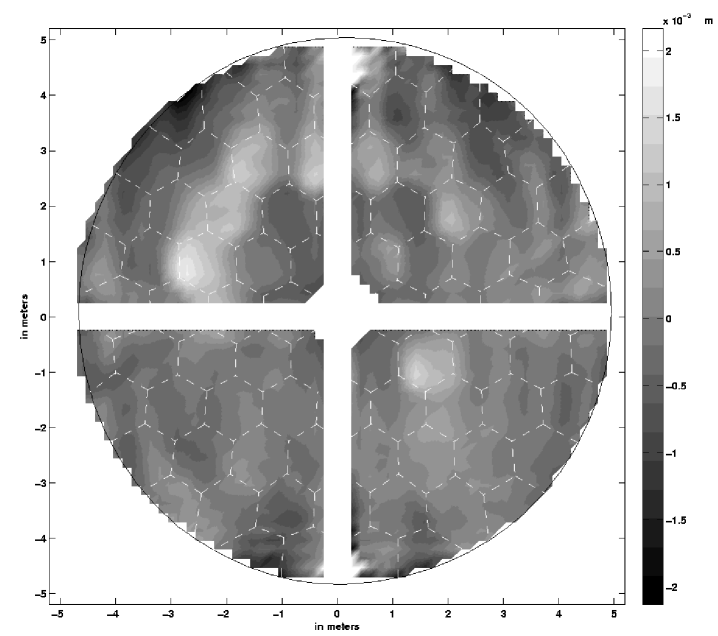
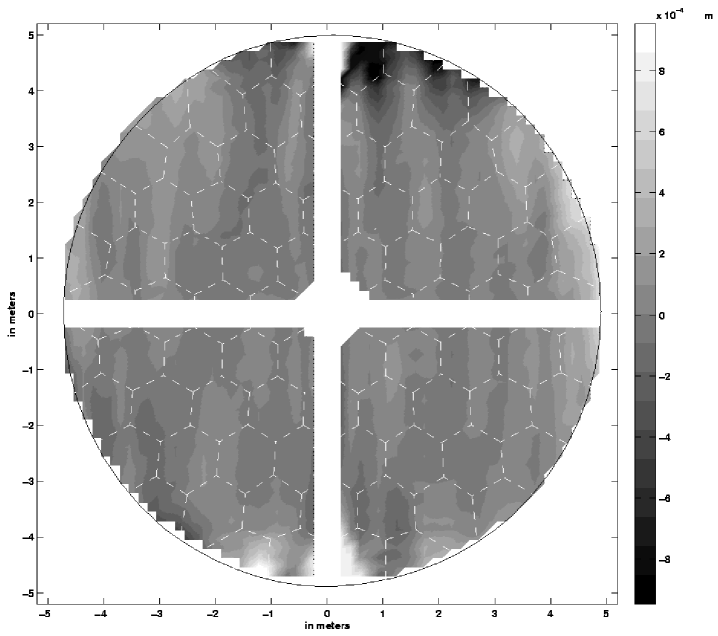
From the measured surface deviations (see Fig. 3(a)), the surface rms error is calculated to be m. It is within /16, implying that Q Band observations are possible. It can also be seen that some panels require correction. Fig. 3(b) shows the residual obtained by subtracting two independent surface deviation measurements. The rms of this residual is m. Therefore, the measurement accuracy is estimated to be m.
Acknowledgment
We would like to thank the Radio Astronomy Lab (RAL), RRI, for providing the components used in the receiver chain. We would also like to thank Prof V. Lakshminarayanan (LC Lab), for sharing the SRS Lockin Amplifier.
References
- Ruze (1966) John Ruze, Antenna Tolerance Theory - A Review, Apr 1966, Proceedings of the IEEE, Vol.54, No.4
- Scott (1977) P.F Scott and M. Ryle, A Rapid method of measuring the figure of a radio telescope reflector, Mon. Not. Roy. Astrol. Soc., 1977, 178, pp. 539-545.
- Sridharan (1993) T.K Sridharan, The RRI 10.4 m millimeter-wave Radio Telescope, BASI, 1993, 21, pp. 339-345.
- Bracewell (1965) R.N. Bracewell, The Fourier Transformation and Its Applications, New York: McGraw-Hill, 1965.