11email: alessandro.loni@inaf.it 22institutetext: Dipartimento di Fisica, Università di Cagliari, Cittadella Universitaria, 09042, Monserrato, Italy 33institutetext: International Centre for Radio Astronomy Research (ICRAR), The University of Western Australia, 35 Stirling Hwy, Crawley, WA 6009, Australia 44institutetext: ARC Centre of Excellence for All-Sky Astrophysics in 3 Dimensions (ASTRO3D) 55institutetext: CSIRO Astronomy and Space Science, Australia Telescope National Facility PO Box 76, Epping, NSW 1710, Australia 66institutetext: Department of Astronomy, University of Cape Town, Private Bag X3, Rondebosch 7701, South Africa 77institutetext: School of Physics and Astronomy, Cardiff University, Queens Buildings The Parade, Cardiff CF24 3AA, UK 88institutetext: INAF-Astronomical observatory of Capodimonte, via Moiariello 16, Naples 80131, Italy 99institutetext: Kapteyn Astronomical Institute, University of Groningen, PO Box 800, 9700 AV Groningen, The Netherlands 1010institutetext: Australian Research Council, Centre of Excellence for All-sky Astrophysics (CAASTRO), Australia 1111institutetext: Department of Physics and Electronics, Rhodes University, PO Box 94, Makhanda, 6140, South Africa
A blind ATCA H\scaleto1.2ex survey of the Fornax galaxy cluster
We present the first interferometric blind H\scaleto1.2ex survey of the Fornax galaxy cluster, which covers an area of 15 deg2 out to the cluster virial radius. The survey has a spatial and velocity resolution of 67″ 95″( kpc at the Fornax cluster distance of 20 Mpc) and 6.6 km s-1 and a 3 sensitivity of 2 1019 cm-2 and 2 107 M⊙, respectively. We detect 16 galaxies out of roughly 200 spectroscopically confirmed Fornax cluster members. The detections cover about three orders of magnitude in H\scaleto1.2ex mass, from to M⊙. They avoid the central, virialised region of the cluster both on the sky and in projected phase-space, showing that they are recent arrivals and that, in Fornax, H\scaleto1.2ex is lost within a crossing time, Gyr. Half of these galaxies exhibit a disturbed H\scaleto1.2ex morphology, including several cases of asymmetries, tails, offsets between H\scaleto1.2ex and optical centres, and a case of a truncated H\scaleto1.2ex disc. This suggests that these recent arrivals have been interacting with other galaxies, the large-scale potential or the intergalactic medium, within or on their way to Fornax. As a whole, our Fornax H\scaleto1.2ex detections are H\scaleto1.2ex-poorer and form stars at a lower rate than non-cluster galaxies in the same range. This is particularly evident at M⊙, indicating that low mass galaxies are more strongly affected throughout their infall towards the cluster. The / ratio of Fornax galaxies is comparable to that in the Virgo cluster. At fixed , our H\scaleto1.2ex detections follow the non-cluster relation between and the star formation rate, and we argue that this implies that thus far they have lost their H\scaleto1.2ex on a timescale Gyr. Deeper inside the cluster H\scaleto1.2ex removal is likely to proceed faster, as confirmed by a population of H\scaleto1.2ex-undetected but H2\scaleto1.2ex0pt-detected star-forming galaxies. Overall, based on ALMA data, we find a large scatter in H2\scaleto1.2ex0pt-to-H\scaleto1.2ex mass ratio, with several galaxies showing an unusually high ratio that is probably caused by faster H\scaleto1.2ex removal. Finally, we identify an H\scaleto1.2ex-rich subgroup of possible interacting galaxies dominated by NGC 1365, where pre-processing is likey to have taken place.
Key Words.:
galaxies: cluster / galaxies: evolution / galaxies: ISM1 Introduction
It is known that the evolution of galaxies is faster in denser environments (Diaferio et al., 2001) and that, as a consequence, the relative abundance of red early-type galaxies and blue late-type galaxies changes with environment density (Hubble & Humason, 1931; Oemler, 1974; Dressler, 1980). In this context, galaxy clusters are the most extreme environments within which galaxies evolve. They are characterised by a high number density of galaxies and by the presence of a dense intra-cluster medium (ICM), which galaxies move through. Thus, in clusters, both hydrodynamical and gravitational interactions such as ram-pressure stripping and tidal interactions, respectively, are likely to happen (Gunn & Gott 1972; Toomre & Toomre 1972), as well as mergers between galaxies (at least in the cluster outskirts - Sheen et al. 2012; Oh et al. 2018). These interactions deplete the cold gas reservoirs of galaxies and, therefore, affect their star formation activity. The balance between these types of interactions depends both on galaxy properties – including their orbits – and on cluster properties, such as the number density of galaxies and the ICM density. Therefore, we expect galaxy evolution to proceed differently in different clusters.
The aim of this work is to study galaxy evolution in the Fornax cluster, which is a low mass cluster (7 M⊙ within a radius of 1.4 Mpc - twice the virial radius, ; Drinkwater et al. 2001a), located in the southern sky at a distance of 20 Mpc (Blakeslee et al., 2009). Fornax is thus the second closest galaxy cluster to us after Virgo. Fornax has roughly 200 spectroscopically confirmed galaxies within 700 kpc (Maddox et al., 2019). NGC 1399 is the central dominant galaxy, which coincides with the peak of the X-ray emission (Paolillo et al., 2002), and the majority of the massive galaxies in the cluster central region are of an early morphological type. Thus, Fornax shows a more dynamically evolved state than Virgo (Grillmair et al., 1994; Jordán et al., 2007), but its growth is not over at all.
The Fornax region includes two main substructures (Drinkwater et al., 2001a). The first is the cluster itself centred on NGC 1399, whose interaction with NGC 1404 is revealed by a perturbed ICM distribution (e.g. Sheardown et al. 2018). Here, three well defined groups of galaxies with different light and colour distributions, kinematics, and stellar populations were found by combining the Fornax Deep Survey imaging (Iodice et al., 2019b) with Fornax 3D spectroscopy (Iodice et al., 2019a) in the two-dimensional projected phase space: the core, the north-south clump and the infalling galaxies (see Fig. 7 in Iodice et al. 2019a). The core is still dominated by NGC 1399, which is one of only two slow-rotators inside the virial radius (NGC 1427 is the other one, located on the east side of the cluster). The NS-clump is located in the high-density region of the cluster (within Mpc in projection), where the X-ray emission is still bright. It hosts the reddest and most metal-rich galaxies, all of them fast-rotating early-type galaxies. The bulk of the gravitational interactions between Fornax galaxies as well as most of the intra-cluster baryons (i.e. diffuse light, globular clusters and planetary nebulae) (Cantiello et al., 2018; Spiniello et al., 2018; Iodice et al., 2019b) are found in this NS clump, where galaxy growth is still ongoing through the accretion of mass onto galaxies’ outer regions (Spavone et al., 2020). The third group of objects in the cluster includes the infalling galaxies, which are distributed nearly symmetrically around the core in the low-density region outside Mpc in projection. The majority of these galaxies are late-types with ongoing star formation. Most of them exhibit signs of interaction with the environment and/or minor mergers in the form of tidal tails and disturbed molecular gas (Zabel et al., 2019; Raj et al., 2019). Previous works had also shown that numerous dwarf galaxies are currently falling into the centre of the cluster (Drinkwater et al., 2001b; Schröder et al., 2001; Waugh et al., 2002). Finally, the other major structure in the Fornax volume is the infalling group centred on NGC 1316 (Fornax A), located 1.5 Mpc south-west of the cluster centre and experiencing ongoing interactions between its members (Schweizer, 1980; Horellou et al., 2001; Iodice et al., 2017; Serra et al., 2019).
The observation of galaxies’ atomic hydrogen through the 21 cm wavelength emission line (H\scaleto1.2ex) gives us information on the evolutionary state of galaxies as well as a global picture of the cluster. The evolution of galaxies depends on the evolution of their atomic hydrogen reservoir, which is the primary reservoir of fuel for star formation. Since it typically extends to the outskirts of galaxies, H\scaleto1.2ex gas is the first component that is affected by tidal interactions, ram-pressure stripping and mergers. Indeed, cluster galaxies are usually deficient in atomic hydrogen with respect to non-cluster galaxies (Giovanelli & Haynes, 1983; Haynes & Giovanelli, 1986; Boselli & Gavazzi, 2006). H\scaleto1.2ex is, therefore, a crucial observable for understanding galaxy evolution in dense environments (Hughes & Cortese, 2009; Chung et al., 2009).
H\scaleto1.2ex emission in the Fornax cluster was studied in several works. Bureau et al. (1996) used the Parkes radio telescope to measure the amount of atomic hydrogen in 21 undisturbed galaxies with morphologies S0a or later, located within 6 deg from NGC 1399 and with cz 2520 km s-1. The eight galaxies within did not show any peculiar value in the /Iband infrared luminosity ratio with respect to the rest of the sample. The same ratio evaluated for Ursa Major galaxies, a lower density environment than Fornax, led them to conclude that the observed Fornax galaxies are not H\scaleto1.2ex deficient.
The first blind H\scaleto1.2ex survey of Fornax was carried out by Barnes et al. (1997), also with the Parkes telescope. They detected H\scaleto1.2ex in eight galaxies within an area of 8 8 deg2. Of those, two galaxies are within the cluster : ESO 358G-063 and NGC 1365. Thanks to the survey sensitivity, they excluded the existence of a significant population of optically undetected H\scaleto1.2ex clouds with H\scaleto1.2ex mass greater than 108 M⊙.
The number of H\scaleto1.2ex detections within the Fornax central region increased with the targeted survey by Schröder et al. (2001). They found H\scaleto1.2ex in 37 out of 66 galaxies. Of those, 14 are within , while the rest lies within 5 deg from the centre of the cluster. They found a lack of H\scaleto1.2ex in the cluster centre, and measured the H\scaleto1.2ex deficiency parameter to be (as defined in Solanes et al. 1996). This shows a modest H\scaleto1.2ex depletion in Fornax (usually, galaxies with H\scaleto1.2ex deficiency parameter ¿ 0.3 are considered to be H\scaleto1.2ex deficient, e.g. Dressler 1986; Solanes et al. 2001). Furthermore, the toblue light ratio of Fornax galaxies - mean value () ML⊙ - is a factor 1.7 lower than in the field. They also showed that the velocity dispersion of the sample of H\scaleto1.2ex deficient galaxies is lower than that of the remaining H\scaleto1.2ex detected galaxies. This difference in velocity dispersion agrees with the deficient galaxies having more radial orbits (as shown in Dressler 1986), which makes them good candidates for ram-pressure stripping (as discussed in Solanes et al. 2001).
Waugh et al. (2002) presented a blind survey of Fornax based on the H\scaleto1.2ex Parkes All Sky Survey (HIPASS Barnes et al. 2001) data with a limit of 1.4 108 M⊙. They detected 110 galaxies within an area of 620 deg2 around the cluster. Of those, nine H\scaleto1.2ex detections are within . The authors confirmed a H\scaleto1.2ex depletion in the H\scaleto1.2ex detections (all late types) near the centre of the cluster, and suggested that H\scaleto1.2ex-rich galaxies detected in the outer parts of the cluster are infalling towards the cluster for the first time. H\scaleto1.2ex detections are arranged in a large scale sheet-like structure with a negative velocity gradient from south-east to north-west.
Waugh (2005) presented the result of the deepest blind H\scaleto1.2ex survey of the cluster so far: the Basketweave survey of Fornax carried out with the Parkes telescope. This survey used a new scanning technique, which improved the sampling and the noise level compared to HIPASS. H\scaleto1.2ex was detected in 53 galaxies within 100 deg2 down to a detection limit of 108 M⊙. Of those, 15 were new detections, which confirmed the results of Waugh et al. (2002). In addition, the author presented higher resolution H\scaleto1.2ex observations (2 arcmin, 3.3 km s-1) of 28 individual Fornax galaxies carried out with the Australia Telescope Compact Array (ATCA). Of those, six are within . Within this region, ESO LV-3580611 was marked as having an intriguing H\scaleto1.2ex morphology with an elongation to the north-east of the system. As suggested in Schröder et al. (2001), also Waugh (2005) pointed out that this galaxy may be moving towards us.
The only other Fornax galaxy within with resolved H\scaleto1.2ex imaging is NGC 1365 (van der Hulst et al., 1983; Jorsater & van Moorsel, 1995). The latter study observed an elongated H\scaleto1.2ex distribution to the west of the system. They suggested that it may be caused by the interaction with the ICM.
All previous blind H\scaleto1.2ex surveys of Fornax were carried out with the Parkes telescope. Their angular resolution of 15 arcmin was insufficient to study the H\scaleto1.2ex morphology of the detected galaxies, which is a powerful tracer of environmental effects. Better angular resolution was achieved with the interferometric observation of a few selected galaxies in Fornax (see references above), but those observations covered only a small portion of the cluster volume. Here we present the first, blind, interferometric H\scaleto1.2ex survey of the Fornax cluster.
Our survey was carried out with the ATCA and covers an area of 15 deg2 centred on NGC 1399 with a spatial and velocity resolution of 67″ 95″( kpc at a distance of 20 Mpc) and 6.6 km s-1, respectively. The average column density sensitivity within the survey area is 21019 cm-2 (3 over 25 km s-1) and the sensitivity is 2 M⊙ (3 over 100 km s-1). Initially, a case study by Lee-Waddell et al. (2018) revealed the tidal origin of NGC 1427A using spatially resolved H\scaleto1.2ex images from a subregion of our ATCA mosaic. Here we present the results of the full survey. In Sect.2 we describe observations and data reduction. In Sect.3 we present the H\scaleto1.2ex detections, their H\scaleto1.2ex images and spectra. We also compare their H\scaleto1.2ex mass, H2\scaleto1.2ex0pt mass and SFR relative to non-cluster control samples, and compare their spatial and velocity distribution with those of the general Fornax population. In Sect. 4 we discuss our results, which we then summarise in Sect.5. We include supplementary material on each galaxy in Appendix A.
2 ATCA observations and data reduction
Our blind Fornax survey covers an area of 15 deg2 (defined at a sensitivity level 3 higher than in the best region of the H\scaleto1.2ex cube), spanning from the centre of the cluster to a distance slightly further than . The observations were carried out with the ATCA in the 750B configuration, from December 2013 to January 2014 (project code C2894)111Data available on https://atoa.atnf.csiro.au/query.jsp. The cluster was observed for 336 hrs using 756 different pointings with a spacing of 8.6 arcmin (1/4 of the primary beam FWHM at 1.4 GHz)
The 64 MHz bandwidth, centred at 1396 MHz, was divided into 2048 channels, providing a velocity resolution of 6.6 km s-1. We reduced the data using the MIRIAD software (Sault et al., 1995). PKS B1934-638 and PKS 0332-403 were chosen as the bandpass calibrator and the phase calibrator, respectively. The latter was observed at 1.5 hr intervals between on-source scans. We flagged strong radio frequency interference based on Stokes V visibilities. After flagging and calibration we further processed a restricted frequency range 1407.2 MHz - 1419.6 (which corresponds to the velocity range of 166 - 2783 km s-1), which includes all spectroscopically confirmed Fornax galaxies (Maddox et al., 2019). Within this range we used the UVLIN task of MIRIAD to fit and subtract continuum emission using 2nd-order polynomials.
We obtained the dirty cube with the INVERT task using natural weights to maximise surface-brightness sensitivity. We used MOSMEM and RESTOR to clean and restore H\scaleto1.2ex emission, respectively. The restoring Gaussian PSF has a major and minor axis FWHM of 95 and 67 arcsec, respectively, and a position angle of 0.4 deg. The root mean square (RMS) noise level of the final cube goes down to 2.0 mJy beam-1 in the most sensitive region. Within the survey area the RMS noise is mJy beam-1 and, on average, 2.8 mJy beam-1. This corresponds to a H\scaleto1.2ex column density sensitivity of 1019 cm-2 assuming a line width of 25 km s-1 and a sensitivity of 2107 M⊙ over a linewidth of 100 km s-1. We searched for H\scaleto1.2ex sources with the SoFiA source-finding package (Serra et al., 2015) within the survey footprint (see the green outline in Fig. 1). By smoothing and clipping, we convolve the input cube with a set of kernels and detect emission above 3.5 of the local noise level of each kernel. Reliable detections are identified based on the reliability algorithm presented in (Serra et al., 2012), which assumes that true sources have positive total flux and that the noise is symmetric around 0. For one faint source, NGC 1436, visual inspection was necessary to improve the SoFiA detection mask used to estimate galaxy parameters. Lastly, our final list of H\scaleto1.2ex detections includes a faint source which did not pass the reliability test, but which we consider a genuine detection given its spatial correspondence with the known optical source FCC 323.
3 H\scaleto1.2ex detections in the Fornax cluster
3.1 H\scaleto1.2ex detection properties
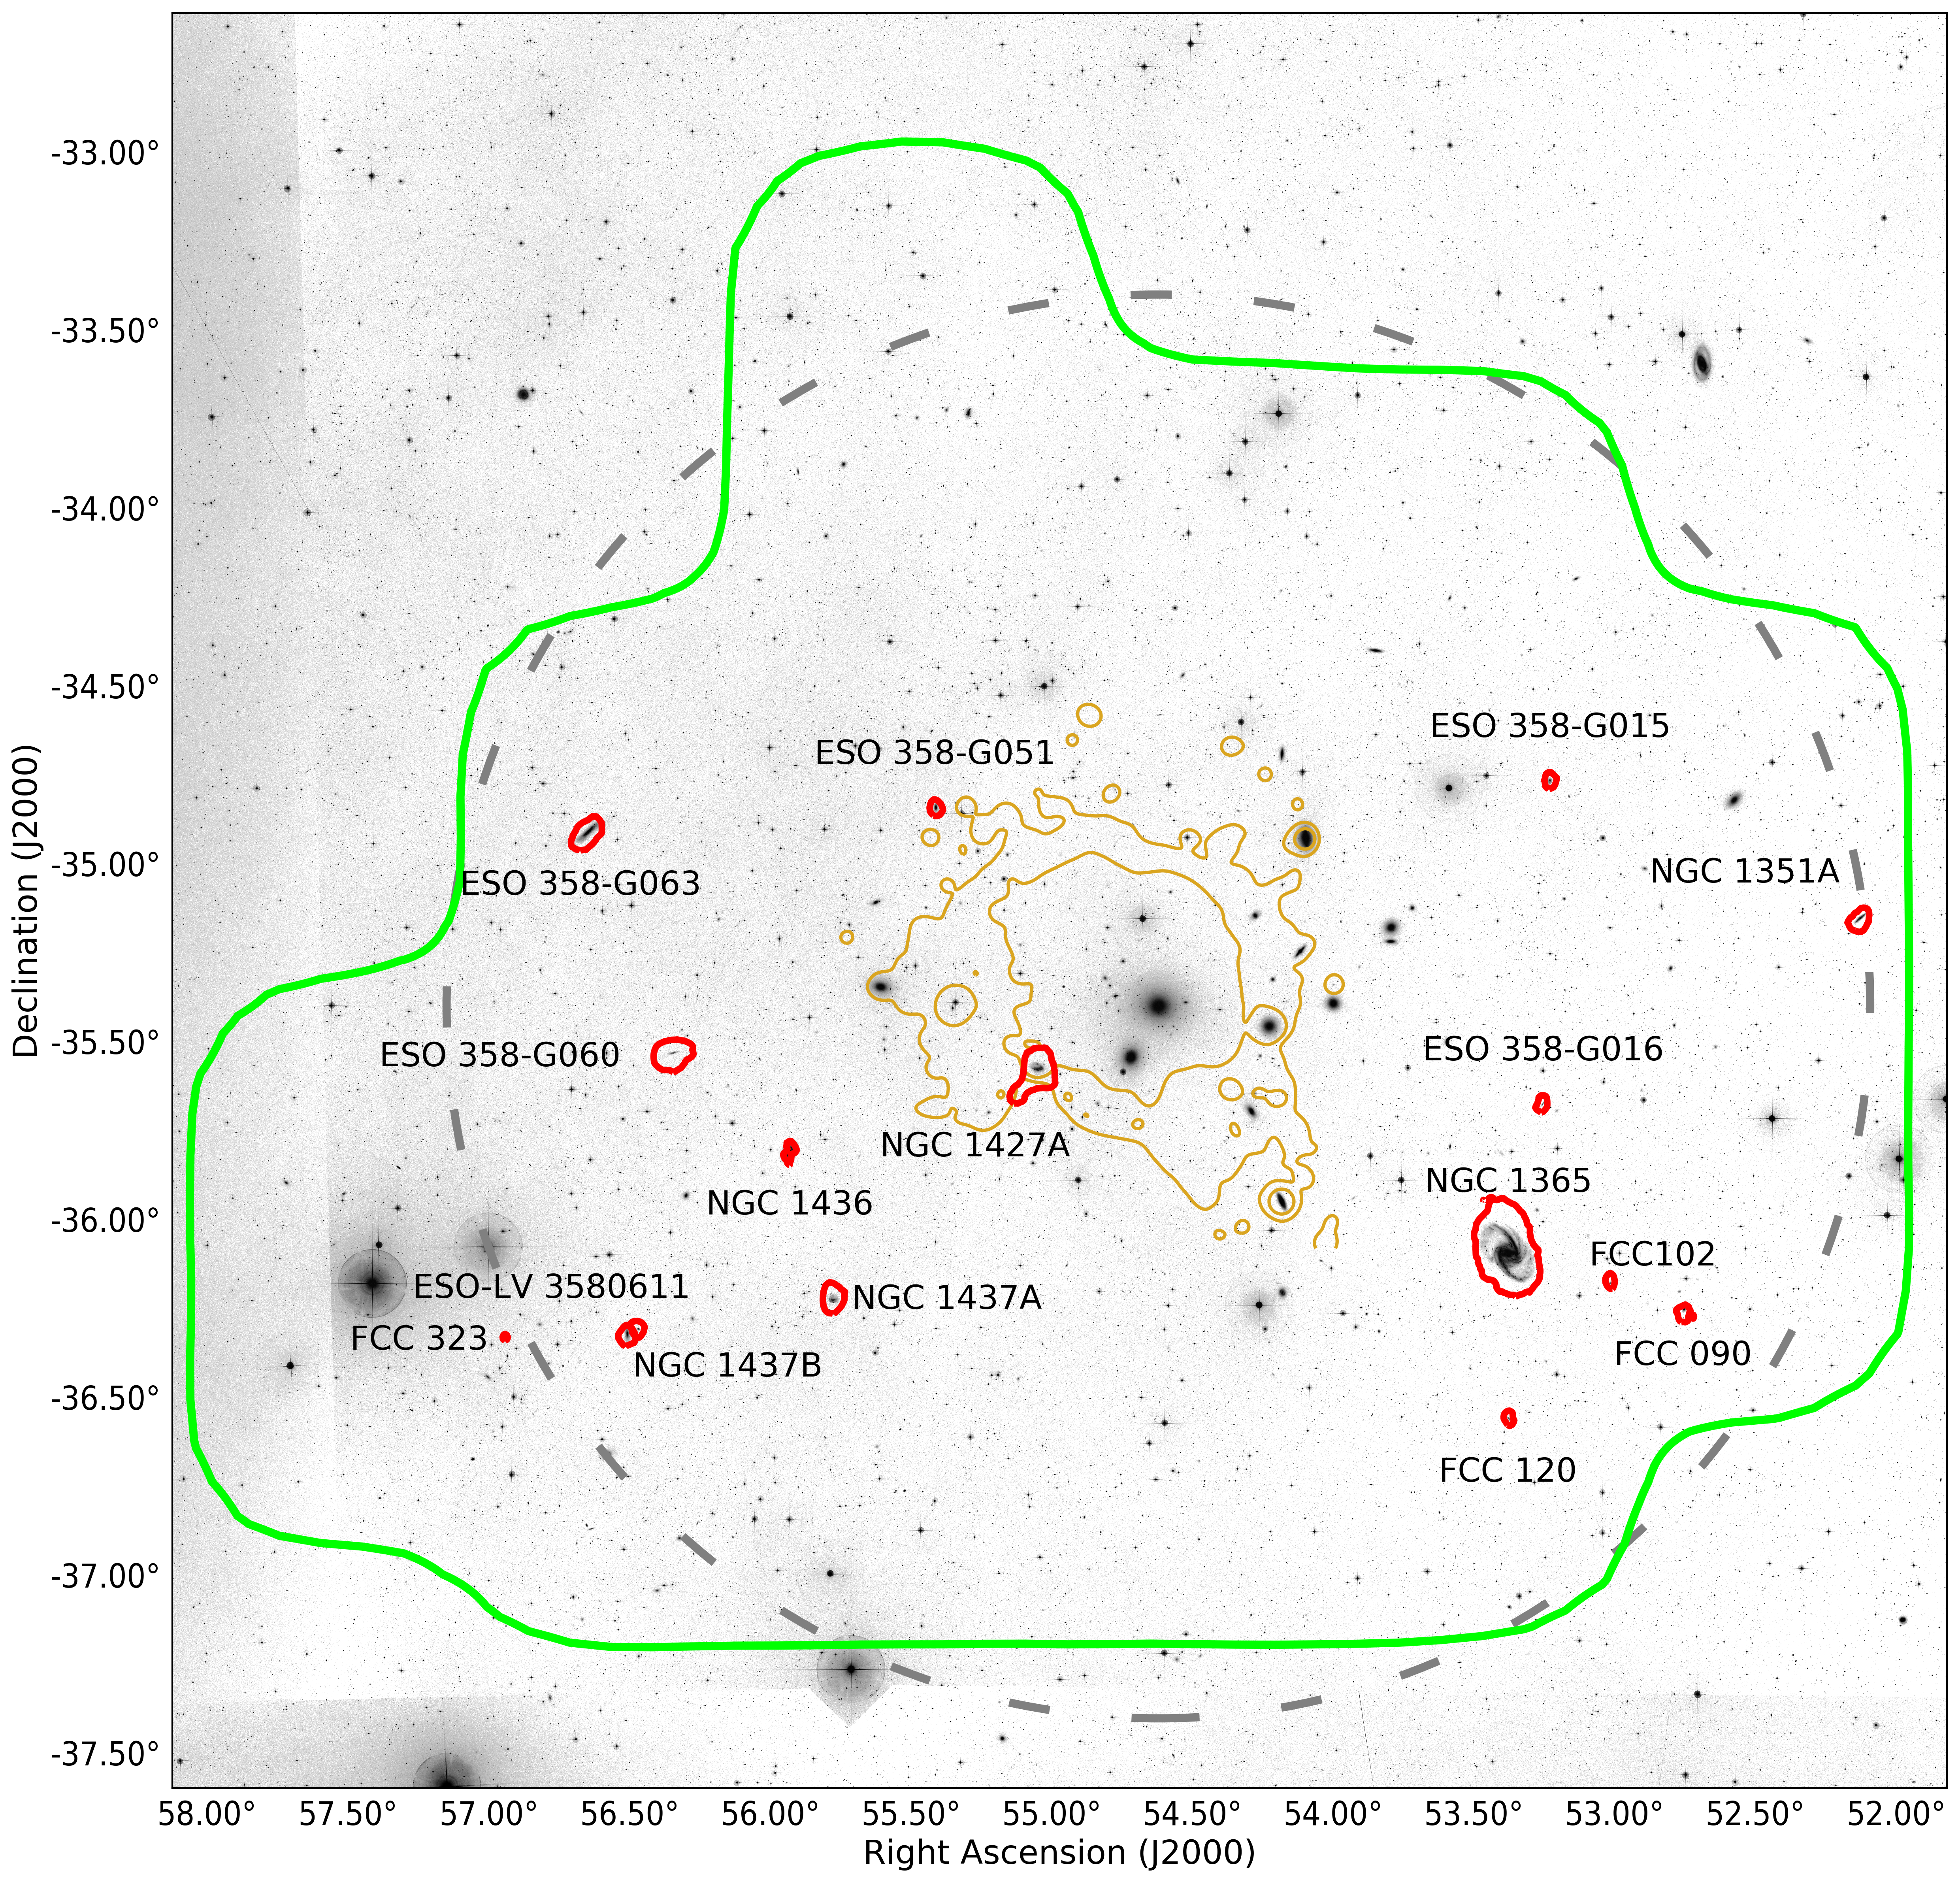
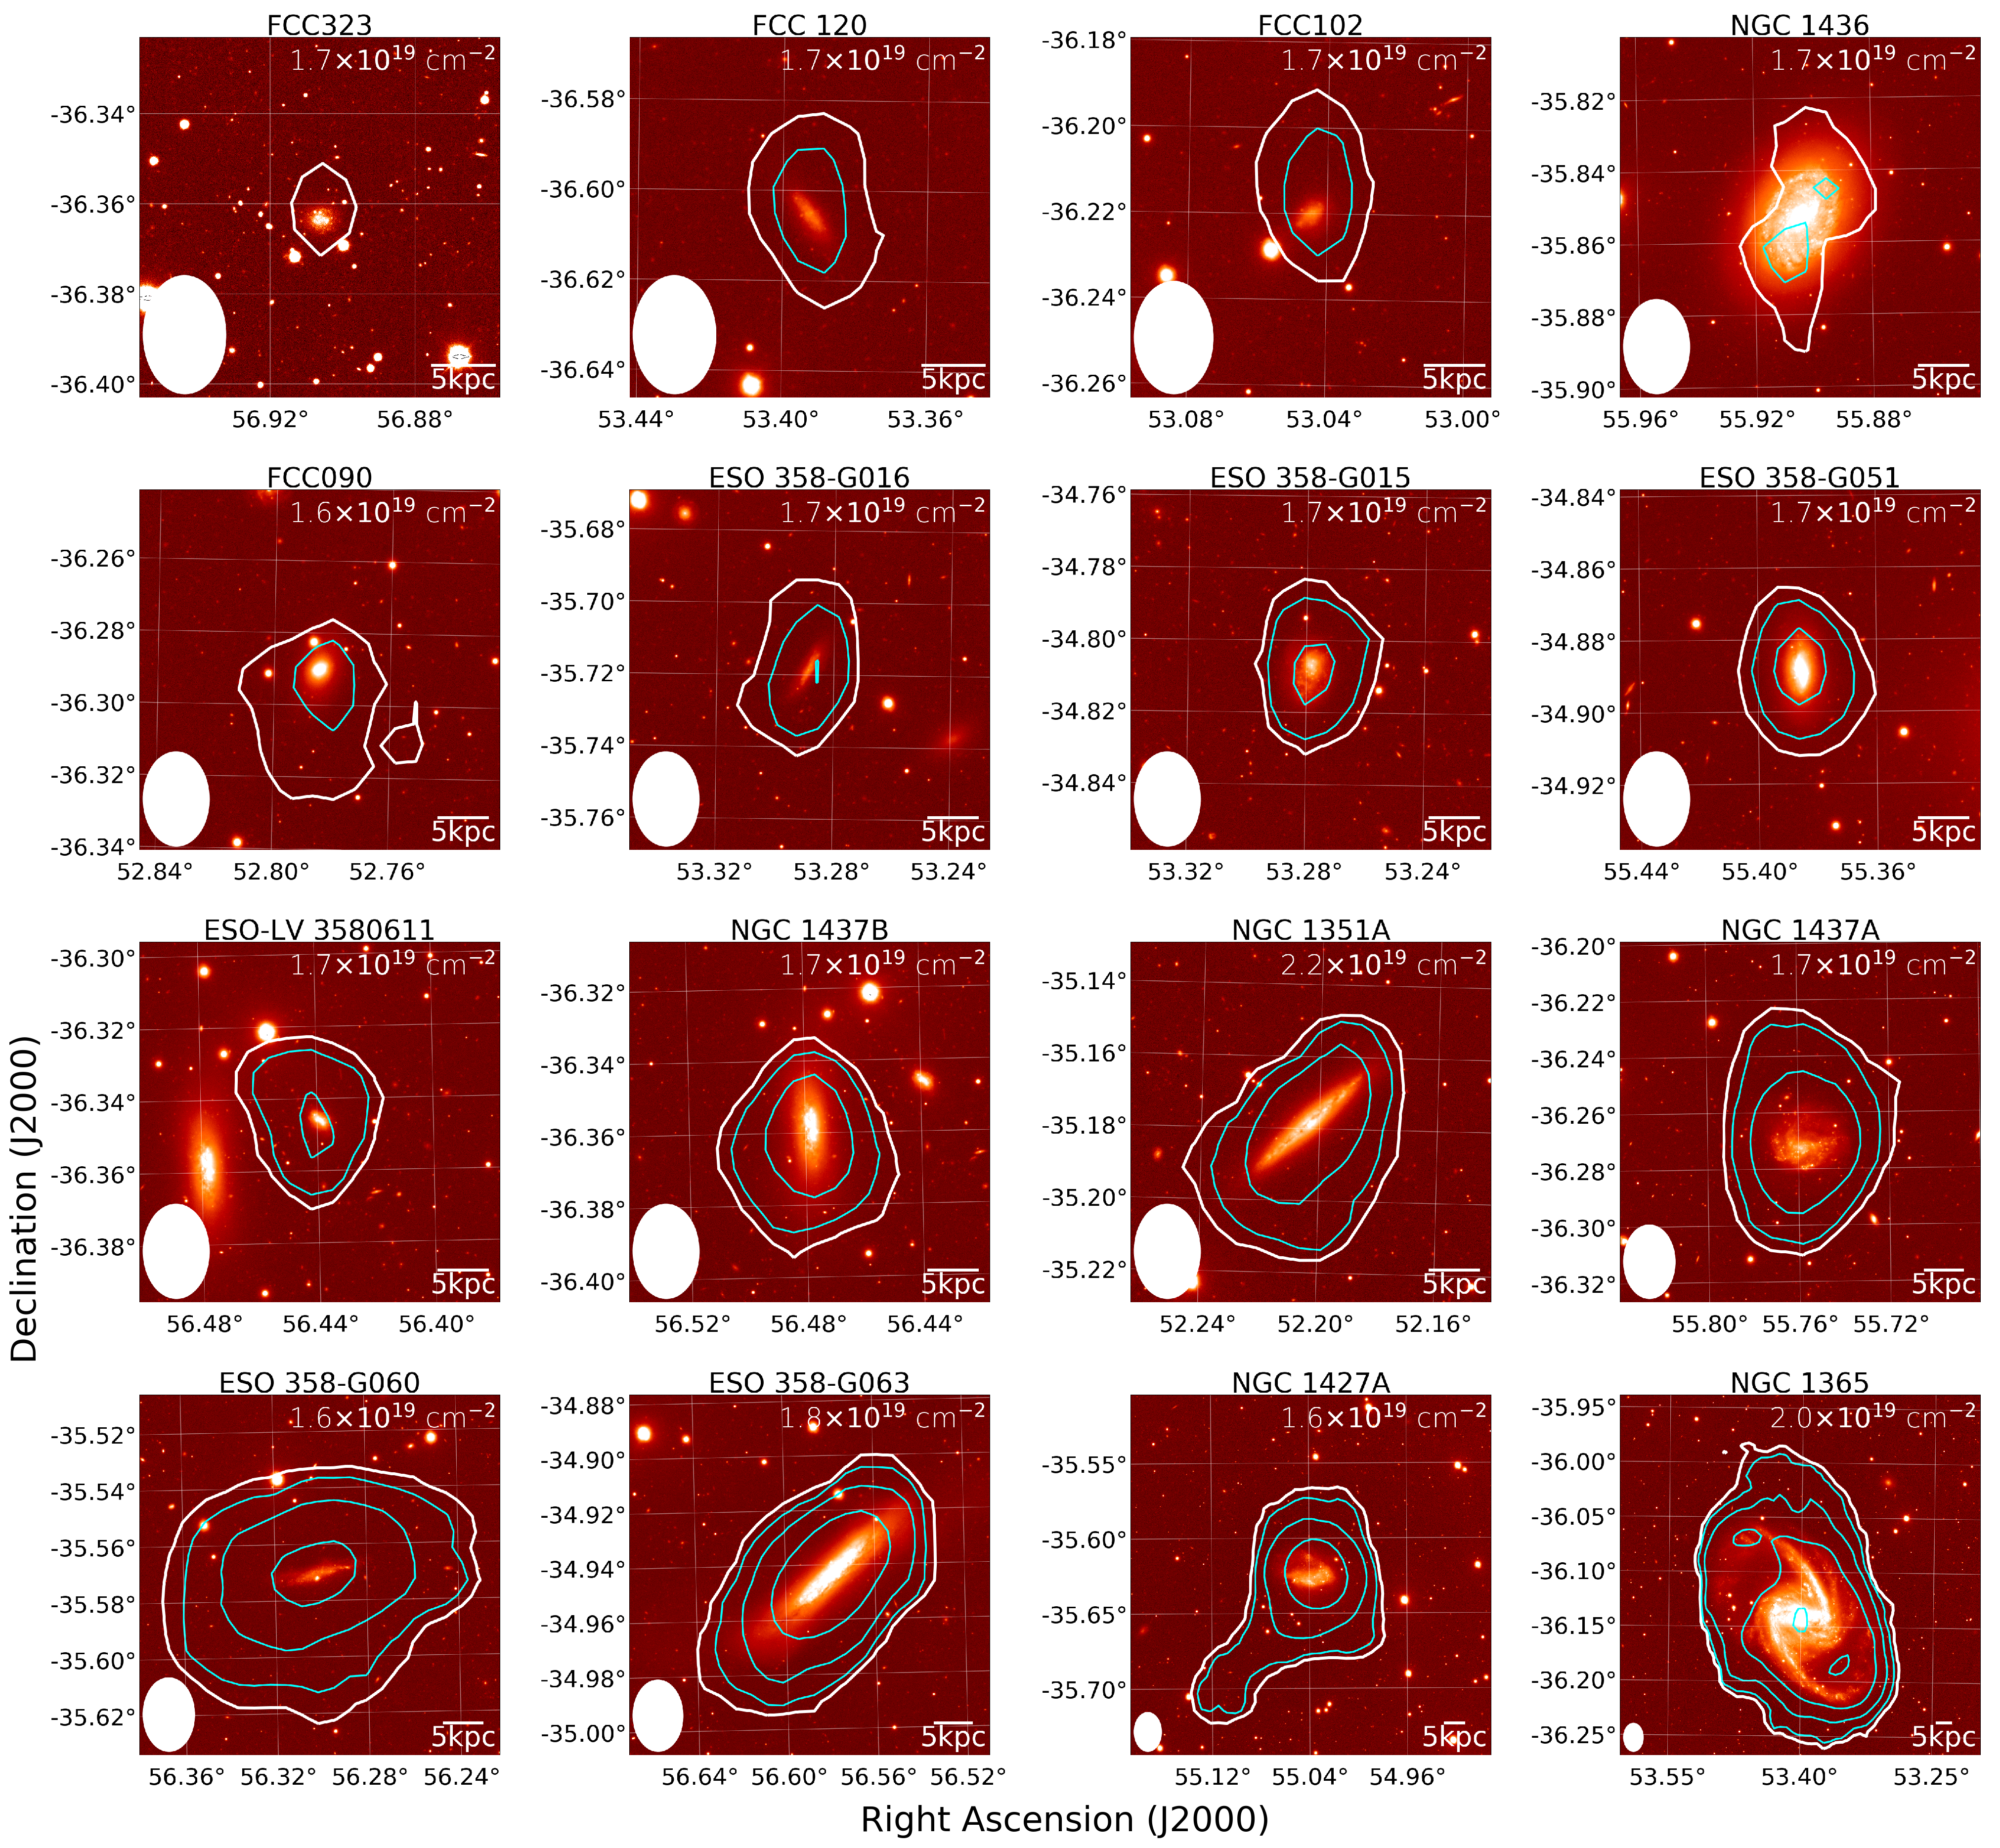
We detect H\scaleto1.2ex in the 16 galaxies listed in Table 1. Of these, three are new H\scaleto1.2ex detections: FCC 090, FCC 102, FCC 323. The last is the only galaxy with no previous redshift measurement. In Fig. 1 we show the location of our H\scaleto1.2ex detections on the sky and in Fig. 2 we show the H\scaleto1.2ex morphology of each galaxy. In these figures, red and white contours, respectively, represent the lowest reliable H\scaleto1.2ex column density contour, defined as 3 times the local RMS assuming a typical H\scaleto1.2ex linewidth of 25 km s-1 (see Table 1 and top-right corner of each panel in Fig. 2).
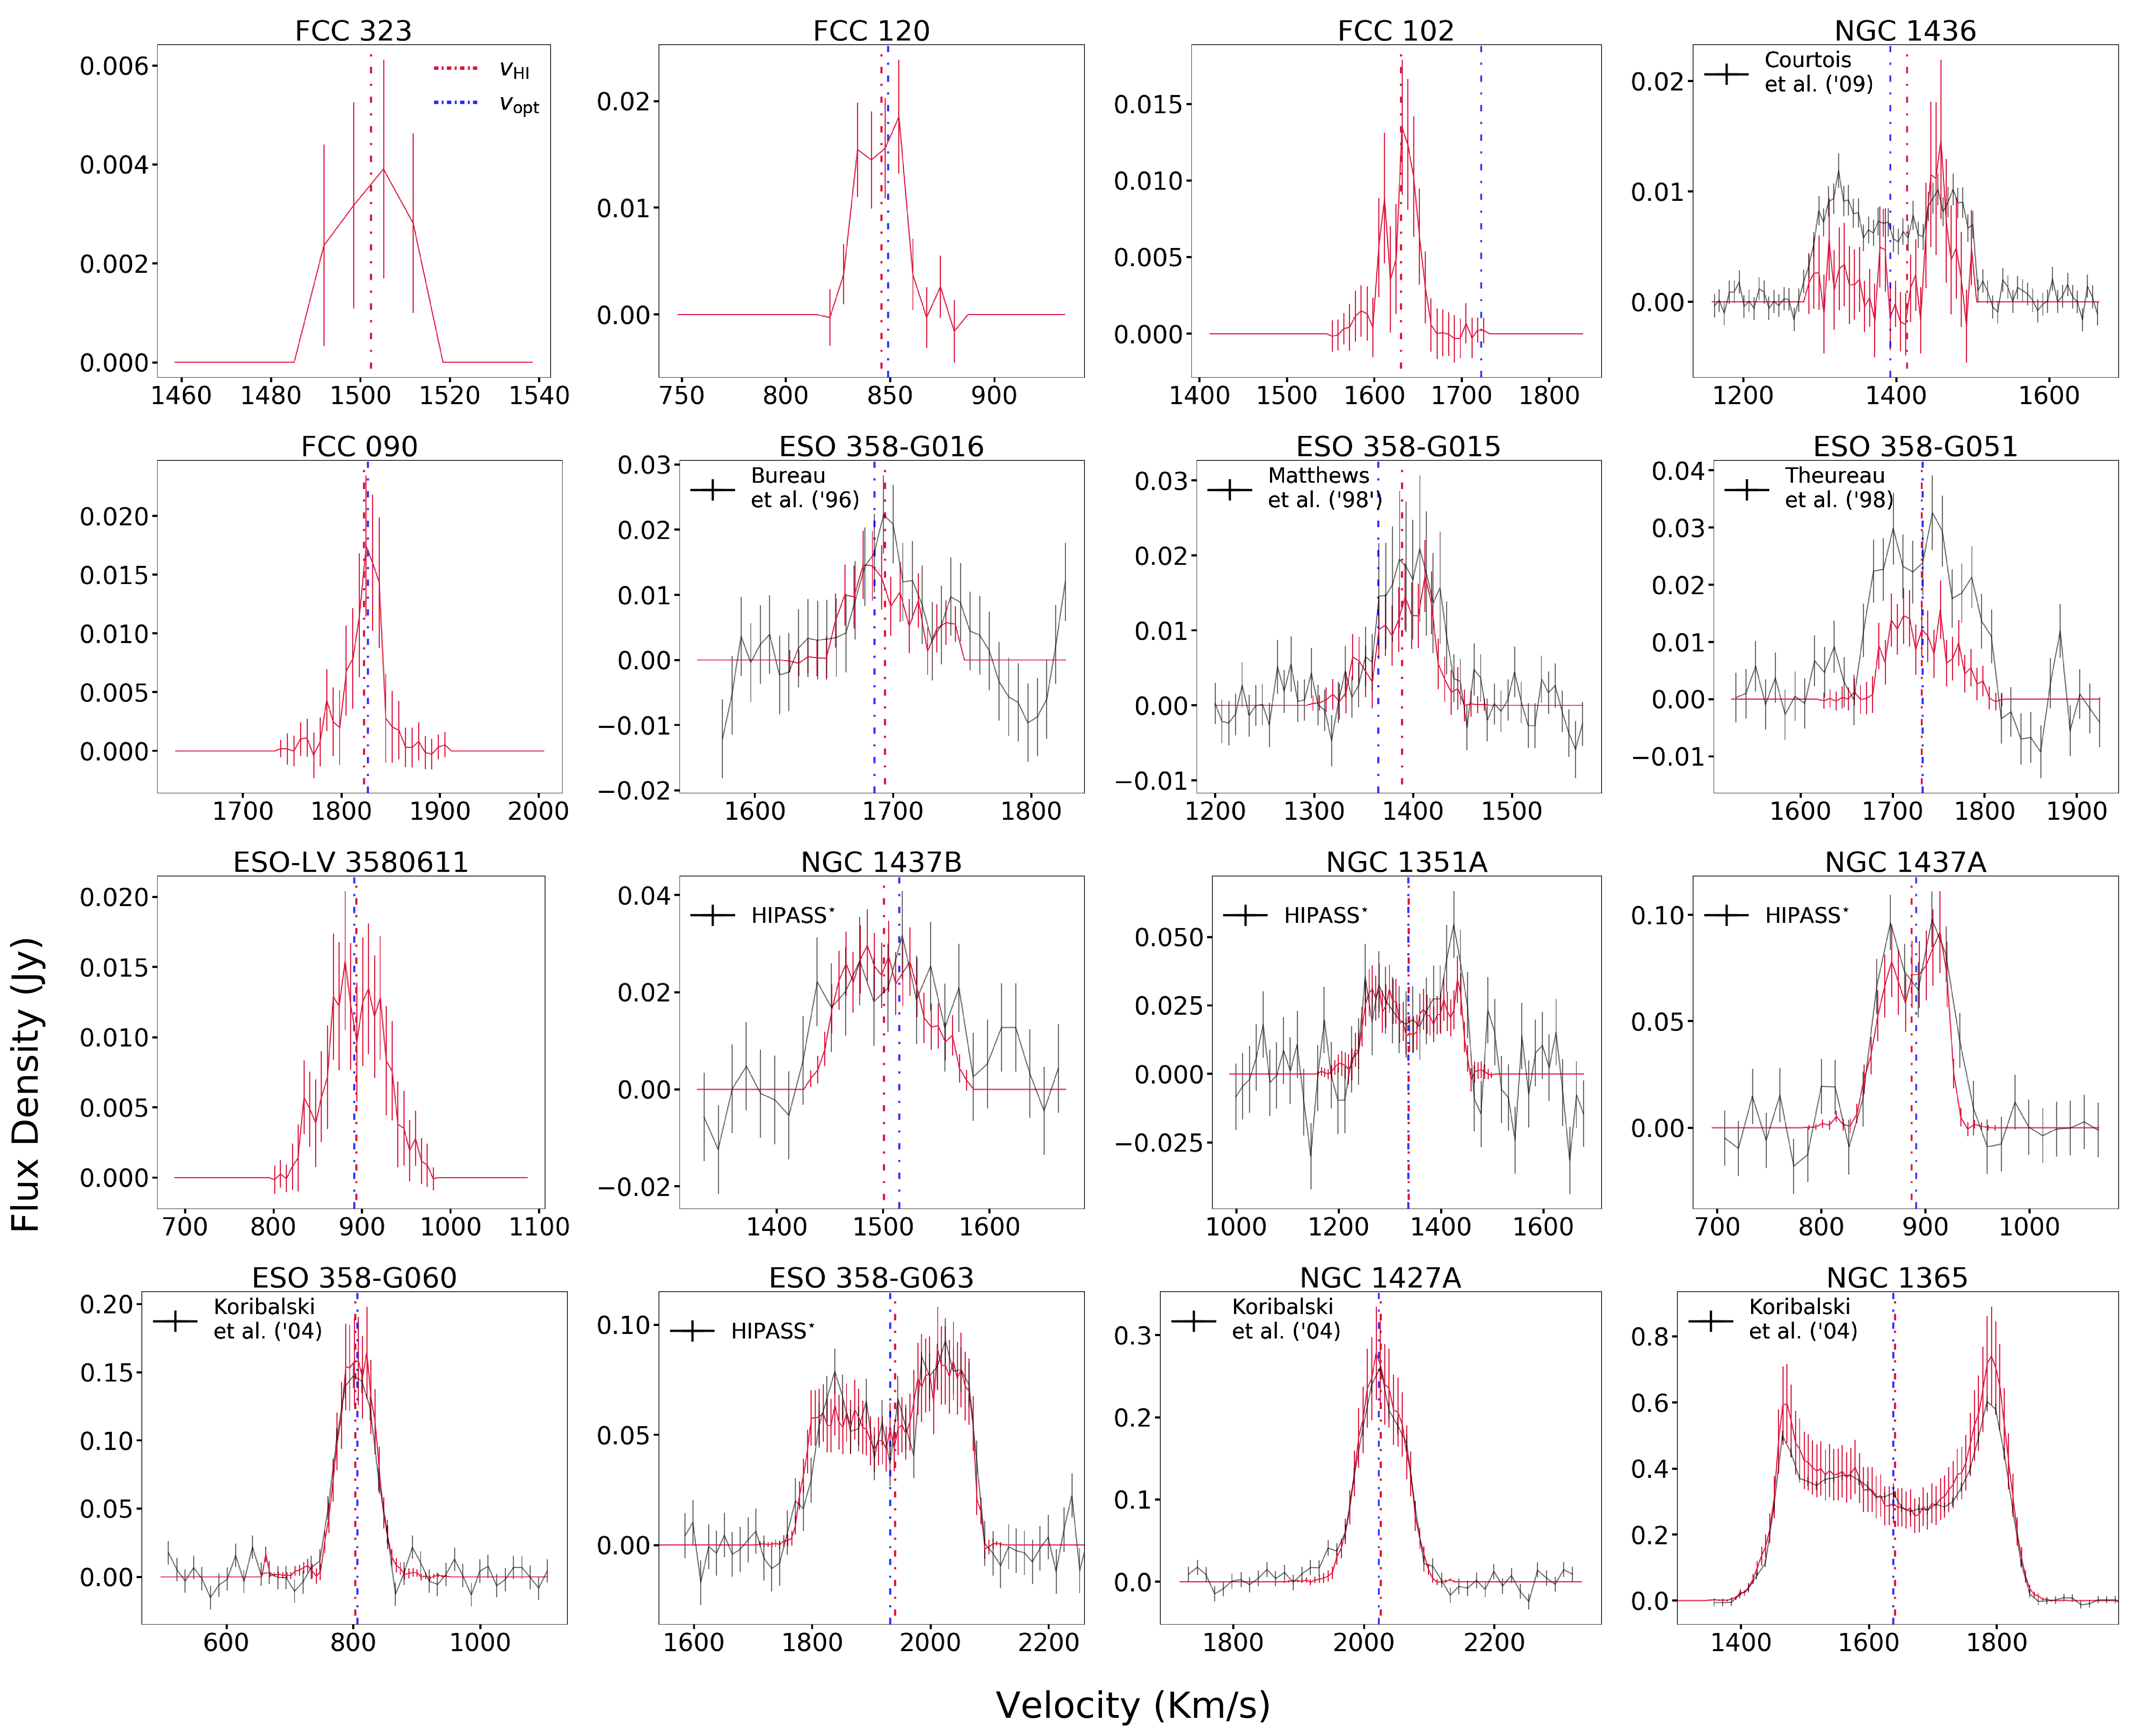
Fig. 3 shows the integrated ATCA H\scaleto1.2ex spectra of our 16 detections. We calculated the error bars by summing in quadrature the statistical uncertainty derived from the local RMS (Table 1) and the number of independent pixels detected in each channel and the flux-scale uncertainty. We find the latter to be % based on the flux ratio calculated for a sample of selected bright point sources between our radio continuum image and the Northern VLA Sky Survey (Condon et al. 1998).
We compare our spectra to those obtained from previous observations. In particular, we use HIPASS spectra from the BGC catalogue (Koribalski et al., 2004) or HIPASS data reprocessed by us. Since HIPASS data do not show any emission at the position of NGC 1436 and ESO 358-G016, we used Green Bank Telescope data (GBT - Courtois et al. 2009) and Parkes data (Bureau et al., 1996) as comparison, respectively. On the other hand, HIPASS spectra of ESO 358-G015 and ESO 358-G051 are noisy, so we used comparison spectra from Matthews et al. (1998) and Theureau et al. (1998), respectively, based on Nanacy data. Furthermore the literature spectra of ESO 358-G015 and ESO 358-G016 were rebinned to our ATCA channel-width. For consistency, we calculated the uncertainties in the comparison spectra by combining the noise in the spectrum and the flux-scale uncertainty of each survey, except for ESO 358-G016 for which the flux-scale uncertainty was not provided. For this galaxy, the error bars are shown as the RMS of the spectrum. In each panel of Fig. 3 we also show the velocity derived from optical spectroscopy (Maddox et al., 2019) and the barycentric H\scaleto1.2ex velocity derived from our ATCA spectra.
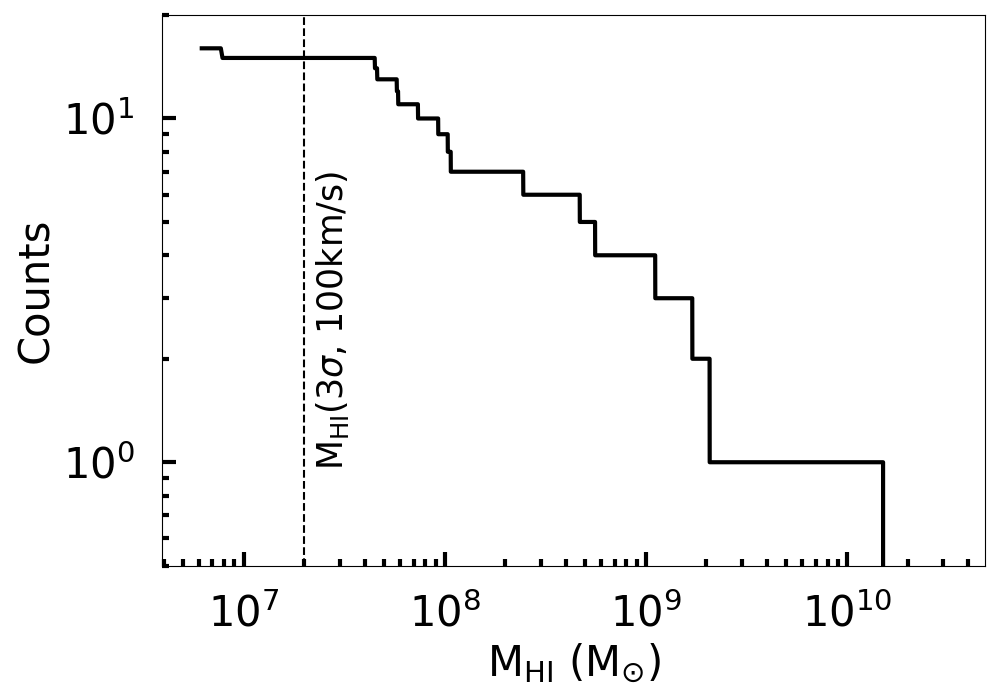
We estimated the H\scaleto1.2ex mass () of our detections from the integrated H\scaleto1.2ex flux using eq.50 in Meyer et al. (2017) and adopting the same distance of 20 Mpc for all galaxies (Mould et al., 2000). The uncertainty on is obtained from the error bars of the spectrum (Fig. 3). We report H\scaleto1.2ex fluxes and masses in Table 1. Our H\scaleto1.2ex fluxes agree with those in the literature within 1 for nine out of 13 galaxies, and within 2 for 11 of them. The two cases with a discrepancy larger than 2.5 are NGC 1436 and ESO 358-G051. The comparison spectrum for NGC 1436 comes from GBT data (Courtois et al., 2009) and shows that we are most likely missing H\scaleto1.2ex flux from the blue-shifted part of the system. For this galaxy, the total H\scaleto1.2ex flux recovered by ATCA is lower than the GBT flux by 2.5 (corresponding to a factor of 2.8). The reason of this discrepancy arises from a combination of low S/N and the presence, in at least some of the blue-shifted channels, of artefacts in this part of the ATCA cube. The case of ESO 358-G051 is less clear since the ATCA cube does not show any obvious artefacts and the galaxy well detected. However the total H\scaleto1.2ex flux recovered by ATCA is lower than the Nancay flux by 3. Based on the current data it is possible that some of the emission is spread over multiple ATCA beams and therefore is too weak to be detected. Future MeerKAT data will clarify this issue Serra et al. (2016). Finally, the H\scaleto1.2ex mass of FCC 323 is below the typical sensitivity of our data quoted in Sec. 2 because of the narrow linewidth as well as the low value of the local noise (Table 1). Our detections cover about three of magnitude in , from FCC 323 ( = M⊙) to NGC 1365 ( = M⊙). Fig. 4 shows the cumulative histogram of the H\scaleto1.2ex masses of our sample. A future study will analyse the H\scaleto1.2ex mass function inferred from our data.
Due to the improved resolution of ATCA over a single dish, we detected, in half of the sample, a variety of H\scaleto1.2ex morphologies (see Fig. 2) including offsets between optical and H\scaleto1.2ex centres, truncated discs, asymmetries and H\scaleto1.2ex tails, which we describe in this section and in Appendix A, following the same order in which galaxies are shown in Fig. 2 (from the lowest to the highest H\scaleto1.2ex mass): the H\scaleto1.2ex distribution in FCC 102 is offset with respect to the optical centre towards the north. We also notice a large difference between and , 100 km s-1. However, this is consistent with the large uncertainty on given that the latter was measured from absorption lines for this galaxy (Natasha Maddox, priv. comm.); the H\scaleto1.2ex peak of FCC 090 corresponds to the optical centre but the H\scaleto1.2ex distribution has an elongation to the south; H\scaleto1.2ex in ESO-LV 3580611 (FCC 306) is more extended to the north although there is no offset between optical and H\scaleto1.2ex centre (Waugh, 2005); the H\scaleto1.2ex morphology of NGC 1437B (FCC 308) is asymmetric and more extended to the south; H\scaleto1.2ex in NGC 1351A (FCC 067) shows an elongation towards the south; the H\scaleto1.2ex of ESO 358-G063 (FCC 312) is more extended to the east side of the disc and the H\scaleto1.2ex contours appear to be compressed on the west side; In NGC 1427A (FCC 235), we detected a H\scaleto1.2ex tail which points to the south-east, away from the cluster centre, consistent with the tidal origin of this galaxy discussed in Lee-Waddell et al. (2018); the H\scaleto1.2ex distribution in NGC 1365 (FCC 121) is extended to the north and appears to be compressed in the south-west part of the disc (see also Jorsater & van Moorsel 1995). We mark these H\scaleto1.2ex disturbed galaxies with star markers in all subsequent figures.
The remaining half of the galaxies are either unresolved (or nearly so) and centred on the stellar body, or do not show noticeable asymmetries. One of them hosts a H\scaleto1.2ex disc unusually truncated within the stellar disc, NGC 1436. This case will be discussed in detail in later sections.
A final case worth commenting on is FCC 120. This galaxy has been detected with Parkes and the spectrum in Schröder et al. (2001) shows an evident double horn profile that is 100 km s-1 wide, while we detect a single-peak profile (within the uncertainties - see Fig. 3). Careful visual inspection of our H\scaleto1.2ex cube did not reveal any H\scaleto1.2ex emission missing from our SoFiA detection mask. The regular H\scaleto1.2ex morphology of this galaxy in Fig. 2 and the good agreement between and in Fig. 3 suggest that our H\scaleto1.2ex characterisation of this galaxy is correct. Future, deeper data from the Meerkat Fornax survey may confirm this (Serra et al., 2016).
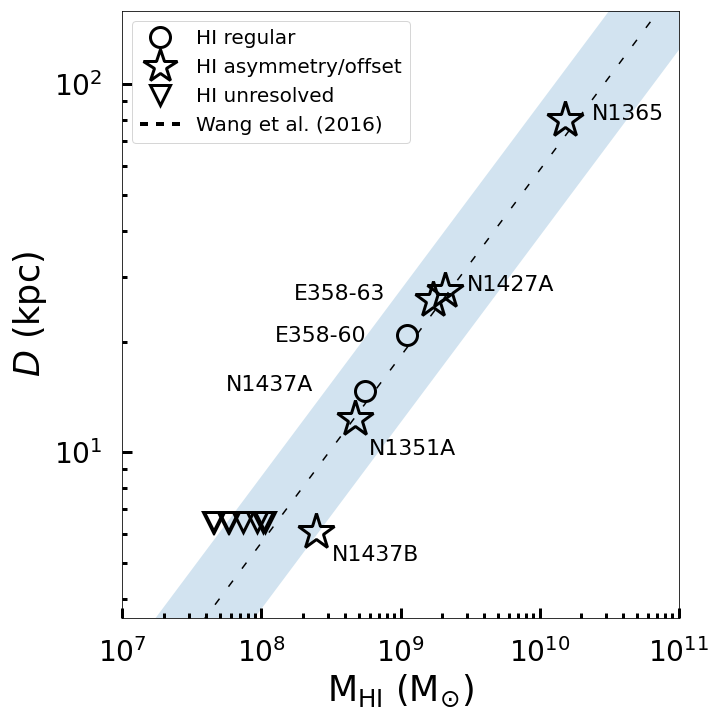
We estimated the H\scaleto1.2ex size for all our resolved H\scaleto1.2ex detections using the method of Wang et al. 2016 from the H\scaleto1.2ex intensity maps of our galaxies. We considered a galaxy resolved if its surface brightness profile deviates from the shape of the point-spread function. We measured the HI diameter where the surface density is 1 M⊙ pc-2 and is then deconvolved with the H\scaleto1.2ex beam. In Fig. 5 we show that both disturbed and regular galaxies follow the H\scaleto1.2ex size-mass scaling relation of Wang et al. (2016) within the 3 scatter. This can be understood as asymmetric H\scaleto1.2ex features usually have a low surface brightness and do not significantly contribute to the total of galaxies. In Fig.5 we also show the H\scaleto1.2ex unresolved galaxies. The upper limit on their size were set equal to the ATCA beam minor axis.
3.2 to ratio
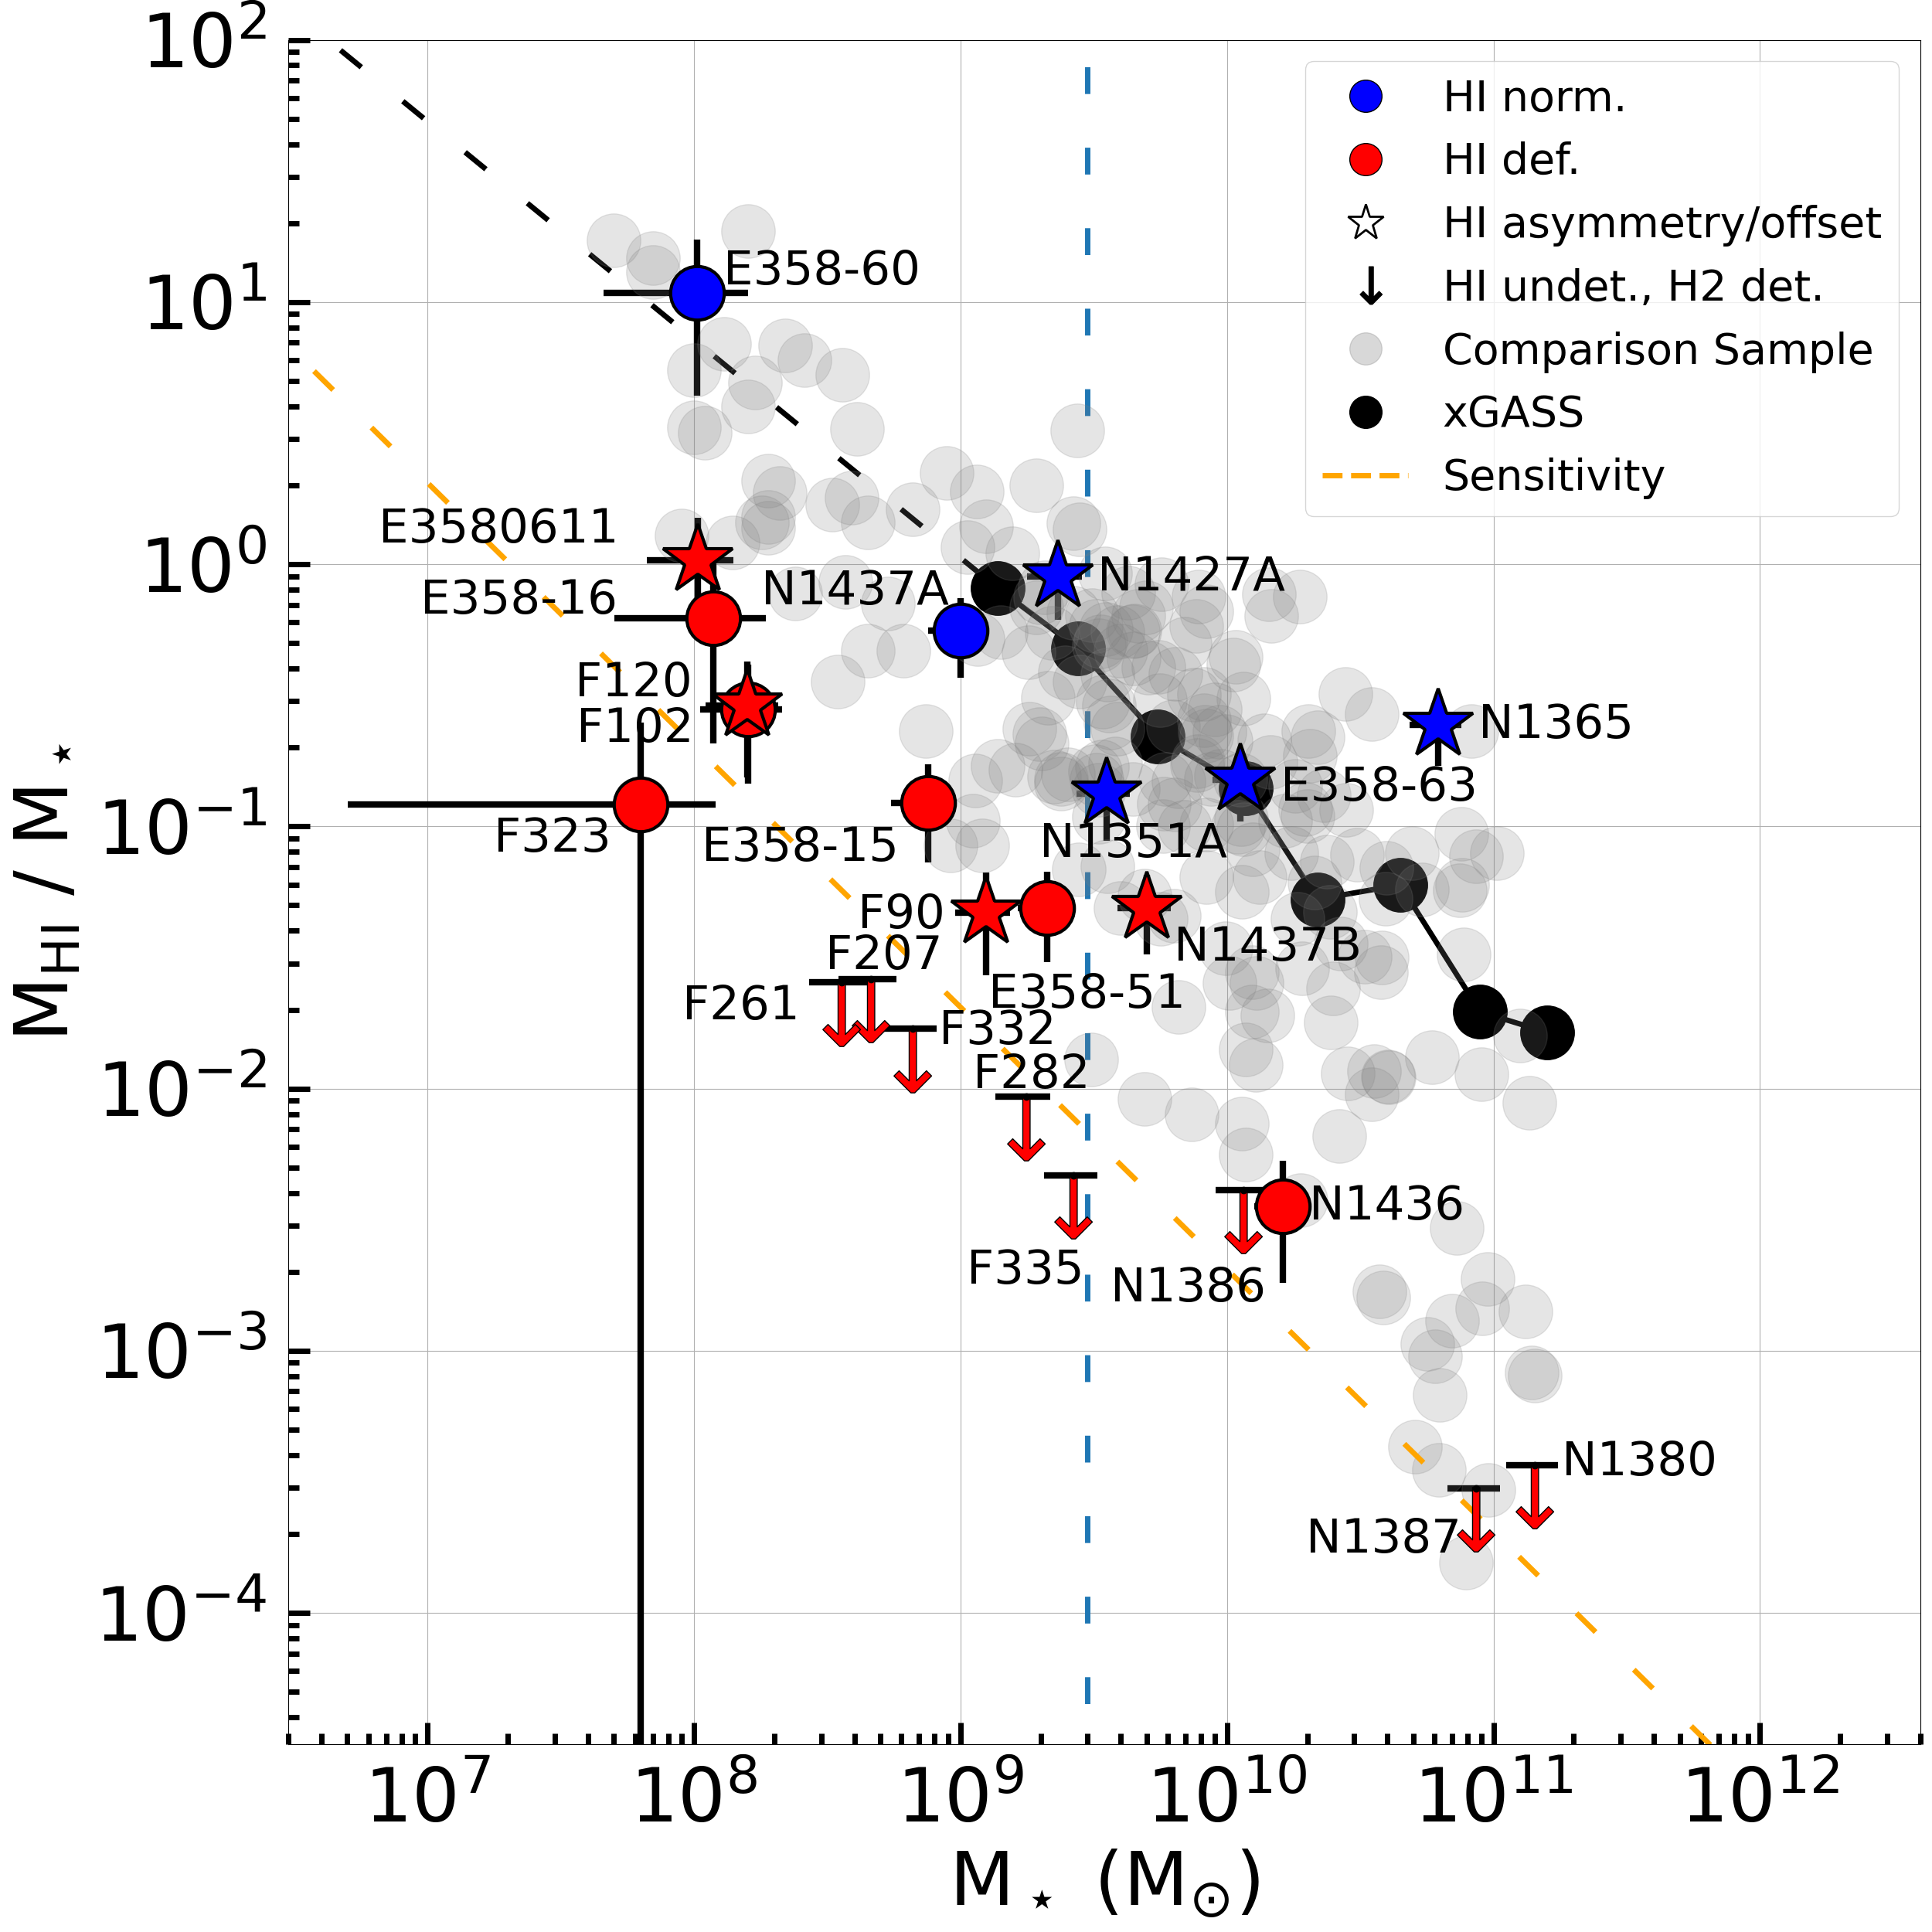
Given the abundant (albeit subtle) H\scaleto1.2ex asymmetries and offsets in our Fornax sample, which might be tracing environmental interactions within or on their way to the Fornax cluster (whether with other galaxies, the large-scale potential or the intergalactic medium), we study the amount of H\scaleto1.2ex in these galaxies in search of signs of H\scaleto1.2ex depletion. In order to do so, we evaluated the ratio between and stellar mass () for each galaxy in our sample. The values are derived using the WISE W1 (3.4 m) inband luminosity, W1W2 colour and the prescription given by Cluver et al. (2014a), with the custom photometry further defined in Jarrett et al. (2019), and assuming a common distance of 20 Mpc for all galaxies. We show the distribution of our sample on the /vs plane in Fig. 6.
We compare galaxies in Fornax with a sample consisting of void galaxies from the Void Galaxy Survey (VGS - Kreckel et al. 2012) and field galaxies from the Herschel Reference Survey (HRS - Boselli et al. 2014). We also used the xGASS -/ scaling relation, which shows the weighted median of (/) as a function of . This was obtained from 1177 galaxies selected only by stellar mass ( = 109–1011.5 M⊙) and redshift (0.01 z 0.05; Catinella et al. 2018). In Fig. 6 we extrapolate the xGASS trend down to 107 M⊙ (black dashed line) and show that it is consistent with the non-cluster sample of galaxies.
Our sample of Fornax H\scaleto1.2ex detections appears to be systematically offset with respect to our VGS+HRS comparison sample and to the xGASS scaling relation. A two-sample Kolmogorov–Smirnov test on the distribution of off sets from the xGASS scaling relation rejects the null hypothesis that Fornax and VGS+HRS galaxies are drawn from the same parent sample (p-value = 0.004, KS statistic = 0.43). Indeed, ten out of 16 Fornax galaxies are below or at the lower edge of the distribution of non-cluster galaxies. Their offset from the xGASS scaling relation is larger than the RMS deviation of VGS+HRS galaxies from it, thus indicating H\scaleto1.2ex deficiency. For illustrative purposes we henceforth label these HI deficient galaxies in red colours in Fig. 6 and in all other upcoming figures in this paper.
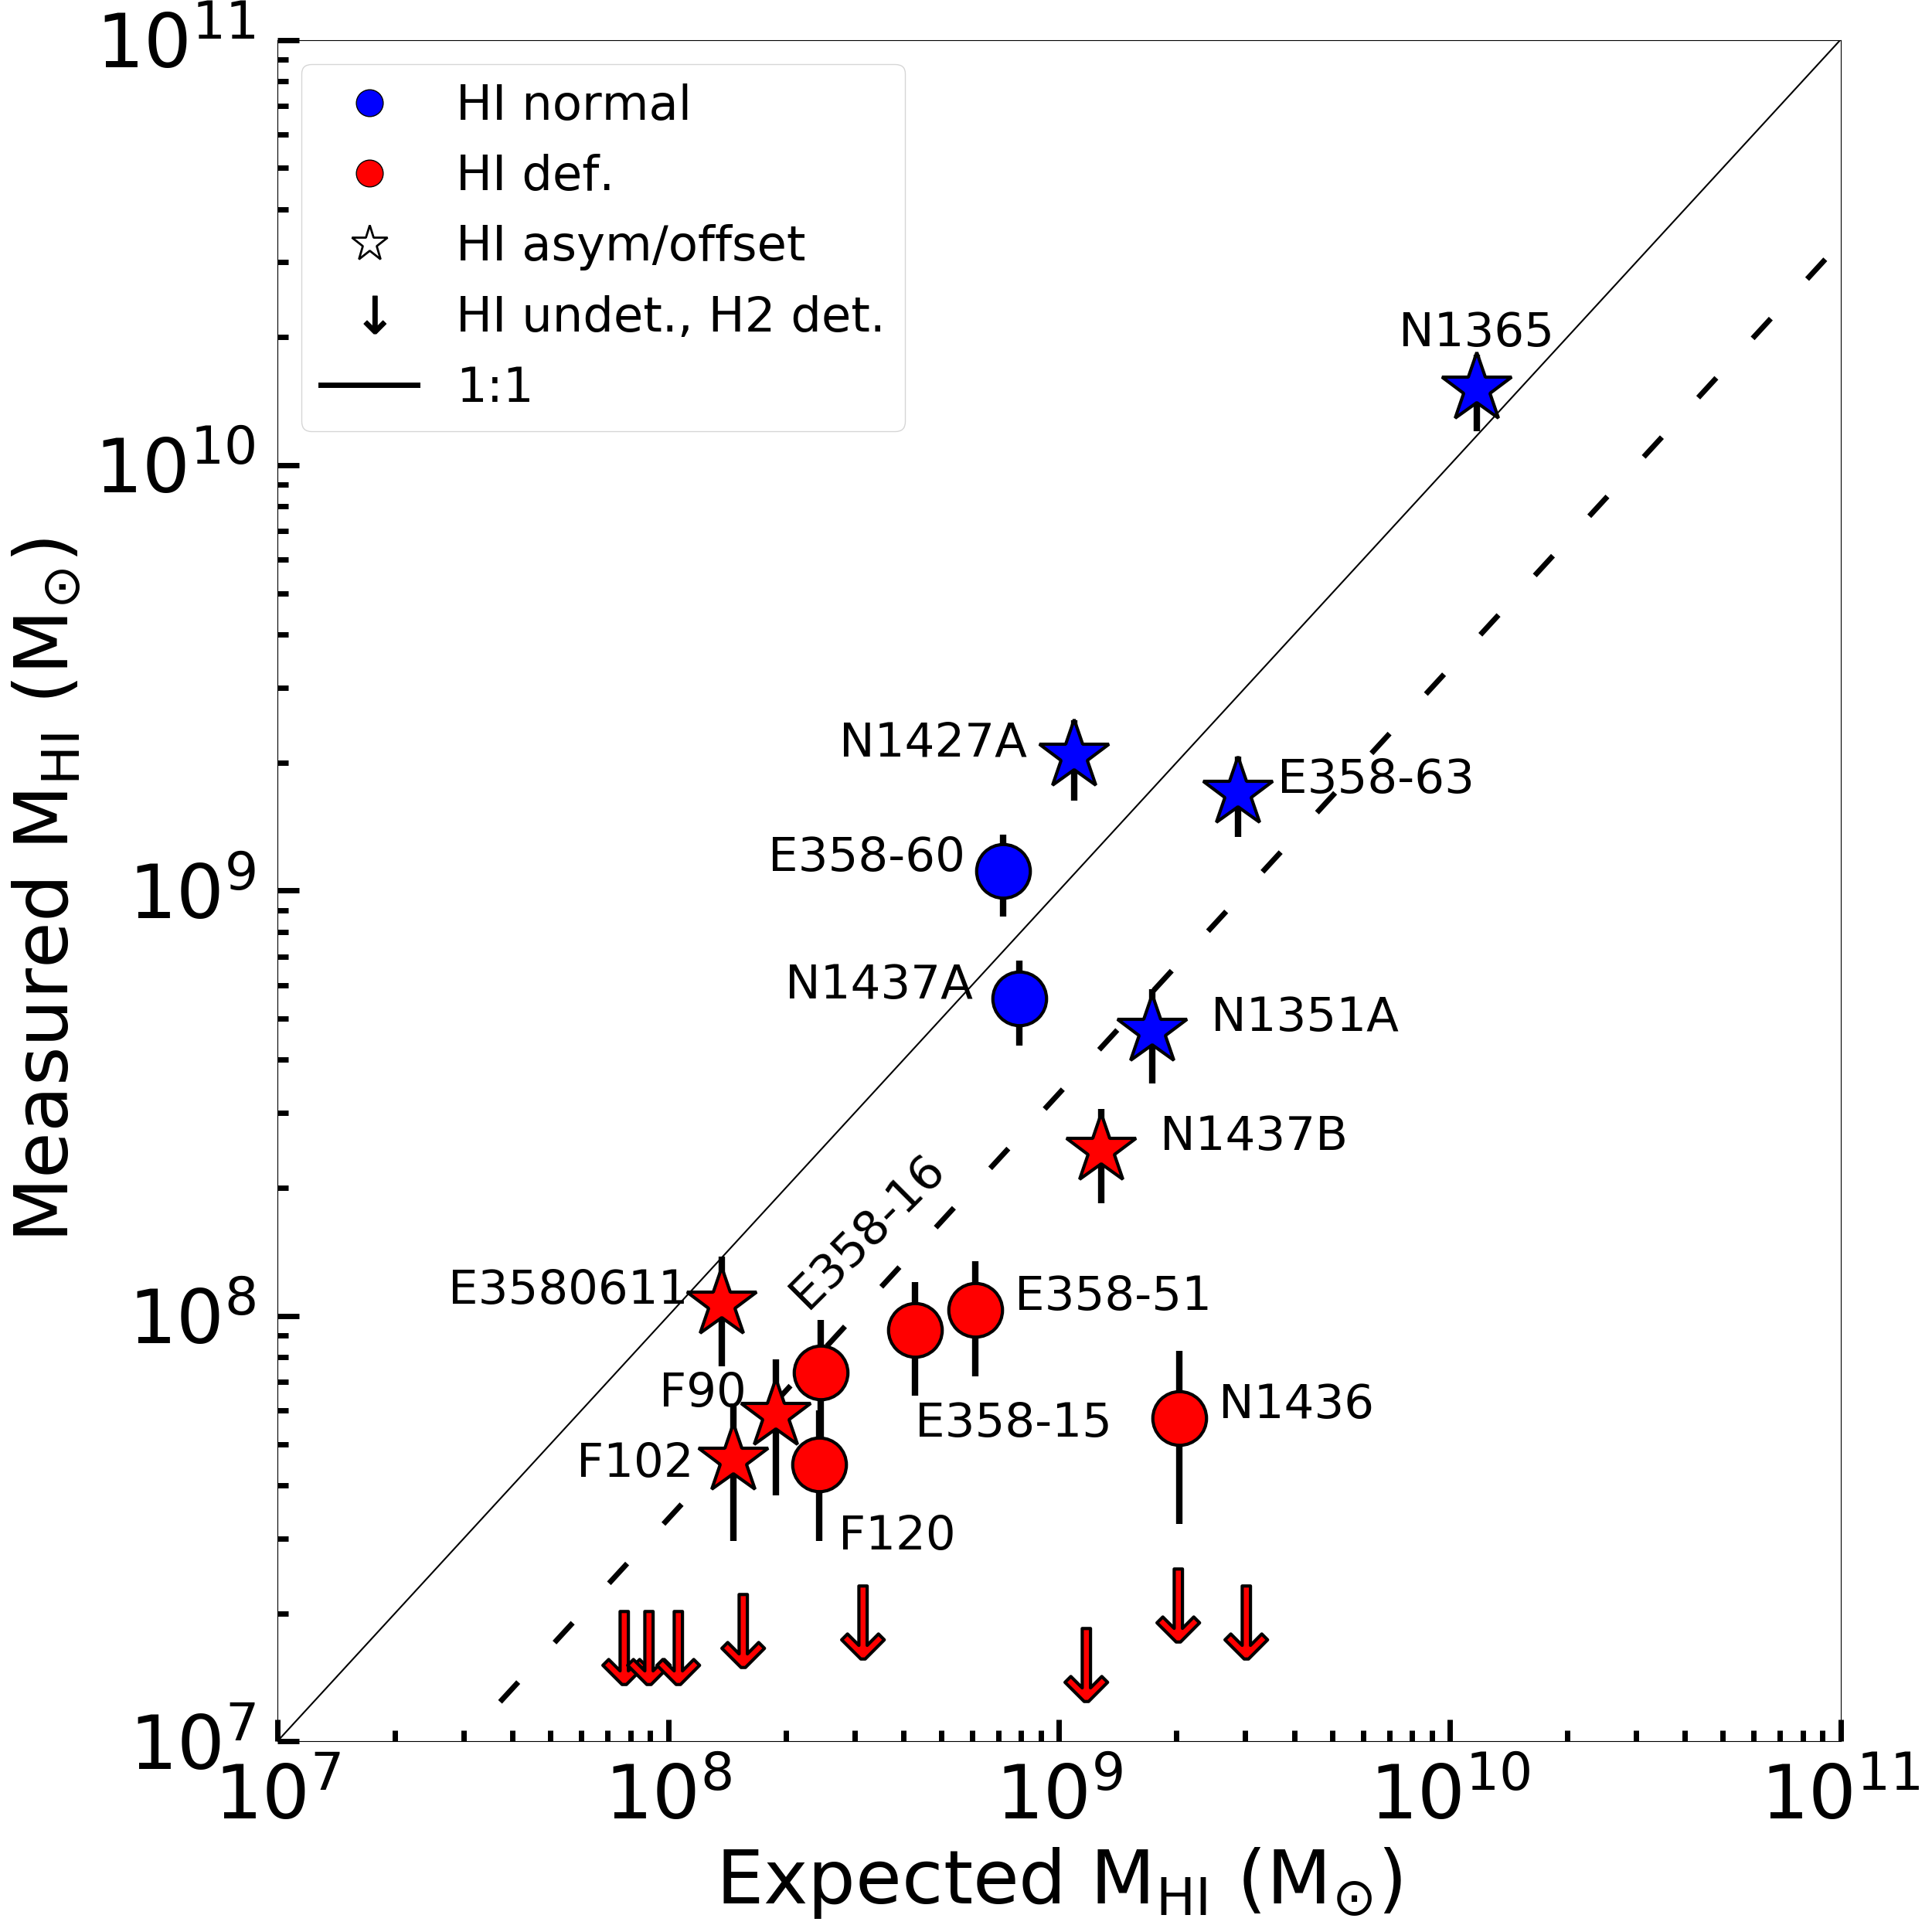
H\scaleto1.2ex deficiencies measured from plots like our Fig. 6 should be taken with caution because of the large scatter at at fixed (e.g. Maddox et al. 2015). This scatter is to first order driven by Hubble type or, equivalently, by galaxy properties that correlate with Hubble type, such as the star formation rate (SFR). For this reason, in Sect. 3.3 we further analyse how the H\scaleto1.2ex deficiency at fixed relates to the H2\scaleto1.2ex0pt and SFR of these galaxies. Furthermore, in the present section we estimate H\scaleto1.2ex deficiencies as proposed by Haynes & Giovanelli (1984) and recently revisited by Jones et al. (2018), where the measured is compared with an expected calculated based on galaxies’ optical size and Hubble type. For this purpose, we use the coefficients summarised by Boselli & Gavazzi (2009) and originally given in Haynes & Giovanelli (1984), Solanes et al. (1996), Boselli & Gavazzi (2009), and adopt the optical sizes and Hubble types listed in Table 1 for our galaxies. Fig. 7 shows the comparison between the expected and the measured . The dashed line, a factor of 3 below the 1:1 relation, is the typical threshold below which galaxies are considered H\scaleto1.2ex deficient using the Haynes & Giovanelli’s (1984) method (e.g. Cortese et al. 2011). Also in this case, Fornax galaxies appear offset towards lower H\scaleto1.2ex masses and there is a good match between galaxies labelled as H\scaleto1.2ex deficient based on our Fig. 6 and those below the dashed line in Fig. 7.
From these figures, we see that not all galaxies with a disturbed H\scaleto1.2ex morphology are H\scaleto1.2ex deficient. Thus, H\scaleto1.2ex morphological disturbances, whatever their exact nature (e.g. tidal or hydrodynamical, which is difficult to establish with the current data), allow us to identify cases of environmental interactions before a significant fraction of the cold interstellar medium is removed. Combining H\scaleto1.2ex morphological information and - ratio may reveal likely new members of the cluster (we come back to this point in Sect.4).
Fornax galaxies with a disturbed H\scaleto1.2ex morphology cover the full range. However, we measure a stronger H\scaleto1.2ex depletion for low mass galaxies: the average offset from the xGASS scaling relation in Fig. 6 is dex and dex for below and above 3109, respectively. We show the threshold of 3109 M⊙ with a vertical dashed blue line in Fig. 6.
We already mentioned the problematic detection of NGC 1436. Although we are probably missing some flux, it remains a deficient galaxy even if we estimate the H\scaleto1.2ex mass from the GBT flux (Table 1) with a log10(/) = and an offset from the xGASS scaling relation of dex.
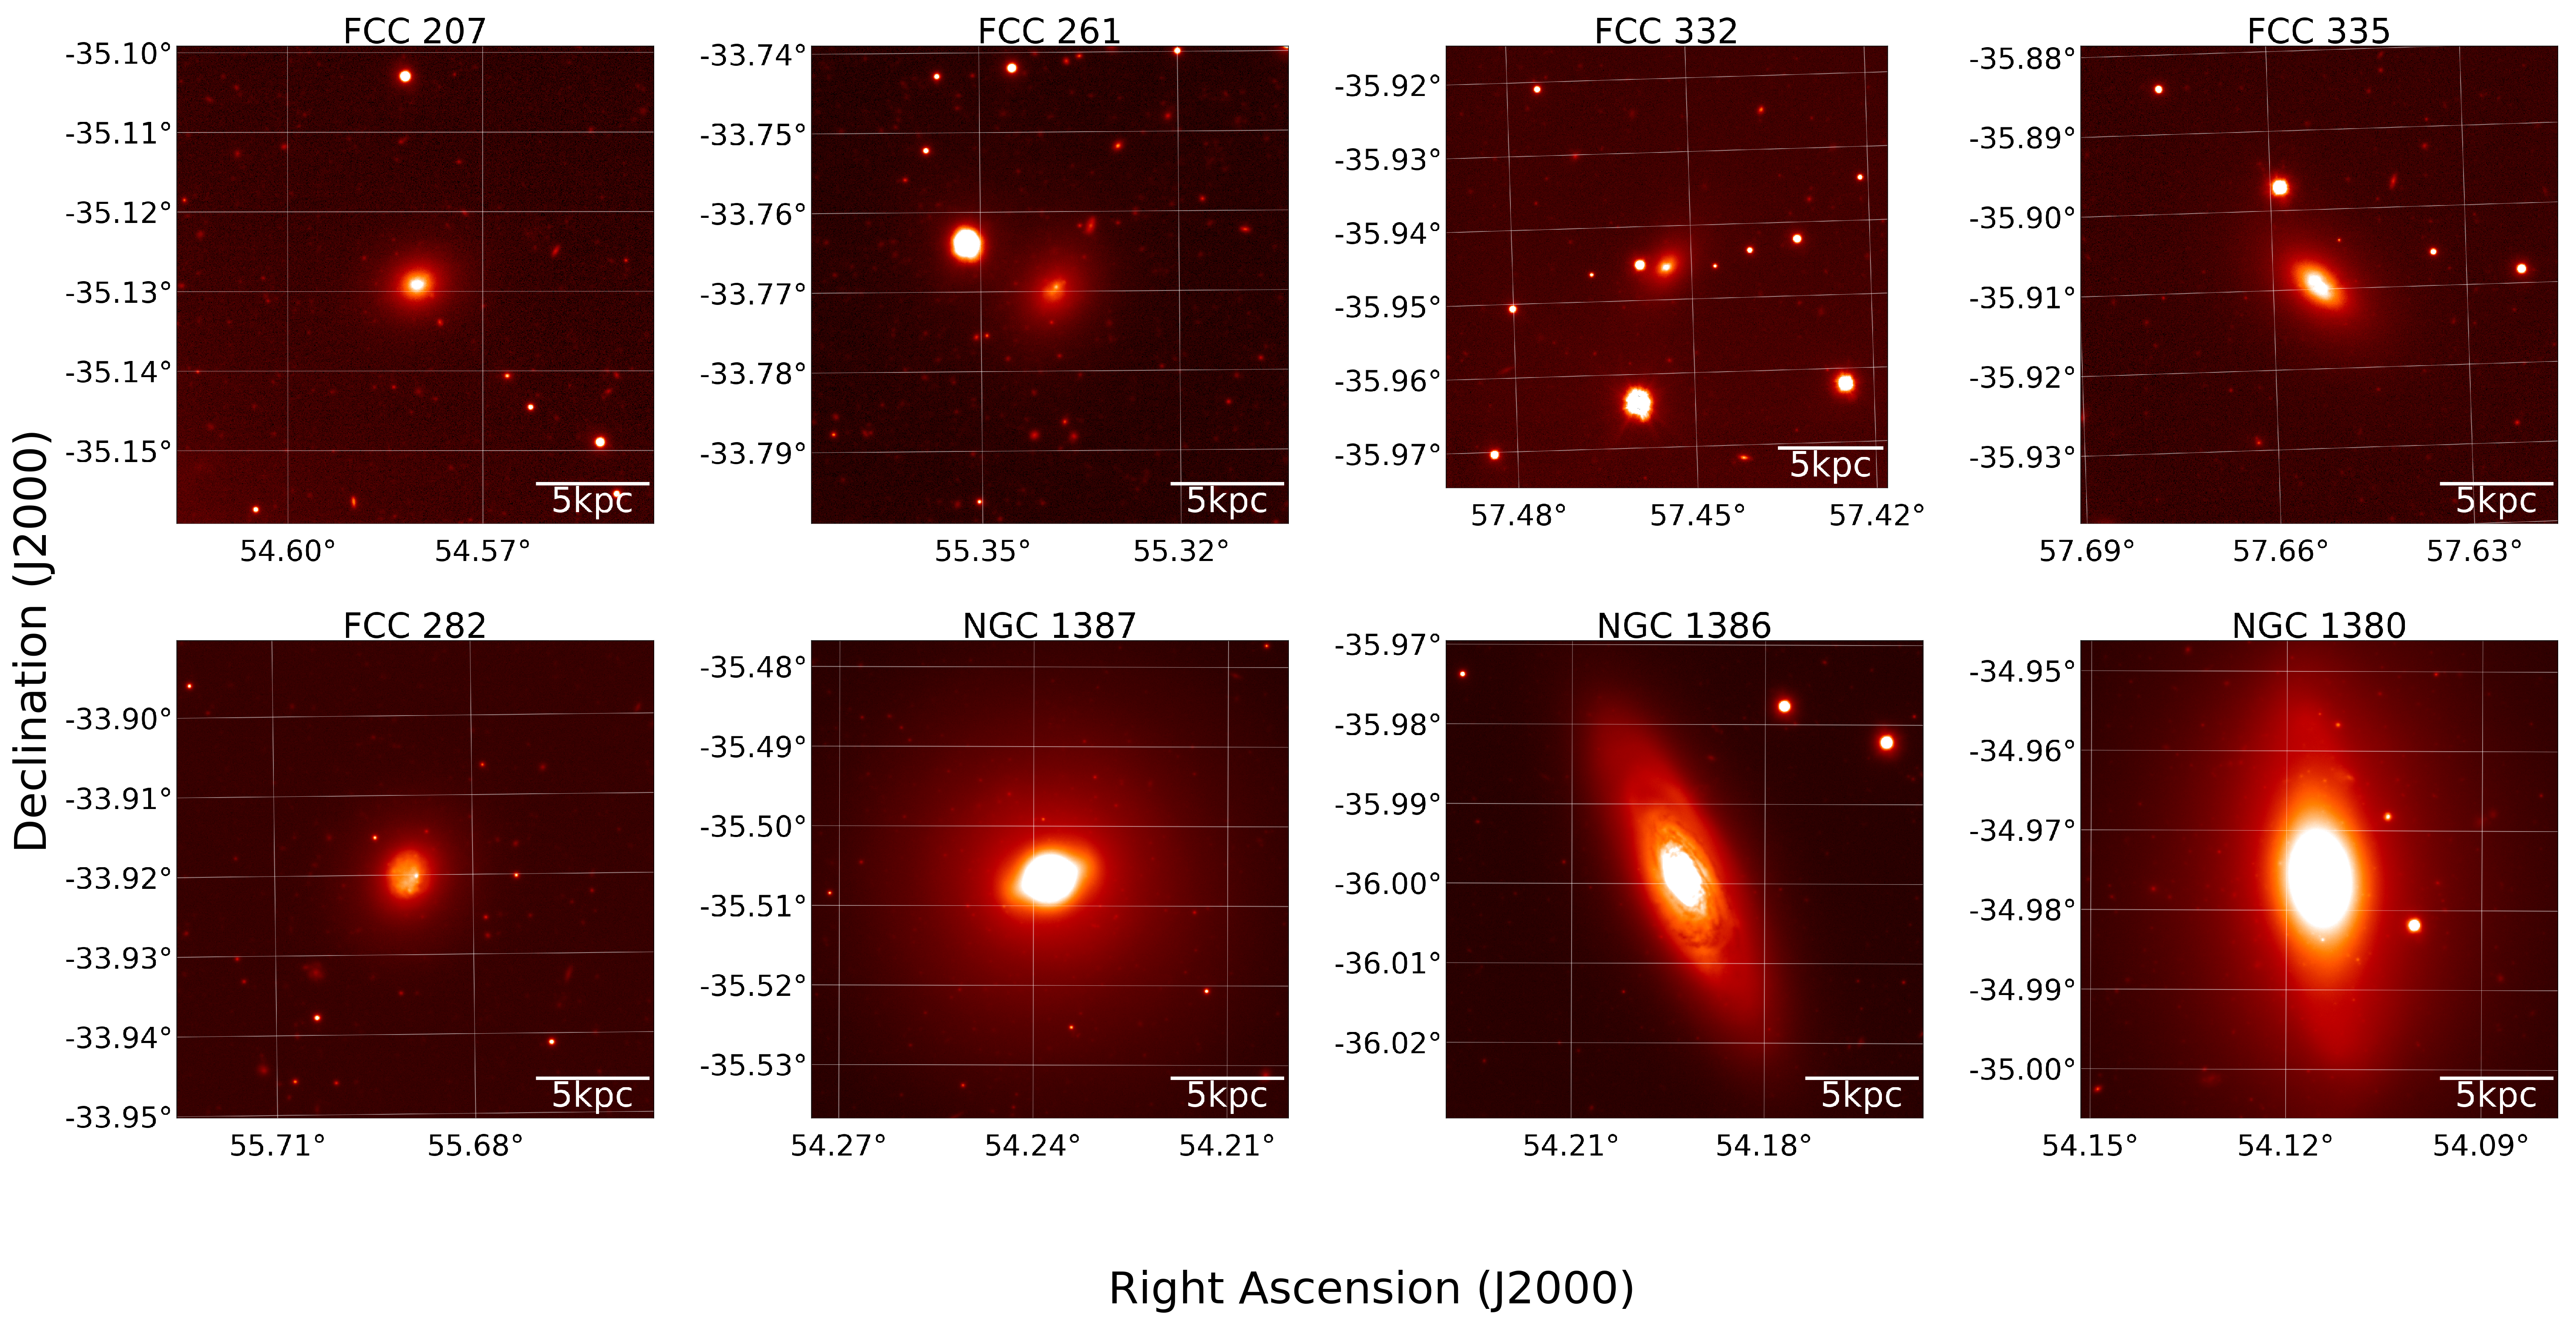
Fig. 6 shows also eight galaxies where we did not detect H\scaleto1.2ex emission but H2\scaleto1.2ex0pt was detected with with the Atacama Large Millimeter/submillimeter Array (ALMA) (Zabel et al., 2019). For these galaxies we calculated the upper limit as the local noise (Table 1) of the cube and assuming the CO line width of these galaxies estimated by the PV diagrams in Zabel et al. (2019). Some of these galaxies appear to have too little H\scaleto1.2ex given the molecular gas content and star formation rate, as we discuss in following sections. We show the optical morphology of these galaxies in Appendix B.
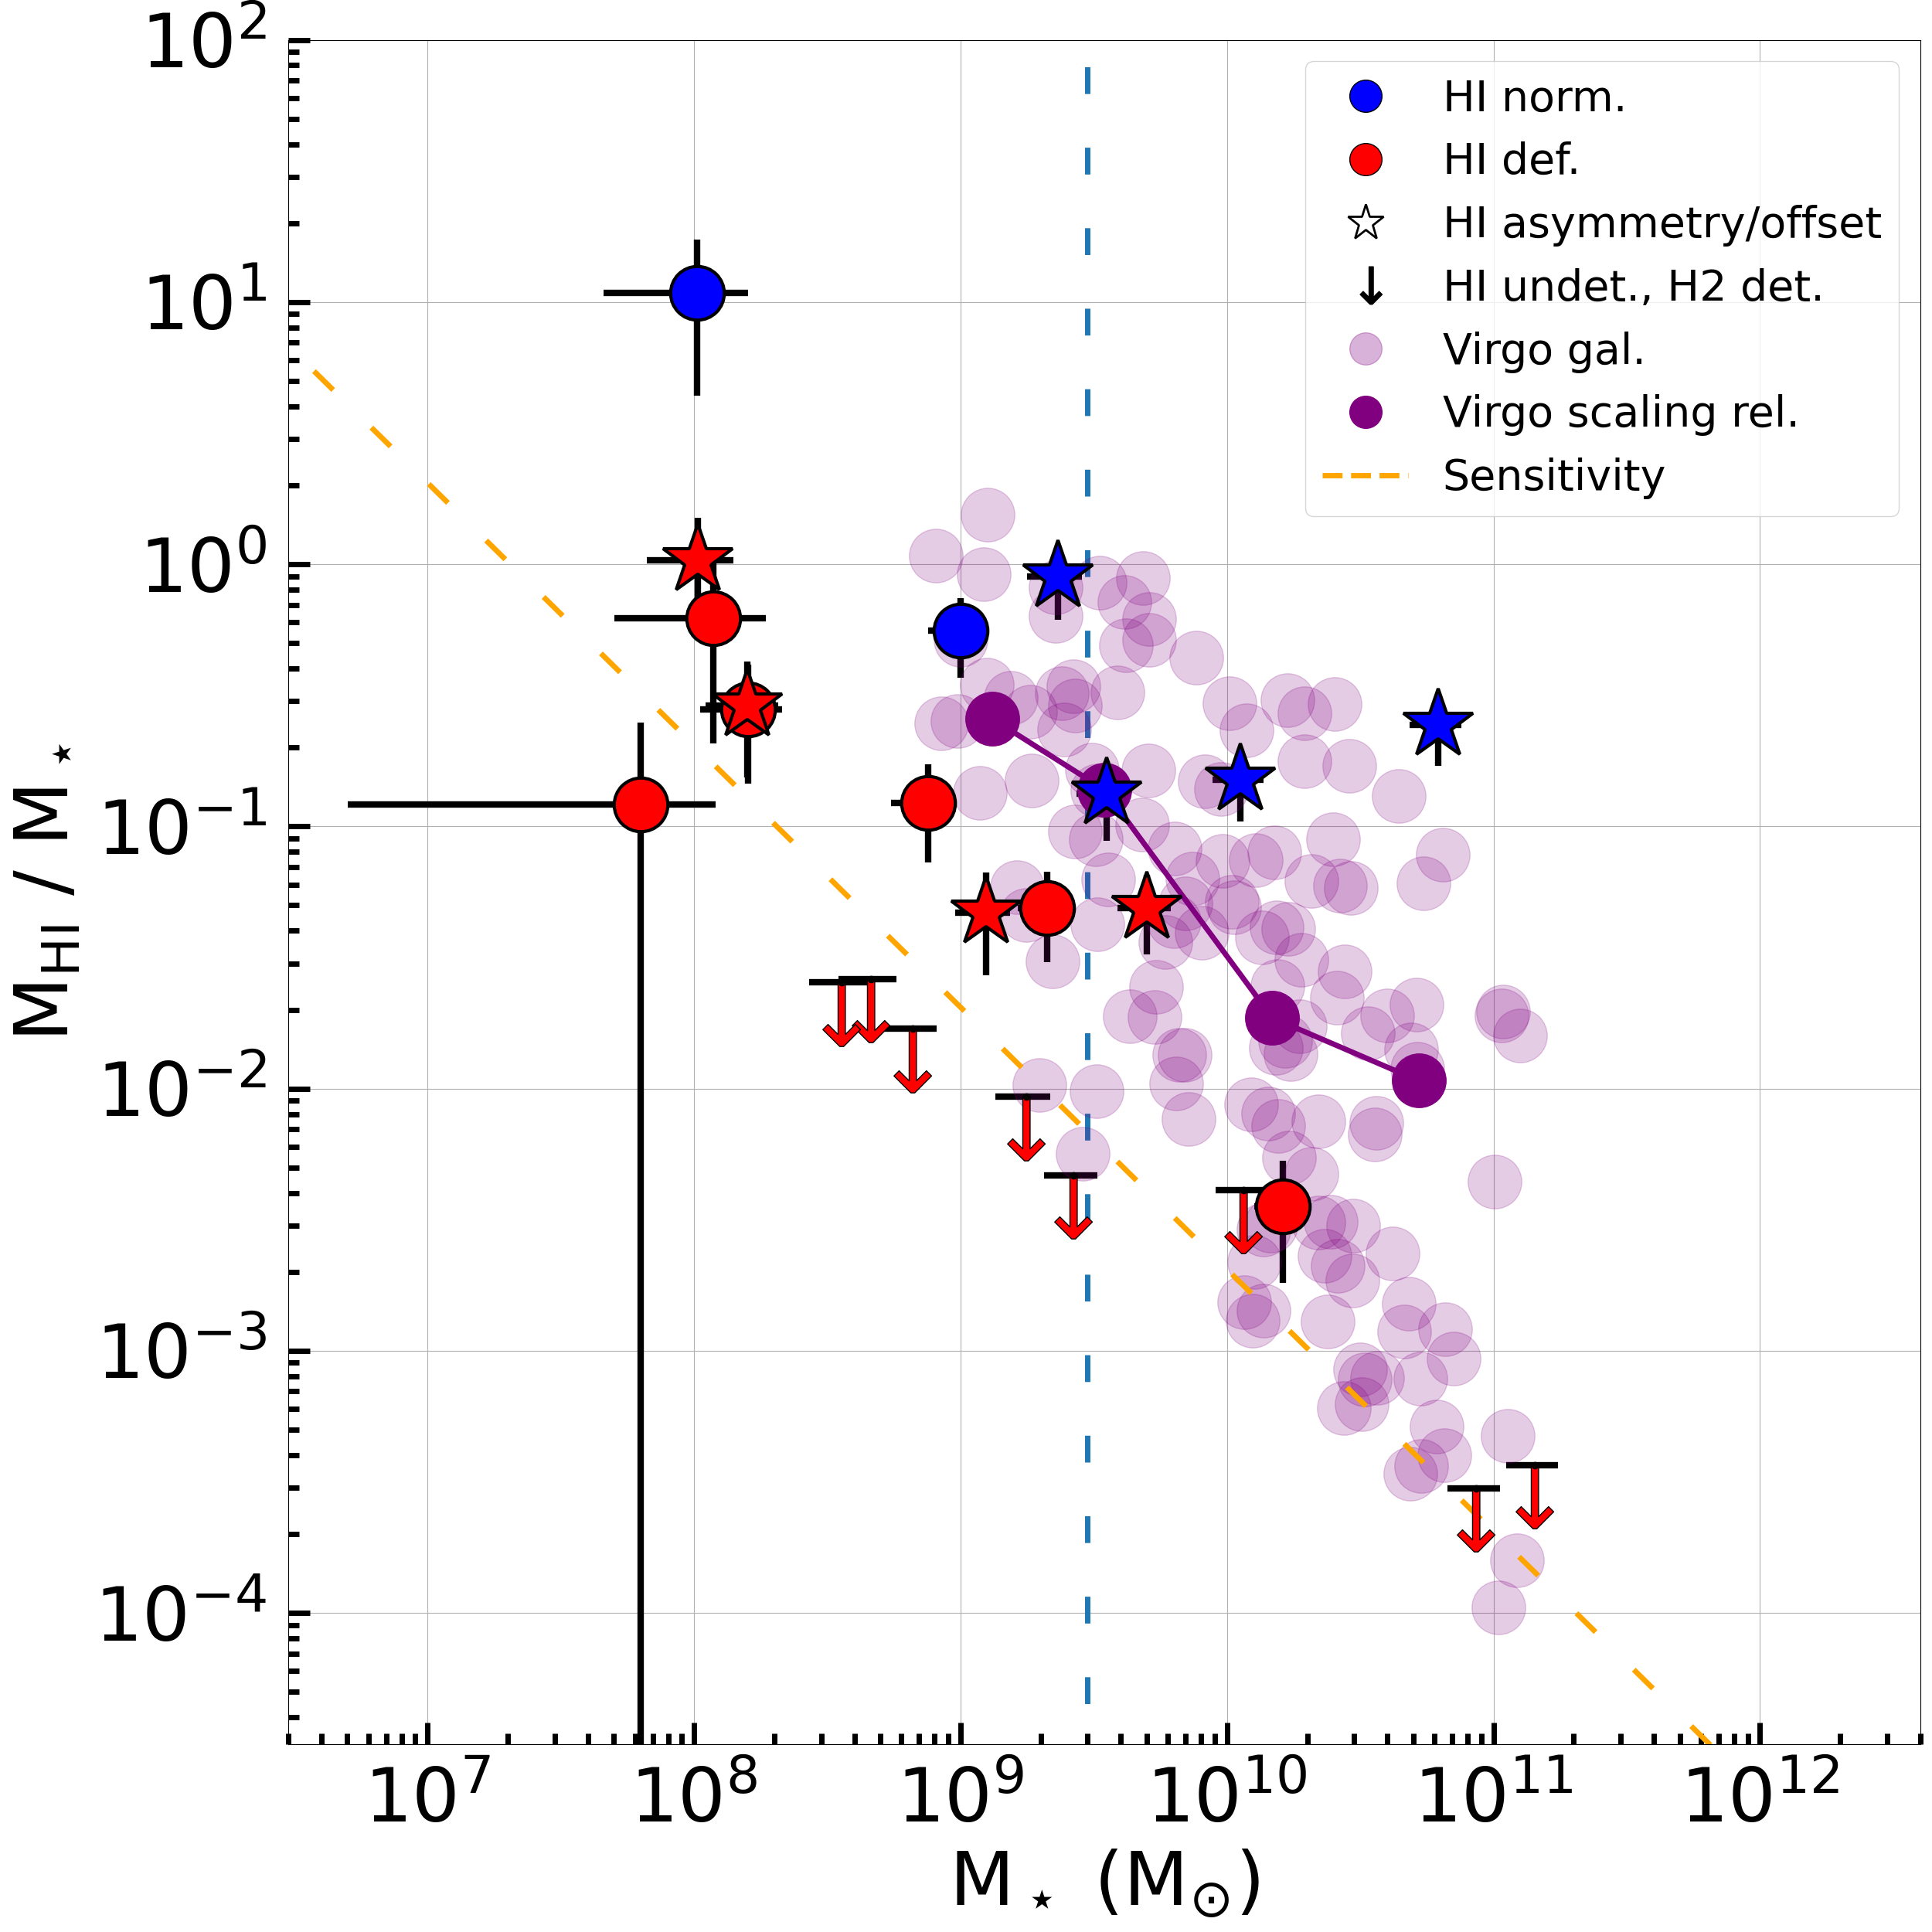
Finally, Fig. 8 shows the comparison between Fornax and Virgo galaxies (from HRS - Boselli et al. 2014) belonging to Virgo clouds A, B, N, E and S (as defined by Gavazzi et al. 1999) with 101011 M⊙. Here we show the Virgo cluster galaxies and the average scaling relation obtained from them in the same range (Cortese et al., 2011). Since Virgo is populated by H\scaleto1.2ex poor galaxies with respect to field galaxies (Davies & Lewis, 1973; Chamaraux et al., 1980; Cayatte et al., 1994; Hughes & Cortese, 2009; Chung et al., 2009), this scaling relation is shifted towards lower gas fractions with respect to xGASS (Fig. 6). Although Fornax and Virgo galaxies experience different cluster environments, the distribution of Fornax galaxies cover the whole range of / of Virgo galaxies, reaching the same level of H\scaleto1.2ex deficiency.
3.3 Linking H\scaleto1.2ex properties with H2\scaleto1.2ex0pt and SFR
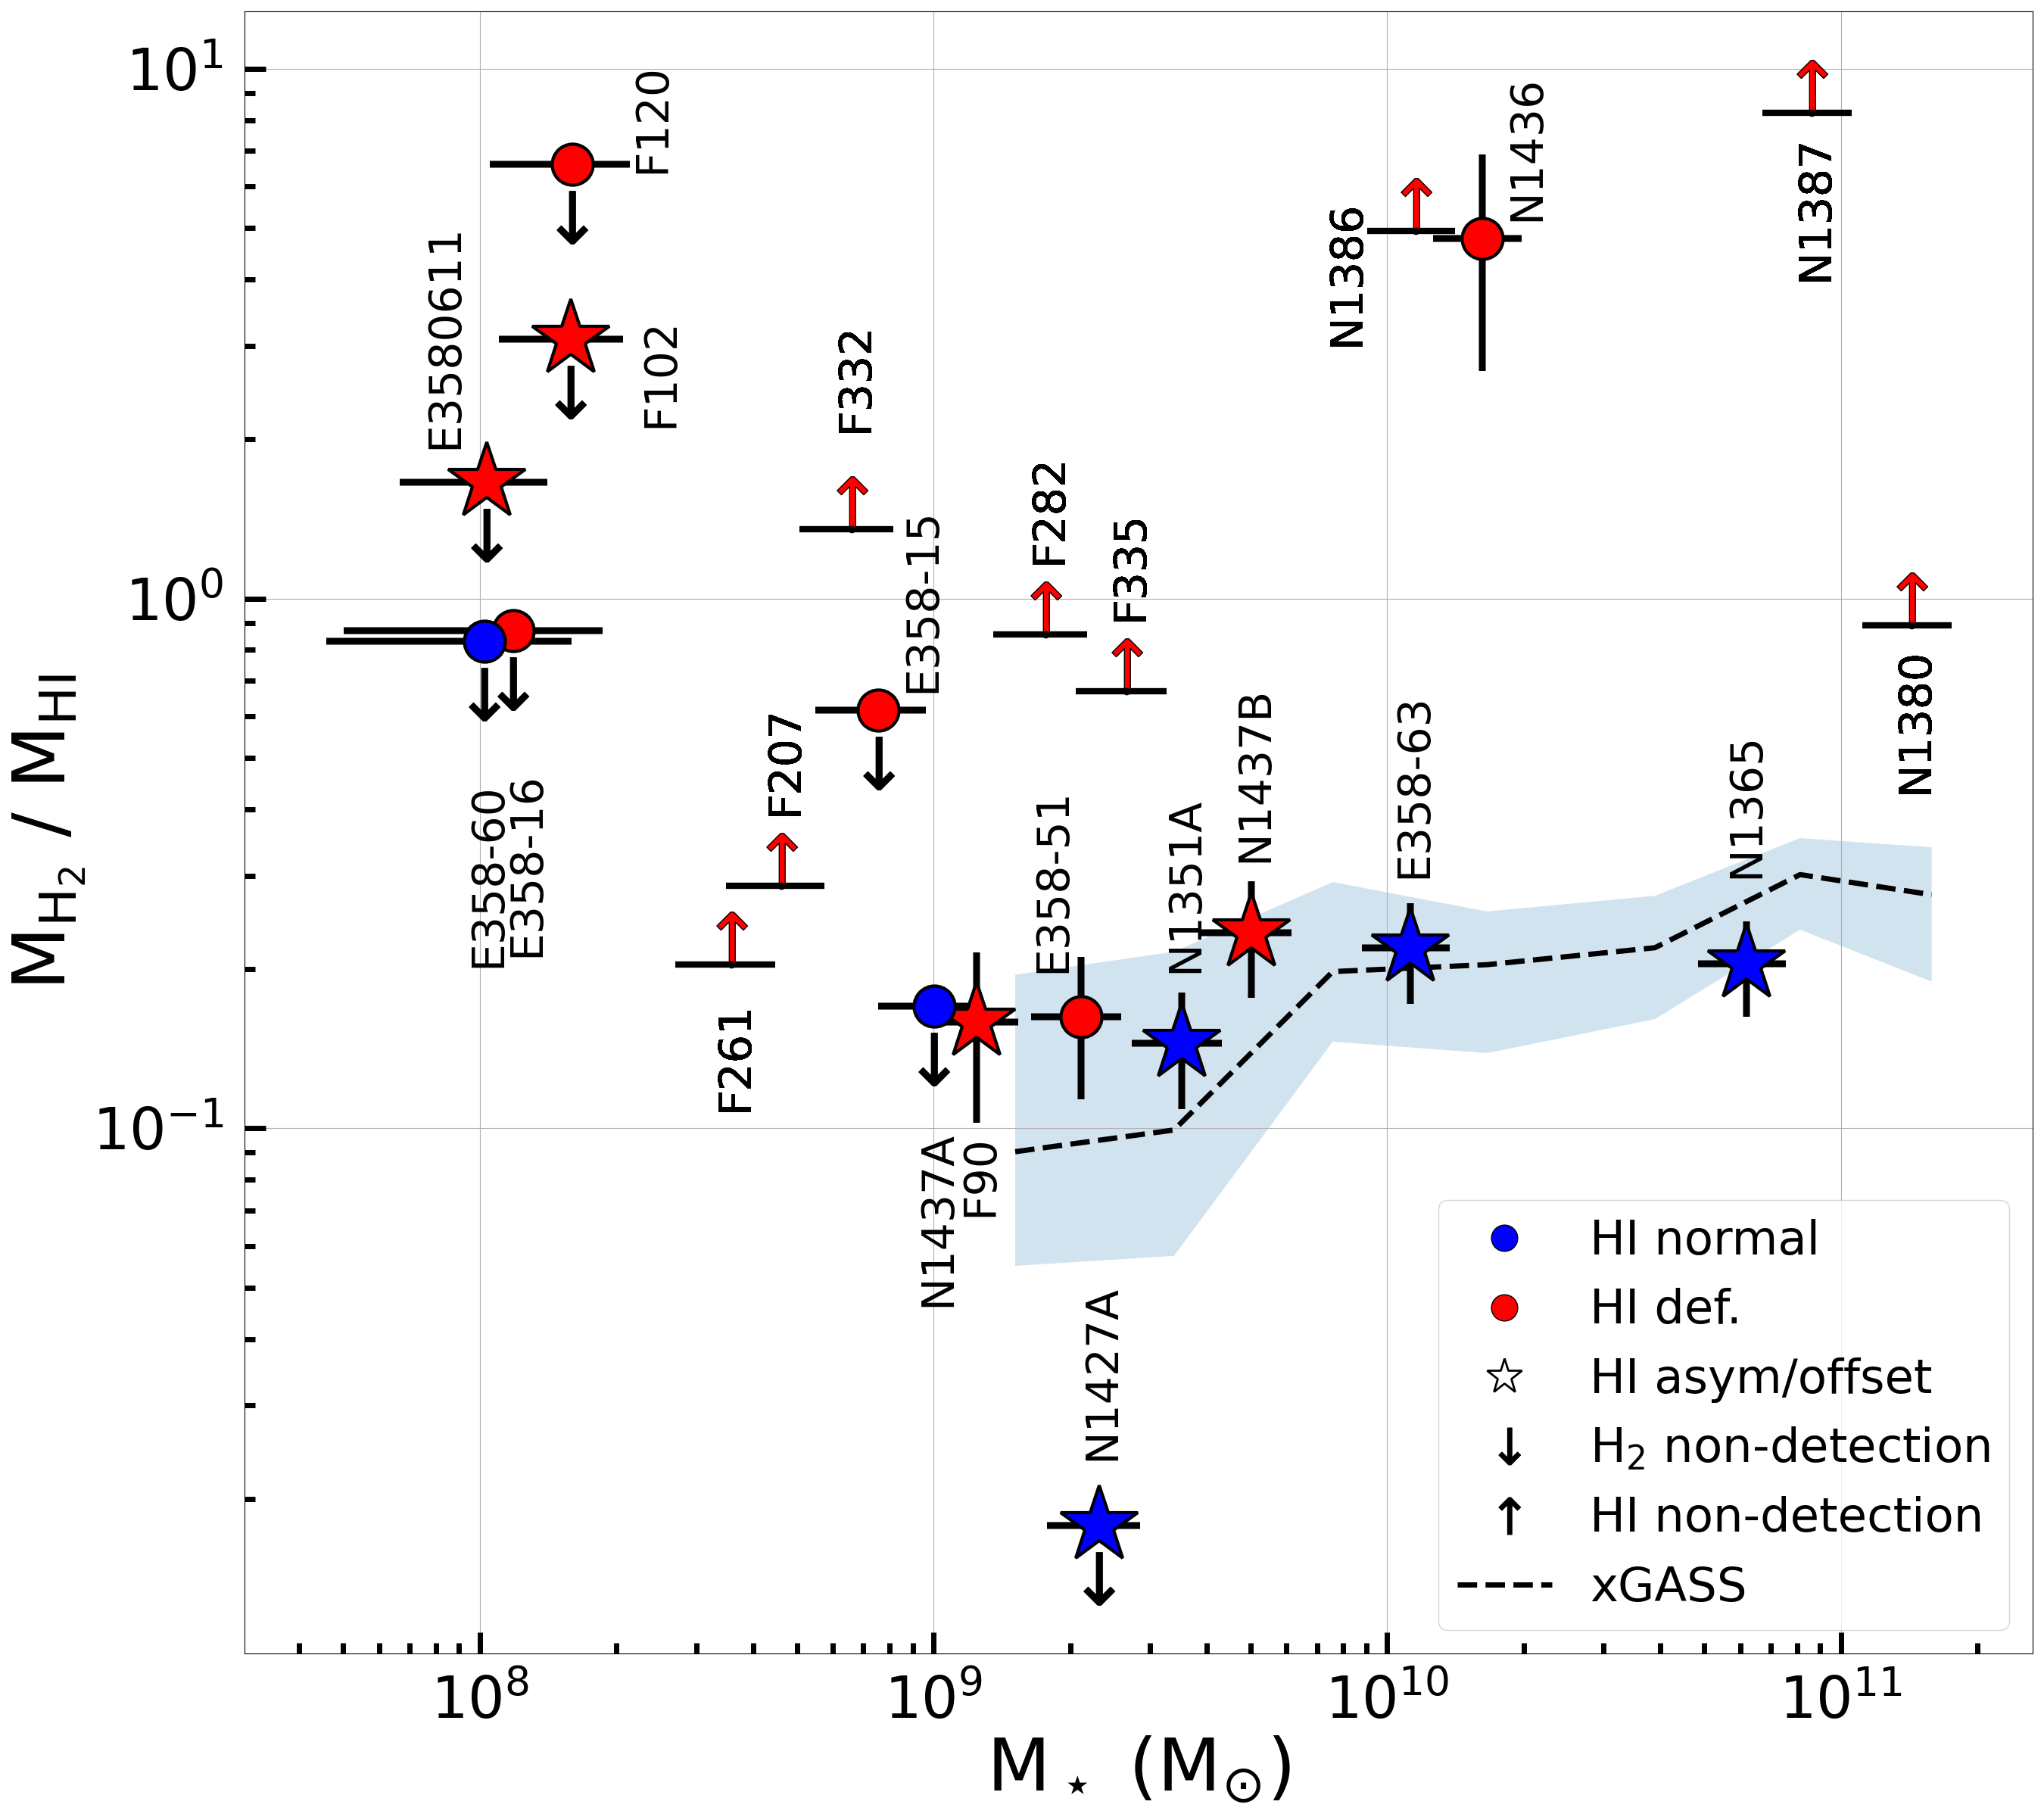
The ratio between molecular and atomic gas mass () can be useful to identify anomalous galaxies where, for example, only the atomic phase is affected by the environment or H\scaleto1.2ex is not efficiently converted to H2\scaleto1.2ex0pt. We thus compared the atomic and molecular gas reservoirs of our detections (see Fig. 9). For this purpose, we used H2\scaleto1.2ex0pt masses from Zabel et al. (2019) for all our H\scaleto1.2ex detections except for FCC 323 (no molecular gas data available). We also include in this analysis the eight galaxies detected with ALMA (Zabel et al., 2019) that are not detected in H\scaleto1.2ex (upper limits in Fig. 6 and Fig. 8; see Sec. 3.2). We also scaled the molecular upper limit from Zabel et al. (2019) to be consistent with a line width of 100 km s-1. As a comparison, we used the xGASS - scaling relation in Catinella et al. (2018), which describes the typical ratio as a function of at 0.
For 109 M⊙, 55 of all H\scaleto1.2ex detected galaxies are also H2\scaleto1.2ex0pt detected, while this fraction drops to zero for 109 M⊙ (likely because the lower metallicity of these objects makes CO progressively harder to detect). In the rest of this section we therefore focus on the higher range. Here, we see that about half of the galaxies are consistent with the xGASS sample, while most of the remaining galaxies are above the xGASS scaling (see Fig. 9). In particular, galaxies with a distorted H\scaleto1.2ex morphology are compatible with the xGASS trend with the exception of NGC 1427A whose lack of molecular gas is puzzling (see Zabel et al., 2019). Although this galaxy has a normal (and large) H\scaleto1.2ex mass for its stellar mass, no molecular gas was detected with ALMA. The agreement with the scaling relation holds also for NGC 1437B, which is the only H\scaleto1.2ex deficient galaxy with a distorted morphology in this range of .
The detection with the highest / ratio is NGC 1436. Although we might be missing H\scaleto1.2ex flux (Sect. 3.2), this mass ratio remains high even if we use the value estimated from the GBT flux (with a / = 1.7). Other three galaxies, NGC 1386, NGC 1387 and NGC 1380, may be even more peculiar as the lower limit on their / ratio is already an order of magnitude above the xGASS scaling relation. High / ratios have also been measured in Virgo galaxies (Cortese et al., 2016).
Given the broad distribution of / ratio in Fornax, we further investigate whether their star formation rate follows standard scaling with and . In particular, we are interested in understanding whether the general offset of Fornax galaxies towards low / ratios in Fig. 6 is associated with a decrease of SFR at fixed .
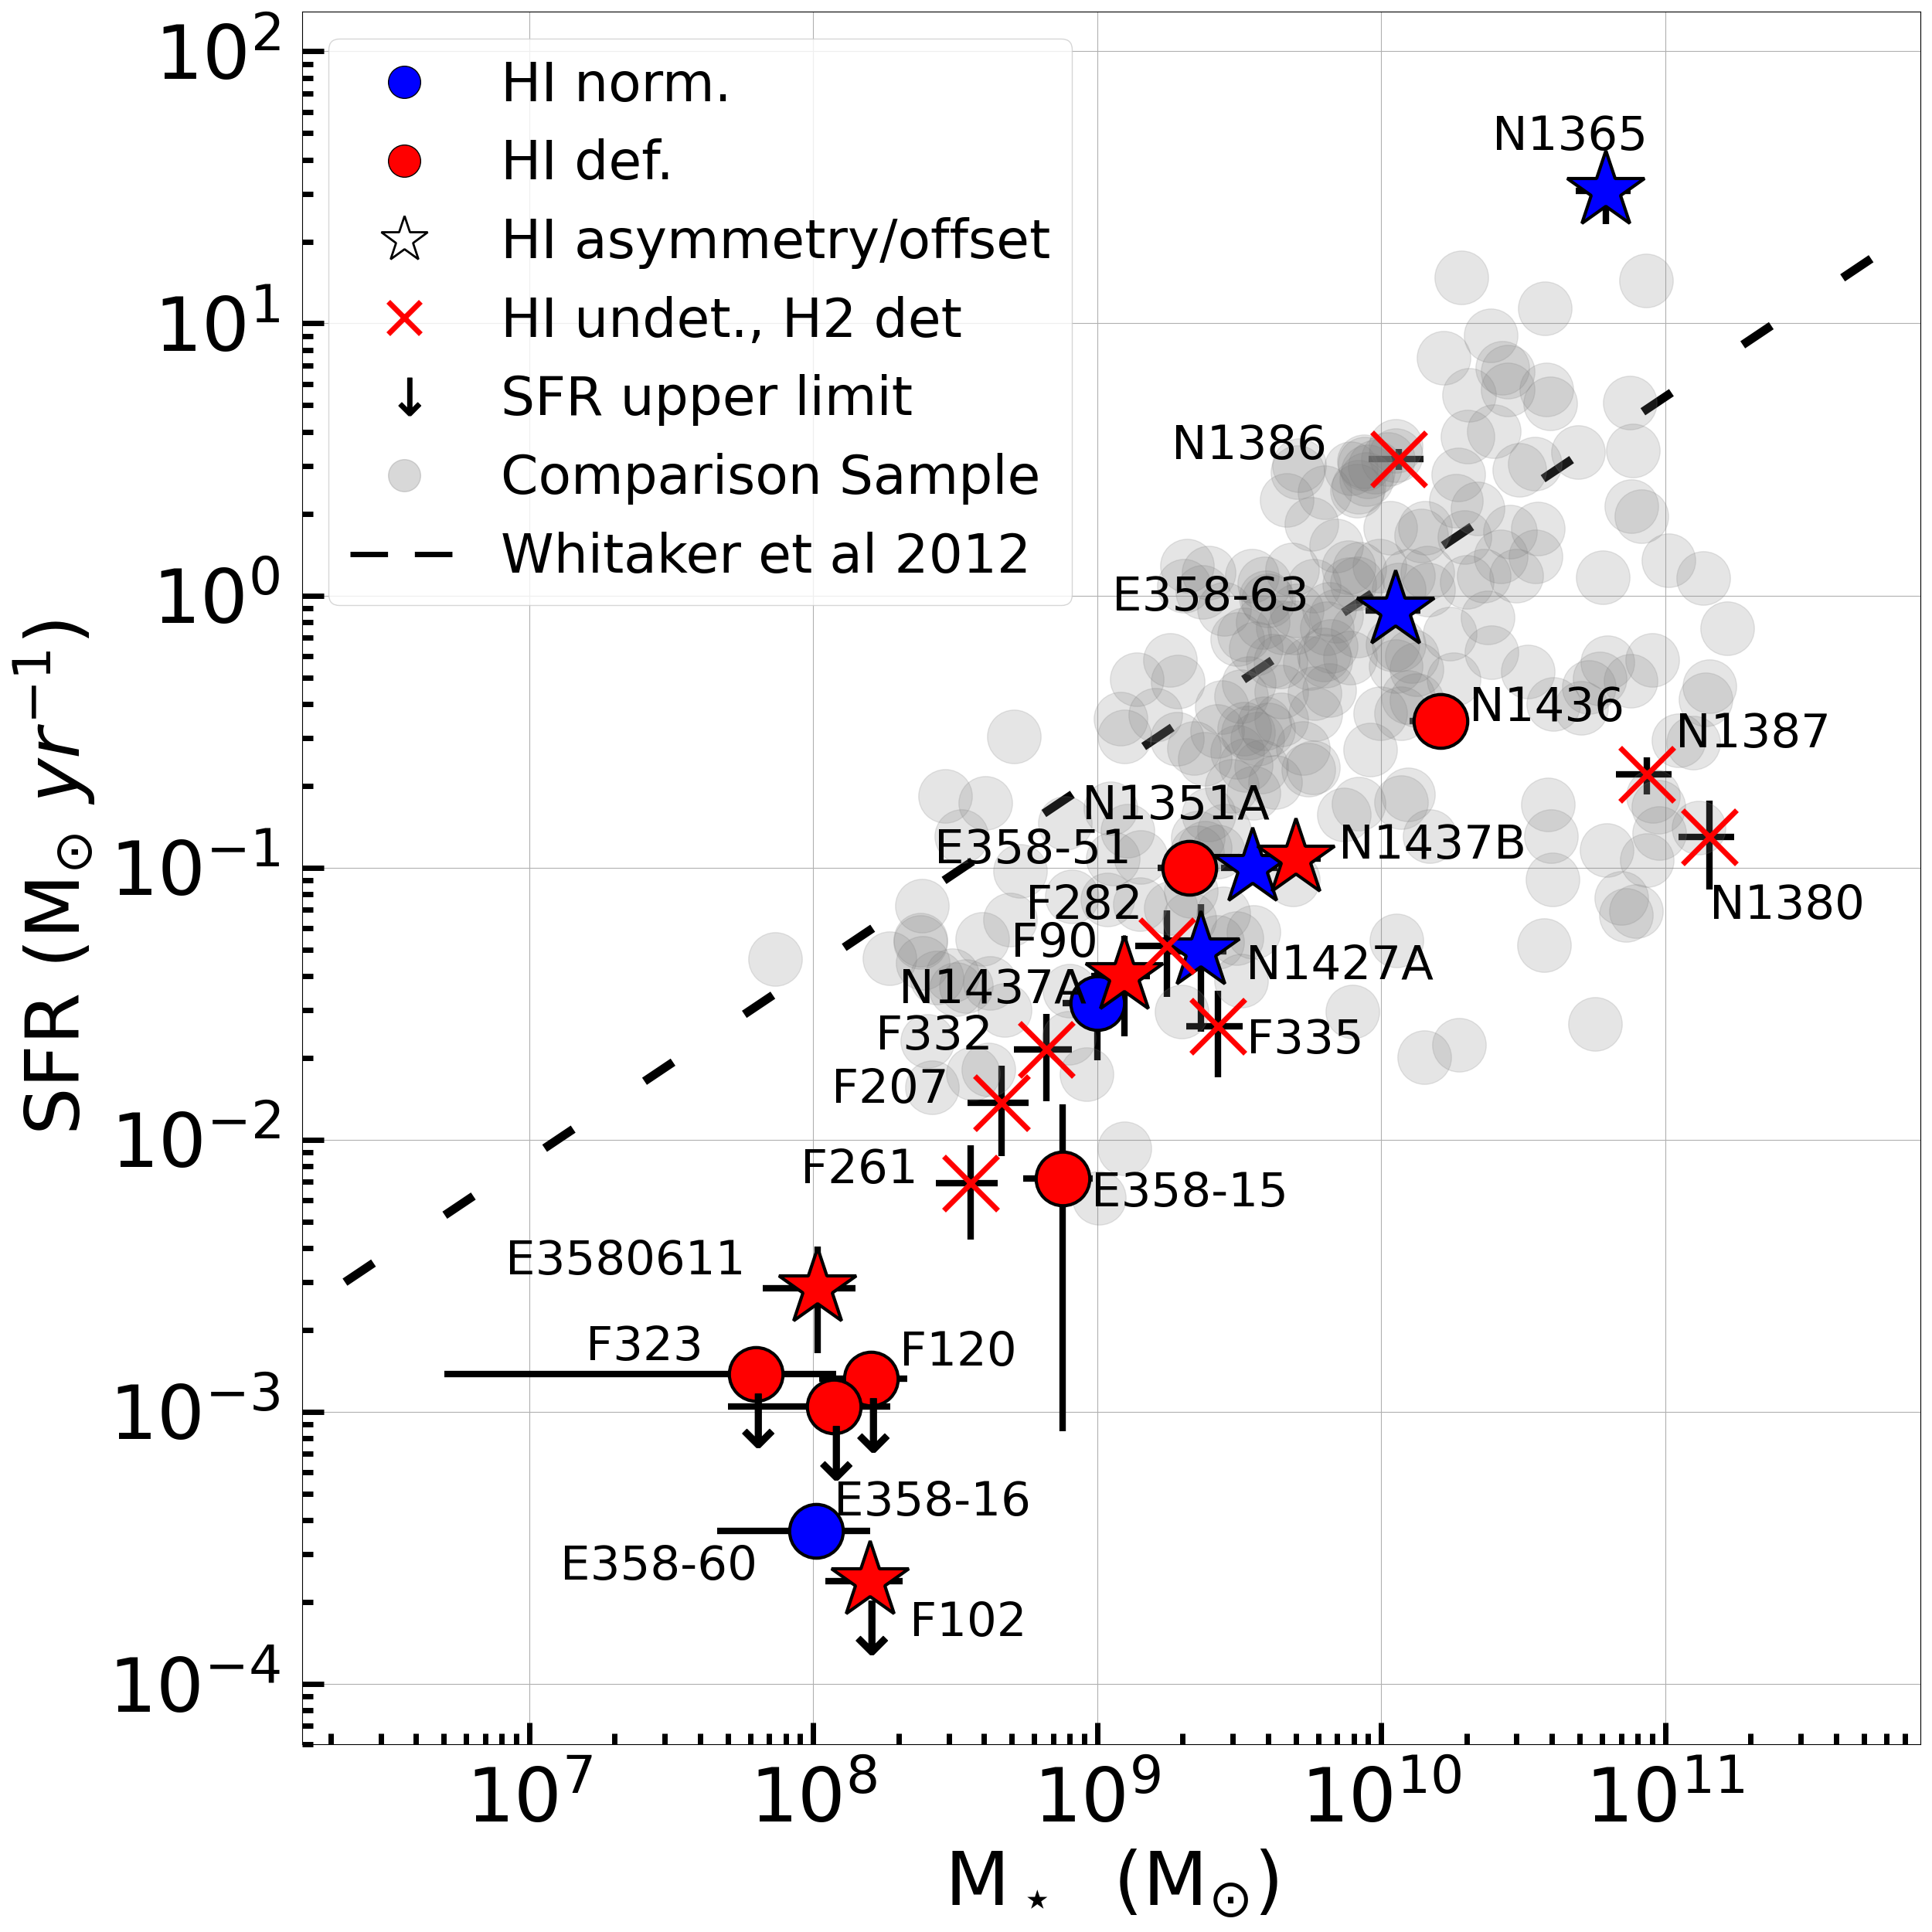
We start by comparing Fornax galaxies with the same sample of non-cluster galaxies used in Sect. 3.2. SFR of both samples of Fornax galaxies and non-cluster galaxies are evaluated using eq. 2 in Boquien et al. (2016). We set the scaling coefficient for the infrared 24 m band (W4) equal to 6.17. We adopted the calibration factor for near UV 231 nm band (NUV) to be log10C = -43.17 (Kennicutt & Evans, 2012). NUV fluxes come from GCAT (Seibert et al., 2012) and IRSA catalogues (Leroy et al., 2019). Since the latter catalogue is more reliable for galaxies at = 0, we used it to get the NUV flux from Fornax galaxies. W4 was obtained using custom software optimised for performing aperture photometry on resolved galaxies (Jarrett et al. 2013; Cluver et al. 2014b; Jarrett et al. 2019). Then, we removed the contribution from the evolved stellar populations using the method of Helou et al. (2004) which consists of scaling and subtracting the W1 light (a proxy of evolved stellar population) from W4 as described in Cluver et al. (2017). For a fraction of galaxies, NUV and W4 fluxes were not available (3/212 non-cluster galaxies; 11/24 Fornax galaxies). In these cases, we calculate the SFR from the W3 (12m) luminosity – with stellar emission subtracted (as for W4)– and the TIR-to-MIR relation using eq. 4 in Cluver et al. (2017), where L12 m is the continuum-subtracted spectral ( Lν) luminosity. Our conclusions below do not change if we calculate SFR from WISE data alone.
Fig. 10 shows that the majority of the Fornax galaxies have a SFR below the values predicted by the scaling relation of Whitaker et al. (2012). Furthermore, the difference between the SFR of Fornax galaxies and that predicted from Whitaker et al. (2012) increases towards lower . That is, the SFR- relation in Fornax is steeper than that of non-cluster galaxies. This might indicate a stronger SFR decrease in low-mass galaxies, similar to what observed for their H\scaleto1.2ex reservoirs (as discussed in Sect. 3.2) and their H2\scaleto1.2ex0pt reservoirs (Zabel et al., 2019). Also when compared to the HRS+VGS comparison sample, Fornax galaxies appear to be offset towards lower SFR values, mirroring the results in Fig. 6.
Among the four galaxies with the highest / ratio in Fig. 9, NGC 1386 is the only one with a higher SFR than expected. This is likely due to the presence of an AGN (Rodr´ıguez-Ardila et al., 2017) which affects the SFR measurement. The other two H\scaleto1.2ex undetected galaxies, NGC 1380 and NGC 1387, reside at the lower edge of the comparison sample. We notice that NGC 1380 is also highly H2\scaleto1.2ex0pt deficient in Zabel et al. (2019).
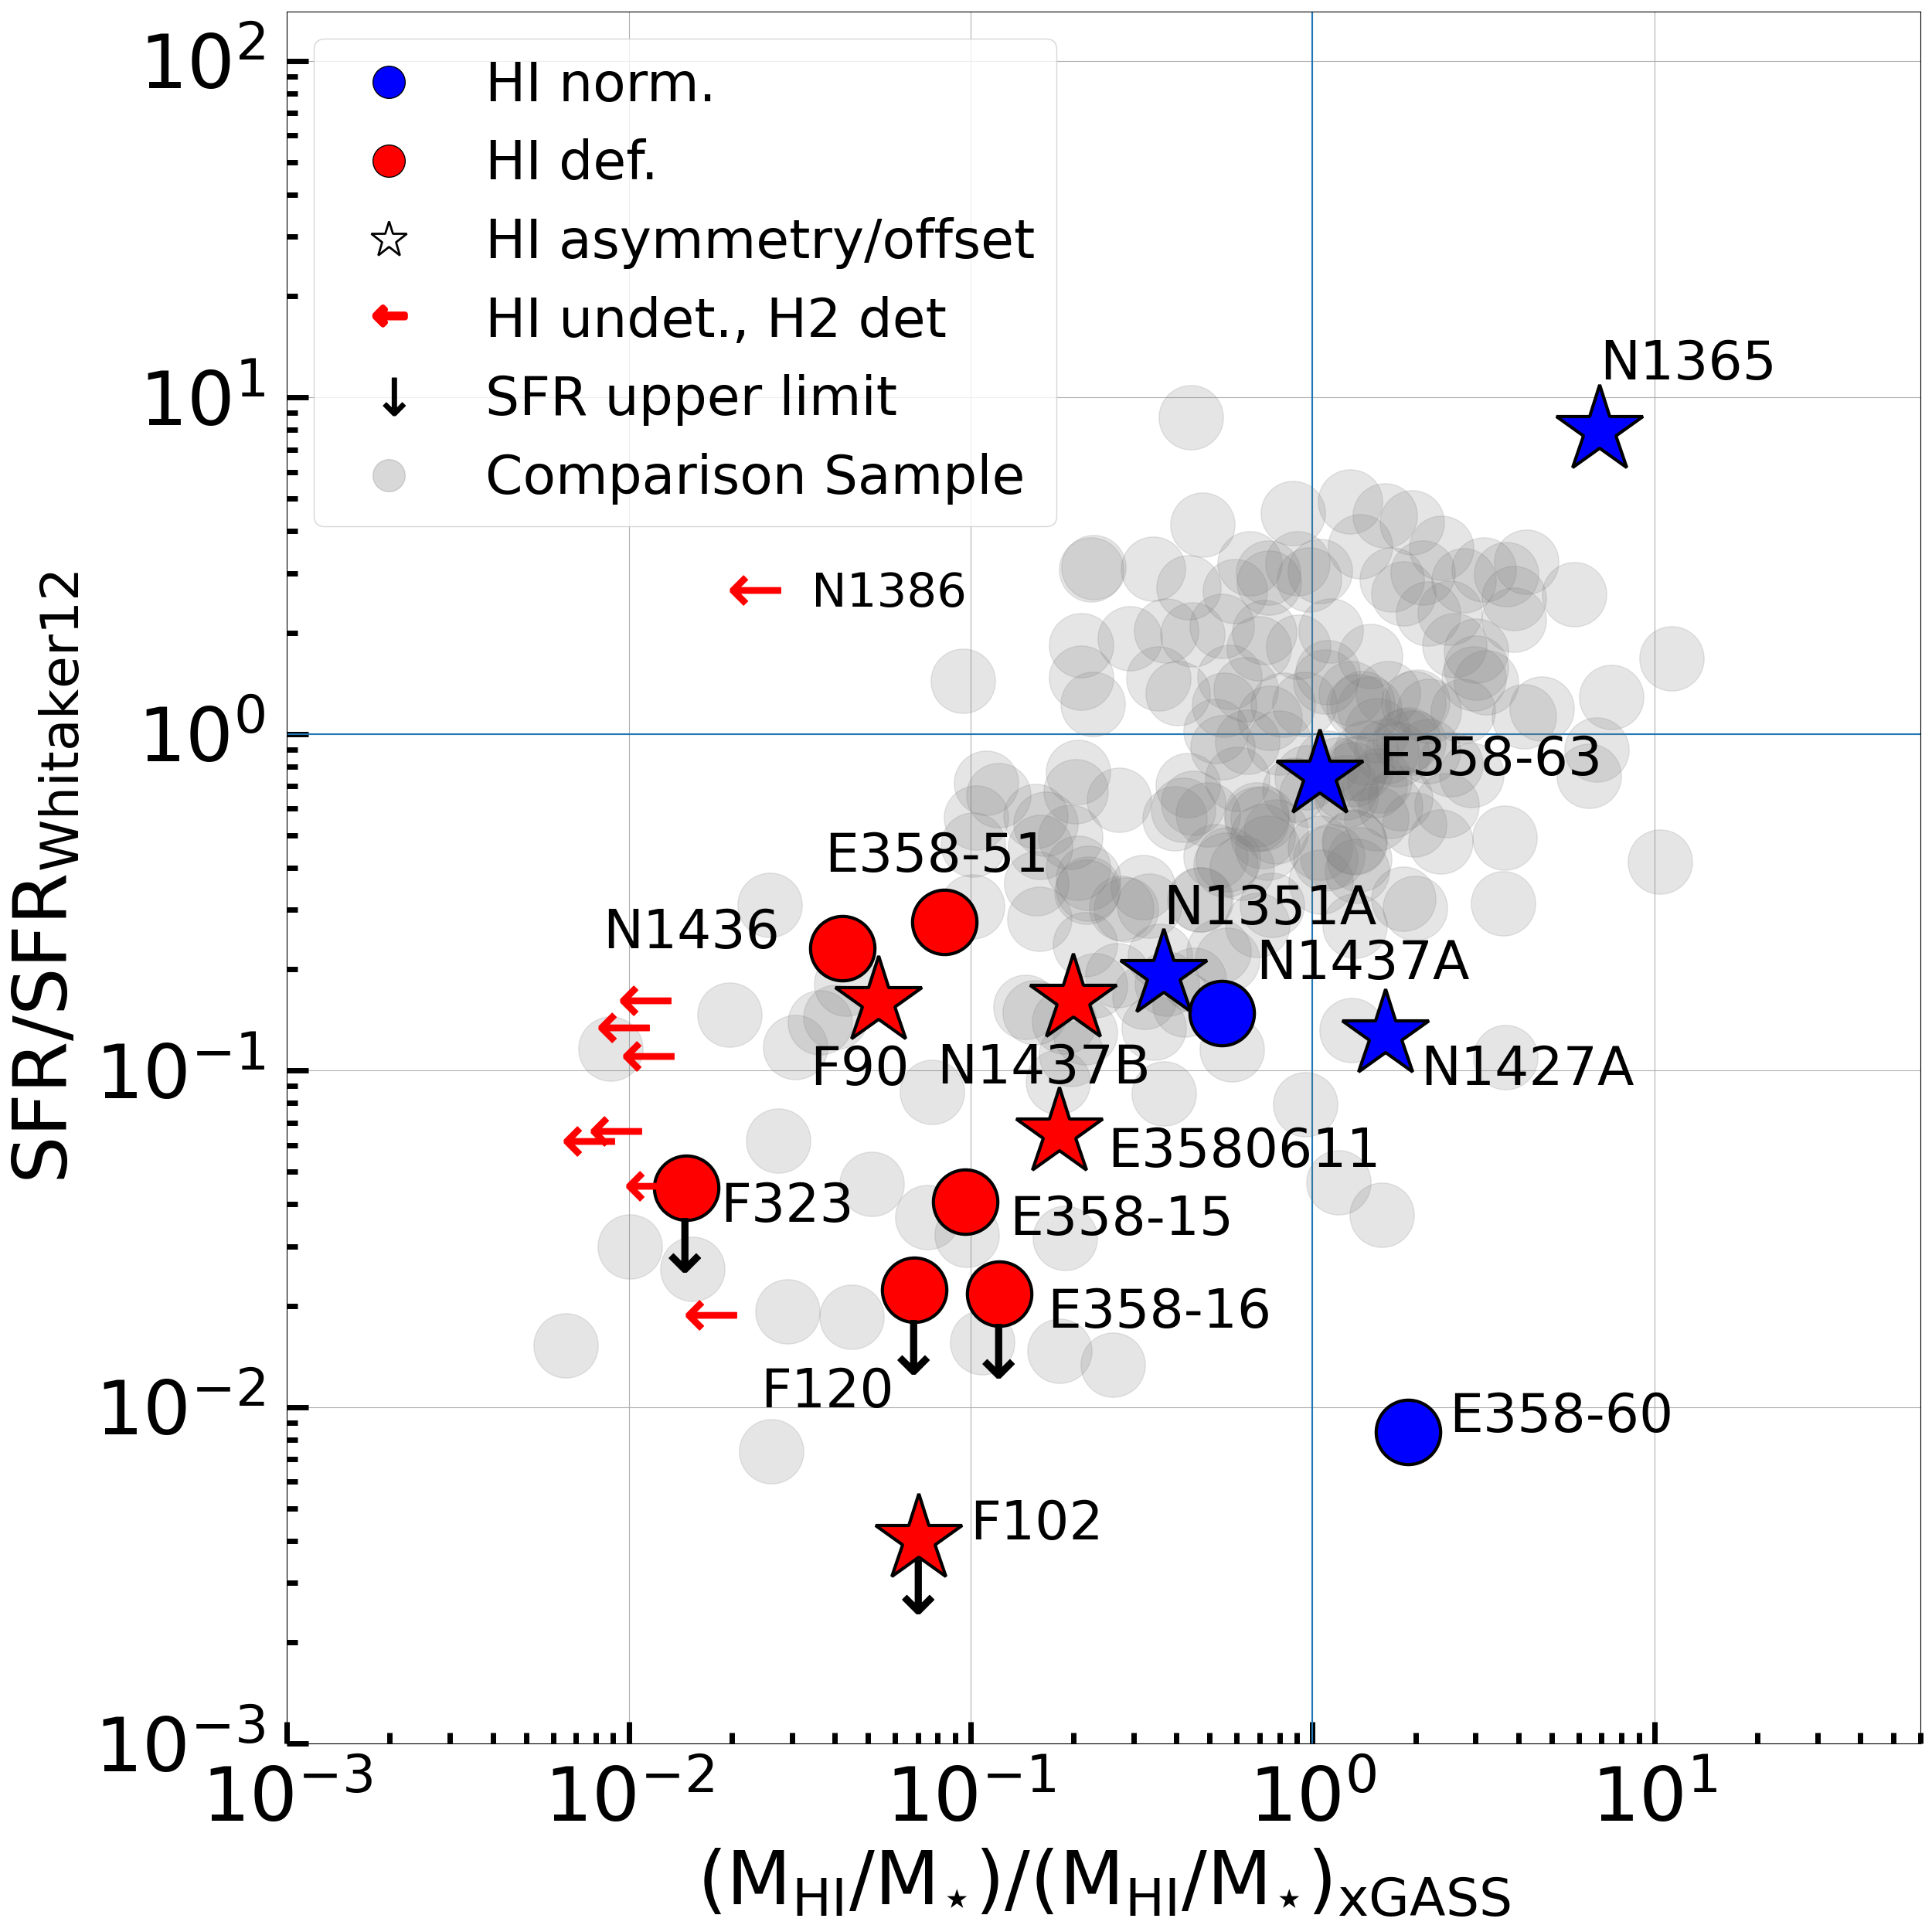
In Fig. 11 we investigate whether, in Fornax, the low SFR (at fixed ; Fig. 10) can be related to the H\scaleto1.2ex deficiency (Fig. 6). This figure plots the SFR and / deviations from the respective scaling relations (Fig. 10 and Fig. 6) against one another. We find that Fornax galaxies mostly populate the area of the plot of H\scaleto1.2ex deficient galaxies with low SFR, following the trend of non-cluster galaxies in the comparison sample. That is, in Fornax, a decrease in is accompanied by a decrease in SFR just like in non-cluster galaxies. In Sec. 4 we present an interpretation of this result.
On top of this general trend we see a few outliers. The most evident ones are ESO 358-G060 and the H\scaleto1.2ex undetected NGC 1386. While the high SFR in NGC 1386 might be an artefact caused by the presence of an AGN, the case of ESO 358-G060 is more complicated. We carefully inspected this galaxy’s WISE images and no SFR from W3/W4 with old stellar population subtraction was detectable. Therefore, we calculated its SFR the from NUV flux alone using eq. 12 in Kennicutt & Evans (2012). Although ESO 358-G060 is H\scaleto1.2ex rich, its SFR is lower than that any galaxy of the comparison sample with a similar . It is worth noting the cases of NGC 1436 which lies at the upper edge of the comparison sample of H\scaleto1.2ex deficient galaxy (bottom-left quadrant of Fig. 11) and NGC 1427A which shows a low SFR although its large H\scaleto1.2ex reservoir. All these cases will be discussed in Sect. 4.
3.4 H\scaleto1.2ex properties as a function of 3D location in Fornax cluster
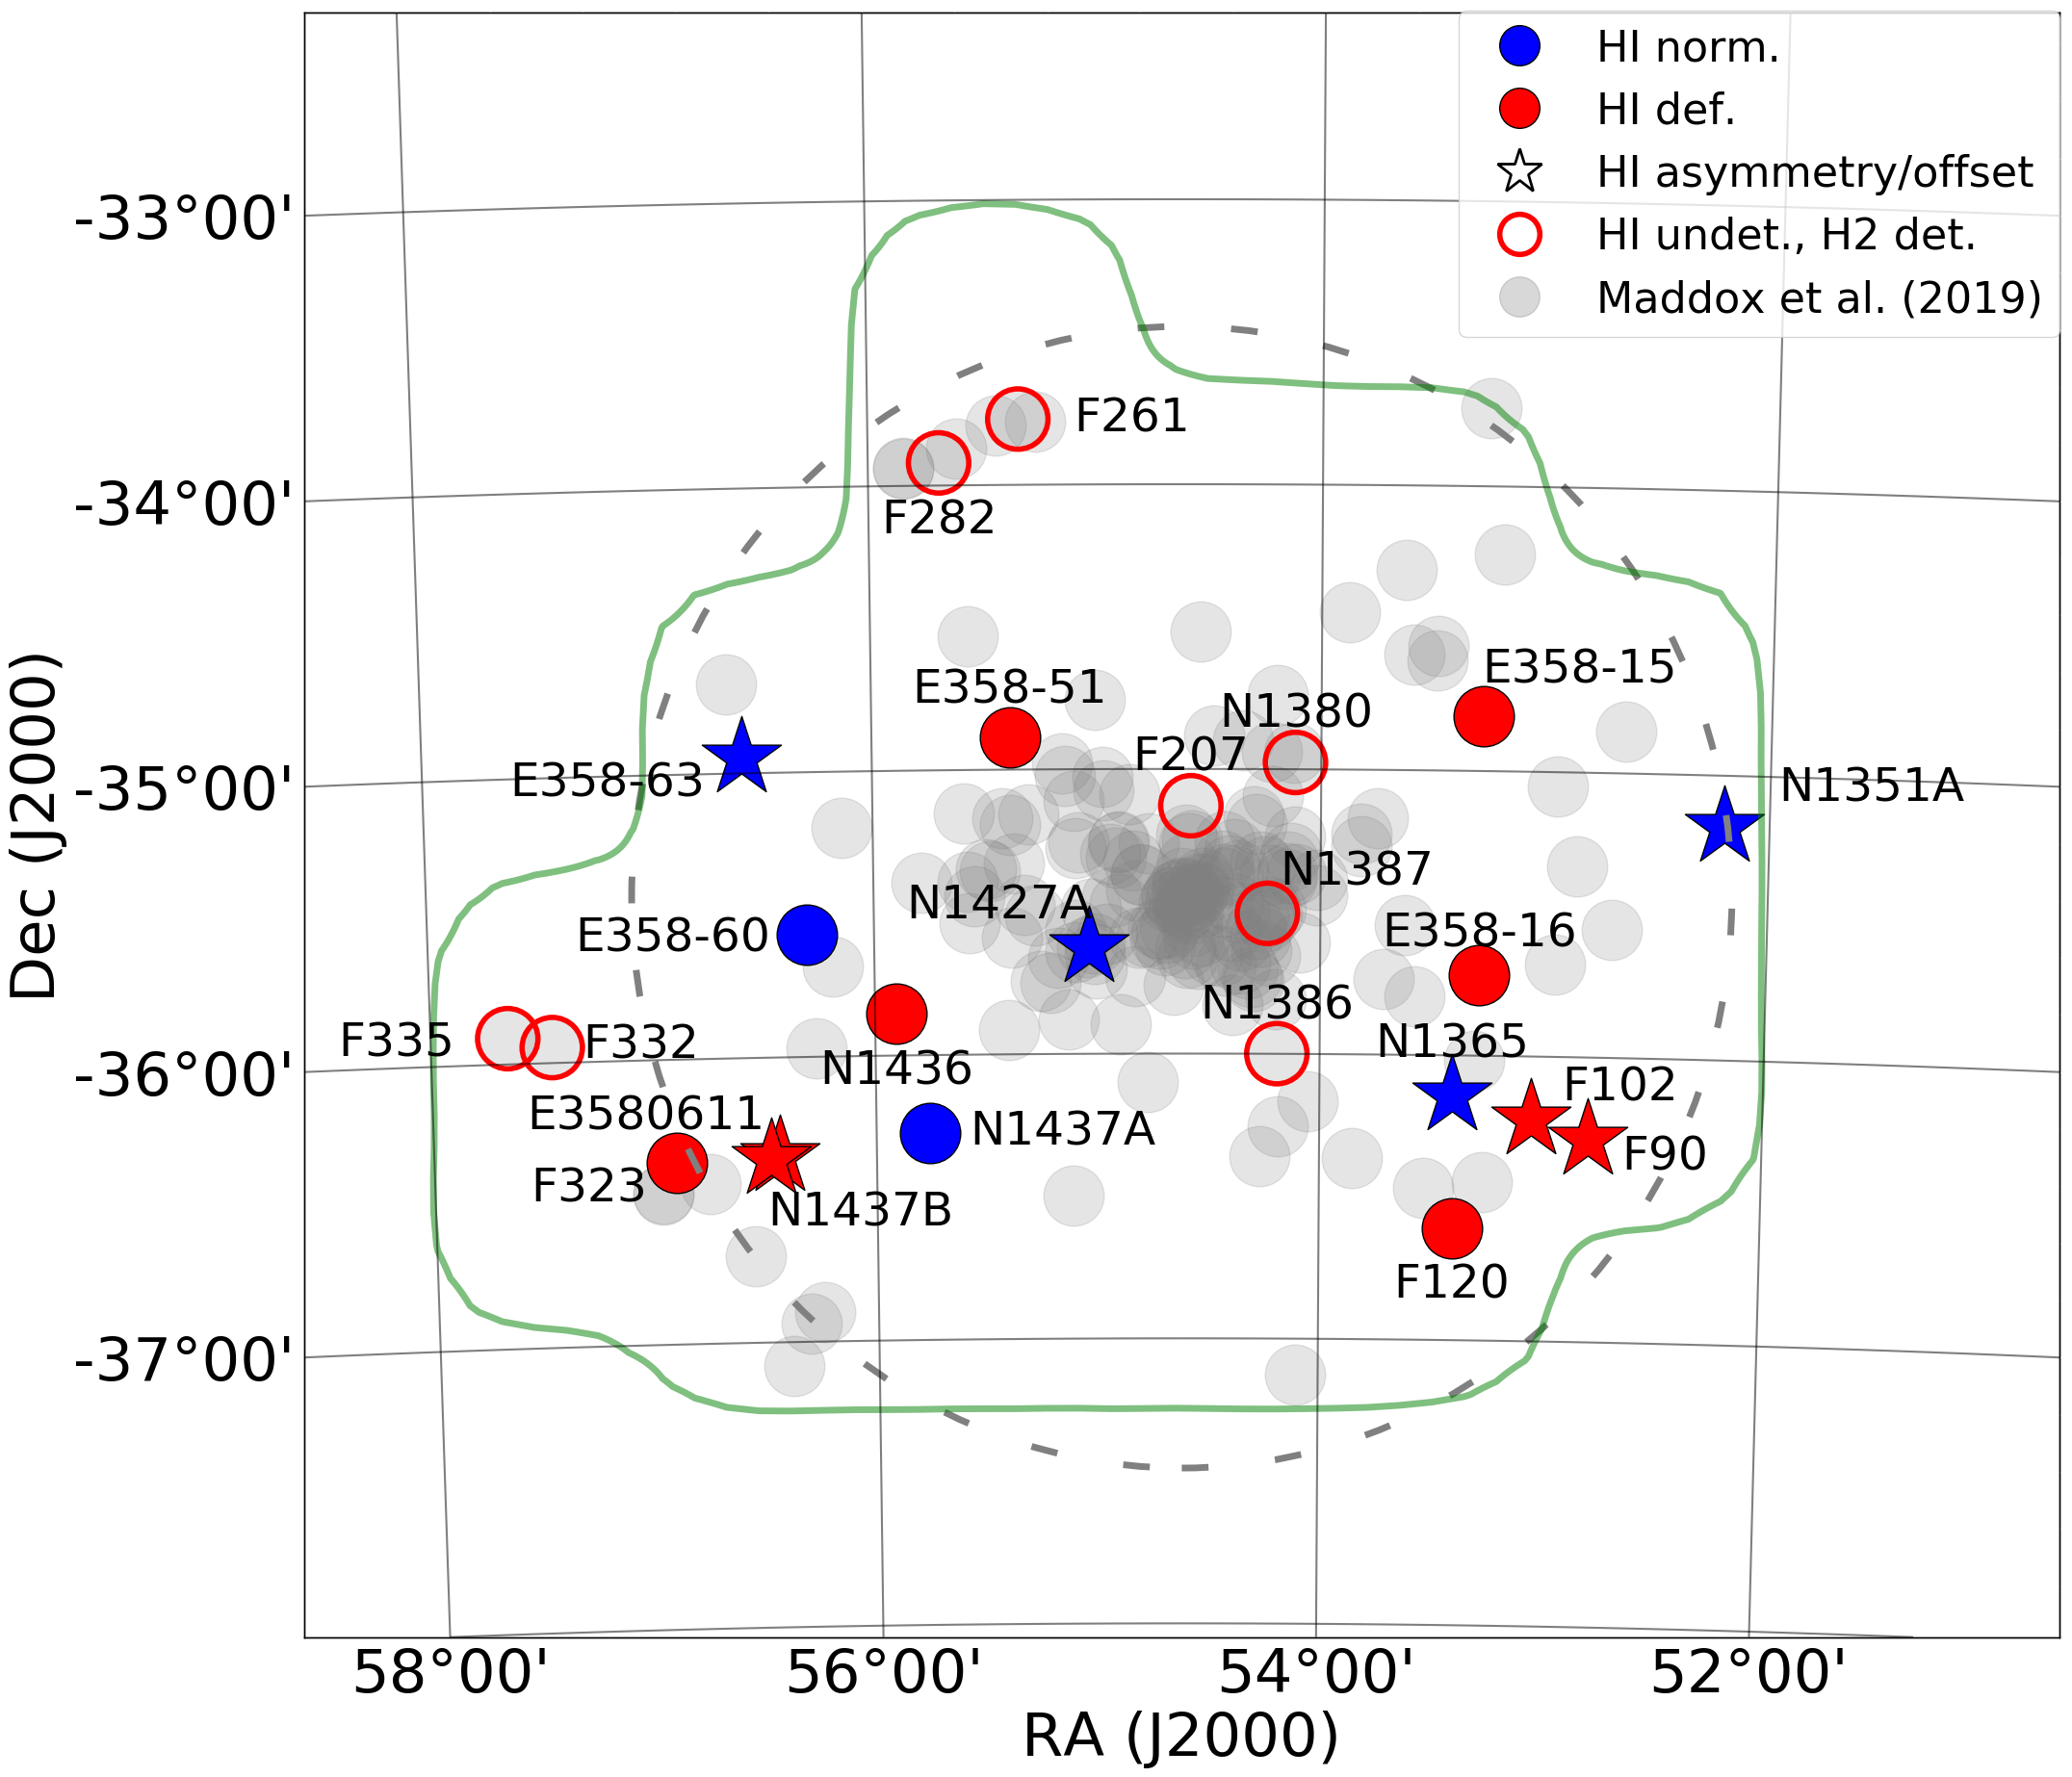
In Fig. 12, we compare the 2D distribution of our Fornax H\scaleto1.2ex detections with that of all spectroscopic Fornax members (Maddox et al., 2019) included within our survey footprint. Keeping in mind that the area of the sky that we observed is not symmetric, most of the galaxies in our sample are located south of the centre of the cluster, while only four out of 16 detections are located north of it.
Almost all our H\scaleto1.2ex detections (88 of the sample) are located farther than 0.5 in projection (the only exceptions being NGC 1427A at 0.2 , and ESO 358-G051 at 0.4 ). In contrast, only 33 of all Fornax galaxies in our footprint are outside 0.5 .
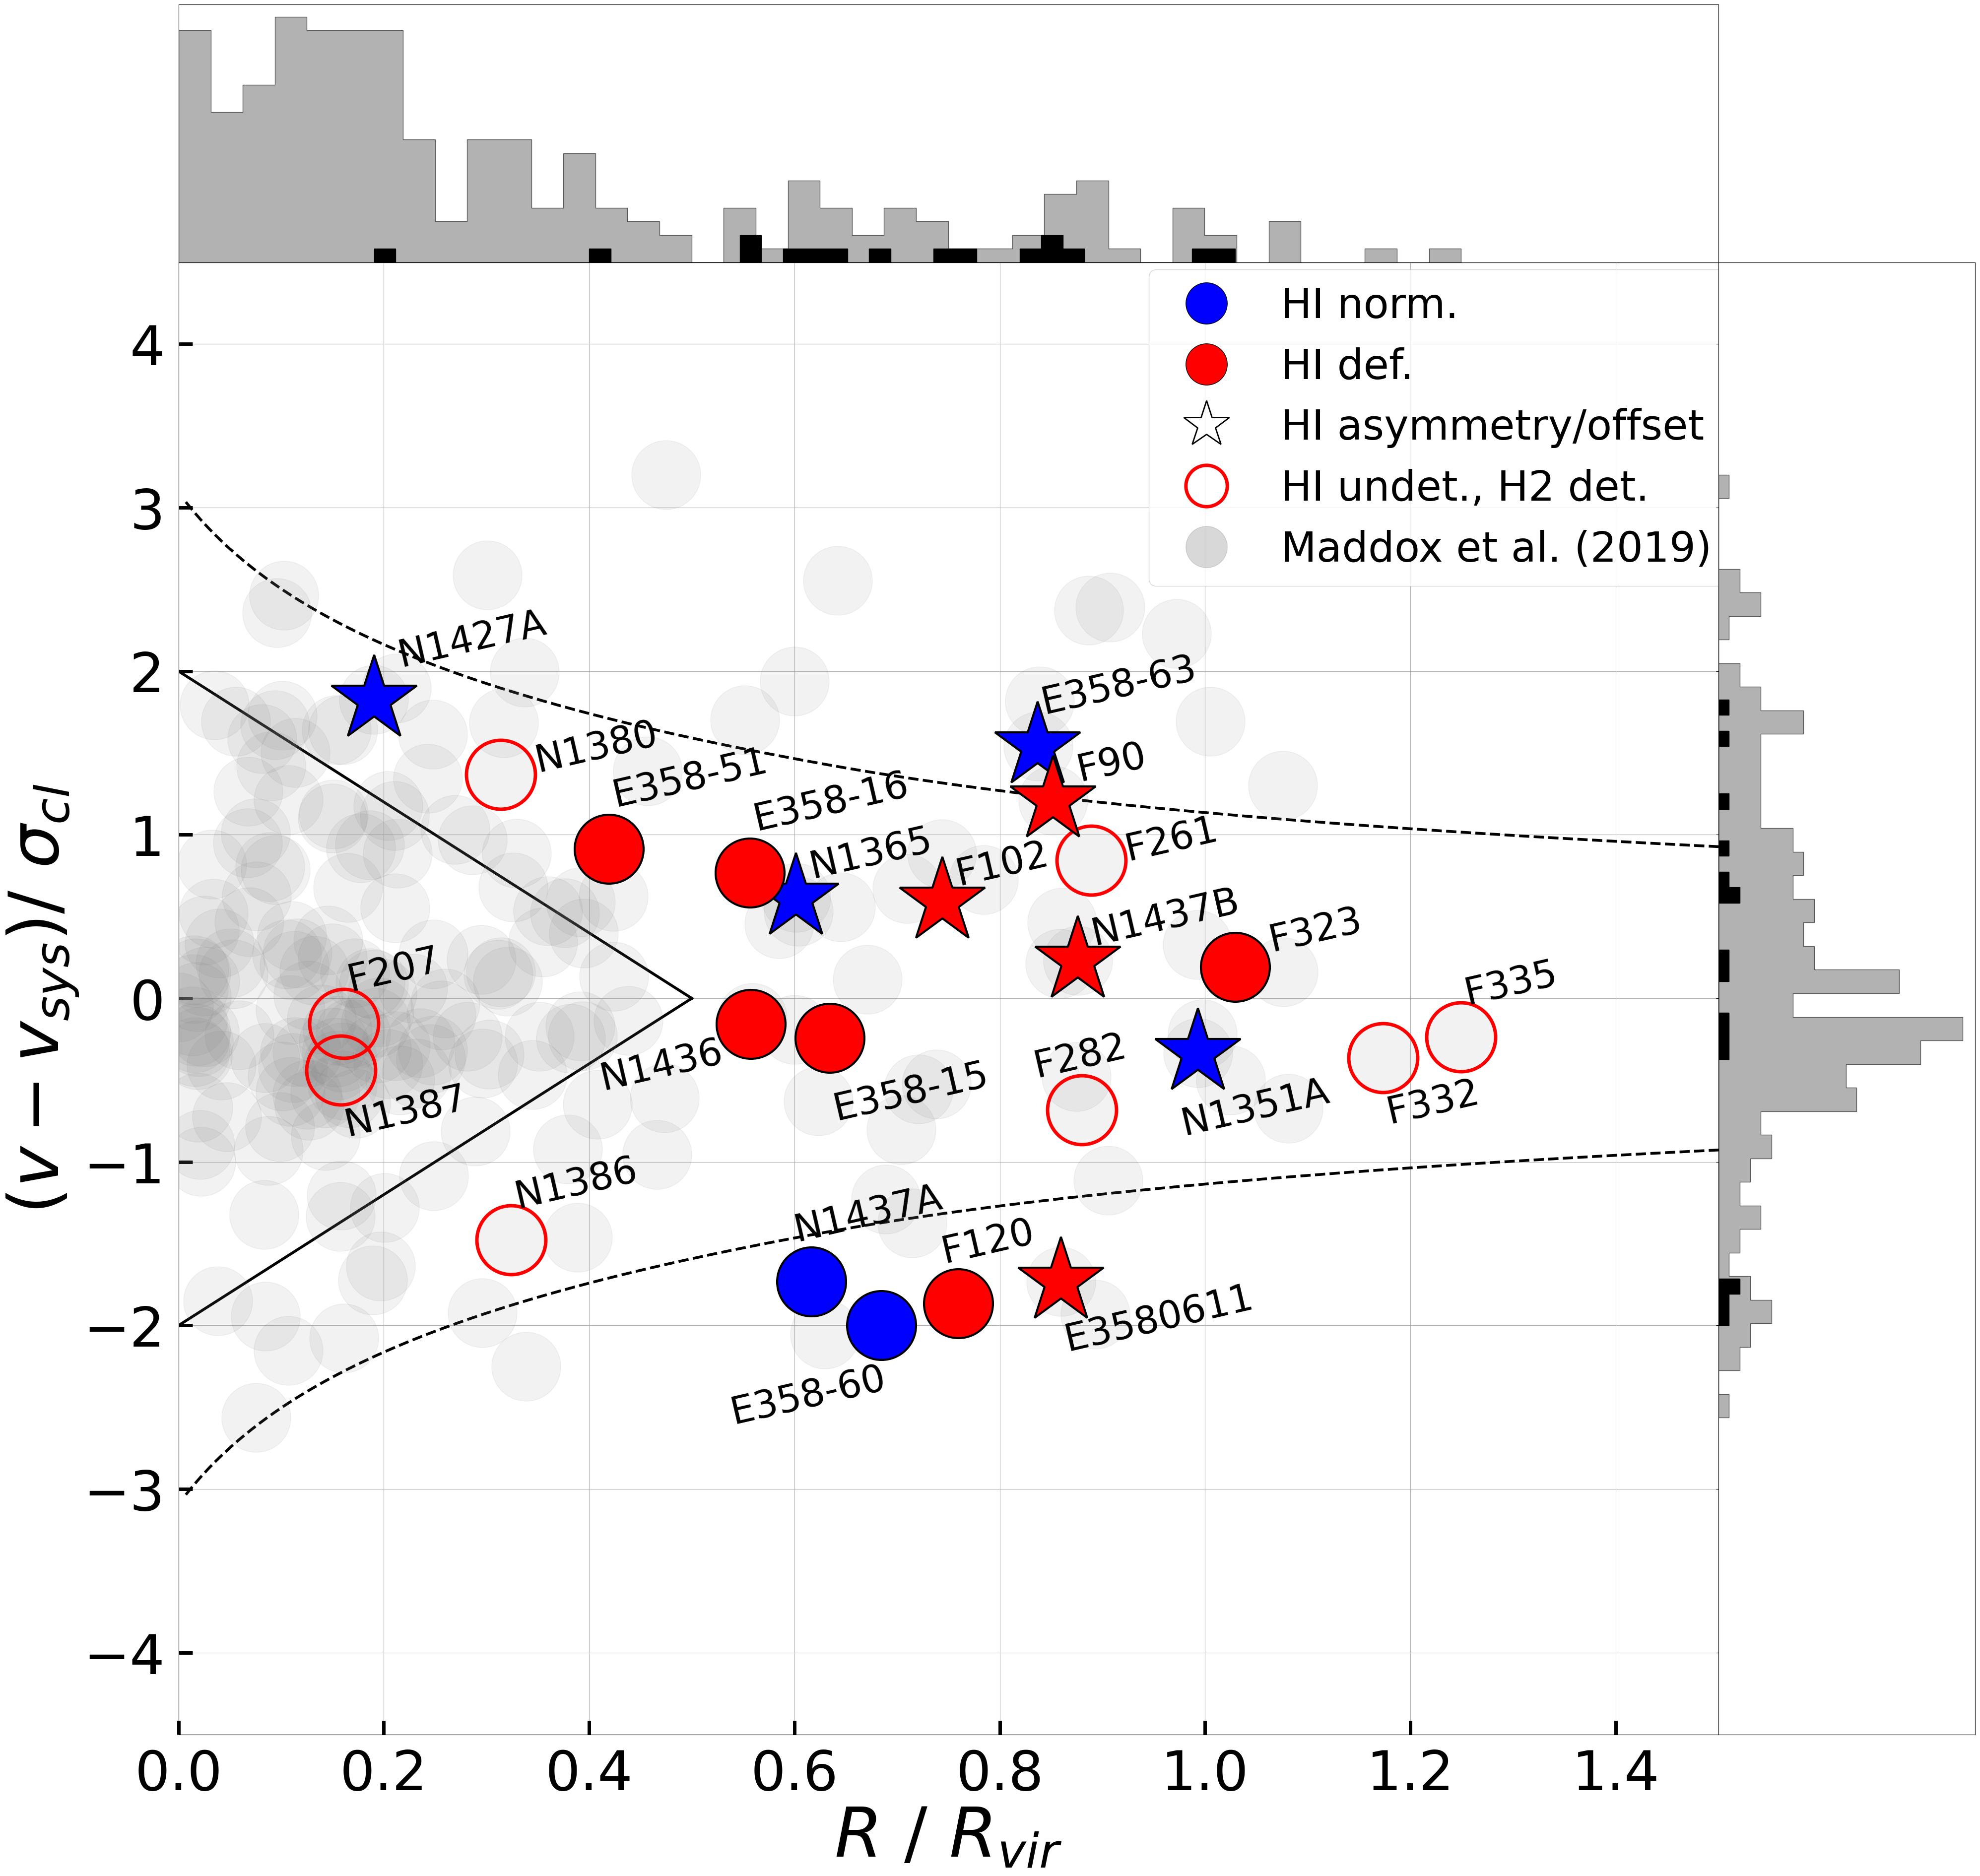
The same effect, with the addition of the kinematical information, can be seen in the projected phase-space diagram shown in Fig. 13. We used a cluster systemic velocity of = 1442 km s-1 and a cluster velocity dispersion of km s-1 (Maddox et al., 2019). In order to draw caustic curves we proceeded as in Jaffé et al. (2015) using = 51013 M⊙, = 700 kpc (Drinkwater et al., 2001a) and a cluster halo concentration parameter equal to 6 (Navarro et al. 1996; the exact value of this parameter does not change the result significantly). The inner triangle shows the virialised area where it is more likely to find old members of the Fornax cluster (Rhee et al., 2017). From the right histogram in Fig. 13, we see that the spectroscopic Fornax members have a peak at the cluster systemic velocity, while velocities of our H\scaleto1.2ex detections cover all velocity range without any preferred velocity. Thus, both Fig. 12 and Fig. 13 show that the H\scaleto1.2ex galaxy sample does not follow the distribution of spectroscopic galaxies.
In Fig. 13, we also see that 11 out of 16 galaxies are within the escape velocity boundary in projection (black lines). It is worth noting that the H\scaleto1.2ex deficient galaxies FCC 120 and ESO-LV 3580611 are located outside the caustic curves. Among H\scaleto1.2ex disturbed galaxies, six out of eight are redshifted with respect to the recessional velocity of the cluster.
Both Fig. 12 and Fig. 13 show that some galaxies in our sample are not just close by one another on the sky but also in velocity. The clearest case is that of NGC 1365 and its three neighbours: FCC 102, FCC 090 and ESO 358-G016. They are all within a region of 250 kpc and a velocity range of 200 km s-1. These galaxies might be part of a substructure which is accreting onto the cluster (as suggested by Drinkwater et al. 2001a). In addition, most galaxies in this substructure exhibit indications of ongoing interactions with one another and/or with the intergalactic medium. Both H\scaleto1.2ex elongations in FCC 102 and NGC 1365 point in projection to the north, while H\scaleto1.2ex in FCC 090 is elongated towards the south. FCC 090, FCC 102 and NGC 1365 form a triplet of galaxies which lies along a line that points towards the centre of the cluster. ESO 358-G016 has a regular H\scaleto1.2ex distribution and it lies in projection to the north of NGC 1365. All but NGC 1365 are H\scaleto1.2ex deficient galaxies. The existence of a sub-group centred on NGC 1365 is also consistent with the large scale structure around Fornax (the Fornax-Eridanus supercluster), which is mainly made by several groups of galaxies that are assembling to form the cluster along the filament (Nasonova et al., 2011).
On the east of the cluster centre, we also see that FCC 323 and NGC 1437B are near each other on the sky in projection (120 kpc apart), as well as in velocity (10 km s-1 difference). The unresolved H\scaleto1.2ex morphology of FCC 323 does not reveal, at this time, whether there is an ongoing interaction between those galaxies. We mark it as a potential subgroup.
Another intriguing galaxy is ESO 358-G060. Among the galaxies with M⊙ it is the only one with a normal H\scaleto1.2ex content compared to non-cluster galaxies (see Fig. 6), and it shows no evidence of on-going interactions with the Fornax environment (see Fig. 2). Given its position just outside the caustic curves in Fig. 13, we discuss in Sect. 4 whether it might not have entered the cluster yet. Another, similar case is NGC 1437A. It is a H\scaleto1.2ex rich galaxy which shows a quite regular H\scaleto1.2ex morphology. It is also just outside the caustic curves in Fig. 13. However, unlike the undisturbed ESO 358-G060, the optical appearance of NGC 1437A is peculiar, similar to that of NGC 1427A, since they both exhibit an arrow shaped optical morphology as pointed out in Raj et al. (2019). The MeerKAT Fornax Survey (Serra et al., 2016) will deliver a higher resolution H\scaleto1.2ex image of this object and will be able to reveal any H\scaleto1.2ex asymmetries that might be hidden by projection effects within the ATCA beam.
4 Discussion
The population of H\scaleto1.2ex detected Fornax galaxies exhibits several interesting features. Despite the limited resolution of our data, half of all detections reveal H\scaleto1.2ex asymmetries and offsets relative to the stellar body (Fig. 2). Furthermore, the H\scaleto1.2ex sample as a whole is gas-poorer and is forming stars at a lower rate than samples of noncluster galaxies in the same range (Fig. 6 and Fig. 10), and half of the galaxies with 109 M⊙ have an anomalous / ratio. Finally, the H\scaleto1.2ex detections are distributed in a noticeably different way with respect to the majority of cluster galaxies both on the sky and in projected phase space (Fig. 12 and Fig. 13). This body of evidence suggests that the Fornax environment is influencing the evolution of these galaxies, which may be the most recent arrivals in the cluster. In particular, the difference between the 3D distribution of H\scaleto1.2ex detected galaxies compared with that of spectroscopically confirmed Fornax members (Maddox et al. 2019), indicates that H\scaleto1.2ex is a crucial observable to test the volume of the cluster where H\scaleto1.2ex rich galaxies become H\scaleto1.2ex deficient, before a complete H\scaleto1.2ex removal in the inner part of the cluster.
An outstanding question is how long it takes for a galaxy to lose its H\scaleto1.2ex – the dominant component of the interstellar medium – as it falls into a cluster. In the case of Fornax we can gain some insight through a joint analysis of Fig. 11 and Fig. 13. If we assume that H\scaleto1.2ex is being actively removed from within galaxies in Fornax (as suggested by the frequently disturbed H\scaleto1.2ex morphologies - see Fig. 2), the lack of H\scaleto1.2ex detections in the virialised region of Fig. 13 implies that H\scaleto1.2ex removal happens on a time scale shorter than the cluster’s crossing time: Gyr (see Sect. 3.4; this is similar to that estimated from simulations, 1.20.5 Gyr independent of cluster mass; Rhee et al. 2017.) Hence, we expect that our 16 detections will have lost most of their H\scaleto1.2ex by the time they reach the pericentre.
On the other hand, Fig. 11 suggests that, so far, H\scaleto1.2ex has been lost slowly in our H\scaleto1.2ex detections (having been removed and/or consumed, and not replenished). In that figure, our Fornax H\scaleto1.2ex detections are distributed along the same correlation defined by non-cluster galaxies. Thus, for those Fornax galaxies, the SFR has so far had sufficient time to respond to a variation in H\scaleto1.2ex mass – just like outside clusters. Since the transition from H\scaleto1.2ex to new stars happens through the intermediate phase of H2\scaleto1.2ex0pt, this ‘equilibrium’ between H\scaleto1.2ex and SFR implies that H2\scaleto1.2ex0pt is depleted faster than H\scaleto1.2ex is lost in galaxies currently at the cluster’s outskirts, giving the entire cycle of H\scaleto1.2ex-to-H2\scaleto1.2ex0pt-to-SFR enough time to ‘see’ the varying H\scaleto1.2ex content. Thus, while for Fornax as whole Gyr (see above), for our H\scaleto1.2ex detections in the outer regions of Fornax has so far been Gyr (Bigiel et al., 2008). (The H2\scaleto1.2ex0pt depletion time is only marginally shorter in Fornax, in particular at its outskirts, and anyway with large variations from galaxy to galaxy; Zabel et al. 2020.)
It is likely that, further inside Fornax, H\scaleto1.2ex is removed faster than what we estimated above for galaxies at the cluster’s outskirts. Indeed, simulations indicate that for a galaxy within , Gyr (Marasco et al., 2016). Such a rapid H\scaleto1.2ex removal may not leave sufficient time for the SFR to ‘track’ the decrease in H\scaleto1.2ex mass in Fig. 11, resulting in galaxies moving to the left of the non-cluster sample. A confirmation of this effect may come from the eight H2\scaleto1.2ex0pt-detected galaxies (most of them H2\scaleto1.2ex0pt-deficient; Zabel et al. 2019) where H\scaleto1.2ex has already been removed at least down to the ATCA sensitivity (left-pointing arrows in Fig. 11), and possibly by some H\scaleto1.2ex detections closer to the cluster centre (e.g. NGC 1436). Indeed, these galaxies occupy a region to the left of the comparison sample, showing that their SFR is still significant despite their low H\scaleto1.2ex content. For these galaxies, H\scaleto1.2ex is likely to have been removed faster than H2\scaleto1.2ex0pt is depleted: . This conclusion is supported by the anomalously high / ratio of these galaxies in Fig. 9 (in the range where we have a reliable comparison).
Within the picture discussed above, H\scaleto1.2ex-detected galaxies in the outer regions of Fornax are thus first infallers, which are starting to interact with the Fornax environment and will lose most of their H\scaleto1.2ex by the time they reach the pericentre. Even at the current early stage of infall, they already show a relatively large diversity in H\scaleto1.2ex morphology (Fig. 2) and mass (Fig. 6). More specifically, we found two morphologically undisturbed H\scaleto1.2ex rich galaxies ( of the H\scaleto1.2ex detections); four morphologically disturbed H\scaleto1.2ex rich galaxies (25 of the H\scaleto1.2ex detections); four morphologically disturbed H\scaleto1.2ex deficient galaxies (25 of the H\scaleto1.2ex detections); six morphologically undisturbed - within the ATCA resolution - H\scaleto1.2ex deficient galaxies (38 of the H\scaleto1.2ex detections).
The morphologically undisturbed H\scaleto1.2ex-rich galaxies are ESO 358-G060 and NGC 1437A. They both reside outside the caustic curves in projection (Fig. 13) and, given their low , they should be easily perturbed by the Fornax environment. Thus, we speculate that they are recent Fornax members which have not yet had enough time to be significantly affected by the cluster. One possible caveat is the low resolution of our images, which may hide H\scaleto1.2ex disturbances in particular in the case of the optically peculiar galaxy NGC 1437A. Another possibility is that they are outside the cluster volume or in a region with lower ICM density. ESO 358-G060 is also an outlier in Fig. 11, where the relatively high / does not correspond to a high SFR. In this galaxy no SFR was detectable from WISE W3/W4 bands (after subtracting the old stellar population light), and the NUV contribution to star formation is low. Several physical processes might account for the low SFR with respect to the large H\scaleto1.2ex reservoir: for example, an inefficient H\scaleto1.2ex to H2\scaleto1.2ex0pt conversion due to a small amount of dust, a large angular momentum which prevents the H\scaleto1.2ex from collapsing, and/or an H\scaleto1.2ex external origin (e.g. see Geréb et al. 2016, 2018).
The morphologically disturbed H\scaleto1.2ex-rich galaxies are ESO 358-G063, NGC 1351A, NGC 1427A, NGC 1365. We discuss the last galaxy when we focus our attention on the H\scaleto1.2ex detected subgroup of interacting galaxies. ESO 358-G063 and NGC 1351A, are both disc galaxies north of NGC 1399. They are both quite isolated from all other Fornax Galaxies in RA, Dec and velocity in projection (see Fig. 12 and Fig. 13). Thus, their slightly H\scaleto1.2ex disturbed morphologies described in Sect.3 might be due to the interaction with the ICM of the Fornax cluster. Furthermore, the agreement of / of ESO 358-G063 and NGC 1351A with the xGASS scaling relation in Fig. 9 suggests that they are recent Fornax members, thus the cluster environment has not had enough time to significantly deplete their H\scaleto1.2ex reservoirs. The last morphologically disturbed H\scaleto1.2ex rich galaxy is NGC 1427A. This is the galaxy with the second-highest H\scaleto1.2ex mass in our sample of Fornax H\scaleto1.2ex detections. In Fig. 12 and Fig. 13, we see that NGC 1427A is the closest H\scaleto1.2ex detected galaxy to the centre of the cluster in projection, but it has also the highest velocity. Thus, it may be a new Fornax member which is infalling from the foreground. As already mentioned, Lee-Waddell et al. (2018) studied the origin of the H\scaleto1.2ex tail using the same data we present here. They concluded that, unlike previously suggestions, ram-pressure is unlikely to be the main process shaping the galaxy’s optical appearance. Instead, NGC 1427A is most likely a recent merger remnant, thus shaped by tidal forces. The recent merger might be the cause of the low molecular column density and/or its low metallicity, resulting currently undetected by ALMA (Zabel et al. 2019; it is the upper limit with the highest in Fig. 9). NGC 1427A is also the second H\scaleto1.2ex rich outlier with low SFR in Fig. 11. The H\scaleto1.2ex-to-H2\scaleto1.2ex0pt conversion might be inefficient to have a SFR consistent with its / ratio.
The only H\scaleto1.2ex deficient and morphologically disturbed galaxies which do not belong to the NGC 1365 subgroup are: ESO-LV 3580611 and NGC 1437B. They are very close to one another on the sky but have significantly different velocities. The former is outside the caustic curve in projection (Fig. 13), which supports the hypothesis of an new infalling Fornax member made by Schröder et al. (2001). The latter has a velocity similar to the recessional velocity of the cluster. H\scaleto1.2ex and molecular morphologies (the latter detected by Zabel et al. 2019) are elongated in the same direction. This suggests that both gas phases are experiencing the same environmental interaction. Raj et al., 2019 detected a tidal tail in NGC 1437B, which may be due to a recent fly-by of another galaxy. As mentioned in Sect.3.4, although the evidence is not strong, NGC 1437B might be part of a subgroup of interacting galaxies which includes FCC 323. Thus, FCC 323 might be the fly-by galaxy that NGC 1437B has interacted with.
It is difficult to comment on the morphologically undisturbed H\scaleto1.2ex deficient galaxies, since their symmetric H\scaleto1.2ex distribution may be a consequence of the ATCA resolution. However, a very peculiar case is the truncated H\scaleto1.2ex disc of NGC 1436. It is the closest spiral galaxy to the centre of the cluster detected in H\scaleto1.2ex. Raj et al. (2019) observed an ongoing morphological transition into lenticular: the spiral structure is found only in its inner region, while the outer disc has the smooth appearance typically found in S0 galaxies.
The inner part of NGC 1436 appears regular also in H2\scaleto1.2ex0pt, and the galaxy is just moderately H2\scaleto1.2ex0pt deficient (Zabel et al., 2019). It is also the only galaxy detected both in H\scaleto1.2ex and H2\scaleto1.2ex0pt which shows a high / ratio in Fig. 9. These results and the evidence of morphological distortions only in the outer part of the galaxy suggest that this galaxy may have gone through a quick interaction with the cluster environment, which did not affect the inner spiral structure yet. This idea is corroborated by the fact that NGC 1436 lies on the upper edge on the comparison sample in Fig. 11, which means that despite its H\scaleto1.2ex deficiency it is still forming stars at a significant rate.
Finally, we focus on the NGC 1365 subgroup. We discussed all the H\scaleto1.2ex morphologies and the 3D distribution of the subgroup members in Sect.3.1 and Sect.3.4, respectively. As mentioned earlier, NGC 1365 is the only H\scaleto1.2ex rich galaxy of the subgroup (Fig. 6) with a at least two orders of magnitude larger than the other members. The H\scaleto1.2ex distribution both in NGC 1365 and in FCC 102 is elongated to the north, while it is elongated to the south in FCC 090. ESO 358-G016 is the only galaxy with a regular H\scaleto1.2ex morphology. It is also the only galaxy located north of NGC 1365. We propose two scenarios in order to explain the properties of the subgroup and its members: the former is a case of interaction between galaxies and the cluster environment which is responsible of the high / ratio of the low mass members. In contrast, due to to its deep gravitational potential, NGC 1365 has been able to retain its H\scaleto1.2ex, although some of it has been perturbed. The latter scenario we propose, it is a case of preprocessing in a group of galaxies where the local environment of the subgroup was able to affect the / ratio of the low mass members before the group began to interact with the cluster environment.
In general, although we found a large variety of H\scaleto1.2ex properties in our sample of H\scaleto1.2ex detections, we detected an overall trend towards H\scaleto1.2ex disturbances and deficiency in Fornax. Fig. 6 makes evident an already evolved state of Fornax H\scaleto1.2ex galaxies where 2/3 of the galaxies are H\scaleto1.2ex deficient. Fig. 6 also shows that the Fornax environment is more effective in altering the gas content of galaxies with 3 109 M⊙) (see Sect.3.2).
Zabel et al. (2019) presented a similar study, where they compare Fornax and field galaxies based on their molecular gas properties. They found some molecular deficiency in all their detections except NGC 1365. However, galaxies with 3109 M⊙ are both more H2\scaleto1.2ex0pt-deficient and morphologically disturbed with respect to more massive galaxies, whose molecular gas morphology is always regular. We do not observe such a clear difference in H\scaleto1.2ex. Indeed, we observe disturbed H\scaleto1.2ex morphologies across our entire range, confirming that atomic hydrogen is the best tracer of early interactions. Despite this difference between H\scaleto1.2ex and H2\scaleto1.2ex0pt morphologies, we also note some similarities between our results and those in Zabel et al. (2019). Indeed, the mass range of molecular disturbed galaxies is also characterised by a stronger H\scaleto1.2ex depletion. Conversely, the H\scaleto1.2ex depletion is weaker in the mass range in which galaxies show regular molecular-gas morphologies ( 3109 M⊙; Sect.3.2). Thus, both gas phases show that the Fornax environment is more effective in altering the gas content of low-mass galaxies compared to high-mass galaxies.
Finally, our results are in agreement with the FDSF3D results (Iodice et al., 2019a, b). Indeed, almost all galaxies with a disturbed H\scaleto1.2ex morphology are of late type and belong to the group of the infalling galaxies in (Iodice et al., 2019a), which are symmetrically distributed around the cluster’s central region. These galaxies have active star formation and are located in the low-density region of the cluster, where the X-ray emission is faint or absent. Our results show that they are interacting with the cluster environment. Deeper into the cluster, the lack of H\scaleto1.2ex detections is consistent with the result that this region is dominated by evolved early-type galaxies. Some of these galaxies have been able to retain part of their H2\scaleto1.2ex0pt reservoirs (Zabel et al., 2019), but not their H\scaleto1.2ex.
5 Summary
The blind ATCA H\scaleto1.2ex survey of the Fornax galaxy cluster covers a field of 15 deg2 out to a distance of from the cluster centre. It has a spatial and velocity resolution of 67″ 95″and 6.6 km s-1, respectively, and a 3 and sensitivity of 2 1019cm-2 and 2 107M⊙, respectively. The survey revealed H\scaleto1.2ex emission from 16 Fornax galaxies covering a mass range of about three orders of magnitude, from to M⊙. These galaxies exhibit a variety of disturbances of the H\scaleto1.2ex morphology, including asymmetries, tails, offsets between H\scaleto1.2ex and optical centres and a case of a truncated H\scaleto1.2ex disc (Fig. 2). This suggests environmental interactions within or on their way to Fornax (whether with other galaxies, the large-scale potential or the intergalactic medium), supported by the offset of Fornax galaxies towards low / ratios with respect to the xGASS -/ scaling relation (Fig. 6), and resulting in H\scaleto1.2ex deficiencies similar to those observed in the Virgo cluster (Fig. 8). The H\scaleto1.2ex sample of Fornax galaxies is also forming stars at a lower rate than samples of non-cluster galaxies at fixed (Fig. 10). This deficit of SFR is consistent with the deficit of H\scaleto1.2ex when compared to non-cluster galaxies (Fig. 11).
Our 16 detections reside outside the virialised region of the cluster – where the distribution of the general population of Fornax galaxies is clustered – both on the sky and in the projected phase space diagram (Fig. 12 and Fig. 13). This result implies that H\scaleto1.2ex is lost down to the ATCA sensitivity within a crossing time ( Gyr), and that our H\scaleto1.2ex detections are recent arrivals in the cluster. They still reside at the outskirts of Fornax, where their H\scaleto1.2ex and SFR properties suggest that H\scaleto1.2ex has so far been lost on a time scale longer than the H2\scaleto1.2ex0pt depletion time ( Gyr). In the cluster’s central regions H\scaleto1.2ex removal is likely to proceed faster (). This is supported by the relatively high SFR of H\scaleto1.2ex-undetected, H2\scaleto1.2ex0pt-detected galaxies and by the anomalously high / ratios of galaxies in those regions (Fig. 9, Fig. 12 and Fig. 13). These are galaxies where SFR is likely to be proceeding relatively unperturbed after rapid removal of the H\scaleto1.2ex.
This picture is enriched by the new detection of the NGC 1365 subgroup – where both pre-processing and early interaction with the cluster environment are plausible scenarios to account for the H\scaleto1.2ex properties of its members – and by the detection of several galaxies with peculiar ISM properties, such as some H\scaleto1.2ex-rich but H2\scaleto1.2ex0pt-poor and low-SFR galaxies (NGC 1427A, ESO 358-G060). The future MeerKAT Fornax Survey (Serra et al., 2016) will observe this cluster with a better resolution and sensitivity than those of our ATCA survey, enabling a further step forward in the study of the evolution of Fornax galaxies.
Acknowledgements.
This project has received funding from the European Research Council (ERC) under the European Union’s Horizon 2020 research and innovation programme (grant agreement no. 679627; project name FORNAX). Parts of this research were supported by the Australian Research Council Centre of Excellence for All Sky Astrophysics in 3 Dimensions (ASTRO 3D), through project number CE170100013. LC is the recipient of an Australian Research Council Future Fellowship (FT180100066) funded by the Australian Government. This publication has received funding from the European Union Horizon 2020 research and innovation programme under the Marie Skłodowska-Curie grant agreement number 721463 to the SUNDIAL ITN network. NZ acknowledges support from the European Research Council (ERC) in the form of Consolidator Grant CosmicDust (ERC-2014-CoG-647939). This work made use of the Digitized Sky Surveys, which were produced at the Space Telescope Science Institute under U.S. Government grant NAG W-2166. The Australia Telescope Compact Array is part of the Australia Telescope National Facility which is funded by the Australian Government for operation as a National Facility managed by CSIRO. We acknowledge the Gomeroi people as the traditional owners of the Observatory site.| Name | FCC | RA | Dec | Flux | M⋆ | RMS | Flux | Morph. | D25(B) | Notes | |||
|---|---|---|---|---|---|---|---|---|---|---|---|---|---|
| (J2000) | (J2000) | (literature) | |||||||||||
| (hh:mm:ss.ss) | (dd:mm:ss.ss) | (108M) | (108M⊙) | () | (arcsec) | ||||||||
| ESO 358-G015 | 113 | 03:33:06.85 | -34:48:29.19 | 1365 | 1389 | 1.00.2 | 0.90.2 | 82 | 2.4 | 1.40.2∗ | Scd | 72.10 | H\scaleto1.2ex def. |
| ESO 358-G016 | 115 | 03:33:09.19 | -35:43:06.69 | 1686 | 1694 | 0.80.2 | 0.70.2 | 1.20.2 | 2.5 | 1.20.5△ | Im | 48.42 | H\scaleto1.2ex def.; N1365 s.group |
| ESO 358-G051 | 263 | 03:41:32.59 | -34:53:17.99 | 1733 | 1731 | 1.10.2 | 1.00.2 | 215 | 2.5 | 2.80.4∘ | Scd | 92.90 | H\scaleto1.2ex def. |
| ESO 358-G060 | 302 | 03:45:12.14 | -35:34:15.26 | 806 | 803 | 122 | 112 | 1.00.6 | 2.4 | 10.60.6▼ | Scd | 104.30 | |
| ESO 358-G063 | 312 | 03:46:19.00 | -34:56:36.80 | 1932 | 1940 | 184 | 173 | 11030 | 2.6 | 18.70.9▲ | Scd | 280.60 | H\scaleto1.2ex dist; |
| ESO-LV 3580611 | 306 | 03:45:45.39 | -36:20:47.50 | 891 | 894 | 1.10.2 | 1.10.2 | 1.00.4 | 2.4 | 2.70.7▽ | Im | 31.99 | H\scaleto1.2ex def.; H\scaleto1.2ex dist; |
| FCC 090 | 090 | 03:31:08.26 | -36:17:24.50 | 1827 | 1823 | 0.60.2 | 0.60.1 | 13 3 | 2.3 | # | E | 62.80 | H\scaleto1.2ex def.; H\scaleto1.2ex dist; N1365 s.group |
| FCC 102 | 102 | 03:32:10.73 | -36:13:14.91 | 1722 | 1631 | 0.50.1 | 0.50.1 | 1.60.5 | 2.5 | # | Im | 33.50 | H\scaleto1.2ex def.,H\scaleto1.2ex dist; N1365 s.group |
| FCC 120 | 120 | 03:33:34.22 | -36:36:21.29 | 849 | 846 | 0.50.1 | 0.40.1 | 1.60.5 | 2.4 | 1.90.9▽ | Im | 48.13 | H\scaleto1.2ex def. |
| FCC 207 | 207 | 03:38:19.27 | -35:07:44.69 | 1393 | # | 0.1 | 0.1 | 5 1 | 2.3 | # | E | 36.65 | H\scaleto1.2ex undet. |
| FCC 261 | 261 | 03:41:21.52 | -33:46:09.19 | 1710 | # | 0.1 | 0.1 | 3.6 0.9 | 2.3 | # | E | 39.75 | H\scaleto1.2ex undet. |
| FCC 282 | 282 | 03:42:45.31 | -33:55:13.80 | 1225 | # | 0.2 | 0.2 | 18 4 | 2.5 | # | E | 54.39 | H\scaleto1.2ex undet. |
| FCC 323 | 323 | 03:47:37.52 | -36:21:46.83 | # | 1502 | 0.080.03 | 0.080.03 | 0.6 0.6 | 2.4 | # | E | # | H\scaleto1.2ex def. |
| FCC 332 | 332 | 03:49:49.02 | -35:56:44.09 | 1326 | # | 0.1 | 0.1 | 7 2 | 2.3 | # | E | 43.90 | H\scaleto1.2ex undet. |
| FCC 335 | 335 | 03:50:36.73 | -35:54:33.59 | 1367 | # | 0.1 | 0.1 | 27 6 | 2.6 | # | E | 80.90 | H\scaleto1.2ex undet. |
| NGC 1351A | 067 | 03:28:48.72 | -35:10:41.30 | 1336 | 1337 | 51 | 51 | 358 | 3.2 | 6.10.9▲ | Sc | 161.50 | H\scaleto1.2ex dist; |
| NGC 1365 | 121 | 03:33:36.37 | -36:08:25.44 | 1638 | 1641 | 16030 | 15030 | 600100 | 2.8 | 1463▼ | Sb | 673.20 | H\scaleto1.2ex dist.; N1365 s.group |
| NGC 1380 | 167 | 03:36:27.59 | -34:58:34.41 | 1877 | # | 0.6 | 0.5 | 1400 300 | 2.6 | # | S0a | 287.20 | H\scaleto1.2ex undet. |
| NGC 1386 | 179 | 03:36:46.18 | -35:59:57.86 | 972 | # | 0.5 | 0.5 | 120 30 | 2.9 | # | Sa | 203.30 | H\scaleto1.2ex undet. |
| NGC 1387 | 184 | 03:36:57.06 | -35:30:23.90 | 1302 | # | 0.3 | 0.3 | 900 200 | 2.1 | # | E | 169.10 | H\scaleto1.2ex undet. |
| NGC 1427A | 235 | 03:40:09.30 | -35:37:27.99 | 2023 | 2026 | 224 | 214 | 235 | 2.3 | 22.50.8▼ | Im | 140.70 | H\scaleto1.2ex dist; |
| NGC 1436 | 290 | 03:43:37.08 | -35:51:10.90 | 1392 | 1414 | 0.60.2 | 0.60.2 | 16040 | 2.5 | 1.70.2⋄ | Sc | 177.10 | H\scaleto1.2ex def.; truncated H\scaleto1.2ex disc |
| NGC 1437A | 285 | 03:43:02.19 | -36:16:24.14 | 891 | 887 | 61 | 61 | 103 | 2.4 | 71▲ | Scd | 111.70 | |
| NGC 1437B | 308 | 03:45:54.85 | -36:21:25.09 | 1515 | 1501 | 2.60.5 | 2.40.5 | 50 10 | 2.5 | 3.20.6▲ | Scd | 157.80 | H\scaleto1.2ex def.; H\scaleto1.2ex dist; |
References
- Barnes et al. (2001) Barnes, D. G., Staveley-Smith, L., de Blok, W. J. G., et al. 2001, MNRAS, 322, 486
- Barnes et al. (1997) Barnes, D. G., Staveley-Smith, L., Webster, R. L., & Walsh, W. 1997, MNRAS, 288, 307
- Bigiel et al. (2008) Bigiel, F., Leroy, A., Walter, F., et al. 2008, AJ, 136, 2846
- Blakeslee et al. (2009) Blakeslee, J. P., Jordán, A., Mei, S., et al. 2009, The Astrophysical Journal, 694, 556
- Boquien et al. (2016) Boquien, M., Kennicutt, R., Calzetti, D., et al. 2016, A&A, 591, A6
- Boselli et al. (2014) Boselli, A., Cortese, L., & Boquien, M. 2014, A&A, 564, A65
- Boselli & Gavazzi (2006) Boselli, A. & Gavazzi, G. 2006, PASP, 118, 517
- Boselli & Gavazzi (2009) Boselli, A. & Gavazzi, G. 2009, A&A, 508, 201
- Bureau et al. (1996) Bureau, M., Mould, J. R., & Staveley-Smith, L. 1996, ApJ, 463, 60
- Cantiello et al. (2018) Cantiello, M., D’Abrusco, R., Spavone, M., et al. 2018, A&A, 611, A93
- Catinella et al. (2018) Catinella, B., Saintonge, A., Janowiecki, S., et al. 2018, MNRAS, 476, 875
- Cayatte et al. (1994) Cayatte, V., Kotanyi, C., Balkowski, C., & van Gorkom, J. H. 1994, AJ, 107, 1003
- Chamaraux et al. (1980) Chamaraux, P., Balkowski, C., & Gerard, E. 1980, A&A, 83, 38
- Chung et al. (2009) Chung, A., van Gorkom, J. H., Kenney, J. D. P., Crowl, H., & Vollmer, B. 2009, AJ, 138, 1741
- Cluver et al. (2017) Cluver, M. E., Jarrett, T. H., Dale, D. A., et al. 2017, ApJ, 850, 68
- Cluver et al. (2014a) Cluver, M. E., Jarrett, T. H., Hopkins, A. M., et al. 2014a, ApJ, 782, 90
- Cluver et al. (2014b) Cluver, M. E., Jarrett, T. H., Hopkins, A. M., et al. 2014b, ApJ, 782, 90
- Condon et al. (1998) Condon, J. J., Cotton, W. D., Greisen, E. W., et al. 1998, AJ, 115, 1693
- Cortese et al. (2016) Cortese, L., Bekki, K., Boselli, A., et al. 2016, MNRAS, 459, 3574
- Cortese et al. (2011) Cortese, L., Catinella, B., Boissier, S., Boselli, A., & Heinis, S. 2011, MNRAS, 415, 1797
- Courtois et al. (2009) Courtois, H. M., Tully, R. B., Fisher, J. R., et al. 2009, AJ, 138, 1938
- Davies & Lewis (1973) Davies, R. D. & Lewis, B. M. 1973, MNRAS, 165, 231
- de Vaucouleurs et al. (1991) de Vaucouleurs, G., de Vaucouleurs, A., Corwin, Herold G., J., et al. 1991, Third Reference Catalogue of Bright Galaxies
- Dey et al. (2019) Dey, A., Schlegel, D. J., Lang, D., et al. 2019, AJ, 157, 168
- Diaferio et al. (2001) Diaferio, A., Kauffmann, G., Balogh, M. L., et al. 2001, MNRAS, 323, 999
- Dressler (1980) Dressler, A. 1980, ApJ, 236, 351
- Dressler (1986) Dressler, A. 1986, ApJ, 301, 35
- Drinkwater et al. (2001a) Drinkwater, M. J., Gregg, M. D., & Colless, M. 2001a, ApJ, 548, L139
- Drinkwater et al. (2001b) Drinkwater, M. J., Gregg, M. D., Holman, B. A., & Brown, M. J. I. 2001b, MNRAS, 326, 1076
- Ferguson (1989) Ferguson, H. C. 1989, AJ, 98, 367
- Frank et al. (2013) Frank, K. A., Peterson, J. R., Andersson, K., Fabian, A. C., & Sanders, J. S. 2013, ApJ, 764, 46
- Gavazzi et al. (1999) Gavazzi, G., Boselli, A., Scodeggio, M., Pierini, D., & Belsole, E. 1999, MNRAS, 304, 595
- Geréb et al. (2016) Geréb, K., Catinella, B., Cortese, L., et al. 2016, MNRAS, 462, 382
- Geréb et al. (2018) Geréb, K., Janowiecki, S., Catinella, B., Cortese, L., & Kilborn, V. 2018, MNRAS, 476, 896
- Giovanelli & Haynes (1983) Giovanelli, R. & Haynes, M. P. 1983, AJ, 88, 881
- Grillmair et al. (1994) Grillmair, C. J., Freeman, K. C., Bicknell, G. V., et al. 1994, ApJ, 422, L9
- Gunn & Gott (1972) Gunn, J. E. & Gott, J. Richard, I. 1972, ApJ, 176, 1
- Hamraz et al. (2019) Hamraz, E., Peletier, R. F., Khosroshahi, H. G., et al. 2019, A&A, 625, A94
- Haynes & Giovanelli (1984) Haynes, M. P. & Giovanelli, R. 1984, AJ, 89, 758
- Haynes & Giovanelli (1986) Haynes, M. P. & Giovanelli, R. 1986, ApJ, 306, 466
- Horellou et al. (2001) Horellou, C., Black, J. H., van Gorkom, J. H., et al. 2001, A&A, 376, 837
- Hubble & Humason (1931) Hubble, E. & Humason, M. L. 1931, ApJ, 74, 43
- Hughes & Cortese (2009) Hughes, T. M. & Cortese, L. 2009, MNRAS, 396, L41
- Iodice et al. (2016) Iodice, E., Capaccioli, M., Grado, A., et al. 2016, ApJ, 820, 42
- Iodice et al. (2019a) Iodice, E., Sarzi, M., Bittner, A., et al. 2019a, A&A, 627, A136
- Iodice et al. (2017) Iodice, E., Spavone, M., Capaccioli, M., et al. 2017, ApJ, 839, 21
- Iodice et al. (2019b) Iodice, E., Spavone, M., Capaccioli, M., et al. 2019b, A&A, 623, A1
- Jaffé et al. (2015) Jaffé, Y. L., Smith, R., Candlish, G. N., et al. 2015, MNRAS, 448, 1715
- Jarrett et al. (2019) Jarrett, T. H., Cluver, M. E., Brown, M. J. I., et al. 2019, ApJS, 245, 25
- Jarrett et al. (2013) Jarrett, T. H., Masci, F., Tsai, C. W., et al. 2013, AJ, 145, 6
- Jones et al. (2018) Jones, M. G., Espada, D., Verdes-Montenegro, L., et al. 2018, A&A, 609, A17
- Jordán et al. (2007) Jordán, A., Blakeslee, J. P., Côté, P., et al. 2007, ApJS, 169, 213
- Jorsater & van Moorsel (1995) Jorsater, S. & van Moorsel, G. A. 1995, AJ, 110, 2037
- Kennicutt & Evans (2012) Kennicutt, R. C. & Evans, N. J. 2012, ARA&A, 50, 531
- Koribalski et al. (2004) Koribalski, B. S., Staveley-Smith, L., Kilborn, V. A., et al. 2004, AJ, 128, 16
- Kreckel et al. (2012) Kreckel, K., Platen, E., Aragón-Calvo, M. A., et al. 2012, AJ, 144, 16
- Lauberts & Valentijn (1989) Lauberts, A. & Valentijn, E. A. 1989, The surface photometry catalogue of the ESO-Uppsala galaxies
- Lee-Waddell et al. (2018) Lee-Waddell, K., Serra, P., Koribalski, B., et al. 2018, MNRAS, 474, 1108
- Leroy et al. (2019) Leroy, A. K., Sandstrom, K. M., Lang, D., et al. 2019, ApJS, 244, 24
- Lupton (2005) Lupton, P. 2005
- Maddox et al. (2015) Maddox, N., Hess, K. M., Obreschkow, D., Jarvis, M. J., & Blyth, S. L. 2015, MNRAS, 447, 1610
- Maddox et al. (2019) Maddox, N., Serra, P., Venhola, A., et al. 2019, MNRAS, 490, 1666
- Marasco et al. (2016) Marasco, A., Crain, R. A., Schaye, J., et al. 2016, MNRAS, 461, 2630
- Matthews et al. (1998) Matthews, L. D., van Driel, W., & Gallagher, J. S., I. 1998, AJ, 116, 1169
- Meyer et al. (2017) Meyer, M., Robotham, A., Obreschkow, D., et al. 2017, PASA, 34, 52
- Mould et al. (2000) Mould, J. R., Hughes, S. M. G., Stetson, P. B., et al. 2000, ApJ, 528, 655
- Nasonova et al. (2011) Nasonova, O. G., de Freitas Pacheco, J. A., & Karachentsev, I. D. 2011, A&A, 532, A104
- Navarro et al. (1996) Navarro, J. F., Frenk, C. S., & White, S. D. M. 1996, ApJ, 462, 563
- Oemler (1974) Oemler, Augustus, J. 1974, ApJ, 194, 1
- Oh et al. (2018) Oh, S., Kim, K., Lee, J. H., et al. 2018, ApJS, 237, 14
- Ondrechen & van der Hulst (1989) Ondrechen, M. P. & van der Hulst, J. M. 1989, ApJ, 342, 29
- Paolillo et al. (2002) Paolillo, M., Fabbiano, G., Peres, G., & Kim, D. W. 2002, ApJ, 565, 883
- Peletier et al. (2020) Peletier, R., Iodice, E., Venhola, A., et al. 2020, arXiv e-prints, arXiv:2008.12633
- Raj et al. (2019) Raj, M. A., Iodice, E., Napolitano, N. R., et al. 2019, A&A, 628, A4
- Rhee et al. (2017) Rhee, J., Smith, R., Choi, H., et al. 2017, ApJ, 843, 128
- Rodr´ıguez-Ardila et al. (2017) Rodríguez-Ardila, A., Prieto, M. A., Mazzalay, X., et al. 2017, MNRAS, 470, 2845
- Sault et al. (1995) Sault, R. J., Teuben, P. J., & Wright, M. C. H. 1995, Astronomical Society of the Pacific Conference Series, Vol. 77, A Retrospective View of MIRIAD, ed. R. A. Shaw, H. E. Payne, & J. J. E. Hayes, 433
- Schröder et al. (2001) Schröder, A., Drinkwater, M. J., & Richter, O. G. 2001, A&A, 376, 98
- Schweizer (1980) Schweizer, F. 1980, ApJ, 237, 303
- Seibert et al. (2012) Seibert, M., Wyder, T., Neill, J., et al. 2012, in American Astronomical Society Meeting Abstracts, Vol. 219, American Astronomical Society Meeting Abstracts #219, 340.01
- Serra et al. (2016) Serra, P., de Blok, W. J. G., Bryan, G. L., et al. 2016, in MeerKAT Science: On the Pathway to the SKA, 8
- Serra et al. (2012) Serra, P., Jurek, R., & Flöer, L. 2012, PASA, 29, 296
- Serra et al. (2019) Serra, P., Maccagni, F. M., Kleiner, D., et al. 2019, A&A, 628, A122
- Serra et al. (2015) Serra, P., Westmeier, T., Giese, N., et al. 2015, MNRAS, 448, 1922
- Sheardown et al. (2018) Sheardown, A., Roediger, E., Su, Y., et al. 2018, ApJ, 865, 118
- Sheen et al. (2012) Sheen, Y.-K., Yi, S. K., Ree, C. H., & Lee, J. 2012, ApJS, 202, 8
- Solanes et al. (1996) Solanes, J. M., Giovanelli, R., & Haynes, M. P. 1996, ApJ, 461, 609
- Solanes et al. (2001) Solanes, J. M., Manrique, A., García-Gómez, C., et al. 2001, ApJ, 548, 97
- Spavone et al. (2020) Spavone, M., Iodice, E., van de Ven, G., et al. 2020, A&A, 639, A14
- Spiniello et al. (2018) Spiniello, C., Napolitano, N. R., Arnaboldi, M., et al. 2018, MNRAS, 477, 1880
- Su et al. (2021) Su, A. H., Salo, H., Janz, J., et al. 2021, arXiv e-prints, arXiv:2101.05699
- Theureau et al. (1998) Theureau, G., Bottinelli, L., Coudreau-Durand, N., et al. 1998, A&AS, 130, 333
- Toomre & Toomre (1972) Toomre, A. & Toomre, J. 1972, ApJ, 178, 623
- van der Hulst et al. (1983) van der Hulst, J. M., Ondrechen, M. P., van Gorkom, J. H., & Hummel, E. 1983, in IAU Symposium, Vol. 100, Internal Kinematics and Dynamics of Galaxies, ed. E. Athanassoula, 233–234
- Venhola et al. (2018) Venhola, A., Peletier, R., Laurikainen, E., et al. 2018, A&A, 620, A165
- Venhola et al. (2019) Venhola, A., Peletier, R., Laurikainen, E., et al. 2019, A&A, 625, A143
- Wang et al. (2016) Wang, J., Koribalski, B. S., Serra, P., et al. 2016, MNRAS, 460, 2143
- Waugh (2005) Waugh, M. 2005, PhD thesis, University of Melbourne.
- Waugh et al. (2002) Waugh, M., Drinkwater, M. J., Webster, R. L., et al. 2002, MNRAS, 337, 641
- Whitaker et al. (2012) Whitaker, K. E., van Dokkum, P. G., Brammer, G., & Franx, M. 2012, ApJ, 754, L29
- Zabel et al. (2020) Zabel, N., Davis, T. A., Sarzi, M., et al. 2020, MNRAS
- Zabel et al. (2019) Zabel, N., Davis, T. A., Smith, M. W. L., et al. 2019, MNRAS, 483, 2251
Appendix A
In this section, we describe in detail each galaxy of our sample. Whenever possible we compare the information estimated from our H\scaleto1.2ex data with observations at other wavelengths. The galaxies are sorted according to increasing H\scaleto1.2ex mass as in Table 1, Fig. 2 and Fig. 3.
FCC 323
According to Ferguson (1989), FCC 323 is a dE2/ImV. This is the faintest among our H\scaleto1.2ex detections and, for the first time, we detected it in H\scaleto1.2ex and thus measured its recessional velocity of 1502 km s-1. FCC 323 has a = (7.63.9)106 M⊙ and a = (6.35.8)107 M⊙. The Fornax environment might have strongly affected the H\scaleto1.2ex reservoir of FCC 323. It has the highest / offset from the (extrapolated) xGASS scaling relation in Fig. 6. Its closest galaxy both on the sky and velocity is NGC 1437B (120 kpc and 12 km s-1 away), leading us to think that FCC 323 and NGC 1437B might be part of a subgroup or a pair of galaxies.
FCC 120
FCC 120 is classified as ImIV by Ferguson (1989). The H\scaleto1.2ex emission associated with the galaxy seems to be quite regular. The ATCA spectrum in Fig. 3 shows one peak (within the uncertainties), which is different from the 100 - km s-1 - wide double horn spectrum detected by Schröder et al. (2001) based on Parkes data. Even if the latter data shows strong RFI at a velocity of 1250 km s-1, this RFI does not affect the detection of the galaxy. However, from Maddox et al. (2019), agrees with our . Deeper H\scaleto1.2ex data (Serra et al. 2016) may confirm this. FCC 120 has a = (4.51.5)107 M⊙ and a = (1.60.5)108 M⊙.
FCC 102
FCC 102 is an irregular ImIV classified by Ferguson (1989). We detect H\scaleto1.2ex emission associated with FCC 102 for the first time. Although the H\scaleto1.2ex morphology is not resolved, the H\scaleto1.2ex is offset towards the north with respect to the optical centre. The difference between from Maddox et al. (2019), and from ATCA data is almost 100 km s-1. However, those values are still consistent due to the large uncertainty on , which was measured from absorption lines for this galaxy (Natasha Maddox, priv. comm.). Recently this galaxy was detected during MeerKAT test observations in preparation for the MeerKAT Fornax Survey Serra et al. (2016), confirming our ATCA H\scaleto1.2ex results. FCC 102 has a = (4.61.6)107 M⊙ and a = (1.60.5)108 M⊙. The comparison with H\scaleto1.2ex belonging to non-cluster galaxies with similar in Fig. 6 shows that FCC 102 is H\scaleto1.2ex deficient.
NGC 1436
NGC 1436 is the closest H\scaleto1.2ex detected spiral to the centre of the cluster (see Fig 12 and Fig. 13). Ferguson (1989) classify this galaxy as ScII. The H\scaleto1.2ex emission associated with NGC 1436 is confined well within the stellar body suggesting a truncated H\scaleto1.2ex disc. However, Fig. 3 shows that the ATCA spectrum compared with that based on GBT data (Courtois et al. 2009) misses flux from the blushifted part of the disc. This discrepancy might be due to a faint H\scaleto1.2ex emission of NGC 1436 which extends over a region smaller than the ATCA beam in at least some of the blue-shifted channels. This would cause the average HI column density within the beam to fall below the sensitivity limit, resulting in a loss of H\scaleto1.2ex flux in our data. The H\scaleto1.2ex spectrum of NGC 1436 spectrum from Schröder et al. (2001) is more similar to that obtained with the GBT than to ours. The estimated by the ATCA flux is (5.82.5)107 M⊙, while the of the galaxy is (1.60.4)1010 M⊙. Whether adopting the ATCA or the GBT H\scaleto1.2ex flux measurement, NGC 1436 would still be an H\scaleto1.2ex deficient galaxy (see Sect.3.2). Similarly, it would still be the (H\scaleto1.2ex and H2\scaleto1.2ex0pt) detection with the largest / ratio in Fig. 9.
The high offset from the scaling relation in Fig. 9, the truncated H\scaleto1.2ex disc in Fig. 2 and the molecular spiral structure detected by Zabel et al. (2019) show that NGC 1436 may have gone through a quick interaction with the cluster environment, which did not affect the inner spiral structure yet.
Furthermore, Raj et al. (2019) found that NGC 1436 appears to be transforming into a S0 in its morphological evolution. They found spiral arms only in the central region whereas its outer disc resembles the smooth structure typically found in the discs of S0 galaxies. The truncated H\scaleto1.2ex disc agrees with the observation of a passively-evolving outer optical disc, which is being shaped by the Fornax environment.
FCC 090
FCC 090 is classified as a peculiar elliptical galaxy by Ferguson (1989). We detected H\scaleto1.2ex emission in FCC 090 for the first time. The H\scaleto1.2ex morphology of FCC 090 is elongated towards the south. FCC 090 has a = (5.92.1)107 M⊙ and a = (1.30.3)109 M⊙. Its / ratio makes it a H\scaleto1.2ex deficient galaxy, which lies on the edge of comparison sample of non-cluster galaxies (Fig. 6).
FCC 090 is part of the NGC 1365 infalling subgroup. Within the subgroup, the H\scaleto1.2ex morphology of FCC 090 is the only one which is extended towards the south; it is the farther galaxy from NGC 1365; it has the highest velocity in phase space. FCC 090 is also the westernmost galaxy in the triplet of the aligned H\scaleto1.2ex disturbed galaxies. Besides FCC 090, this triplet includes FCC 102 and NGC 1365.
The H\scaleto1.2ex and molecular distributions (Zabel et al. 2019) are difficult to compare due to the different resolutions between ATCA and ALMA. The molecular distribution extends beyond the stellar body showing a tail that points to the west in projection but it is still within our H\scaleto1.2ex detection that does not show any peculiarity in that direction. Our knowledge on H\scaleto1.2ex in FCC 090 as well as its belonging to the NGC 1365 subgroup, corroborates the idea of an infalling galaxy which is loosing the external gas envelope.
In the sample of dwarf galaxies studied by Hamraz et al. (2019) FCC 090 is one out of two outliers in the Fornax cluster with a very blue inner part. Recently, Zabel et al. (2020) showed that depletion time is shorter than usual (0.5 Gyr rather than 2 Gyr) which may be a consequence of the environmental interactions taking place in it.
ESO 358-G016
ESO 358-G016 is classified as Sdm (edge-on) by Ferguson (1989). It has a = (7.42.5)107 M⊙ and a = (1.20.7)108 M⊙. ESO 358-G016 is the only member of the NGC 1365 infalling subgroup with a regular H\scaleto1.2ex morphology. Like all the low mass members of the subgroup, it is a H\scaleto1.2ex deficient galaxy. It is also the second closest galaxy to NGC 1365 both on the sky and in phase space. Raj et al. 2019 suggested that ESO 358-G016 might have experienced disruptions of the outer disc due to the gravitational potential of the cluster. If that is the case, some H\scaleto1.2ex survived in this process.
ESO 358-G015
ESO 358-G015 is classified as a peculiar Scd-III by Ferguson (1989). It has a regular H\scaleto1.2ex morphology, with a systemic velocity close to the recessional velocity of the cluster. It has a = (9.32.8)107 M⊙ and a = (7.62.1)108 M⊙. Fig. 6 shows that ESO 358-G015 is a H\scaleto1.2ex deficient galaxy. Furthermore, it is one of the four H\scaleto1.2ex detected galaxies that are north of NGC 1399. Raj et al. (2019) identified a lopsided tail pointing to the centre of the cluster. They also suggested ESO 358-G015 to be a galaxy that is being pulled into the cluster centre, in the southern direction. The quite regular H\scaleto1.2ex morphology does not provide clear support to this hypothesis.
ESO 358-G051
ESO 358-G051 is classified as SBcd-III by Ferguson (1989). The H\scaleto1.2ex distribution is regular and peaks on the optical centre. It is located north of NGC 1399 and it is the closest H\scaleto1.2ex deficient galaxy from it (0.4 ). In general, among all our H\scaleto1.2ex detections, only NGC 1427A is closer to NGC 1399. ESO 358-G051 has a = (1.00.3)108 M⊙ and a = (2.10.5)109 M⊙. Fig. 6 shows that ESO 358-G051 is a H\scaleto1.2ex deficient galaxy.
Raj et al. (2019) marked this galaxy as a recent infaller with strong central H emission powered by star formation. Iodice et al. (2019a) observed an ionised gas distribution extended towards the north. This is the opposite direction with respect to the H2\scaleto1.2ex0pt elongation detected by Zabel et al. (2019). However, the H\scaleto1.2ex distribution does not seem to be disturbed, perhaps due to the ATCA resolution. Although ESO 358-G051 is a H\scaleto1.2ex deficient galaxy, the unresolved H\scaleto1.2ex morphology does not provide information about on going interaction with the Fornax environment.
ESO-LV 3580611
ESO-LV 3580611 is classified as SBm-III by Ferguson (1989). The H\scaleto1.2ex morphology shows a lopsided H\scaleto1.2ex distribution in the northern part of the system. However, optical and H\scaleto1.2ex distribution share the same centre. It has a = (1.10.3)108 M⊙ and a = (1.00.4)108 M⊙. ESO-LV 3580611 is also one of the two H\scaleto1.2ex deficient galaxies in our sample that is outside the caustic curves (Fig. 13). Schröder et al. (2001), based on the high deviation of ESO-LV 3580611 from the Tully-Fisher relation, suggested that this galaxy is falling into the cluster from the background.
According to Raj et al. (2019), ESO-LV 3580611 may have experienced disruptions in the outskirts of the disc due to gravitational potential well of the cluster. Thus, similarly to ESO 358-G016, H\scaleto1.2ex has survived during the infall.
NGC 1437B
NGC 1437B is classified as Sd (edge-on) by Ferguson (1989). The H\scaleto1.2ex distribution shows an elongation to the south, while the H\scaleto1.2ex peak corresponds to the optical centroid (Fig. 2).
This galaxy is located on the south east of the cluster, close to FCC 323 both on the sky and in velocity (see Fig. 12 and Fig. 13). Given the small separation of only 120 kpc with a difference of 10 km s-1 in velocity, they might be part of an interacting subgroup of galaxies. NGC 1437B has a = (2.40.6)108 M⊙ and a = (5.000.01)109 M⊙ and it is a H\scaleto1.2ex rich galaxy.
Fig. 9 shows that the Fornax environment has not strongly affected the / ratio yet. On the other hand, contrary to the case of NGC 1436, the two gas phases are probably experiencing the same environmental effect. Indeed, although the scales are different, we found consistency between the southern H\scaleto1.2ex elongation of NGC 1437B and the elongation of the molecular morphology detected by Zabel et al. (2019). Thus, the agreement between its / ratio and the xGASS scaling relation might be due to a slower evolution with respect to that taking place in NGC 1436.
Raj et al. (2019) did not observed any hint of optical morphological transition from the late-type spiral structure, which supports the hypothesis of a recent infaller. However, they found an optical disturbance in form of tidal tail, which points to the south in projection and might be due to a recent fly-by of another galaxy in the cluster. The H\scaleto1.2ex morphology agrees with the optical detected tail. If FCC 323 and NGC 1437B belong to the same subgroup, the former may be the fly-by galaxy that NGC 1437B has interacted with.
NGC 1351A
Classified as Sc (edge-on) by Ferguson (1989). The H\scaleto1.2ex distribution shows a projected elongation towards the south. It has a velocity similar to the recessional of the cluster (Fig. 13). NGC 1351A has a = (4.71.2)108 M⊙ and a = (3.50.8)109 M⊙. The H\scaleto1.2ex reservoir is similar to that of non-cluster galaxies with the same (Fig. 6). NGC 1351A is isolated both on the sky and in projected phase space (Fig. 12 and Fig. 13). Thus, the H\scaleto1.2ex asymmetry might be due to the interaction with ICM. Zabel et al. (2019) detected a slightly more diffuse east side in the H2\scaleto1.2ex0pt distribution.
NGC 1437A
NGC 1437A is classified as SdIII by Ferguson (1989). The H\scaleto1.2ex morphology is quite regular and its H\scaleto1.2ex content is comparable with that of non-cluster galaxies with the same (see Fig.s 2 and 6). NGC 1437A has a = (5.61.3)108 M⊙ and a = (1.00.2)109 M⊙. Although the optical appearance of NGC 1437A is not regular and the location of its star forming regions suggests that the galaxy is travelling in a south-east direction (Raj et al. 2019), the H\scaleto1.2ex distribution does not show any strong asymmetries. Thus, ram-pressure and tidal interaction might not be the cause of the asymmetric star forming regions. However, the poor resolution of the H\scaleto1.2ex image may hide H\scaleto1.2ex asymmetries in projection.
ESO 358-G060
ESO 358-G060 is a low mass galaxy classified as Sdm (edge-on) by Ferguson (1989). The H\scaleto1.2ex morphology is regular. ESO 358-G060 has a = (1.10.2)109 M⊙ and a = (1.00.6)108 M⊙. Fig. 6 shows that ESO 358-G060 has a H\scaleto1.2ex reservoir comparable with that of non-cluster galaxies with the same . As discussed in Sect.3.2, we pointed out that the Fornax cluster environment is more effective in altering the gas content for galaxies with 3109 M⊙. This supports the idea that ESO 358-G060 is a likely new Fornax member which has not been affected by the cluster environment yet. Raj et al. (2019) observed irregular star-forming regions making the hypothesis of a disruptions due to the gravitational potential well of the cluster centre, during the fall. However, since the H\scaleto1.2ex distribution is not perturbed yet by environmental interactions, internal feedback might be the cause of the irregular star forming regions. Furthermore no H2\scaleto1.2ex0pt was detected by Zabel et al. (2019) and it is a dust poor galaxy as discussed in Sect.4. Overall, this galaxy is forming star with lower rate than that predicted for galaxies with similar / (Fig. 11).
ESO 358-G063
Classified as Scd (edge-on) by Ferguson (1989). The atomic hydrogen distribution is more extended to the south-east part of the system. On this side, H\scaleto1.2ex contours are more spaced with respect to the opposite side of the disc where H\scaleto1.2ex emission seems to be confined within the stellar body. ESO 358-G063 has a = (1.70.4)109 M⊙ and a = (1.10.2)1010 M⊙. Despite the asymmetries in the H\scaleto1.2ex distribution, ESO 358G-063 is not H\scaleto1.2ex deficient, and the molecular gas detected by Zabel et al. (2019) has a regular morphology. Thus, the galaxy has just started to interact with the cluster environment. The idea is supported by its position in projected phase space (Fig. 13) where the galaxy is just outside the caustic curves. Raj et al. (2019) found irregular star-forming regions in the ill-defined spiral arms of ESO 358-G063, which may be signs of minor mergers.
NGC 1427A
NGC 1427A is classified as Im-III by Ferguson (1989). The H\scaleto1.2ex morphology shows a very long tail pointing to the south-east in projection (opposite direction to the centre of the cluster - we refer the reader to Lee-Waddell et al. (2018) for a detailed study about the origin of the tail). NGC 1427A has a = (2.10.4)109 M⊙ and a = (2.30.5)109 M⊙. This is the second most massive H\scaleto1.2ex galaxy of our sample, which has an H\scaleto1.2ex content comparable to that of non-cluster (see Fig. 6). NGC 1427A is the closest H\scaleto1.2ex detection to the centre of the cluster (0.2 ). Due to its high velocity (see Fig. 13) it is not clear whether NGC 1427A is already virialised in the cluster or not. If it is virialised, it may decrease its velocity while reaching its apocentre. It is the only / upper limit with 109 M⊙ in Fig. 9. Despite the large H\scaleto1.2ex reservoir no H2\scaleto1.2ex0pt was detected by Zabel et al. (2019). This may be due to a recent merger which involved the NGC 1427A progenitors that might have lowered its metallicity. The H\scaleto1.2ex-to-H2\scaleto1.2ex0pt conversion might be inefficient to have a SFR consistent with its / ratio (Fig. 11).
NGC 1365
NGC 1365, the large barred spiral galaxy (SBbc(s)I by Ferguson 1989), is the most massive galaxy in our sample. The optical morphology shows a well defined spiral structure, three northern arms and two more compressed southern ones. The H\scaleto1.2ex morphology (Fig. 2) shows a very prominent extension to the north of the system and more dense contours corresponding to the two compressed optical arms. A very detailed study on the structure of NGC 1365 is made by Jorsater & van Moorsel (1995). They also suggested that the motion of the galaxy through the ICM can account for its unwinding arms.
NGC 1365 has a = (1.50.3)1010 M⊙ and a = (6.21.3)1010 M⊙. Fig. 6 shows that NGC 1365 is the only galaxy in our sample which is at the upper edge of the comparison sample of non-cluster galaxies due to its high /. Besides evidence of environmental interactions from its morphology, the strong gravitational potential appears to have been able to hold a sufficient amount of H\scaleto1.2ex to make it comparable with the general behaviour of local galaxies (see also Fig. 9).
NGC 1365 is the main member of the detected infalling subgroup of galaxies located to the south-west of the cluster. It is also the only galaxy in the subgroup with a normal H\scaleto1.2ex content. The existence of the NGC 1365 subgroup is also supported by Drinkwater et al. (2001a) which found NGC 1365 to be part of a substructure.
Appendix B