A comparative evolutionary study of transcription networks.
Abstract
We present a comparative analysis of large-scale topological and evolutionary properties of transcription networks in three species, the two distant bacteria E. coli and B. subtilis, and the yeast S. cerevisiae. The study focuses on the global aspects of feedback and hierarchy in transcriptional regulatory pathways. While confirming that gene duplication has a significant impact on the shaping of all the analyzed transcription networks, our results point to distinct trends between the bacteria, where time constraints in the transcription of downstream genes might be important in shaping the hierarchical structure of the network, and yeast, which seems able to sustain a higher wiring complexity, that includes the more feedback, intricate hierarchy, and the combinatorial use of heterodimers made of duplicate transcription factors.
I Introduction
Cells need constant sensing of environmental changes and internal fluxes, and correct response to these external and internal stimuli through the simultaneous expression of a large set of genes. The basal mechanism that performs this task is transcriptional regulation. Depending on species, context and specific function, this can involve simple interactions or complex signaling cascades, but in general it involves a large number of genes RS93 ; PWG99 ; PC00 ; BB04 ; UKZ05 ; BBA07 . For this reason, it is necessary to characterize this regulatory process from a global, or "network" point of view. To this aim, transcriptional regulation networks are defined starting from the basic functional elements of transcription BLA+04 . This information is represented as a directed graph, usually identifying each gene transcript and their protein products with an unique node, and each regulatory interaction with a directed edge between the node (the target gene) and the node (the gene coding for a transcription factor (TF) that has at least one binding site in the cis-regulatory region of ). A transcription factor regulating its own expression is called an autoregulator (AR). With this definition, the interaction graph structure is given by large-scale and collections of small-scale experiments SMM+02 ; SSG+06 ; LRR+02 ; HGL+04 .
A basic way to understand the architecture of transcription networks it to consider their topology. Topological analysis is able to capture functional properties, and important architectural features of the network MIK+04 ; WtW04 ; TB04 ; MBZ04 ; MKD+04 ; YG06 ; CLJ+07 . Examples of topological properties are the so-called network motifs SMM+02 , or the degree distribution of the connectivity of the nodes IMK+03 . These observations need to be compared with suitable null models. For example, “network motifs” are subgraphs for which the probability of appearing in a suitably randomized network an equal or greater number of times than in the empirical network is lower than a given cutoff value. For a meaningful comparison, randomized networks are taken with the same single-node characteristics of the empirical network. Usually, each node in the randomized networks is constrained to have the same number of incoming and outgoing edges (degree distribution) as the corresponding node has in the empirical network MSI+02 ; FBJ+07 . Considering more large-scale properties, the known transcription networks possess a hierarchical feedforward layered structure MBZ04 ; YG06 , and often feedback is mainly limited to a rather large set of autoregulations THP+98 . The perspective on the topology transcription networks is enriched by taking an evolutionary point of view. Evolution of a transcription network is driven by three main biological mechanisms: (i) gene duplication, (ii) rewiring of edges by mutation/selection of TF/DNA interactions and (iii) horizontal gene transfer. The first mechanism has been shown to play a substantial role, although the extent to which it can shape the network is debated BLA+04 ; TB04 ; CW03 ; DMA05 ; MBV05 . For example, it has been shown that network motifs do not emerge from duplication events MBV05 ; BLA+04 , while other topological properties have arisen from gene duplications BLA+04 ; BBI+06 . We have previously considered from this viewpoint the properties of hierarchy and feedback in the E. coli network CLJ+07 , finding that gene duplication can be held responsible for the preservation of self-regulations, and for the “shallow” layered organization, which one can hypothesize to optimize the time constraints for the production of targets.
In this paper, we present a comparative study of transcription networks, which extends the analysis on E. coli, and considers also the evolutionarily distant bacteria B. subtilis, and two different data sets for the eukaryote S. cerevisiae. From comparison of these data we distinguish between unifying and distinct features of the three networks. In particular, while in the two bacteria feedback loops involve few nodes and the number of hierarchical layers is minimal, yeast shows more feedback and a more complex hierarchy of transcription factors. Autoregulatory interactions are always abundant, although their role appears to be different between yeast and the bacteria. The fraction of self-regulators is above in the bacterial data sets, dropping around for S. cerevisiae. If we take into account the effects of evolution on topology, a richer, more complex scenario appears. Our analysis is focused on the mechanism of gene duplication, and is based on a network growth model which considers this drive to be the only one present. With this method it is also possible to infer on other mechanisms indirectly. Our main findings are the following. (i) Duplications play an important role in evolution of the TN: the relative abundance of simple network subgraphs stemming from duplication is evident in all data sets. (ii) Gene duplications shape the degree sequences and the hierarchy of the network, as predicted by a duplication-divergence model. (iii) The feedback core in the yeast network may be shaped by duplications of existing feedbacks (iv) The yeast network tends to form heterodimeric TF pairs from duplicates, which seem to be forbidden in E. coli, possibly because of the same selective pressure erasing crosstalks from duplicate ARs.
II Feedback and hierarchy. Topological Evaluation.
Feedback is present in our network if closed directed paths exist. We quantify the amount of feedback with the “leaf-removal” algorithm. This decimation algorithm iteratively removes the input and output tree-like components (i.e. parts without loops) of a directed graph CLB06 . The outcome can be either the empty graph or a non-empty subgraph of the original. In the former case, the whole network is tree-like. In the latter, we say that the leftover subgraph represents the feedback core of the network. The size of this core (number of nodes or edges, with respect to the complete network) can be used as a measure of the amount of feedback.
The reverse, or complementary, of feedback is hierarchy. Neglecting self-regulations, we define roots the nodes which are not regulated by other nodes, and leaves the nodes which do not regulate other nodes. Starting from the roots of the graph we can define hierarchical layers considering the relative ordering of nodes in a chain of regulatory interactions. (i) If we consider a tree-like graph (or a tree-like subset of it), each iteration of the leaf-removal algorithm removes a number of nodes, either roots or leaves, and the edges pointing from or to these nodes. By definition, the removed nodes do not interact with each other, and can be thought to form a distinct computational “layer”. In this case, the leaf-removal algorithm described above naturally defines a hierarchy between the nodes, through the longest path to a root or to the feedback core upstream of a given node. In the general case, we define the number of layers in the hierarchy by the number of iterations of the leaf-removal algorithm needed to remove all the nodes outside of the feedback core (thus as a sum of layers downstream and upstream of the feedback). (ii) Hierarchical layers can be defined in a similar way through the longest open chain of regulators that each of their members share. In a longest-path hierarchy, and in absence of feedback, members of layer one are regulated by at most themselves. Members of layer two are regulated by a chain of one, and no more, nodes and possibly themselves, and so on. This definition, though conceptually similar to that given by the leaf removal, is computationally demanding since the algorithm represents a NP-complete problem. We did not use this definition in our analysis. (iii) An alternative definition (computationally easier) is given by the shortest open directed paths between nodes. The number of layers is computed considering the longest among the shortest paths from any pairs of nodes (which can be found in polynomial time, for example with the Dijkstra algorithm Dij59 ). Shortest paths measure the minimal number of intermediary transcriptional interactions required for a signal from a transcription factor to reach a given target downstream, which can be interpreted as hierarchical layers. On the other hand, a straightforward univocal definition of hierarchical layers using shortest paths is difficult to produce YG06 .
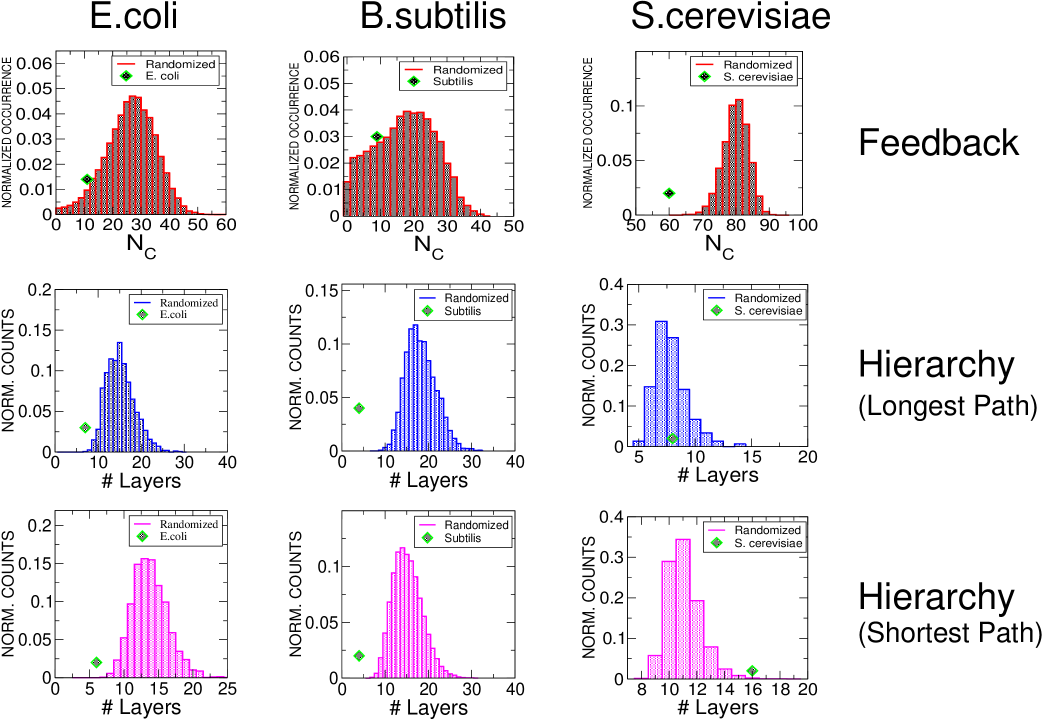
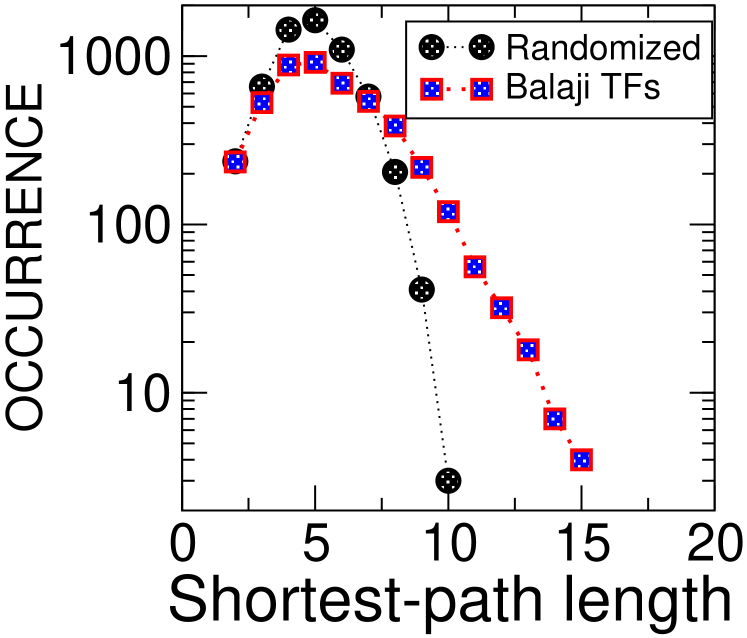
In order to quantify the significance of feedback and hierarchical properties of the three transcription networks (five data-sets), we compared them with random ensembles of networks having the same degree sequences, i.e. conserving the number of incoming and outgoing edges for each node. For all the bacterial data sets, we find consistently the following. The feedback core is slightly smaller than the typical random case, and the number of layers is minimal. This is true both for a longest path and a shortest path hierarchy. Data are shown in the first two columns of Fig. 1. On the other hand, the case of S. cerevisiae is more complex. First, we observe that the two data sets we analyzed are not consistent with each other. We believe this to be due to their large differences in size: the older Guelzim data set GBB+02 contains approximately interactions, while the more recent Balaji data setBBI+06 contains around . Considering the Guelzim data set, the almost tree-like topology does not differ from randomizations in any of the observables considered above. For the Balaji data set, we find contrasting trends compared to the bacterial networks. The rather large feedback core involving nodes and interactions is far larger than the one found in the two bacterial networks. On the other hand, it is significantly smaller than the typical feedback core found in randomizations. Interestingly, the number of leaf-removal layers falls in the average, in contrast with the trend observed in bacterial networks. Even more surprisingly, the number of shortest-path layers in the yeast network greatly exceeds randomizations, in strong contrast with the bacterial data-sets. Data are shown in the third column of Fig. 1. More in detail (Supplementary Fig. 1, the lengths of these shortest-paths have a Poisson-like distribution in both the empirical graphs and their randomizations, but for the yeast network the tails of their distributions are significantly shifted between the two.
A possible rationale for these observations is the importance, in bacteria, of minimization of the time-scales for the production of target genes, for example with structural connotation. Since each transcriptional step of an expression program takes an estimated time of the order of one cell cycle REA02 . The same argument might also explain the abundance of self-repressed transcription factors, which reach steady-state expression in shorter times REA02 . This kind of pressure is possibly released from yeast due to a more efficient organization of gene expression and degradation.
III Evolutionary Duplication-divergence Growth
Model.
We use a simple duplication-divergence model for the growth of the transcription network tesikirill ; EI-06 ; CLJ+07 to guide the data analysis. The model is formulated as follows. At each step all, or a fraction of the nodes are duplicated. The duplicate nodes inherit all the in- and outgoing edges of the original (ancestral) node. In other words one supposes that before divergence, the binding sites on the proteins and the regulatory regions on DNA remain identical. Subsequently, the new edges are removed with a certain probability, that might depend on the status of the node (regulator or target, subject or regulating a new or an old gene, etc.).
A qualitative study of the model leads to the following schematic resultstesikirill . First, by definition there is no possibility of de novo addition of edges by rewiring. Hence no edges can be created from an homology class that initially does not regulate another one. In the simplest case, if feedback is initially absent, it cannot arise spontaneously. Moreover, no hierarchical layer can be added to the network, and duplicates selected for fixation will lie in the same layer. On the contrary, in the presence of feedback, and ARs in particular, the model behaves differently. Duplication of ARs can give rise to higher order feedback and to new ARs. However, this feedback will be strictly confined among members of the same homology class. Analogously, the degree distribution is piloted by the degree distribution of duplicates. The in- and out- degree distributions can be decoupled by choosing different removal probabilities for old/new and new/old edges. One can obtain power-law out-degree and compact in-degree distributions that are in close relation with the phylogenetic conservation of the network proteins EI-06 ; EI07 : conserved nodes must exhibit at least one between the in- and out-degree sequence with a scale-free distribution, while proteins with only exponential degrees cannot be phylogenetically conserved under a general duplication-divergence model. According to this model, bacterial transcription networks with scale-free out-degrees and exponential in-degrees are thus consistent with a phylogenetically conserved set of transcription factors and a non-phylogenetically conserved set of target genes (possibly due to abundant horizontal tranfers of target genes).
In a realistic situation, the above observations may not apply because of the possibility of edge rewiring, that may be able to shuffle the hierarchy, create new feedback, affect the degree distribution, and mix edges among homology classes. Note, however, that some regulatory edges between apparently different homology classes may have also resulted from very old edges within ancestral homology classes that are no longer classified as single homology classes due to their gradual divergence. Besides, while actual edge rewiring may have occurred after homology class separation, it is clear that edge deletion must typically happen after gene duplication (or else extant regulatory networks would be densely cross-edged graphs.) Hence, this model, which focuses on the necessary deletion of duplicated edges, can assess the specific role of gene duplication and edge deletion in the growth of the network and also underline their possible shortcomings to delineate the role of other evolutionary processes such as edge rewiring.
Data Evaluation.
Having in mind the above qualitative results we examine the topological roles in empirical networks of nodes coming from the same common ancestor. We define proteins that are likely to share a common ancestor through structural domain architectures TB04 ; MBT03 ; BD92 . These domains allow for the definition of larger classes than sequence comparison alone TB04 . The database enables to associate an ordered sequence of domains, or “domain architecture” to each protein. We define protein homologs as proteins whose domain architectures are identical neglecting domain repeats. This corresponds to a conservative view of homology where no new domains are acquired or lost after duplication. The results are tested using different definitions of homologs sellerio002 . Homology allows us to construct sets, or classes, of proteins which have then supposedly evolved from a common ancestral gene. We have analyzed the distribution of regulatory edges between and within classes of the likely duplicate genes. The statistical significance of the analysis in terms of homology classes is established BLA+04 by comparison with random shuffling of genes (TFs and TGs separately) between classes. This analysis is limited by the number of nodes for which homology classes can be constructed, and thus less sensitive to the particular data set.
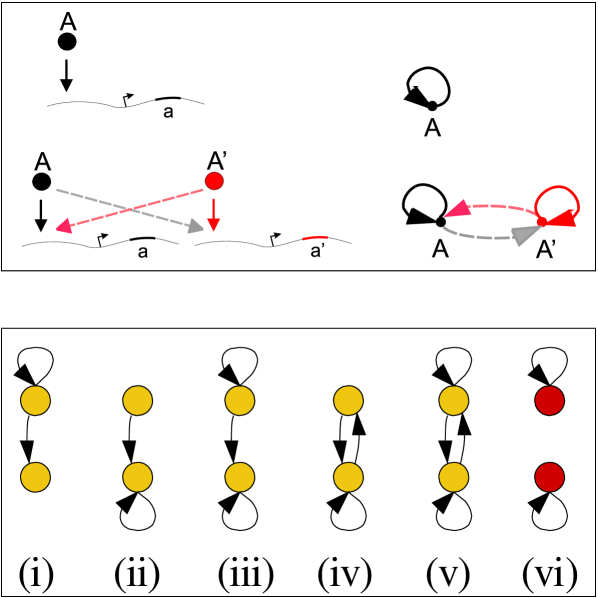
In all cases we find that the motifs of duplicated TGs, regulated by a single or duplicate TFs, and duplicate TFs regulating a common target (Fig. 2), are significantly overrepresented TB04 , which can be seen as a validation of the model. The signal for this is smaller in the smaller data sets (such as B. subtilis), because of poor statistics.
Degree sequences and duplications.
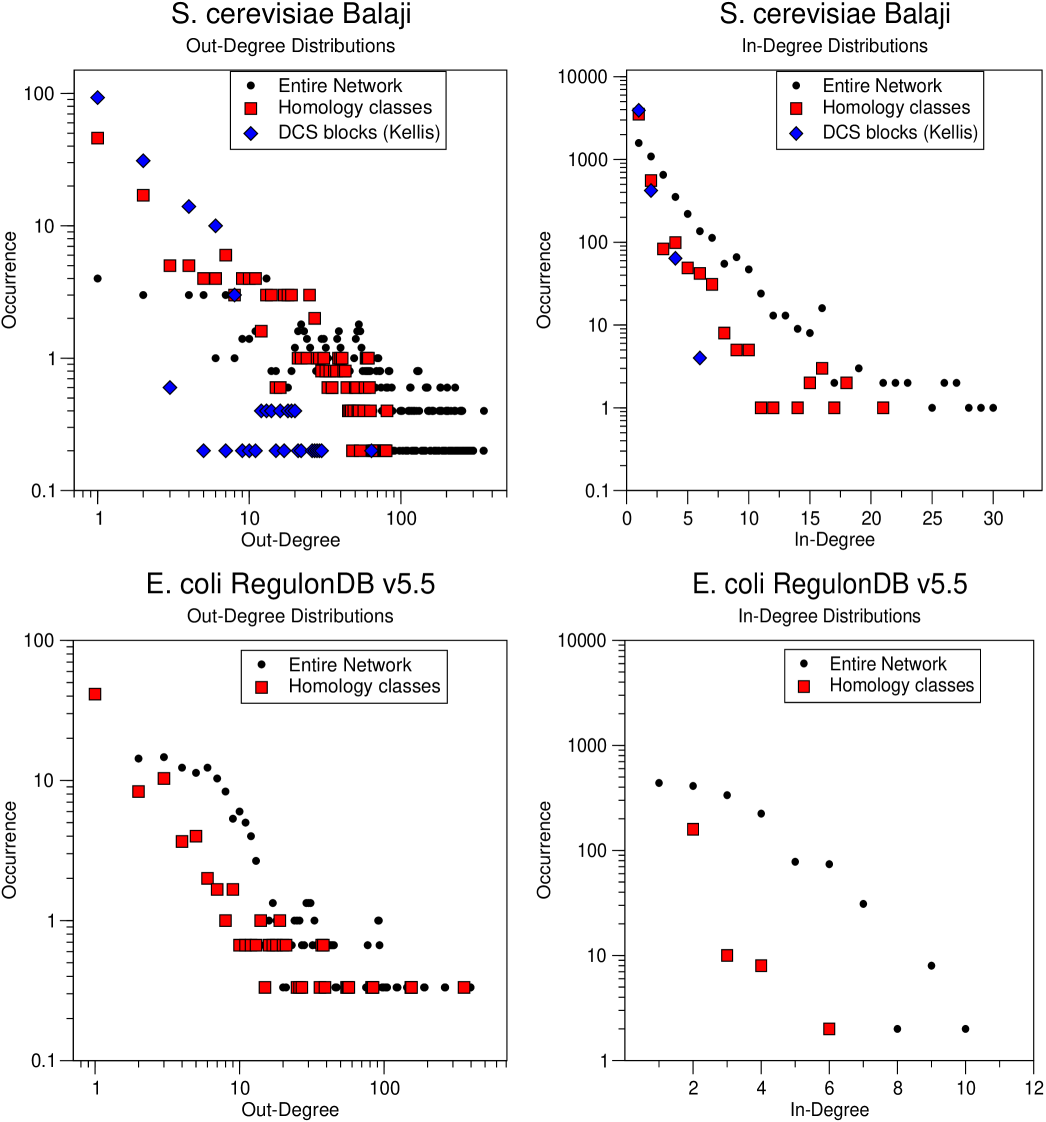
A first question to address is whether gene duplications are able to pilot the observed degree sequences of the network, as predicted by the model. For the case of yeast, one can perform this test on the above defined homology classes, and also, on the doubly conserved genes in the yeast whole-genome duplication proved by Kellis et al. KBL04 . Precisely, one can measure the degree distributions restricted to targets or regulator falling in the same homology class, and verify whether it scales in a similar way as the unrestricted distribution.
Our results, considering the Balaji data set for yeast and RegulonDB 5.5 for the E. coli, are shown in Fig. 2. The homologs follow a qualitatively similar distribution to the entire network, exponential for the in-degree, and power-law-like for the out-degree. For the in-degree distributions we find a better agreement between the decay of the entire network and the restriction to homology classes. This confirms the general idea that the degree distributions are strongly dependent upon duplications. However, in the case of yeast, the out-degree of the entire network seems to follow a broader distribution than that of the duplicates (top-left panel of Fig. 2). This can be seen as an indication that other processes, such as rewiring, concur in defining the targets of a TF. The behavior of the duplicates from the whole-genome duplication is conditioned by the small size of the sample, and its degree distribution drops with a faster decay for both the in- and the out-degree.
Duplication of Autoregulatory Circuits.
Our analysis shows that the role of autoregulatory interactions is rather different in the bacterial data sets compared to yeast. The fraction of self-regulated TFs is above in all three bacterial data sets, while being around only in the two S. cerevisiae data sets. If we measure directly the distribution of ARs in classes, in the E. coli datasets we find a consistent signal that the population of ARs in homology classes is more dense and more variable than in randomized instances CLJ+07 . This is a direct evidence of duplication and conservation of ARs, and agrees with the conservation of a hierarchical structure during evolutionary growth. In B. subtilis and yeast, we find that the population of ARs in classes falls closer to (although systematically above) the average of the randomized samples. This means that, in these cases, the pure analysis of AR population in homology classes is not sufficient to assess that ARs in the same class are the result of duplication and inheritance of self-edges. In the smaller data-sets (such as DBTBS MNO+04 ) this absence of signal could be likely due to small size of the sample, so it is possible that this is another trend differentiating bacteria from eukaryotes.
| Empirical | Randomization | Z-score | |
|---|---|---|---|
| E. coli (RDB 5.5) | |||
| B. subtilis | |||
| S. cerevisiae (Balaji) |
On the other hand, in all the data sets we find evidence for the relevance of AR duplications if we consider the distribution of the subgraphs that can stem from AR duplication (Fig. 3) within homology classes (Table 1). These subgraphs are compatible with AR duplication conserving crosstalks. In order to quantitatively evaluate the relevance of the subgraphs, we define an observable that counts the occurrence of the following events
-
1.
An AR regulates a homologous, non-self-regulatory transcription factor.
-
2.
An AR is regulated by a homologous, non-self-regulatory transcription factor.
-
3.
Two homolog ARs possess reciprocal cross regulation.
We indicate with the total number of homology classes, with the total number of the subgraphs of the three kinds found in homology class , and by the number of edges in the class, and define
This observable represents the ratio of subgraphs to the total number of (self- and non-self-) edges present in the homology class.
We find that, although the fixation of cross-talks within homology classes is typically less frequent that the retention of self-edges in bacteria CLJ+07 , the AR duplication subgraphs are systematically overrepresented, as shown by the positive signal. Specifically (see Supplementary Table 1), in E. coli and B. subtilis, this signal is dominated by duplicated self-interactions followed by loss of crosstalks, while for the S. cerevisiae network, subgraphs including crosstalks are more abundant, compatibly with the observed more complex hierarchy CLJ+07 . In addition, in the significantly overrepresented AR duplication subgraphs (type ii in figure 3), only one of the two possible self-regulations of duplicate TFs survives, indicating that ARs do not proliferate by duplication. This observation indicates that duplications have been important to shape the non-self-regulatory edges within homology classes, thereby redefining the TF hierarchy, besides leading to the fixation of new ARs in the bacterial networks. This is especially the case in yeast, indicating that circuits with crosstalks or feedback stemming from AR duplication are not negligible, and might have contributed to the build-up of the existing feedback.
Interaction Across Homology Classes and Evolution of the Feedback Core.
To gain further insight into this point, we evaluated the distribution of interactions within and across homology classes. Considering the transcription factors homology classes, we constructed a “collapsed” weighted network as follows. The nodes are homology classes, and weighted oriented edges represent the number of members of a class regulating members of another class. In absence of rewiring, this would be a likely “ancestral” TF-TF network, inherited by duplication of “primitive” self- and heterologous edges. Our model dictates that this ancestral graph can only be hierarchical or maintain the same amount of feedback of the initial configuration. In particular, if an ancestral edge is sent out from a class to a second one and the reverse is not true, there will be no edges coming from the second class to the first in the evolved network. This corresponds to an asymmetric regulatory control of the first homology class over the second homology class. Conversely, the appearance of symmetric regulations may be a signature of rewiring, if one assumes that retaining both ancestral crosstalks produced by the duplication of an ancestral AR was then as unlikely as it appears to be between recent AR duplicates. Hence, symmetric regulation between homology classes in the extant network actually suggests that the likely initial asymmetry conserved by duplication was progressively smoothed down by edge rewiring or other evolutionary mechanisms with an equivalent effect.
We define the observable , which represents a measure of the strength of asymmetric regulation across the classes. We indicate as the number of regulatory edges between homology class and class . Let then represent the number of elements in homology class . Then we define
where the sum is performed over all the pairs of homology classes and , without considering self-interactions of classes. The normalization factor in the denominator is chosen to be a linear function of the number of edges. The linear relation is suggested by the experimental observation that the number of edges in these TF-TF networks is comparable to the number of nodes. We introduced the square root normalization factor in order to compensate for the bias generated by the different size of classes and 111The important fact here is that the normalization factor should compare to the number of nodes, as does the total number of edges in the network, alternative choices such as or lead to the same results. .
| Empirical | Randomization | Z-score | |
|---|---|---|---|
| E. coli (RDB 5.5) | |||
| B. subtilis | |||
| S. cerevisiae (Balaji) |
Note that the definition the collapsed network absorbs the presence of crosstalks or feedback likely inherited by AR duplication, and this is reflected by . To understand this, let us assume that the probability of a rewiring event is smaller than the probability of keeping inherited interactions. Then, homology classes, generated by duplication of ancestral genes, would tend to maintain their inherited regulations, thus measuring an high value of . In other words, measures the extent to which feedback is retained within homology classes. This likely comes from AR duplication, or duplication of existing higher-order feedbacks between homologs.
To sum up, the larger is (compared to randomizations), the less likely rewiring has shaped the network, and the more the hierarchy between the homology classes is maintained. Evaluation of empirical data (Table 2) shows that in the bacterial data sets, the estimated rewiring is consistent with, or slightly lower than, typical randomized values. Perhaps unexpectedly, we find an even stronger signal for the yeast TF-TF network, where, as we have shown, the feedback is more common. Most of this feedback involves homolog TFs, and the network is likely to have been shaped by a small amount of rewiring, or by rearrangements that keep into account the homology relations of transcription factors. Note that, empirically, one alternative possibility is that a duplication of ARs with inherited crosstalk is followed by a subsequent split the homology class, so that the two homologs cease to be classified as such. This phenomenon would lead to a false positive for rewiring in our interpretation. However, this problem is less relevant in presence of a negative signal, such as the one we find. Another way to put the same observation, is that most of the feedback observed in yeast was shaped by duplication with retained crosstalks, rather than by rewiring.
Duplication of Homodimeric and Heterodimeric TFs.
An issue where we found notable evolutionary differences between the evolutionary transcriptional architecture of E. coli and S. cerevisiae is the duplication of homo- and heterodimeric TFs222This analysis was not possible for B. subtilis due to the lack of large-scale interaction data..
It is known from sparse observations that yeast tends to use more heterodimeric TF pairs than prokaryotes IYM+05 ; LPC+06 ; PLK+07 . A systematic analysis using large protein interaction datasets confirms this trend. In E. coli (out of 150 TFs) we find 21 homodimers, and only 5 heterodimer pairs, all formed with the histone-like protein HU, which has a rather special status. Though no systematic data is available, the common opinion is that it likely that these figures strongly underestimate the number of homodimers. A computational evaluation of the TFs available in the 3DComplex database LPC+06 is not able to enrich the sample. On the other hand, it shows that 37/42 TF entries in PDB are scored as homodimers, corroborating the common belief. Conversely, in yeast, where more systematic data is available, we find (out of 157 TFs) 45 homodimers, and 91 heterodimer pairs.
| Co-occurrence | Empirical | Randomization | Z-score | |
|---|---|---|---|---|
| A | E. coli | |||
| S. cerevisiae | ||||
| B | E. coli | |||
| S. cerevisiae |
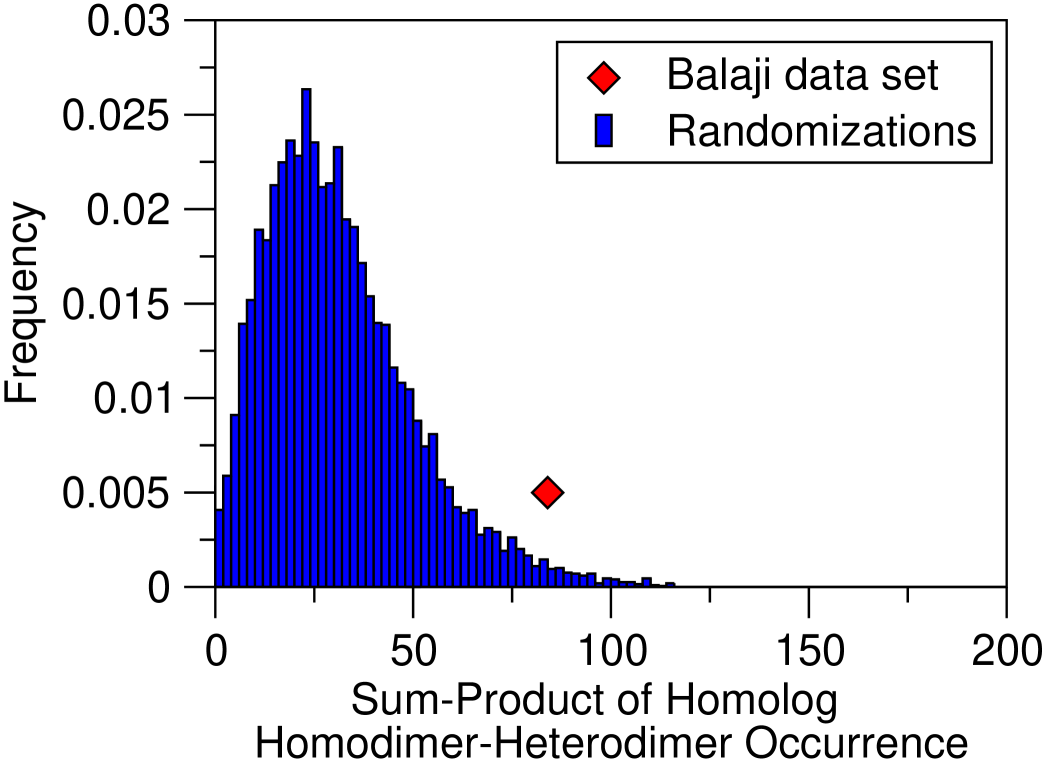
Inspection of the homology classes (Table 3 and Supplementary Figure) shows that in S. cerevisiae, heterodimeric TFs tend to cluster in homology classes, and also to co-occur with homodimers. We interpret this as a strong indication that heterodimers stem from duplications of other dimeric TFs. This is measured by evaluating the overrepresentation of number of homodimers and heterodimers in homology classes, and the product of homodimers and heterodimers in the same class. The same process seems to be forbidden in E. coli, possibly because of the same selective pressure erasing crosstalks from duplicate ARs. Due to insufficient data, we could not show that homodimeric TFs in his bacterium are likely to form classes of homodimers.
Longest Path and Shortest Path Hierarchy.
Finally, we proceed to evaluate the long and short path hierarchy conservation in evolution. The model predicts that they will be conserved, in absence of rewiring and multiple AR duplications. In particular, we expect to find many members of the same homology class falling in the same computational layer, defined by longest paths to a root or shortest paths. Our observations are reported in Table 4. In E. Coli both data sets indicate a strong tendency to have duplicates in the same layer, with both definitions of hierarchy. In B. subtilis we find a similar trend only for the long-path hierarchy (the signal is much weaker, possibly due to the small size of the sample). Finally, in yeast we also find evidence for hierarchy conservation all data sets. In the larger dataset, the long-path hierarchy was evaluated for the hierarchical component only.
| Path | Data Set | Empirical | Randomization | Z-score |
|---|---|---|---|---|
| A - Long | E. coli (Shen-Orr) | |||
| E. coli (RDB 5.5) | ||||
| B. subtilis | ||||
| S. cerevisiae (Guelzim) | ||||
| S. cerevisiae (Balaji / TF) | ||||
| B - Short | E. coli (Shen-Orr) | |||
| E. coli (RDB 5.5) | ||||
| B. subtilis | ||||
| S. cerevisiae (Guelzim) | ||||
| S. cerevisiae (Balaji / TF) |
IV Discussion and Conclusions
Our results highlight both common and distinct trends in the two bacteria and the yeast, both in the topology and in its evolution. We find that the underrepresentation of feedback is common in the three transcription networks. Indeed, the feedback core is always smaller than what expected from the null model, in both the two bacteria and yeast. On the other hand, there is a difference in the size of the feedback core of the network, which is 6 times larger in yeast, involving a major fraction of the transcription factors. As noted by Jeong and Berman JB08 , this feedback essentially condensed in one single connected component, and is enriched with TF nodes having the endogenous functions of cell cycle and sporulation, and the exogenous functions of diauxic shift and DNA repair. However, it must be noted that this feedback component, though large, is much smaller than expected by a degree-sequence-conserving null network model, so that the trend of underrepresentation of feedback has to be regarded as a common feature of the networks, and is particularly strong in yeast. On the other hand, there is a remarkable difference in the hierarchical organization between the two evolutionarily distant bacteria and yeast, which emerges more prominently in the length of shortest paths in the network. In the bacterial networks, the nodes are organized in a small number of hierarchical layers pointing to a minimization of both longest and shortest paths between TFs and their targets. Since each computational layer has a cost in time REA02 , this observation would be consistent with a possible constraint on the minimization of the time-scales for the production of structural target genes from upstream TFs which sense a particular internal or external signal. In yeast, shortest paths are much longer, both in absolute terms and compared to random networks. This means that the number of computations made after an upstream TF is activated by a signal, so that the hypothetic time constraints should be softer. This feature could be ascribed to the documented more complex post-transcriptional regulation and the efficient specific degradation machinery. We also would like to observe that, while the distributions of small network motifs seem to be common among known transcription networks MIK+04 , the nonlocal observables considered here, which evaluate the feedback and hierarchichal organization of transcription programs, point to consistent differences in network architecture that accompany the transition from prokaryotes to eukaryotes.
From the evolutionary analysis, we find in all cases significant indications that the existing feedback stems from lower-order feedback by gene duplication and inheritance of interactions. In particular, AR duplication is significant for all data sets. However, circuits with crosstalks or feedback stemming from AR duplication are found in yeast and to a certain extent in B. subtilis, but less in E. Coli. On the contrary, we observe that crosstalk conservation in E. coli is not frequent. Direct measurement of ARs in E. coli show a consistent signal that the population of ARs in homology classes is more dense and more variable than in randomized instances CLJ+07 . This is a direct evidence of duplication and conservation of ARs during evolution. In B. subtilis and yeast, the population of ARs falls closer to the null model. The pure analysis of AR population in homology classes is not sufficient to assess that ARs evolve from duplication and inheritance of self-edges.
The other face of the medal is that outside of the small feedback cores, a hierarchical organization where computational layers are built by gene duplication is visible. more in detail, in E. Coli and S. cerevisiae duplicates tend to populate the same layer, indicating conservation of hierarchy. The same seems to be true for B. subtilis, but the signal is weaker. A possible interpretation is again that, in bacteria, minimization constraints on the time-scales for the production of target genes, if present, would translate into selective pressure for the reduction of the number of computational layers. On the other hand, such pressure could be released from yeast due to more efficient post-transcriptional control of gene expression.
Finally, and along the same lines, we find a strong distinct trend in E. coli and yeast, concerning the use and evolution of homodimers versus heterodimer transcription factors. In S. cerevisiae we found strong indication that heterodimers TFs stem from duplications of ancestral dimeric TFs. The same process seems to be forbidden in E. coli, possibly because of the same selective pressure erasing crosstalks from duplicate ARs. One can speculate that this ability to make use of heterodimeric binding boosts the combinatorial capacity of a promoter signal integration function BBG+05 .
In conclusion, we presented a comparative analysis of large-scale topological and evolutionary properties of transcription networks in three species, focusing on the global aspects of feedback and hierarchy in regulatory pathways. This analysis confirms that gene duplication is an important drive for the shaping of transcription networks, which follows distinct directions between bacteria, where we hypothesize time constraints to impose the observed simple hierarchical structure, and yeast, where more intricate pathways arise. Overall, it appears that yeast is able to sustain a higher complexity in its topological structure, including more feedback and longer pathways, and to explore more freely the possible regulatory interactions stemming from gene duplication, such as feedback stemming from self-interactions and dimer transcription factors. Our current work explores the hypothesis that part of this higher complexity stems from the known whole-genome duplication event WPF+07 ; WT07 .
METHODS
Graph Growth Model.
A simple model of network evolution through duplication-divergence was considered. At each time step all the nodes of the graph are duplicated, while the number of edges rises fourfold. This happens for the following reason: for each edge connecting two original (old) nodes (old-old edge), duplication of interaction gives rise to edges between the two old nodes and the two duplicate nodes. The original old-old edge therefore generates the four old-old, old-new, new-old, new-new edges. Duplication of the graph is followed by erasing of edges with prescribed probabilities tesikirill ; CLJ+07 . One can formulate the model with partial or global duplications, and including or not the duplication and removal of self-edges (in this case, we considered the probability of retaining a self-edge equal to that of any other edge). The behavior of this model was compared, through a set of observables, with the observed trends of the experimental data.
Data Sets.
We considered the following data sets for the transcription networks. For E. coli, the Shen-orr data-set and the larger and more recent RegulonDB5.5 SMM+02 ; SGP+06 ; SSG+06 . For B. subtilis, DBTBS MNO+04 . For S. cerevisiae, the Guelzim GBB+02 data-set and the more recent Balaji BBI+06 data set. The Balaji data set was modified to include auto regulating interactions taken from the literature. In the case of yeast, probably due to the much larger size of the more recent data, there is no compatibility between the two sets of data. Domain architecture data are taken from the SUPERFAMILY database GKH+01 ; WMV+07 , versions 1.61 and 1.69, as in the data sets in BLA+04 . Homodimers and Heterodimers forS. cerevisiae and E. coli respectively, were obtained from the SGD database CWB+04 and from ref. BPL+05 .
Evaluation of Feedback and Hierarchy.
We used the leaf-removal algorithm CLJ+07 on the data-sets (including ARs) and their randomized counterparts. This algorithm prunes the input and output tree-like components of a directed network leaving with a “feedback core” of nodes, where each node is involved in at least one feedback loop. Each iteration of this pruning algorithm defines a hierarchical layer. The main observables we considered were the size of the core and the number of iterations to reach the core. For the evaluation of shortest paths, we used the Dijkstra algorithm Dij59 , considering the distribution of shortest-path lengths and the longest paths. The results for the empirical networks were compared to randomizations obtained using a standard Markov Chain Monte Carlo (MCMC) algorithm RJB96 or an Importance Sampling Monte Carlo algorithm FBJ+07 that preserve the degree sequence (marginals of the adjacency matrix). We considered random counterparts of the networks where the only constraints come from the in- and out- degree sequences. In particular, we chose not to conserve the number of self-regulators. Our previous work CLJ+07 ; FBJ+07 shows that in general this null model yields qualitatively different results. In particular, in the case of the Shen-Orr data set the number of layers falls in the average of the random ensemble that conserves self-regulations. For the scopes of this work, we did not consider this kind of randomization, and we hypothesized that, as in the model for the graph growth by duplication, auto-regulatory edges have the same status of other edges.
Evaluation of Duplications.
We used domain architectures from the SUPERFAMILY database to build protein architecture databases, one for each specie. We then constructed classes of homologous genes using similarity criteria between these architectures, as was done in TB04 . Two genes are considered homologs if they share the same domains in the same order, neglecting domain repeats. For this analysis, proteins coded by the same operon were considered as separate entities. Since the definition of homology is rather arbitrary it is rather natural to test different definition and observe the stability of results. All these results were filtered for consistency using stricter or looser homology criteria sellerio002 . In the case of the S. cerevisiae, and only with respect to the network degree distributions (as shown in Fig. 2), we also considered the notion of homology descending from the gene pairs defined by blocks of doubly conserved syntheny described in KBL04 .
Duplication of Auto Regulators.
We assessed the evolution of the Auto Regulated transcription factors by studying the distribution of the subgraphs shown in Fig. 3 within homology classes. Quantitative measure was given by the evaluation of observable , as described in the main text, which was computed on both the experimental data set and on the randomized instances of the null model described later.
Interaction and Rewiring between TFs.
We studied the distribution of regulating interaction within and across homology classes. A number of observables were implemented to describe the relationship standing between the architecture data set and the transcription network data set. To quantify the effect of rewiring we introduced the observable as described in main text. Again, this observable was evaluated upon the experimental data set and upon the null model.
Evaluation of Coevolution of Dimer TFs.
We studied the evolutionary properties of homodimers and heterodimers with respect to our duplication and divergence model. We assessed the co-existence of homo- and hetero- dimers within the homology classes by evaluating the sum (over all the homology classes) of the number of all dimeric pairs found in each homology class. The same analysis were performed upon the randomized instances of the null model, and the result is shown in Fig. 2.
Null Model for Duplication.
Most of the measures performed upon the experimental data sets were compared with a null model of homology. Keeping fixed the homology classes, we randomly shuffled the architecture associations to the gene names. This randomizes all the interaction existing between homology properties (which are responsible of class generation) and all the other data sets (adjacency list of transcription network, homodimers, heterodimer pairs). The advantage of this null model lies in the fact that no experimental database is actually randomized, only their interactions. This is important as this randomization does not destroy the homology information nor the global (large scale) properties of the network. Finally, gene name shuffling was done separately for TFs and TGs, as was done in TB04 , due to their inherently different DNA-binding properties (which depend on their domains). The data shown in this paper correspond to randomized instances of the null model, allowing us to estimate P-values larger than .
Acknowledgments.
We would like to thank Kirill Evlampiev for useful discussions and work on the asymptotics of the theoretical model, Diana Fusco for help with the subgraph analysis.
References
- (1) Russo, F. D. & Silhavy, T. J. The essential tension: opposed reactions in bacterial two-component regulatory systems. Trends Microbiol 1, 306–10 (1993).
- (2) Perraud, A. L., Weiss, V. & Gross, R. Signalling pathways in two-component phosphorelay systems. Trends Microbiol 7, 115–20 (1999).
- (3) Perez-Rueda, E. & Collado-Vides, J. The repertoire of DNA-binding transcriptional regulators in Escherichia coli K-12. Nucleic Acids Res 28, 1838–47 (2000).
- (4) Browning, D. F. & Busby, S. J. The regulation of bacterial transcription initiation. Nat Rev Microbiol 2, 57–65 (2004).
- (5) Ulrich, L. E., Koonin, E. V. & Zhulin, I. B. One-component systems dominate signal transduction in prokaryotes. Trends Microbiol 13, 52–6 (2005).
- (6) Balaji, S., Babu, M. M. & Aravind, L. Interplay between network structures, regulatory modes and sensing mechanisms of transcription factors in the transcriptional regulatory network of E. coli. J Mol Biol 372, 1108–22 (2007).
- (7) Babu, M., Luscombe, N., Aravind, L., Gerstein, M. & Teichmann, S. Structure and evolution of transcriptional regulatory networks. Curr Opin Struct Biol 14, 283–91 (2004).
- (8) Shen-Orr, S., Milo, R., Mangan, S. & Alon, U. Network motifs in the transcriptional regulation network of Escherichia coli. Nat Genet 31, 64–8 (2002).
- (9) Salgado, H. et al. The comprehensive updated regulatory network of Escherichia coli K-12. BMC Bioinformatics 7, 5 (2006).
- (10) Lee, T. I. et al. Transcriptional regulatory networks in Saccharomyces cerevisiae. Science 298, 799–804 (2002).
- (11) Harbison, C. T. et al. Transcriptional regulatory code of a eukaryotic genome. Nature 431, 99–104 (2004).
- (12) Milo, R. et al. Superfamilies of evolved and designed networks. Science 303, 1538–42 (2004).
- (13) Warren, P. & ten Wolde, P. Statistical analysis of the spatial distribution of operons in the transcriptional regulation network of Escherichia coli. J Mol Biol 342, 1379–90 (2004).
- (14) Teichmann, S. A. & Babu, M. M. Gene regulatory network growth by duplication. Nat Genet 36, 492–6 (2004).
- (15) Ma, H., Buer, J. & Zeng, A. Hierarchical structure and modules in the Escherichia coli transcriptional regulatory network revealed by a new top-down approach. BMC Bioinformatics 5, 199 (2004).
- (16) Ma, H. et al. An extended transcriptional regulatory network of Escherichia coli and analysis of its hierarchical structure and network motifs. Nucleic Acids Res 32, 6643–9 (2004).
- (17) Yu, H. & Gerstein, M. Genomic analysis of the hierarchical structure of regulatory networks. Proc Natl Acad Sci U S A 103, 14724–31 (2006).
- (18) Cosentino Lagomarsino, M., Jona, P., Bassetti, B. & Isambert, H. Hierarchy and feedback in the evolution of the Escherichia coli transcription network. Proc Natl Acad Sci U S A 104, 5516–20 (2007).
- (19) Itzkovitz, S., Milo, R., Kashtan, N., Ziv, G. & Alon, U. Subgraphs in random networks. Phys Rev E Stat Nonlin Soft Matter Phys 68, 026127 (2003).
- (20) Milo, R. et al. Network motifs: simple building blocks of complex networks. Science 298, 824–7 (2002).
- (21) Fusco, D., Bassetti, B., Jona, P. & Cosentino Lagomarsino, M. DIA-MCIS: an importance sampling network randomizer for network motif discovery and other topological observables in transcription networks. Bioinformatics 23, 3388–90 (2007).
- (22) Thieffry, D., Huerta, A., Perez-Rueda, E. & Collado-Vides, J. From specific gene regulation to genomic networks: a global analysis of transcriptional regulation in Escherichia coli. Bioessays 20, 433–40 (1998).
- (23) Conant, G. & Wagner, A. Convergent evolution of gene circuits. Nat Genet 34, 264–6 (2003).
- (24) Dekel, E., Mangan, S. & Alon, U. Environmental selection of the feed-forward loop circuit in gene-regulation networks. Phys Biol 2, 81–8 (2005).
- (25) Mazurie, A., Bottani, S. & Vergassola, M. An evolutionary and functional assessment of regulatory network motifs. Genome Biol 6, R35 (2005).
- (26) Balaji, S., Babu, M. M., Iyer, L. M., Luscombe, N. M. & Aravind, L. Comprehensive analysis of combinatorial regulation using the transcriptional regulatory network of yeast. J Mol Biol 360, 213–27 (2006).
- (27) Cosentino Lagomarsino, M., Bassetti, B. & Jona, P. Randomization and Feedback Properties of Directed Graphs Inspired by Gene Networks, vol. 4210 of Lecture Notes in Computer Science, 227–241 (Springer Berlin / Heidelberg, 2006).
- (28) Dijkstra, E. W. A note on two problems in connexion with graphs. Numerische Mathematik 1, 269–271 (1959).
- (29) Guelzim, N., Bottani, S., Bourgine, P. & Kepes, F. Topological and causal structure of the yeast transcriptional regulatory network. Nat Genet 31, 60–3 (2002).
- (30) Rosenfeld, N., Elowitz, M. & Alon, U. Negative autoregulation speeds the response times of transcription networks. J Mol Biol 323, 785–93 (2002).
- (31) Evlampiev, K. Modélisation de réseaux biologiques. Ph.D. thesis, Univ. Paris VI / Curie Institute (2007).
- (32) Evlampiev, K. & Isambert, H. Conservation and topology of protein interaction networks under duplication-divergence evolution. Proc Natl Acad Sci USA, in press (2008).
- (33) Evlampiev, K. & Isambert, H. Modeling protein network evolution under genome duplication and domain shuffling. BMC Syst Biol 1, 49 (2007).
- (34) Madan Babu, M. & Teichmann, S. A. Evolution of transcription factors and the gene regulatory network in Escherichia coli. Nucleic Acids Res 31, 1234–44 (2003).
- (35) Bork, P. & Doolittle, R. F. Proposed acquisition of an animal protein domain by bacteria. Proc Natl Acad Sci U S A 89, 8990–4 (1992).
- (36) Sellerio, A. L. & Cosentino Lagomarsino, M. Sequence alignments and domain architectures. Comparative study in yeasts lineage. In Preparation (2007).
- (37) Kellis, M., Birren, B. W. & Lander, E. S. Proof and evolutionary analysis of ancient genome duplication in the yeast Saccharomyces cerevisiae. Nature 428, 617–24 (2004).
- (38) Makita, Y., Nakao, M., Ogasawara, N. & Nakai, K. DBTBS: database of transcriptional regulation in Bacillus subtilis and its contribution to comparative genomics. Nucleic Acids Res 32, D75–7 (2004).
- (39) Ispolatov, I., Yuryev, A., Mazo, I. & Maslov, S. Binding properties and evolution of homodimers in protein-protein interaction networks. Nucleic Acids Res 33, 3629–35 (2005).
- (40) Levy, E. D., Pereira-Leal, J. B., Chothia, C. & Teichmann, S. A. 3D complex: a structural classification of protein complexes. PLoS Comput Biol 2, e155 (2006).
- (41) Pereira-Leal, J. B., Levy, E. D., Kamp, C. & Teichmann, S. A. Evolution of protein complexes by duplication of homomeric interactions. Genome Biol 8, R51 (2007).
- (42) Jeong, J. & Berman, P. On cycles in the transcription network of Saccharomyces cerevisiae. BMC Syst Biol 2, 12 (2008).
- (43) Bintu, L. et al. Transcriptional regulation by the numbers: models. Curr Opin Genet Dev 15, 116–24 (2005).
- (44) Wapinski, I., Pfeffer, A., Friedman, N. & Regev, A. Natural history and evolutionary principles of gene duplication in fungi. Nature 449, 54–61 (2007).
- (45) Ward, J. J. & Thornton, J. M. Evolutionary models for formation of network motifs and modularity in the Saccharomyces transcription factor network. PLoS Comput Biol 3, 1993–2002 (2007).
- (46) Salgado, H. et al. RegulonDB (version 5.0): Escherichia coli K-12 transcriptional regulatory network, operon organization, and growth conditions. Nucleic Acids Res 34, D394–7 (2006).
- (47) Gough, J., Karplus, K., Hughey, R. & Chothia, C. Assignment of homology to genome sequences using a library of hidden Markov models that represent all proteins of known structure. J Mol Biol 313, 903–19 (2001).
- (48) Wilson, D., Madera, M., Vogel, C., Chothia, C. & Gough, J. The SUPERFAMILY database in 2007: families and functions. Nucleic Acids Res 35, D308–13 (2007).
- (49) Christie, K. R. et al. Saccharomyces Genome Database (SGD) provides tools to identify and analyze sequences from Saccharomyces cerevisiae and related sequences from other organisms. Nucleic Acids Res 32, D311–4 (2004).
- (50) Butland, G. et al. Interaction network containing conserved and essential protein complexes in Escherichia coli. Nature 433, 531–7 (2005).
- (51) Rao, A., Jana, R. & Bandyopadhyay, S. A markov chain monte carlo method for generating random (0,1)-matrices with given marginals. Indian J. Stat. 58(A), 225–242 (1996).
SUPPLEMENTARY MATERIAL
| E. coli (RDB 5.5) | |||
|---|---|---|---|
| Subgraph type | # Empirical | Randomization | P-value |
| (i) | |||
| (ii) | |||
| (iii) | |||
| (iv) | |||
| (v) | n.a. | ||
| (vi) |
| B. subtilis (DBTBS) | |||
|---|---|---|---|
| Subgraph type | # Empirical | Randomization | P-value |
| (i) | |||
| (ii) | |||
| (iii) | |||
| (iv) | 0.0755 | ||
| (v) | |||
| (vi) |
| S. cerevisiae (Balaji) | |||
|---|---|---|---|
| Subgraph type | # Empirical | Randomization | P-value |
| (i) | |||
| (ii) | |||
| (iii) | |||
| (iv) | n.a. | ||
| (v) | |||
| (vi) |