A Conversation with George C. Tiao
Abstract
George C. Tiao was born in London in 1933. After graduating with a B.A. in Economics from National Taiwan University in 1955 he went to the US to obtain an M.B.A from New York University in 1958 and a Ph.D. in Economics from the University of Wisconsin, Madison in 1962. From 1962 to 1982 he was Assistant, Associate, Professor and Bascom Professor of Statistics and Business at the University of Wisconsin, Madison, and in the period 1973–1975 was Chairman of the Department of Statistics. He moved to the Graduate School of Business at the University of Chicago in 1982 and is the W. Allen Wallis Professor of Econometrics and Statistics (emeritus).
George Tiao has played a leading role in the development of Bayesian Statistics, Time Series Analysis and Environmental Statistics. He is co-author, with G.E.P. Box, of Bayesian Inference in Statistical Analysis and is the developer of a model-based approach to seasonal adjustment (with S. C. Hillmer), of outlier analysis in time series (with I. Chang), and of new ways of vector ARMA model building (with R. S. Tsay). He is the author/co-author/co-editor of 7 books and over 120 articles in refereed econometric, environmental and statistical journals and has been thesis advisor of over 25 students. He is a leading figure in the development of Statistics in Taiwan and China and is the Founding President of the International Chinese Statistical Association 1987–1988 and the Founding Chair Editor of the journal Statistica Sinica 1988–1993. He played a leading role (over the 20 year period 1979–1999) in the organization of the annual NBER/NSF Time Series Workshop and he was a founding member of the annual conference “Making Statistics More Effective in Schools of Business” 1986–2006. Among other honors he was elected ASA Fellow (1973), IMS Fellow (1974), member of Academia Sinica, Taiwan (1976) and ISI (1980), and was recipient of the Distinguished Service Medal, DGBAS, Taiwan 1993, the Julius Shiskin Award, 2001, the Wilks Memorial Medal Award, 2001, and the Statistician of the Year Award in 2005 (ASA Chicago Chapter). He received honorary doctorates in 2003 from the Universidad Carlos III de Madrid and National Tsinghua University, Hsinchu, Taiwan.
doi:
10.1214/09-STS292and
The original conversation took place in May 2003 in Chicago. Due to George’s health problems right after he retired in 2003, this final version was finished in 2009.
Q: George, tell us something about your parents.
GCT: My mother was from a somewhat well-to-do family in Kunming, Yunnan, but her father died early and she was brought up by her mother. In the mid-1920s she went to Beijing Female Normal University, which was a famous university at that time, and she caught the revolutionary fervor and joined the Nationalists Army doing political work. My father was from a very poor family in Szechuan and had a very hard time until he finally graduated from college. When the Nationalists established the government in China, they had exams every year to send students abroad and my parents passed those exams and in 1930 my father went to Harvard and my mother went to Illinois at Champaign. Some of my parents’ friends introduced them when they were in the US and my father transferred from Harvard to Champaign–Urbana and they got married there.
I think they were in this country for about three years before they went to England to study at the LSE (London School of Economics). I was born there in 1933. But shortly after I was born, they ran out of money and went back to China, so I was in England for just about four months. They never had in mind anything about birth certificates and the only concrete evidence I had about my place of birth was a slip, a little sort of invoice-receipt for five pounds, that they obtained when they checked out of a hospital. My mother always kept that, and when I came to this country she gave it to me. I kept that in my wallet and carried it with me all the time. Unfortunately that wallet was stolen in Paris and I lost it.
Q: What did your parents do when they returned to China?
GCT: They went back to Shanghai. My father joined the Central Bank of China and my mother was teaching accounting in Shanghai and maybe was doing some job for the Nationalist party organization. When the Sino–Japanese war started in 1937 my father was sent to establish a branch of the Central Bank in Chungking. The year the war ended (1945) was the year I graduated from the grade school.
Q: When did your family move to Taiwan?
GCT: There were four or five years of complete chaos in China. During the war my father became the treasury head of the city of Chungking and my mother was the principal of a high school, the first female high school principal in Chungking. The World War ended in 1945, but in China the war continued between the Nationalists and the Communists. In 1949 the situation was very hard for the Nationalists and my father got the job to move all the gold and foreign currency reserves from Chungking to Taiwan. My father was very loyal and a clean civil servant and I have been very proud of him all my life. I remember when we went to the bank and they took all the money (silver and gold) that was left in the vault in four or five trucks. Each truck had two army guards, and at four or five o’clock in the morning, we went from the bank to the airport. The normal travel time to the airport was about an hour, but it took us about six or seven hours or maybe eight hours, because the traffic was a complete jam. That was the first time I witnessed a city and an army about to collapse.
We went to the airport and they loaded the money on a plane. We got on the airplane and for a while we just stopped and waited for the plane to take off. I peaked out from the window and saw a machine gun pointed at the airplane and my father was arguing with the soldiers. He was jumping up and down saying this is the government’s money, you cannot take any of this out. My father was an extremely loyal civil servant to the government and was completely oblivious of the risk. Finally the local garrison commander talked to us, and my father let him, I think, take about two or three boxes of the silver dollars out. When you think about it, most people would just do whatever they can to save their lives, but my father was arguing with them, defending the government property, and this incident has left a very, very deep impression on me about public service. From there we went to Hong Kong.
Q: At any time did you feel that your life was really at risk?
GCT: No, we didn’t know that because I was, in a way, stunned by the whole event and just followed my parents. I didn’t know about the dangers. Only later on did we realize that, and there were rumors that we got robbed and that the whole family had perished.
We went to Hong Kong and in January 1950 we flew from Hong Kong to Taiwan. I remember all my parents’ friends in Hong Kong said there’s no point for us to go there because the whole thing will be over in three months. All the people with some means stayed and we were really lucky because my parents had no property, so we had nothing to lose. Well, nothing to live either, except with the government. That was the situation I was brought up in. So we went to Taiwan and, of course, stayed much longer than three months. In June 1950, the Korean War started. I always remember when my father came home one day at noon. At the time, he always came home for lunch, had some rest, and then went back to work again. He said to my mother, “Well, now we don’t have to jump into the ocean.” The way he said it, it’s the Chinese way of saying it, is that, “We will not be eaten by fish.”
1 Arriving in the United States
Q: When and why did you come to the United States?
GCT: I came here in 1956. I finished high school in 1951 and got in to National Taiwan University in the fall. I graduated in 1955, spent a year in the army and then I came to the States in October 1956. See, at that time, most of the college students came to study here and I got admitted to NYU’s economics department. My father arranged something very helpful to me and I became a trainee for two years at a bank in New York. A trainee there simply meant that I had to go through the training in the morning. Well, first of all, the bank gave me $50 a week, and this was quite a bit of money at the time. In the morning I spent four hours in their different departments and in the evening I went to school. I was originally admitted to the econ department, but once I was in New York City I met some other friends in the Bank of China. Some people said, “Why do you go to NYU in Washington Square? It’s far away from here. Why don’t you go to NYU’s business school, which is across the street from here? Also, if you get a business degree job opportunities are probably better.” That’s how I got into the business school, because of its location. I spent four hours in the morning going through training in the bank, in the afternoon I stayed in the bank library, and in the evening I went to school. So that was sort of what my life was like in New York.
Q: How did you decide to study statistics?
GCT: Well, it was sort of by accident. I met Barbara in high school in Taiwan. We were engaged there in 1955. I came out first, then she came out and we got married in 1958, the same year I got the MBA. And then our first daughter was born in 1959. It was very tough; very uncertain and very tough. We knew that we had to get out of New York because at that time the bank job was just $75 a week. There was a senior guy, a Chinese fellow, in the bank, who was in his forties. His name was Chiu and one day we were having lunch together and he said, “George, you better leave. There’s no chance. You make seventy-five, right? I make a hundred and twenty-five.”
Q: That’s your future.
GCT: After fifteen years. Then he gave me another example. He says, “I’ll tell you about mybrother-in law who happens to be Gregory Chow. He just got a Ph.D. and is a famous sort of economist, a famous MIT professor.” He told me all about Gregory. He says, “You definitely should get a Ph.D. and leave the bank.” So I took his advice. You know what happened? After I left New York the banks started opening up. He jumped to American Express. In 1970 when I went back to New York with my father to visit the banks, the guy was a senior VP at American Express. I told him, “Look, bad advice. Otherwise I’d be a heck of a lot richer.” And we laughed.
So that’s how I went to Wisconsin. I got a scholarship, $1500 a year, great. My idea was to get a Ph.D. in international finance and I needed a secondary field. The first obvious choice was accounting, because I had all these cost accounting, advanced accounting and so forth in NYU and back in National Taiwan University. I went to the accounting department and said well maybe I could take one advanced course and then take a seminar. That should satisfy the secondary field. They said, no, you have to take all these basic courses. Because I didn’t want to take them the third time, one guy suggested, how about statistics? I had a course in statistics in my sophomore year and it’s like Greek, you know. I went to talk to the guy (who) taught statistics in the business school and he was so surprised that a student wanted a secondary field in statistics. This never happened before. He said, “Well, we really don’t have any advanced courses for you for the secondary field. To use that as a secondary field, you have to show some advance courses.” Then he said that he heard that the math department was starting out a theory course and I went to the math department. In the first year I took from the math department a math stat course, and the teacher was a complete disaster. Sam Wu, who became a famous engineering statistician later on, was also in the class. I ended up working with somebody in class and we studied the Mood book together and we did every problem in the book. So at the end of the course I became one of the most advanced students in statistics on campus. At the beginning of the second year, I was persuaded to go back to economics. I thought I should transfer to some other place, like Michigan or Stanford, but then I was told that two good guys were coming this year. One is Goldberger and the other is Box. It was lucky that I stayed. And in the third year I shifted from economics to statistics with the permission from economics to write a thesis with Box on Bayesian robustness. To qualify it as an econometrics thesis, Goldberger finally made me write a piece about estimating common parameters from two regressions with different variances. I did it in the Bayesian framework and he was happy with it. Later on I worked with Arnold Zellner in this area. Arnold joined Wisconsin just right after I graduated, he read my thesis and we started working together. A person who helped me a lot was Marvin Zelen. At that time he was at the Mathematics Research Center, MRC, as a visitor. He was always very encouraging and helpful to me in learning statistics. When the Raiffa and Schlaiffer book on Applied Statistical Decision Theory came out, Marvin organized a group seminar on the book at MRC. I learned so much with that group, talking about decision trees, posterior analysis and all that stuff.
2 Bayesian Statistics
Q: How was the subject of your thesis chosen?
GCT: The title of my thesis was Bayesian Analysis of Statistical Assumptions. Box was interested in two things when he came to Wisconsin in 1959. One was time series and the other was Bayes. Box was 42 when he went to Wisconsin and he was at the peak of his ideas at the time. I think he was frustrated by the frequentist approach because you have to have sufficiency otherwise it becomes very difficult. He started looking at Bayes. At the time Savage had a little book on stable estimation and Box was studying that and got very interested. I remember his first lecture the first year that he was teaching. There were six students in his class, among them Bill Hunter, Sam Wu and I. His first couple lectures were on the likelihood function of nonlinear models and how to combine that with locally uniform priors. Nobody knew what he was talking about. In a matter of two weeks it was clear that we were going nowhere with this. He probably did look at our faces and saw them. Then he completely changed it. He said, “OK, let us start from scratch.” He got C. R. Rao’s first book, not the Linear Statistical Models. He started to get material from that book and began with expected value and then only toward the very end of the second semester he came back to Bayes and stuff like that. But in the meantime he was very interested in trying the robustness in the Bayesian way and this was my dissertation topic.
Q: Is there anything that you remember that impressed you very much at the time of the Bayesian approach?
GCT: By the time I finished the thesis in 1962, you could just see the easy way that this approach can study robustness from a different point of view. If you draw a conclusion from the data, then the likelihood is the most natural thing. You don’t have to compare that with the things that could have happened. So, it’s a new approach. You learn, for example, in the variance component, that if the variance component has a negative estimate, it becomes a very bothersome thing. But, if you’re doing the Bayesian approach, you don’t have that problem. After I had done the random effect model I became more and more convinced about the Bayesian approach.
Q: When you got your Ph.D. degree did you consider going elsewhere instead of staying in Wisconsin?
GCT: When I was about finished, I went to George and said that, well, I probably should start looking for a job. And his response was “why don’t you stay here?” He wanted to have joint appointments with other schools. He himself and Bill Hunter were with engineering, and then at that time John Gurland started with the medical school. In his mind definitely something had to be done with economics and so I was a natural person to have a joint appointment. George probably didn’t mind much about using his own students, but I guess in the Economics Department they were having some reluctance because not hiring your own students was a very good American tradition. However, the Business School agreed to pay forty percent of my salary and I didn’t have to do anything for them for the first three years. So the first three years at Wisconsin I taught one course a semester. And George Box said, “Well George, why don’t you teach my course?” I was shaking. I didn’t know what to do, you know, because I had so little training and knew so little about anything. In addition to Rao, I remember the three books that I used, more like a self-study really. The first is Kendall and Stuart, it has a vast coverage but the only trouble is that there were a lot of mistakes in there. The second is Wilks’ book. I think I used Wilks’ book quite a bit the second year in fixing up my notes. Then the other one is this book by Fisk.
Q: What kind of a schedule did you have at that time? Did you keep working with George Box?
GCT: There are several major co-workers. One is Irwin Guttman, we shared an office for four and one-half years. Then there’s Arnold Zellner. Arnold actually spent about half of the time inside the Statistics Department. He and I ended up writing three papers together. Irwin and I probably had four or something like that. And then George Box, I continued to work with him. In the 60s we worked mostly on Bayesian stuff. The only time series we did together was the one which is the precursor of the Intervention Analysis paper: a change in level in a nonstationary time series. I think I started teaching time series in the late 60s.
Q: What course did you teach?
GCT: There were two time series courses. George was teaching one (701) and I was teaching a baby Box and Jenkins course for Business and economic students. When I developed the course, I was also working with Howard Thompson on the telephone paper—that is how I really learned the seasonal models and so forth by working on the telephone data. Also, one famous guy who attended every lecture was Sam Wu and that’s how he later on got into time series. So by the time I got to England I think I got more and more interested in time series.
Q: Did you have any trouble publishing the paper from your thesis?
GCT: No. I was not sure about the paper, but Box was quite sure and he was right. I told him, “Well there isn’t much math in there,” but the ideas were very interesting where it worked out all this posterior distribution and the different kind of robustness and so forth. George was thinking this would get a good reception in Biometrika, and sure we did. We sent the paper in and Egon Pearson, who was the Editor, wrote a long letter to Box saying that he thought the idea we had in the paper was quite interesting. And he said that he and Neyman struggled a lot trying to build statistics on Bayes, but in the end couldn’t accept this subjective idea and so forth. So they couldn’t justify the prior distribution because degree of belief is not frequency, and therefore he gave up (laughing). Then he developed the well-known Neyman–Pearson theory. It was quite sympathetic and very encouraging to us.
From then I was lucky, because I never had any trouble publishing anything. The first time I had a little trouble publishing was in 1970, so I was really very lucky the first eight years. Later I thought that it was probably because the basic idea was quite new and to look at problems in a Bayesian way was a very popular thing.
At that time one of the major things we (Box and I) were doing was writing the Bayes book. We went to Harvard in 1965 to finish two books. The first is the Bayes book and we also wanted to write a book on Mathematical Statistics. But, of course, we ended up with half a book on Bayes. The most interesting things I remember when working with George in 1965 and 1966 in writing the book are data translated likelihood with the noninformative priors, and the random effect model.
Now let me say something about both. We had this chapter, Chapter 2, about Standard Normal Theory Inference Problems, and two people have helped us a lot on this. One is Fred Mosteller and another is Jim Dickey. They read many of the topics and said, well, we justify everything on Jeffreys prior but nobody understands it. Why should you hide behind Jeffreys? You should come out with arguments. It is by his kind criticism that we went back and worked at it and then finally got a likelihood function that when we take the transformation it becomes normal. I think the data translated idea is really from Mosteller’s criticism and it makes the argument a lot more intuitive. So we spent quite a lot of time on that subject.
The other thing we spent a lot of time on is the random effect model. A bit of that was done before by W. Y. Tan and I, but we really worked very hard on this problem in Boston. There are two aspects in the random effect model. The first is looking at the estimation of variance components. You have negative variance components estimates from random effects models which are bothersome, and you also have them from mixed and hierarchical models. But that is all on estimating variance components.
The second and more interesting thing is the estimation of the random effects because that’s really kind of Stein’s shrinkage and stuff like that, and the two of us worked for a long, long time on this. If you have many groups, you may assume that all the groups have the same mean, just one mean. The second is the fixed-effect model that means that all the groups means have locally uniform prior distributions. If you assume they’re totally spread out, then you don’t give them a chance to shrink. So the random effect model is very nice because it allows the group means to come from some common population.
In this framework you invite the data to comment on the possibility of clustering. So we thought that’s really an interesting way, as we said in Chapter 7 of the book. In fact, later on, all these things about random effect hierarchical models in marketing and all that, this idea of inviting the data to tell you whether you have clusters or not, persisted. If you use fixed-effect models, you don’t give them a chance.
The other thing we did at that time is this 1968 outlier paper which has generated quite a bit of follow-ups. The only thing that was regretted is that we didn’t put the outlier paper in the book. But by then the book was in the printing process in England so that we couldn’t change it any more.
Q: How was the situation of Bayes theory at that time?
GCT: The Neyman–Pearson approach is really formalized in their 1928 paper. So the basic foundations were only effective in the 30s. And the next 10–20 years really developed that. All along the way there’s always this Bayesian stuff lurking in the background. The sequential analysis was developed in the 40s. These are probably two of the main things. There are always some doubts about this Neyman–Pearson framework and in the 50s people started to think about alternative ways of drawing inference. And there is also this likelihood function because Fisher introduced the idea of likelihood function to obtain the maximum likelihood estimates and so forth.
The likelihood function is a summary of information, and it has it’s own natural appeal. It’s not just to get the maximum and then suddenly turn around to find the sampling (frequentist) property of the estimates. So there is talking about all this likelihood and thinking about Bayes and, I think, Savages’ idea about stable estimation and locally uniform prior which produce an answer that looks the same as the classical answer “t” and so forth, that has a tremendous impact on a lot of people who are looking for alternatives. Take George Box as an example. He was totally trained in sampling and all his early work on robustness was of this frequentist type of thing. He was very frustrated that in some cases, such as when you have sufficient statistics, the answer to an inferential problem is very obvious. As soon as you go away from sufficient statistics, how do you find the critical region and all the similar regions, which is the basis of the hypothesis testing? So that when you don’t have sufficient statistics all this becomes difficult. And when they become difficult people will naturally think about alternatives and the likelihood thing becomes very hot in the 50s. A lot of very good people like Barnard appeared and there is a famous paper by Birnbaum. This all happened in the 50s, the late 50s and early 60s.
So there’s a revival of the Bayesian framework or another critical look at the frequentist approach. And, of course, the major problem at the time, from our contention, is the Behrens–Fisher problem at the time. Very often a locally uniform prior or something like that will produce a Bayesian answer which is very similar, or which is the same thing, at least in terms of practical use, to a sampling procedure. But Behrens–Fisher, what is it? Lots of people tried very hard to understand Fiducial and Bayesians got it, but it is very different from the sampling approach. So that is the first clear-cut example of the distinction between Bayesian and sampling approach.
So that was the time I became a student in statistics and read all this stuff. And at the time I was kind of very depressed because I got out of economics because there were too many theories on the one hand. On the other hand, now you got into statistics and the first thing you jumped into is the inference business. And I happened to have a major professor interested in this and got me this problem. To work on this problem, I started to read this literature and it was quite a turmoil at the time.
By the 60s people said, well, let’s look at this. All these problems that create difficulties in the frequentist approach and how do they look if we adopt a Bayesian approach. At the beginning I think that’s reasonable because when you start a new theory, or revive a theory, the first thing you always try to compare with is what the current dominating theory has to say about this. And compare that answer with the Bayesian answer. That, in a way, is the reason why we do all this. A lot of the problems we are interested in is in that vain. And at that time many papers are like that if you look at the papers by Geisser and so forth; I just want to basically say a bit about the time. And that was the reason why I was interested in the variance component estimation.
The variance component topic is very confusing and not well taught at all. If every group has an equal number of observations, at least you get sufficient statistics and inference is easy. As soon as the numbers of observations of each group are different, things become very messy. Apart from this, there is the possibility of negative variance estimates, which is very counter-intuitive and people regard it as a thorny problem. How can you have an approach, which works very nicely only under certain sorts of nice balanced designs and immediately becomes very difficult and you can’t explain? As another example, take the problem of comparing two means. If you teach a student how to tell if the variances are equal, we can make inference. If the variances are not equal, suddenly we cannot make any inference. That is the Behrens–Fisher problem. In the analysis of variance, if the numbers of observations in each group are equal, things are very simple. But as soon as a number of groups are unbalanced, immediately they become very difficult. For practitioners, if they really want to understand that, they would ask why do you have a theory like that? That is all the reasons why we want to look at all these things from a new point of view, the Bayesian point of view. In the Bayesian approach, if you look at all these thorny problems, you will produce good answers. And again, at the same time, you always want to see in the simple cases you will give similar answers. I don’t know whether I explained the sentiment or not, but I think it’s a new insight comparison. You have to compare with the dominating approach. Any time you want to make any changes you cannot just throw them away. They are there. Most of the people believe in them and so you have to defend [them] and say, Hey! We produce answers as good as you are in the case where you can solve the problem, but in the case where you cannot solve the problem we get answers, which seem to be intuitively reasonable and asymptotically the same. Also, we can get finite sample solutions. So you can remember Arnold Zellner, even down to this day, always talks about finite sample solutions and that’s exactly the kind of thing that people like us talked about in the 60s. Well, he is the person from that generation anyway and is always very proud that Bayesian can produce finite-sample solutions to all these problems for any sample size. I can produce a posterior distribution. The only difficulty is the numerical integration. I don’t have to find sufficient statistics. I don’t have to find similar regions.
Q: Why do you think that these ideas were not more widely accepted in the statistical profession? Is it because of the computational difficulty?
GCT: Well, there are many answers to that. One is, of course, there is still a lot of frequentist people who think that the whole prior idea is wrong. Everything has to be based on frequency and so forth. That’s one thing.
And the other thing is this. To some Bayesians, at least I believe that in the 60s, all the problems are solved; the only thing that’s left is computation, and the computation is difficult at that time. You can do numerical integration in one- or two-dimensional cases. So you talk to Bayesians, all the problems are solved. You have got to assess the prior. Once you assess the prior, you get the likelihood and bang!
In the 60s many frequentists thought that theBayesians were basically just hanging around. But somehow the attitude gradually shifted in the 70s because they found that the Bayes is a way to get good estimates. So then they began to think that Bayes is probably not that bad at all.
3 Time Series
Q: Was it at the end of the 60s that you started to get involved in time series analysis?
GCT: Yeah, more and more. Two things stood out for me in the beginning of the 70s. One is this work with Bill Cleveland about the X-11. And that took a very long time. The other is the level change paper for nonstationary time series in 1996.
Q: But how you do become interested in seasonal adjustment?
GCT: Well, I was lecturing the Box and Jenkins method at Dupont doing all this seasonal stuff. It was natural for me because I did the telephone paper with Thompson. I had the feeling that I really had some feeling for that kind of model. So I was particularly enthusiastic about that. There was a guy, I forget his name now, who was in the audience and he was an important statistician working there in the head office and doing a lot of economic analysis. He took me to his office and said, “Well, all of what you said sounds very interesting, but we’ve often used the X-11 program from the Census Bureau.” (We used various filters and so forth. At that time I didn’t even know what X-11 is.) And then he said, “Can you tell me about how these two things are related?” So I said, “Well, I really know nothing about it, but I’ll look.”
I came back and started to look into this and found filtering very fascinating, so I started to play with it myself. Then came Bill Cleveland. He was looking for a thesis topic and had an Electrical Engineering background, so he was very familiar with spectral analysis and the filters. We started to work together on that. A rough logic goes like this. Given a filter people use, we tried to figure out if the filter has any kind of model background. In other words, is there any possibility of modeling those filters? This is just like the way you can think about “exponential smoothing.” People used it for many years, but it’s only later on that Muth came out with an explanation that the exponential smoothing filter really produces the optimal forecast with respect to the first-order integrated moving average model. By this logic, we can bring together statistical modeling and choice of filters.
I kept thinking about a model-based explanation of the filters because I always had the exponential smoothing case appearing in my head. And so that’s how Bill and I got started on that and we finally found some approximate model for the Census filters. Harry Roberts and Arnold Zellner became very high on the subject. It was the first time that somebody found an empirically developed filter that became the widely used official method, with a model-based explanation. So we published the paper. We started working on that in 1969. But the final paper was published in 1976.
Q: Yes, it took a long time.
GCT: Yeah, from 1969 to 1976. It took a long time to understand everything. Going through it, I have a much better feeling about filters because you have to deal with stationary and nonstationary stuff. For all this, the traditional filtering doesn’t work. I mean, you had to have a theory behind it, so we worked out a theory and so forth. Later on somebody says others have similar ideas, but when we were writing our paper we didn’t even know.
This was a very good learning process with Bill to get that out. Also, about the time that paper was published, I was on the Advisory Committee of Bureau of the Census and the Bureau had two conferences about seasonal adjustment. Arnold Zellner was the leader. And we all got involved. All those things together got me really interested in the seasonal adjustment methods. Steve Hillmer, following Bill, was working with me and so we continue to work on the problem. This is the part now where I got into seasonal adjustment.
Q: You also wrote the intervention paper, and it has become a classic article.
GCT: I don’t know whether I deserve anything like that. Very often the stuff that you got a lot of publicity over is not the thing that you spent much time with. What happened was that after the 1966 paper, people in education and psychology picked up the work. I got a lot of phone calls from the education/psychology colleagues at Wisconsin. And then there’s somebody outside of Wisconsin who came and talked to me. They applied the method because I guess it is much easier to understand a change in the level in practice because there is no mean in a nonstationary series. A change in mean is, of course, a very common method. But here there is no mean and you weight the observations with more weights for those observations close to the point of change and then less and less. It’s very intuitive, and education/psychology people picked it up. I think the first paper they had was an application using the Connecticut turnpike. There was a speed limit, but a lot of people were still speeding, so police had a crackdown. They wanted to know what is the effect of this crackdown in changing the level of the speed violation, so it is a natural application. And they found that the solutions that George and I worked out are much more intuitive than the one they used before. So they applied our method to that kind of a problem. In fact, this guy McGuire coined the word “intervention analysis.” It’s not George’s or my invention. And he came and talked to me.
There was another interesting application. At the turn of the century Germany passed a new divorce law and they wanted to know how that divorce law affects the divorce rate and the reconciliation rate. These people and I actually published a paper on this. I even got some money out of it (laughing). The paper was published in the Northwestern Law Review, which is not a bad law journal. Then people came and asked me (and George) about application in advertisements. In advertisement you’ll see that the effect of advertising wears out in a cycle. A lot of applications are of this type.
In 1974 or 1975 JASA invited us to write a paper. We felt we should cover all these consulting questions and put them all together. So we wrote this intervention analysis paper for JASA. I think putting the whole thing together enabled us to come out with all these dynamic models. This work only took about a week or two because we already knew all the materials.
When we were about to submit, I told George that this is a bit thin and we perhaps should do a bit more, like working out the algebra and implications of all these different filters and different interventions for the patterns. In the process of working it out, I say, “Hey, this can also be used for outlier testing or for missing observations.” So for the second part of the intervention paper I remember I spent a couple of weeks doing algebra like crazy. Now the paper has more substance (laughing). I don’t know how many people paid attention to the latter part, but actually the latter part later on has a lot of impact on all the things I deal with, such as outliers, level shifts and stuff like that. If you look at the second half of the paper, it’s all there somehow. It’s not the easiest way to read, but it’s there. So this is what happened to that paper.
Q: Right. Was the paper also your first connection to the environmental statistics?
GCT: Yeah, that’s right. I got into the environment in 1973. Thank you for reminding me of that. There’s another key motivation for that paper. See, in 1973 I got involved in the first ozone project. This is not the ozone of the stratosphere, but it’s the ozone near the ground, ambient ozone, and this is from Los Angeles. People from Los Angeles called and wanted our help.
What happened was that air pollution there was very bad. The local Air Pollution Control District set up the monitoring stations and collected the data. And they got together with industry. The Government had the data and got together with industry because it wanted to convince the industry to get together and change or pass the law that regulates the exhaust/air quality standard.
They wanted somebody to really analyze the data, but they wanted to exclude all statisticians from California, because those statisticians might be biased. They wanted somebody from far away who knows nothing about the problem, which is real and interesting.
There were two reasons they come to Wisconsin. One is the major guy in the industry graduated from the Chemical Engineering Department in Wisconsin and so he heard about the Statistics Department. The second thing is that the Government guy, who passed away a long time ago, and his name was Hamming (he had a brother famous in numerical analysis), had some connections with Wisconsin and heard about George Box. I remember what happened was that they called Wisconsin. Rich Johnson was the Associate Chairman then. And Rich tried to call Box, but Box was not around. So he called me. He says, “George, here’s an opportunity and do we want to do it?” So I talked to George. He was a little reluctant, worrying that we might get bad publicity because the money is from the oil industry. I said, “Well, why don’t I go take a look, talk to them, and see what happens?” I didn’t want to do it all by myself, so Rich Johnson and I flew to Los Angeles together and we talked to them. We were very impressed because these are Government people and then the industry, they’re all scientists, and they just wanted to do a careful analysis of the data.
We were quite convinced and we said we’d do it. And I remember this thing. As I was leaving, the guy gave me two rolls of tape. I said, “What is it?” He said, “These are all the data.” I said, “Are you going to tell us something about your problem?” He said, “No, if we tell you something, you will be biased” (laughing). I said, “No, you cannot do that. I know nothing about the scientific background of pollution and so forth. If you don’t tell us anything, there’s no way we can be useful.” And so that’s the beginning.
Then they came to Wisconsin and it was a group of about 5 or 6 scientists from the industry and Government. They spent two days lecturing Box and I and some students to get things started.
Intervention analysis then becomes a natural thing for them, because they have passed the law and wanted to know the effect of the law. So that’s why in the intervention paper we have pictures of the air pollution in downtown Los Angeles. (George then showed the interviewers some color plots of the air-pollution project that were very informative.)
Q: Could you say saying something about thecanonical analysis paper?
GCT: My work on canonical analysis started out in the 1960s, I think probably 1967 or 1968, when I listened to a talk of a colleague, I think his name is Gill Churchill. He was a colleague in Wisconsin’s Business School and he is a marketing man. He gave a talk about using principal component analysis to analyze some marketing data. And as I listened to the talk, I was thinking that, well, the results sound reasonable, but one thing we know in all this classical principal component analysis is that all of the observations are i.i.d. And here you get some business data, which are clearly not i.i.d. So I was wondering how that would affect, how the autocorrelations of this would affect, your principal components. And that was the thing that I had in mind. And so that’s always on my mind and I also looked a little bit, trying to learn principal component analysis.
So then when I was in England finishing the Bayes book with George, and also doing things with Cleveland on seasonal adjustment, I remember talking to George about this principal component problem. That’s how the whole thing started. I remember saying that, well, if it’s nonstationary, is it still reasonable to get principal components? So then the idea that comes about is to see if you have a lot of series and they look nonstationary, why do all these series look nonstationary? By that time I began having some experience looking at business stock prices and so forth. They all move in tandem. Business indexes often move in tandem. Now the question becomes: is there some underlying component which explains that?
Now one way is to do principal component analysis and another one is to think about transformation and try to explain the relationship with the past. This gets us to the canonical analysis. That’s how this whole thing developed that way. It’s from principal components, a combination to explain the underlying and latent fact that explains the nonstationarity. That idea is very simple, when you have all these nonstationary things that move in tandem, maybe there are only one or two underlying components that explain all the growth.
After we came back to Madison, we published the paper in 1977. This took a long time because our stay in England was 1970. So this and the 1989 paper with Ruey were the two longest papers (laughing). The first longest paper is the canonical analysis and the second longest paper is the SCM with Ruey and the third one is the SAR procedure with you (Peña) (laughing).
We went back to Madison and started to write the paper. The major difficulty for me is the nonstationarity stuff. I can find various distributions, but the first thing they assume is stationarity. Then you can borrow Wold’s work and other time-series asymptotics. But the thing is nonstationary with unit roots and differencing. There was little in the literature on this topic. I was trying to see what would happen to the canonical correlations both in theory and in practice. I know if the series is nonstationary, the limiting normal distribution breaks down, but how about when it approaches nonstationarity. It took me a long time. I remember I spent literally days and weeks trying to understand what would happen to the canonical correlations when you have roots approaching the unit circle. I dragged down the paper for quite a lot. Finally, I thought I understood it. I mean that the proof is basically right. And later on, I think, Greg Reinsel and others looked through it and proved it completely.
Once we knew what would happen to the canonical correlations when the series approach nonstationarity, I thought that we could publish the paper. But then the surprising thing was the following. I remember in 1977 Box came to my basement in Madison to work on the paper. As we reworked the Hog example and looked at the components, after you transformed them, you see one or two is very nonstationary, but we also see that there are two components very much like noise. First we dismissed that. All we really wanted are the one nonstationary components because they explained the growth. But then we looked at two noise components and played with them for quite a bit and tried various combinations to explain the components. Finally, we worked out that the two components, by making some transformation, you get some economic sense out of them. And after we got that, we say, hey, this is really interesting. The stable component was a complete surprise, because at the beginning we didn’t work that way. We didn’t think that way, either. We thought it’s important to find the thing that underlines the growth. But then it turns out that the stable components become very interesting at the end because they have economic meanings.
Then we began to realize this is very interesting that out of these nonstationary series linear combinations can be very stable. And I began to think that, hey, this may apply to all kinds of economic indicators because they work and move in tandem, although, as we know now, the problem is still not solved. What is the co-movement and all that stuff?
In summary, you can have combinations of nonstationary series to be stationary. In the end that becomes the key message coming out of the paper and out of the example. So that was the history of that. We worked for about seven or eight years. Oh, from the time the thing hit me ’til the time we published the paper is about nine or ten years. Many readers will realize that this phenomenon is the same as cointegration in econometrics.
I can remember, later on, the work with Ruey in the SCM thing, in the early 80s, we kept talking about there must be something we can do in applying the canonical correlation approach with transformation for model specification. As I remember, it was almost the day before Ruey left, before we parted in Madison. Ruey called me saying, “George, this is interesting.” At that time he didn’t call me George (laughing). You look at properties of the vector autoregressive model and write the model in a way that has canonical correlation implications. It is interesting to use canonical correlation to look at the problem that way. And that was the key observation that Ruey made and that later on led to the whole development.
Q: But by that time you had done a lot of work together on this thing about extended autocorrelation function.
GCT: Oh, yes.
Q: Can you say something about the work together with Ruey?
GCT: Yeah, I said that many times and said it in my letters and now I can say it again. From day one, I regard this guy, this gentleman, as a co-equal, although he was my student at the time. And we worked together really very, very well. There are certain types of students. The one type is that you give them a problem and you have to still end up writing the thesis for them. That’s one kind (laughing). The second type is that you suggest a good problem to a student and that student and you work together. The student does the majority of the work and you keep providing some insight from experience. That’s the way it’s supposed to be anyway. At the end, the student will usually know more about the subject than the professor, because he or she really spent the time working on that. And that’s the second type. At least the student did part of the work. And then the best type of a student is he or she wants to work on a problem. Ruey came to me and said he’d like to work on the model specification problem, the identification of a mixed model. I think I’m quoting the truth. I remember I said, “Yeah, I’m interested in that.” So that’s how we got to the EACF stuff. Because he wants to work on that problem and, of course, I happen to be very, very interested in that too, so it worked out. If you don’t have a good identification tool, the mix model never had a chance. It was not very much use in practice. It’s either AR or MA, because at the time you could not identify the mixed model. At the beginning, it was always just ACF, not even the PACF, because PACF is doing regression and it is a copycat. ACF is very intuitive.
I think I gave him one bit of good advice, which I take a lot of credit for. HA! HA! The time we worked out roughly the theory and a lot of stuff was the time at the end of the Chicago visit, close to the end. He could have, he had enough to write it up as a thesis. So in 1981 he could have gone to the market.
Q: In 1981?
GCT: That’s right, 1981. He had worked out the basic theory of EACF. At least we had the procedure and it seemed to work well. Then I told him that we would go back to Madison. The best thing is to not look for a job this year. The last thing we still have to work out and let’s go back and spend one more year, then we can get things all sorted out. And he agreed. Then we went back and in that year I think I probably spent about three-quarters of the time just with him. That’s it, because I had lots of grants to buy out teaching. The reason I suggest that to him was there was a prior example, Steve Hillmer. Hillmer graduated and stayed as a post doc for two years. These two years were really quite productive. I could pay him as a post doc because of my funding from the first ground-level ozone project and a grant from the EPA. We not only published the likelihood paper, which was part of his thesis, but also worked out all the details of the canonical decomposition stuff for model-based seasonal adjustment. So I knew if the person can postpone his graduation for a year or so and then look for a job, he would be in much better shape. So that’s what I suggested to Ruey and then with him it worked out really beautifully. By the time he left the Annals paper was already submitted and the JASA papers were almost about ready. Anyway, he was a co-equal right from the beginning.
Q: In 1981 you published this very well-known paper with Box about multivariate time series.
GCT: Right. That paper is interesting. In the late 1970s I started to teach multiple time series.
Q: Did you use any textbook?
GCT: No, no books. I developed a set of notes. It is interesting that the course was developed the same time that I developed an applied time series course in Pittsburgh with George. And I was taking the major part of the burden in doing that. The reason we could do that is that I had a great student, Mike Grupe, and the event had to do with the program development. What happened was that George and I started to teach time series in the early 70s and the late 60s, because there was a guy by the name of Bill Ellis at Carnegie Mellon. He marketed advanced statistic courses. He got George and Stuart Hunter interested in offering courses on experimental design. And then they got me involved a little bit; we even had a course on Bayes. Then the next thing to do is to teach a time series course and I started getting involved with that. In order to teach time series, you have to have a computer program for practice.
Let me just give you a little bit of the history of all this. You see, in school every student would have his or her own ACF program (laughing). In the late 60s when I was teaching time series, Dave Pack came and he started to put things together. Still, for a long time everybody just had an ACF program. There was a nonlinear estimation routine in Madison’s Computer Center, and every student had his or her own front program to use the nonlinear routine in estimating time series models. So each time you run one model is a day because the turn around time is a day (laughing).
Now when you talk about industrial teaching there’s no way you can do it that way. You must have a program. And Dave Pack was the guy who put all the ACF and PACF together and then started to put a nonlinear estimation routine together using the NREG program. I guess. Ruey probably still remember that, because by his time it’s all standardized.
Then one of the guys who came to the course in the Carnegie program was Mike Grupe, and he was working with CompuServe and CompuServe happened to give us computer time to develop the program. They sent Mike Grupe to learn this stuff. Mike came and I find he’s a remarkable guy; a good programmer and very interested in going back to school. So I persuaded him to come to Wisconsin to work a Ph.D. He quit his job and came to Wisconsin to work with me on time series.
After I came back from Taiwan in 1976, we planned to do the multiple time series both for school and for industry. But again, the first problem is the computer program. Generalization of the ACF and PACF, it is not hard and we got that quickly done. The difficult part is the estimation, because you need a real good programmer. The theory is not that hard. You look at it and consider the conditional likelihood based on the first few observations and stuff like that and then go to the MA part. At that time I started to get interested in exact MA likelihood with Hillmer. Mike Grupe was the key guy who programmed the algebraically very complex multivariate MA likelihood in the late 70s. His program is still the key element of the estimation program in SCA for multiple time series. I never had a programmer better than him.
You asked when did I get interested in multiple time series? Well, I got interested in multiple time series actually through canonical correlation analysis because that got me interested in general multivariate data. My background is in economics, economic data are mostly time series and people are obviously interested in dynamic relationships among series, and this is multiple time series. So, ever since 1970 in England I have been involved in multiple time series. I started to teach multiple time series in 1976 and we developed the program along the way. In the process we worked on a number of very interesting examples. So by the late 70s we thought we should write a paper to introduce the methods along with the package illustrated by these interesting examples.
One of the major drawbacks of the paper is the problem of identifying mixed models and we admitted that. And that’s ten years later, at least in my mind. But the good thing about the paper is that the examples show clearly how this approach works, because at the time one of the competing approaches is the Granger–Newbold and Box–Hugh approach that uses pre-whitening. Basically, they’re all saying the way you should do it is that you pre-whiten each series and then work on the residuals. I had troubles with that right from the beginning because I was in Larry Hugh’s thesis committee.
The first question I asked them is that, you can make this thing very messy. I showed them by working out simple examples of a bivariate MA. It is easy to identify bivariate MA models, but if you look at the pre-whitened series of each one, it’s a mess. So I was never convinced of the Granger–Newbold and Box–Hugh approach. In a way that paper was a little embarrassing, because basically we’d say that this replaces the Box–Hugh approach (laughing). Attacking the approach of Granger and Newbold was one thing, but to dismiss what Box and Larry did was something else, especially for me at Wisconsin (laughing).
Q: One very important thing about this paper is that it reduces the need to look at many pictures.
GCT: That’s right.
Q: It made the complicated stuff simple to understand, especially with the invention of those pluses and minuses that are very good.
GCT: I am glad that you raised that. That was one of the proudest moments (laughing) in my life! Again, it was from examples such as the hog data. We worked out the correlations and cross-correlations. First of all, by looking at the matrices, it’s a lot better than studying all the plots of auto and cross-correlations. It becomes relatively simple. To generalize univariate results to multivariate results, it only takes a minute. The main problem, however, is about how to comprehend the results. In fact, the reason that multiple time series and multivariate ARMA models were not much used is because of the way people identify the model. To identify a model, you look at all the cross-correlation and correlation functions. So for two series, you have three things to look at, for three series you have six things to look at. By that time your head started spinning (laughing), so for four you give up. If you look at the early papers, they were all like that. They just have plots and plots of auto and cross-correlations.
Q: I remember a course that Jenkins gave in which he tried to identify each element in the matrix. It was not easy.
GCT: Then we thought about looking at matrices. I was very happy about that. We’re in matrices for two series or three series. It is very simple if all the elements in the matrices are small. Then you can cut off and get order of MA models. So that’s fine.
When you looked at the hog data, each matrix is 5 by 5. I remember this was in the basement of Wisconsin, that large room we had there. I remember that afternoon that Box and I were looking at these matrices. We realized that even the matrix is not simple, because it has some 25 elements. Then we said, “Well, which one is big, which one is small?” So you started to look at things by comparing with standard errors and crossing out the insignificant ones. Well, we said, “Basically it will be just significant or insignificant and we generalize a little bit to plus, minus and dot.” Oh, once you see it, that’s it. I remember I was so happy that day. Now we have a good way (laughing). So you might say that’s the only thing that is new in that paper. The examples are very good examples. Well, the Gas–Furnace example is very embarrassing because that’s the Chapter 11 of Box and Jenkins. It’s very hard for him to put the example in the paper. Basically, it ditches Chapter 11. But we can do it.
That example convinced both him and me that the vector approach is worthwhile. But it was hard, because you can see that Chapter 11 of Box and Jenkins is actually very good theoretically. It solved a lot of interesting problems about the Coen, Gomme and Kendall by getting to pre-whitening and so forth.
It is correct to pre-whiten the input and then cross correlate with output. But it is terrible if you pre-whiten two inputs and then cross correlate them. It’s not the Box and Hugh stuff, it’s really Chapter 11 of Box and Jenkins. The 1981 paper didn’t replace the transfer function approach, but the paper comes out with a procedure that’s a lot quicker and can be readily generalized. Once you see that, the adopting of the multivariate approach to identify transfer function models and so forth is much more convenient.
Q: After the paper, the theory of integration and co-integration was developed. The co-integration was developed in economics by Granger and Engle, although afterward people have recognized that the Canonical Analysis paper used the same idea without naming the term co-integration. Is your interest in multiple time series trying to find ways to simplify the dynamic structure and how the idea of canonical correlation analysis comes into the work of model specification?
GCT: Well, that has a long history too. Remember, that was after we came here and Ruey came to Chicago to visit frequently. We finished several papers before we really got to the multivariate analysis. The JASA paper of extended autocorrelation function was first, then we had a univariate canonical analysis paper in Biometrika. I think that’s actually an important paper for understanding the multivariate SCM stuff. (SCM stands for scalar component model.) As I remember, we had to work all these out to understand the problem and the procedure clearly.
And on the multivariate thing, as I remember, we did something right here in this office. There were some key parts that were recognized on the blackboard here about the SCM stuff. That took a long time to really understand it. Yeah. That’s why it took so long to work out the theory and then work out a procedure, an integrated procedure, to sort out the double counting in canonical correlations and in redundant parameters.
Q: Is the sorting concerning the structure of multivariate ARMA models?
GCT: Yes, it is on the multivariate ARMA model and it took a long time. I still think that the iterative procedure of sorting out true structure can be simplified. Probably when we start to write a book, that’s the first thing I would like to sort it out.
Q: In other work that you did, during the time at the end of Madison, is the well-known paper on outliers and outlier detection. Is it the work that you did with Chang?
GCT: Right. Chang was working on outliers as an assistant.
Q: When did the paper start?
GCT: Oh! The thing started here in 1981. I have three interesting persons with me. That was Ruey, Ih Chang and then there’s this guy Ahtola working on nonstationarity with complex unit roots. At that time, Dickey and Harza, both students of Wayne Fuller, worked on unit roots, but it’s one or multiple unit roots, that is, the first and second difference in time series. The case of complex roots was not done. Ahtola and I worked on the distribution theory, because Ruey and I did the consistency of the least squares estimates of all roots on the unit circle.
But then we got to this nearly nonstationary stuff. We found this very interesting. There was an interesting paper in Biometrika on the nearly nonstationary case using the score as the statistic. If you look at a score, you can work out its distribution and then you can see as the root goes to one, the distribution breaks down. As we worked out the theory, I thought it is interesting because it’s something I can teach to students. And that’s the nice thing about that paper, I thought. Akaike also likes that paper very much. I remember I talked about it in Singapore. He liked it and said that this is simple to explain to students; all the student needs to know is the quadratic forms and chi-squares distribution and then they can see by their eyes how interesting it is. So that was with Ahtola.
Q: Which paper is this?
GCT: This is the 1984 Biometrika paper on “Parameter influence about nearly nonstationary first-order autoregressive models.”
Later on other people worked on this in different ways, such as Wei and Chan. Ih Chang was working on outliers that were a thorny problem in developing a program for time series because when you analyze real data there are always some outliers. The1968 paper on outliers uses a Bayesian approach, but that was difficult because at that time computation was difficult so we didn’t even think about that approach for time series. So when Ih Chang was looking for a thesis problem topic I suggested to her to looking into outliers, and said that this is one problem we always talk about. She looked at it. The first paper she studied was the one by Fox. Fox defined two types of outliers, the additive outlier (AO) and the innovational outlier (IO). But the paper was a mess.
As I remember, I was looking at the AO and IO of Fox and tried to relate the stuff. Fox’s paper was published in 1972, but I didn’t know about it when I was writing the intervention paper. I think Ih Chang discovered Fox’s paper. At the time the dominating approach for handling outliers is the Huber stuff. It was quite complicated because it completely goes away from normality. I like to stay in normality and figure out some way to test for outliers. The AO and IO idea seemed interesting. As I remember, it was in Arnold Zellner’s study, which was converted from a garage, that one night I looked at them and realized that we can relate Fox’ approach to the intervention analysis. Once I see that all I have to do, with AO and IO, is just to simply grind out their estimates from the residuals using the psi weights and pi weights together. Once you got that far, the detection procedure becomes obvious. Of course, in her thesis, Ih Chang did sort out different types of outliers, how to compare them, the distribution theory and so forth.
Q: Why did the paper take so long to be published?
GCT: Well, she graduated in 1983. And the last part of her thesis was also quite good, because she also worked out the stuff about nonstationary series and changes in level. For a given stationary series, even white noise, if you have a level shift in the middle and there are a large number of observations before and after the shift, then the sample autocorrelations are all close to one. We thus recognized the level shifts and related stuff. But anyway, the thesis was submitted to Technometrics in 1983 for publication. It came back saying we needed to do some revision. At that time, I was here already busy developing the business statistics program and courses and she had a tough time with her job situation. When she graduated she got an offer to go to work with Professor Der-An Shu in Milwaukee, but she had to turn it down because she was already apart from her husband a couple of years. Her husband earned a Ph.D. in Wisconsin and got a very good job at Kodak and so she had to restrict her job search to around his area and that was very difficult. Her first job was teaching at a small college there. She was not happy and moved to Texas working for IMSL for a while. It was impossible for her to have time to do the reversion and simulation given her situation and I was busy around here. So the work was put in the drawer for several years. Also, at the time we published a summary of the work in a paper with Bill Bell and Steve Hillmer in the Census Volume. In fact, people were already using the detection procedure. Ruey got interested and published a paper in Journal of Forecasting, Bill Bell developed a program at the Census Bureau, and the procedure is also available in the Scientific Computing Associates (SCA) program. In other words, a lot of people have been using the procedure, but the paper is never officially published. It’s just in her thesis or a technical report. Finally, when Chung Chen got his thesis done, I thought that with Chung we might be able to get the needed simulation done. Chung agreed and did the simulation. It was quite involved and he spent a great deal of time, so Ih Chang and I thought that he should be there as a co-author. That’s how it became a three-author paper, and we sent it back to Technometrics in 1988. We almost couldn’t get it published, because in a way the procedure’s already known (laughing) and people are using the procedure. As a matter of fact, the first example we used in the manuscript is the variety-store data, but we cannot really use it because it was already in the Census Volume. So finally we used something else.
Q: OK, maybe we can move on. What were the major developments when you moved from Madison to Chicago in 1982?
GCT: There are two major developments. One is the Ozone Project that I got involved in and continue to get involved in, and the other is about the International Chinese Statistical Association (ICSA). I think these are two major things that probably should be covered. Which one would you like me to talk about first?
Q: Any one is fine.
GCT: Well, I mean what are the specific questions that you want me to answer?
Q: Perhaps you can talk about the ozone project.
4 The Ozone Project
GCT: What happened was that Bill Hill talked to me about an ozone project in 1978 or 1979, I think it was 1978 when he first called me. He had worked on the stratospheric ozone and the project was getting a lot of press and became an important public issue. How does the CFC relate to the depletion of ozone in the stratosphere? At the time I was just getting out of the Los Angeles ozone project, the ground level ozone and air pollutant stuff and was also involved with all the Census Bureau stuff, so I told him I could not really do it, because the Census things already costing me quite a bit of time. So he went away and a year later he came back again. He said he really need my help in the sense that he can do time series analysis, trend analysis, intervention analysis and all that, but he worked in the industry and was concerned about the credibility problem. He needs some sort of academics to really do good analysis and make the results credible. A very important decision will be made because if you stop the use of CFC, it would change a lot of stuff we use like refrigeration and the coolant in air conditioning.
So I got the project and said OK I’ll give it a try. I was first looking for somebody to work with me on that. Instead of finding some post doctors, I looked for a younger faculty. I talked to Jeff Wu and he thought that was a bit too much, too big a project to kill his time. And the second person I tried to persuade was Greg Reinsel, who was a new faculty in Madison teaching 709-Mathematical Statistics. He is a time series guy and he knows all the ARMA models. So I tried to persuade him that this would be a great opportunity for him to look at real data. He agreed. Then we had a post doc from Taiwan and Doug Nichyka (who became a very famous statistician at North Carolina State and now at NCAR) and another student, Rich Lewis. So with two or three students, we got together to start the project. That’s how thing began. At the beginning the project was supported by the CMA, the Chemical Manufactures Association. That was Bill Hill. He worked with us. Then pretty soon Lane Bishop also joined the industrial team.
We met with industry people and people from NASA, EPA, and NOAA and Canadian Environmental Service regularly once every three or four months. This gradually develops into a team of atmospheric scientists, modelers and statisticians working on the atmospheric ozone and later temperature problems. They called it a Tiger Team. Basically, if we want to really understand the problems, scientists need statisticians and we need their scientific input. Over the last two and a half decades the team has published over 30 papers, most in top rank geophysical science journals, and have achieved quite some impact in the scientific community.
5 ICSA and Statistica Sinica
Q: You are deeply involved in the International Chinese Statistical Association and are the Founding Chair-Editor of the journal Statistica Sinica. Can you mention briefly about ICSA and the journal?
GCT: The origins of the ICSA and the journal Statistica Sinica are somewhat intertwined. I first attended the ASA annual meeting in 1961 and, to my surprise, there were only three Chinese statistical experts, two in economics and one in biostatistics. Things started to change in the late 60s and early 70s as increasingly larger numbers of Chinese/Taiwanese math. students came to study statistics in the US. We bought a house with a basement in Madison in 1967 and started to invite Chinese statistics students and their families to the Thanksgiving dinner in the basement. This “dinner festivity” grew to more than 80 participants and lasted for more than 20 years. Many students came to prepare the food the day before Thanksgiving and help cook dinner the next day. We have very nice memories about these dinners. As a matter of fact, many former students know my wife much better than me because of the dinner and opportunities to get together. It was at the 1968 dinner that I realized we perhaps need an organization to promote communication and collaboration among Chinese statisticians. We started with an informal association called the Chinese Statistical Society in US. With the help of 8–10 enthusiastic volunteering students, a hand-written bulletin that contains the directory of Chinese statisticians was published in the following year. The principal student leaders for the first two years were Austin Lee and Der-An Hsu. After the third year I thought that it is better for the Society to broaden its base by rotating it around the States. I asked Professor Y. S. Chow of Columbia University for help. He recruited Min-Te Chao, later the Founding Director of the Institute of Statistical Science, Academia Sinica, to be responsible for the administrative activities of the Society. At that time, Chao was at Bell Lab. Without the help of graduate students, the publication of the annual bulletin quickly became an impossible burden for any single individual. Three years later, the Society moved back to Madison and was renamed Chinese Statistical Association in America.
Besides the bulletin, Chinese statisticians got together to have dinner each year at the annual ASA meeting as a means to get acquainted with one another. As I recall, this started in the early 1970s at the St. Louis meeting with Hubert Chen as the first organizer. It began with 10–20 people, but grew quickly to more than 100 by the beginning of the 1980s. It also became a regular event with an informal meeting in the late afternoon of Wednesday followed by the dinner. With the expansion, we started to wonder whether such an arrangement is effective and sufficient for promoting the communication among Chinese statisticians. The final push to have a formal association has to do with Statistica Sinica.
Three key developments occurred in 1986. First, I returned to Taiwan for the Academia Sinica members meeting and had a chance to meet with Director Chao and other statisticians. Chao suggested that the Institute is sufficiently mature and has budget to launch a new statistical journal. We felt that to publish a new journal, it is best to involve all Chinese statisticians inside and outside of Taiwan. Second, the 1986 ASA meeting was held in Chicago and Jia-Yeong Tsay suggested at the afternoon meeting that the time is ripe for the association to be formalized. He, Grace Yang and Gordon Lan formed a committee to draft the constitution of ICSA in a spirit similar to the ASA Charter. Third, at the dinner James Fu told me of his plan to launch a new statistical journal. I suggested to James and Min-Te that it seems better to combine their efforts to establish a world class journal. They came back to me about the Christmas time that year saying that they decided to cooperate and wanted me to formally launch the journal. To make the long story short, I consulted with several senior Chinese scholars, including the late Professor Shein Ming Wu from Madison. They were all very supportive and gave me valuable suggestions, including having a strong local support at Chicago. As you know, Wing Wong was in Chicago then and he gave me his whole-hearted enthusiastic support. Ruey Tsay and Xiao-Li Meng also came to Chicago shortly after. Furthermore, I also obtained enthusiastic support from Smiley Cheng, T. L. Lai, L. J. Wei and Jeff Wu. Thus, I decided to accept the challenge. An editorial board was formed in April 1987 and I served as the Chair-Editor. Because the Institute cannot sign an agreement with an informal association, the ICSA was formally established in 1987 to jointly sponsor the journal named Statistica Sinica. I was elected as the first president of ICSA for a one year term to help get it started.
Over the last twenty years, ICSA has grown to become one of the largest statistical organizations in the world. It has not only provided services and communication among Chinese statisticians in North America, but also helped promote statistical theory, application and education among Chinese communities in mainland China, Hong Kong, Singapore and Taiwan. To this end, it has held international conferences in Hong Kong, Taipei, Beijing, Kunming and Singapore. Another success story of ICSA is the annual Applied Statistical Symposium. Many members of ICSA are biostatisticians working in the pharmaceutical industry and in the federal agencies such as FDA and NIH. Jia-Yeong Tsay and Gordon Lan initiated and organized a successful half a day meeting called ICSA Biopharmaceutical Statistics Symposium in Washington, DC in 1990, and it was expanded to include other areas beside biostatistics and changed into the current name two years later. This symposium has become an annual event and grown into a three-day affair attracting more than 200 participants from around the world.
The twenty year history of Statistica Sinica is equally lustrous. The first issue, appeared in 1991, was immediately recognized and highly praised, and the journal has been widely supported by colleagues and now is generally regarded as a top ranked journal in our profession. Much of the credit has to go to a stream of prominent chair editors including Jeff Wu, C. S. Cheng, K. C. Li, Jane Wang, X. L. Meng and currently Peter Hall.
6 Making Statistics More Effective in Business Schools Conference
Q: Tell us about the Making Statistics More Effective in Business Schools Conference.
GCT: What happened was this. In the mid 1980s, on the one hand, there was this quality movement that began to happen. It attracted a lot of attention because at the time the American industry was going through a pretty tough period. Got beaten up by the Japanese on manufacturing and all this. Also, at the same time, the statistical profession started to really expand and to get into many different areas. A particularly important area is engineering. In order to develop effective courses in engineering, you have to work with engineers and Bob Hogg at the time was pioneering this effort in Iowa. He organized a conference, a lot of people attended and focused in on how do we offer more, better courses for engineers.
I remember, in 1985 I was invited to New York to attend one of the quality conferences. On my way there I was thinking that now with a good program going in Chicago Business School, we should get together with other teachers of statistics in business schools because we’re the largest school, and have a forum to discuss our common experiences and what kind of problems we have. So on the way to New York I was thinking about all this on the plane and I said, well, maybe I should consult with Bob Hogg and see what we should do. It was quite interesting because when I got to the conference site and saw Bob, before I opened my mouth, he said, “George, I want to talk to you.” I said, “Well, there’s something I want to ask you too.” When we got together he was talking to me about his conference and things. He said that he was doing that and thought that somebody should do that with business and economics. He was talking about me. And I said that’s exactly the kind of thing that I thought would be good to do. He said, “Well, I’ll help you with that.”
When I came back I talked to Harry Roberts about this idea. Harry has been my mentor in Chicago GSB and I’ve known him for many years. In fact, when I graduated the first time I came down to Chicago, I went to visit with him and gave him a copy of my thesis.
Q: When did you meet Harry Roberts?
GCT: In 1962 and he has been always very encouraging to me ever since. Anyway, when I came down he was a senior guy and had a tremendous reputation for his contributions to the school. Whenever I have any plans or any ideas, he’s the first one I’ll consult with. And he’s always been very encouraging and helpful, as also Al Madansky.
So I talked to Harry. I said, well, this is something that seems worthwhile doing. Would you be happy to do it together? He immediately thought it was a great thing. In addition to Harry and I, we need a young person, and George Easton agreed and the three of us got together.
In order to organize this conference, we first of all need some support from the school. So I went down to the Dean’s office to get help. Harry Davis was the Deputy Dean. He was very helpful and promised money. We thought that we want to do it, not just in Chicago, but each year at a different place. First of all, it’s pretty tiring to do every year, and second thing is that it’s not very helpful. The helpful thing would be to go to different places and have this forum in different places and different universities. But, on the other hand, at the beginning I don’t know how many will participate and that we might have to do it more than once. Then Harry Davis said, “How often?” I said, “Well, maybe five years and then we can probably get us established.” So he said, “Well, George, OK, we’ll support you for five years and give you money to support this three to five years.”
So with all of that, we got together and there were two things. One was to develop a directory and Harry Roberts took the initiative to go through the ASA directory, literally page after page, to find out from the directory who are teaching in the business schools. Just from people’s locations and addresses, he literally did it that way (laughing). In the first year we really did a grand job. We covered all the application fields in the business world, plus quality and industry. We had to develop connections with business and also with our colleagues in the function area of the school. So we’d contact people in finance, accounting, marketing, management, quality and industry. These are all the elements of that two-day meeting.
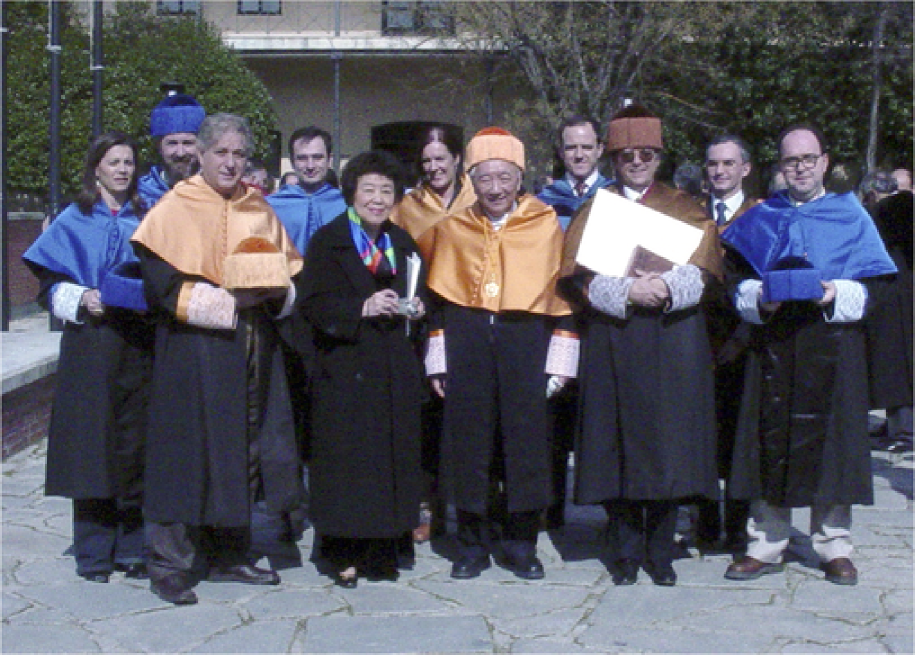
We got the biggest classroom we had. At that time we had about 130 seats. So we kept worrying about how do we fill the 130 seats. And we sent announcements to everywhere we could find out and got a school that got a list of other business schools. Now the school gave us a few thousand dollars to organize the conference. Did you know what happened? It’s just totally incredible, because we filled up the room, every seat. We got people from 66 institutions in America and outside, for example, like Hong Kong. And there was somebody from Europe too. We also got a very good business representation, even from some large companies. We organized a dean’s session. Jack Gould was the Dean at the time and then we had the Wisconsin’s Dean and I think Stanford’s Associate Dean or someone like that. And we also got people like Schlaiffer and John Pratt from the Harvard Business School. This was in 1986, and I think the second one was in New York at NYU.
Q: Was it in 1987 or later?
GCT: Every year. So far we’ve never had to do it again. There are always people wanting to do it. The second year was in New York and the third year in Madison, Wisconsin. Then one year it was in Ann Arbor and so forth going around. The first few years were very, very successful. In the conference we had two types of sessions. One type is industry and area specific, and the second is teaching. How do you teach a basic course? That was where the tradition continues. Of course, the first conference was the most successful because we covered almost all fields, and it’s the beginning. After that we have an area of concentration every year, but teaching is always an important element of that conference. That’s sort of continued down to present time.
Q: It’s been running for 15 years now. What type of impact has it had?
GCT: One of the major impacts is on the textbooks. Many of the textbooks that came out for business statistics in the early 90s all acknowledge the inspiration they experienced in these conferences. So it has a major impact on textbooks. Also, for a lot of people their teaching has greatly benefited by their going to the conference, and sharing experiences. That’s probably the major impact.
7 Time Series Conferences
Q: Another conference that you have been very much involved with is the time series conference.
GCT: The time series conference was like this. Arnold Zellner is the one who established the Bayes conference in 1970. It runs twice a year and it is still going. I think about 1977 Arnold and Bill Wecker got together to do one in time series. I remember I came down to Chicago to participate. In 1978 we did that in Madison. In 1979 it was down in the Census Bureau in Washington, DC, and it disappeared in 1980. When I came to Chicago in 1982, the first thing I did was talk with Bill Wecker. He’s a great guy. I said, well why don’t we get together to revive this? So Bill got the money from NSF through NBER to finance it for five years and we organized the meeting in Chicago in 1983. It was quite successful.
Then Bill Wecker left Chicago. When he left, I said, well, we organized and worked so well together,I would certainly hope you can continue to participate and keep this going. And he promised, so we divided the job such that he kept the money coming in and I am responsible to locate a place each year. We went to all sorts of interesting places, Davis, San Diego, Carnegie Mellon University, Madrid, Vienna and Taiwan and all that. Let me just say this though. That was one of the proudest things I was associated with because this annual conference really mixes time series statisticians and econometricians together. The conference is always very well attended by excellent people.
8 Future
Q: Maybe we can move to talk about more general things. We’d like to know how you see the future of statistics as a profession.
GCT: I’m basically an enthusiastic guy. I do think that the statistics profession has a great future, if we do it right. And the reason is that the whole world is getting more and more quantitative. In business and in science, no matter what field you’re in, it depends more and more upon quantitative information and then how do you collect them? How do you analyze them? I’m very enthusiastic because you can see the need for statistics all over in biological sciences, in natural sciences, in physical sciences, in environment and meteorology and, of course, in business and economics. Every field in business, in marketing, in production, in finance, I don’t think they can operate without statistics. So the use of statistics has become more and more widespread, and the need for statistics is just increasing, there is no end. On the other hand, if we don’t rise to the challenge, then other people gradually will take over our functions. An example is data mining. A problem could be the training of pure mathematical statistics; it’s a long story about this. The feeling I have is that if you look at the growth of our profession, we really don’t grow that much, right? I don’t think the size of the ASA is more than 20,000. Is that right?
Q: Slightly less, about 17,000.
GCT: Close to 20K. But I remember even 10 or 15 years ago when Barbara Bailer was the President, the number was about 15,000. This was a long time ago, and we didn’t grow that much. Very few places have undergraduate statistics program. And if you look at the graduate program, the Ph.D. is, of course, naturally not that big. But if you look at a Master program, it’s not big, either. Our students are very bright, but when they go out to work, they’re at a disadvantage because they don’t know any application areas. A few years ago I thought we should change our program and make all students to have one area of application. This was basically done in Carnegie Mellon, in the statistics program, but the most successful place is Columbia. They come out with the same idea independently and the Statistics Master program consists of 8 courses or something like that. You can do it in one year plus two summers. Out of these 8 courses, only 5 are on statistics methods and theory, the other three are concentrated in their application area. This program saved them, from less than 10 students in three years they got up to about 70 students, and now it is well established.
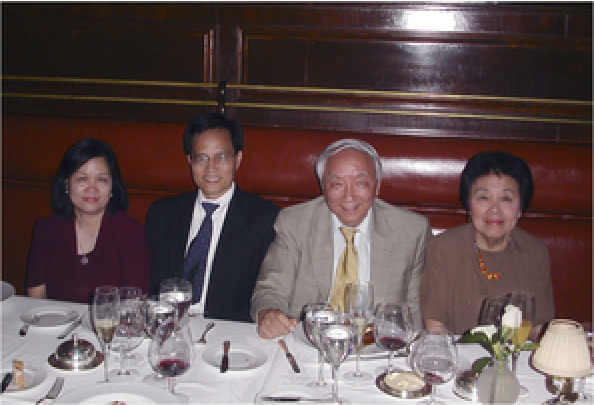
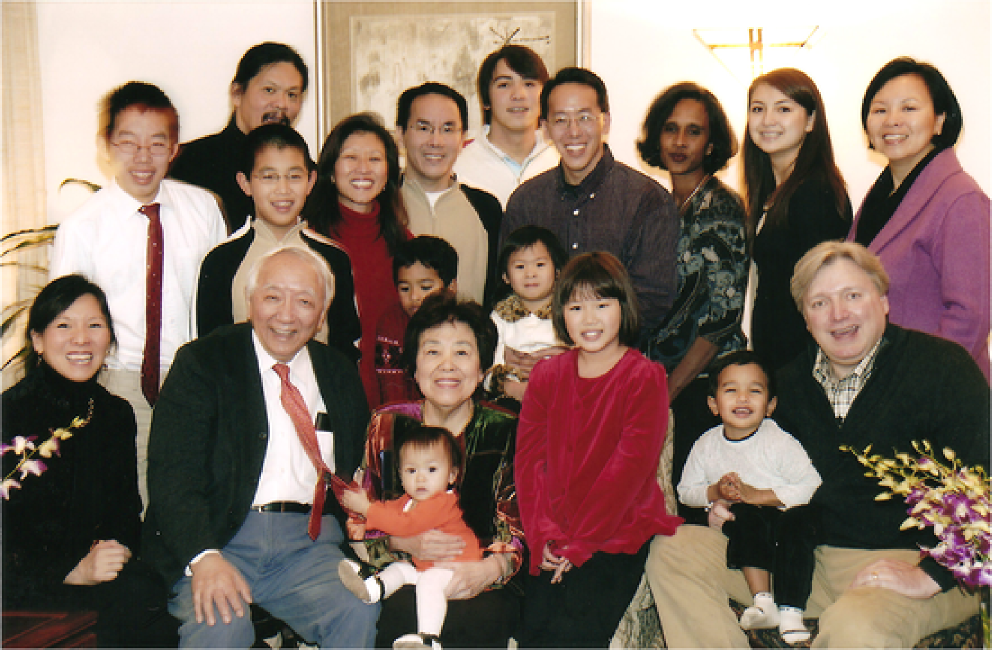
So I think it’s useful to establish some kind of joint Master program with an area of concentration in application. My background is in economics, but when I get involved in environmental data my application background in economics actually helped me to get into other areas. So that way we can probably expand our Master program.
Q: What are your plans for the future?
GCT: I think that what I’d like to do for the rest of my working career is to go back to spend more time doing research, because I think in the last ten years or so I have spent way too much time developing programs. For instance, I have been working with Ruey Tsay and Rong Chen to establish in Taiwan and Beijing a quantitative finance department with a program in which students have a basic good training in statistics and then get into this important area.
Q: What kinds of things do you like to do and enjoy when you are not working.
GCT: Oh, basically I have a very good family. I have a wonderful wife. We’ve known each other more than 50 years now (laughing), which is rather unusual these days.
Q: And your wife, Barbara, she’s very much involved with music, right?
GCT: She is very much involved with music and she sort of gave up her music career in the early years when we had to go through graduate school and then the first few years because we had kids quite early. And we have four kids. They are all grown up now. They are doing well. So I have a very, very wonderful family life.
Q: How many grandchildren now?
GCT: There are five now. Hopefully there will be more to come. So I am enjoying the third generation; it is a great joy.
When I was young I used to play a lot of bridge and also learned to play golf. But in the last 30 years I have basically given it all up. I was fortunate, because I was really brought up in one culture and then adopted another culture. I still go back to China and Taiwan very often. So I continually kind of like live in both, both are part of my life. When I go to China or Taiwan I have a feeling that I’ve never left America, and when I come back to America, I feel that I have never left Taiwan or China. I don’t play any music, but I enjoy music and also enjoy art and literature, from both cultures. So I think that I have lived a very fruitful life (laughing) and am looking forward to many more years (laughing) hopefully.
Q: OK, very good. Is there anything that you would like to add?
GCT: I just want to thank both of you for listening to all this.
Q: OK, thank you very much George, and we all miss Barbara who passed away in March 2008.