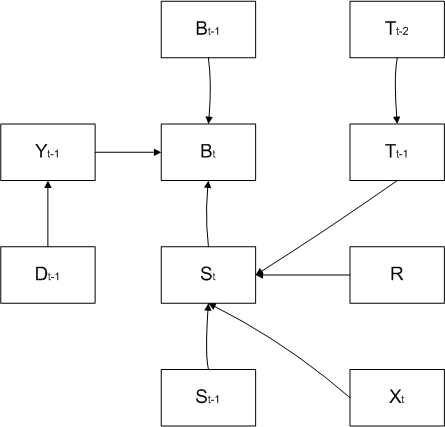
Figure 1: This diagram depicts the underlying causal structure of the model. See the text for the definitions of D,Y,B,T,S.
The model concerns the following random variables:
•
A discrete Markov process which records the behavioural state of the debtor during the time period - measured in months. The state is measured in the middle of each month.
•
A discrete-valued process which records the strongest debt management intervention that was applied to the debtor during the time period .
•
an entity-specific variable, gives the final result of the debtor’s most immediate previous debt case - NA, paid in full, liquidation/bankrupty, full write-off, partial write-off.
•
is the economic state at time period . This measure is obtained through clustering a pertinent collection of economic variables: change in CPI, change in unemployment, change in the average weekly wage, etc. The underlying variables for are varying quarterly, so will be constant in blocks of three months.
•
is a latent discrete Markov process which categorizes debtors in a time period into the behavioural scheme that governs the generation of . The model supposes that influences , and hence influences indirectly.
•
is a positive real-valued variable, given by
•
is a categorization of into - this is governed by a parameter that needs to be inferred. the notion is that as a debtor gets closer to being paid in full, its probability of making a large lump-sum payment to clear its debt may change.
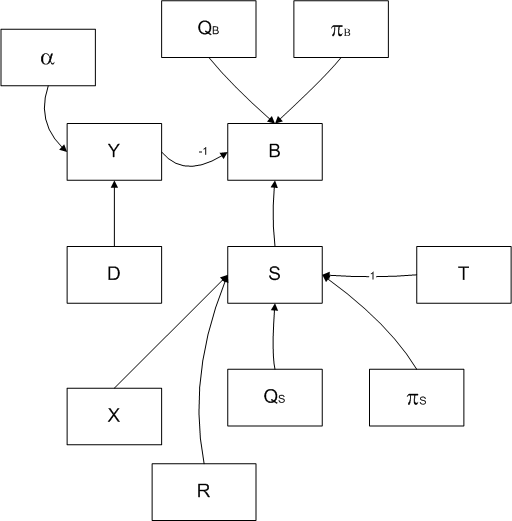
We introduce a set of parameters as follows:
•
: defined by if and only if .
•
: a list of transition matrices, one for each combination of values of .
•
: a list of initial probabilities, one for each combination of values of .
•
: a list of transition matrices, one for each combination of values of and .
•
: a list of initial probabilities, one for each value of .
Figure 2 depicts the causal structure of the variables and the parameters - we have now expressed each of the variables as a vector of length as long as the number of observation periods.
Figure 2: This diagram depicts the underlying causal structure of the model, including the parameters. Refer to the text for definitions of the parameters
Every debt case begins at a time period and ends at a time period . If the debt case is indexed by , the the beginning is and the end is . There will be observations of , , , and from through to .
The log-likelihood of observing a single debt case is maximized when we maximize:
We apply the EM algorithm to , taking the expected value of conditional on and the -th iteration of the parameters , .
For this we define the responsibilities for each debt case, , and time , :
for ; and for ,
It is clear that , or if , - hence we need only compute .
This is done using the Forward-Backward algorithm:
1 Calculating
This calculation is standard, but we present it for completeness.
Define the following four sets of probabilities:
•
•
, .
•
,
•
,.
Then
and
with . The normalizing constants can be found by noting that and .
Having obtained (the forward matrices) we can calculate the backward matrices as follows:
Set .
For ,
2 Update equations for the M-step
The formulas that follow are the result of straightforward calculations.
Note that depends on an unknown value of . The approach will be to fit for a range of values of , and to choose the that gives the maximum value to: