A Lyman- Galaxy at Redshift in the COSMOS Field††thanks: This paper includes data gathered with the 6.5 meter Magellan Telescopes located at Las Campanas Observatory, Chile
Abstract
Lyman- emitting galaxies can be used to study cosmological reionization, because a neutral intergalactic medium scatters Lyman- photons into diffuse halos whose surface brightness falls below typical survey detection limits. Here we present the Lyman- emitting galaxy LAE J095950.99+021219.1, identified at redshift in the COSMOS field using narrowband imaging and followup spectroscopy with the IMACS instrument on the Magellan I Baade telescope. With a single object spectroscopically confirmed so far, our survey remains consistent with a wide range of IGM neutral fraction at , but further observations are planned and will help clarify the situation. Meantime, the object we present here is only the third Lyman--selected galaxy to be spectroscopically confirmed at , and is – times fainter than the previously confirmed Lyman- galaxies.
1 Introduction
Lyman- emitting galaxies provide a valuable probe of reionization, because resonant scattering of Lyman- photons in the intergalactic medium (IGM) can suppress the observed Lyman- line by a factor of for any neutral fraction (Malhotra & Rhoads, 2004; Santos, 2004). Such strong flux suppression will cause a change in the Lyman- luminosity function that should be obvious— especially since Lyman- galaxies show little evolution at , either in luminosity function (Dawson et al., 2007; Zheng et al., 2012) or physical properties (Malhotra et al., 2012). Early studies concluded that the IGM neutral fraction was already small at (Malhotra & Rhoads, 2004; Stern et al., 2005). More recent work has established the Lyman- luminosity function at both and to considerable accuracy (Ouchi et al., 2010; Hu et al., 2010; Kashikawa et al., 2011), showing a modest but statistically significant difference between these observed Lyman- luminosity functions: The luminosity function is below that at , and the difference can be adequately characterized by a pure luminosity evolution by a factor of (Ouchi et al., 2010).
Yet, other Lyman- based tests for reionization— including the apparent spatial clustering of Lyman- galaxies (McQuinn et al., 2007), the minimum ionized volume around observed Lyman- sources (Malhotra & Rhoads, 2006), and Lyman- line profiles (Hu et al., 2010; Ouchi et al., 2010)— show little evidence for neutral gas at . This leaves an open question— is lower Lyman- luminosity function at due to neutral gas, or is it an intrinsic evolution in the galaxy populations?
To distinguish between these possibilities, we can look to still higher redshifts, where the IGM neutral fraction should be higher and its effects on Lyman- stronger. The highest redshift readily accessible to Lyman- searches using CCDs is , in the 9650Å window in the night sky OH emission spectrum. We are pursuing a 9650Å narrowband survey using the IMACS imaging spectrograph on the 6.5m Magellan I Baade Telescope at Las Campanas Observatory (Hibon et al., 2011). We surveyed 465 square arcminutes, corresponding to . After a careful selection, we found 6 z6.96 LAE candidates (Hibon et al., 2011). To confirm whether these are real LAEs, we obtained multi-object spectra with IMACS. In this Letter, we present the spectrum of LAE J095950.99+021219.1, which was identified as a candidate redshift Lyman- emitting galaxy (candidate LAE 3) in Hibon et al. (2011). Our spectroscopy reveals a single, isolated Lyman- line at redshift .
Throughout the paper, we adopt a CDM “concordance cosmology” with , , and .
2 Spectroscopic Observations and Analysis
2.1 Observations
We observed our candidate Lyman- galaxies using the Inamori Magellan Areal Camera and Spectrograph (IMACS) on the 6.5m Magellan I Baade Telescope on the nights of 29–30 December 2010, and 8 February 2011. The February data were of lower quality and are not used here. We used custom multi-slit masks, shared between two primary observing programs. We selected the f/2 camera and the 300-line red-blazed grism with 1” slitlets as the best compromise between areal coverage, spectral coverage, and spectral resolution.
Observations were split among five slit masks (two per night in December, and one in February). The time per mask and observing conditions are summarized in table 1. While the position angle of the masks were not all identical, the data were taken without dithering the telescope. Moreover, the targets were centered on their slitlets, and LAE J095950.99+021219.1 is compact compared to the seeing. This allows us to combine all of the spectroscopic data into a single 1D spectrum (see below).
| Mask ID | Observation | Number of | Time per | Seeing |
|---|---|---|---|---|
| date (UT) | exposures | exposure | (approx) | |
| COSMOS1 | 30 Dec 2010 | 4 | 1800 | 0.5–0.9′′ |
| COSMOS2 | 30 Dec 2010 | 3 | 1800 | 0.5–0.9′′ |
| COSMOS3 | 31 Dec 2010 | 4 | 1800 | 1–1.5′′ |
| COSMOS4 | 31 Dec 2010 | 3 | 1860 | 1–1.5′′ |
| COSMOS-Feb | 8 Feb 2011 | 5 | 1800 | 1.2–2′′ |
2.2 Data Reduction
We performed initial data reduction steps using the COSMOS software package111Note the double meaning of the acronym COSMOS. We deny any responsibility for the ensuing confusion.. COSMOS steps include bias frame subtraction, spectroscopic flat fielding using continuum (quartz) lamp exposures, and wavelength calibration using arc lamp exposures. COSMOS also sky-subtracts the spectra, using the Kelson (2003) algorithm to remove night sky lines. Finally, COSMOS extracts a 2D, rectified spectrum for each slitlet.
We performed subsequent steps in two ways, either (a) combining exposures from each mask separately, and then combining results from different masks; or (b) directly combining all exposures from multiple masks.
Treating masks separately gives four 2D spectra of LAE J095950.99+021219.1 from December, and one more from February. Most of these 2D stacks show a weak but visible emission line in the spectrum of LAE J095950.99+021219.1. We next combined the four December spectra into a stacked 2D spectrum comprising our best 7.05 hours of data. To do this, we first averaged the four 2D spectra. Next, we made a median-combined stack. We then subtracted the two, and computed the (sigma-clipped) noise level in the difference. Finally, we constructed a hybrid stack, using the value from the average stack almost everywhere, but the value from the median stack wherever the difference between these two stacks exceeded . This yields a lower noise estimate than the median, yet remains more robust to outliers than the mean. The emission line becomes readily evident in this combined stack.
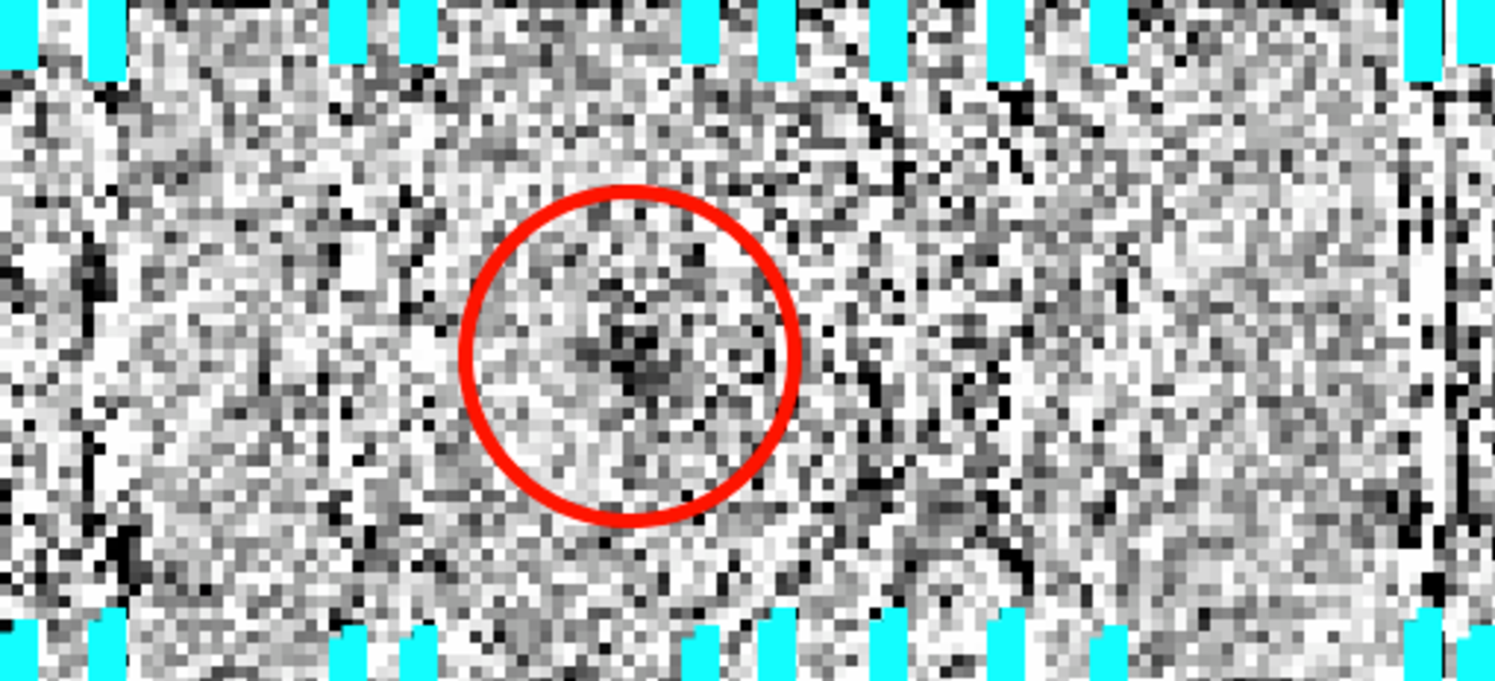
To test the robustness of our results, we also combined all December exposures in single 14-frame stacks, using various outlier rejection schemes (median stacking with 3- and 5 rejection, and average stacking with 2.5 rejection). The emission line remains comparably significant in all of these stacks. The stacked 2D spectrum around the emission line, using average stacking and rejection, is shown in figure 1.
We also made stacks by bootstrap resampling, stacking 14 exposures selected randomly with repetitions permitted. We remeasured the flux at the location of the detected line, using aperture photometry in the 2D stacks. The bootstrap fluxes were of the “normal” stack flux for a 10-pixel diameter (Å) aperture, and for a 14-pixel diameter (Å) aperture. Among 1000 bootstrap simulations, the lowest measured fluxes were 77% and 66% of “normal” for the 10- and 14-pixel apertures. The observed line is therefore not a fluke caused by a handful of exposures.
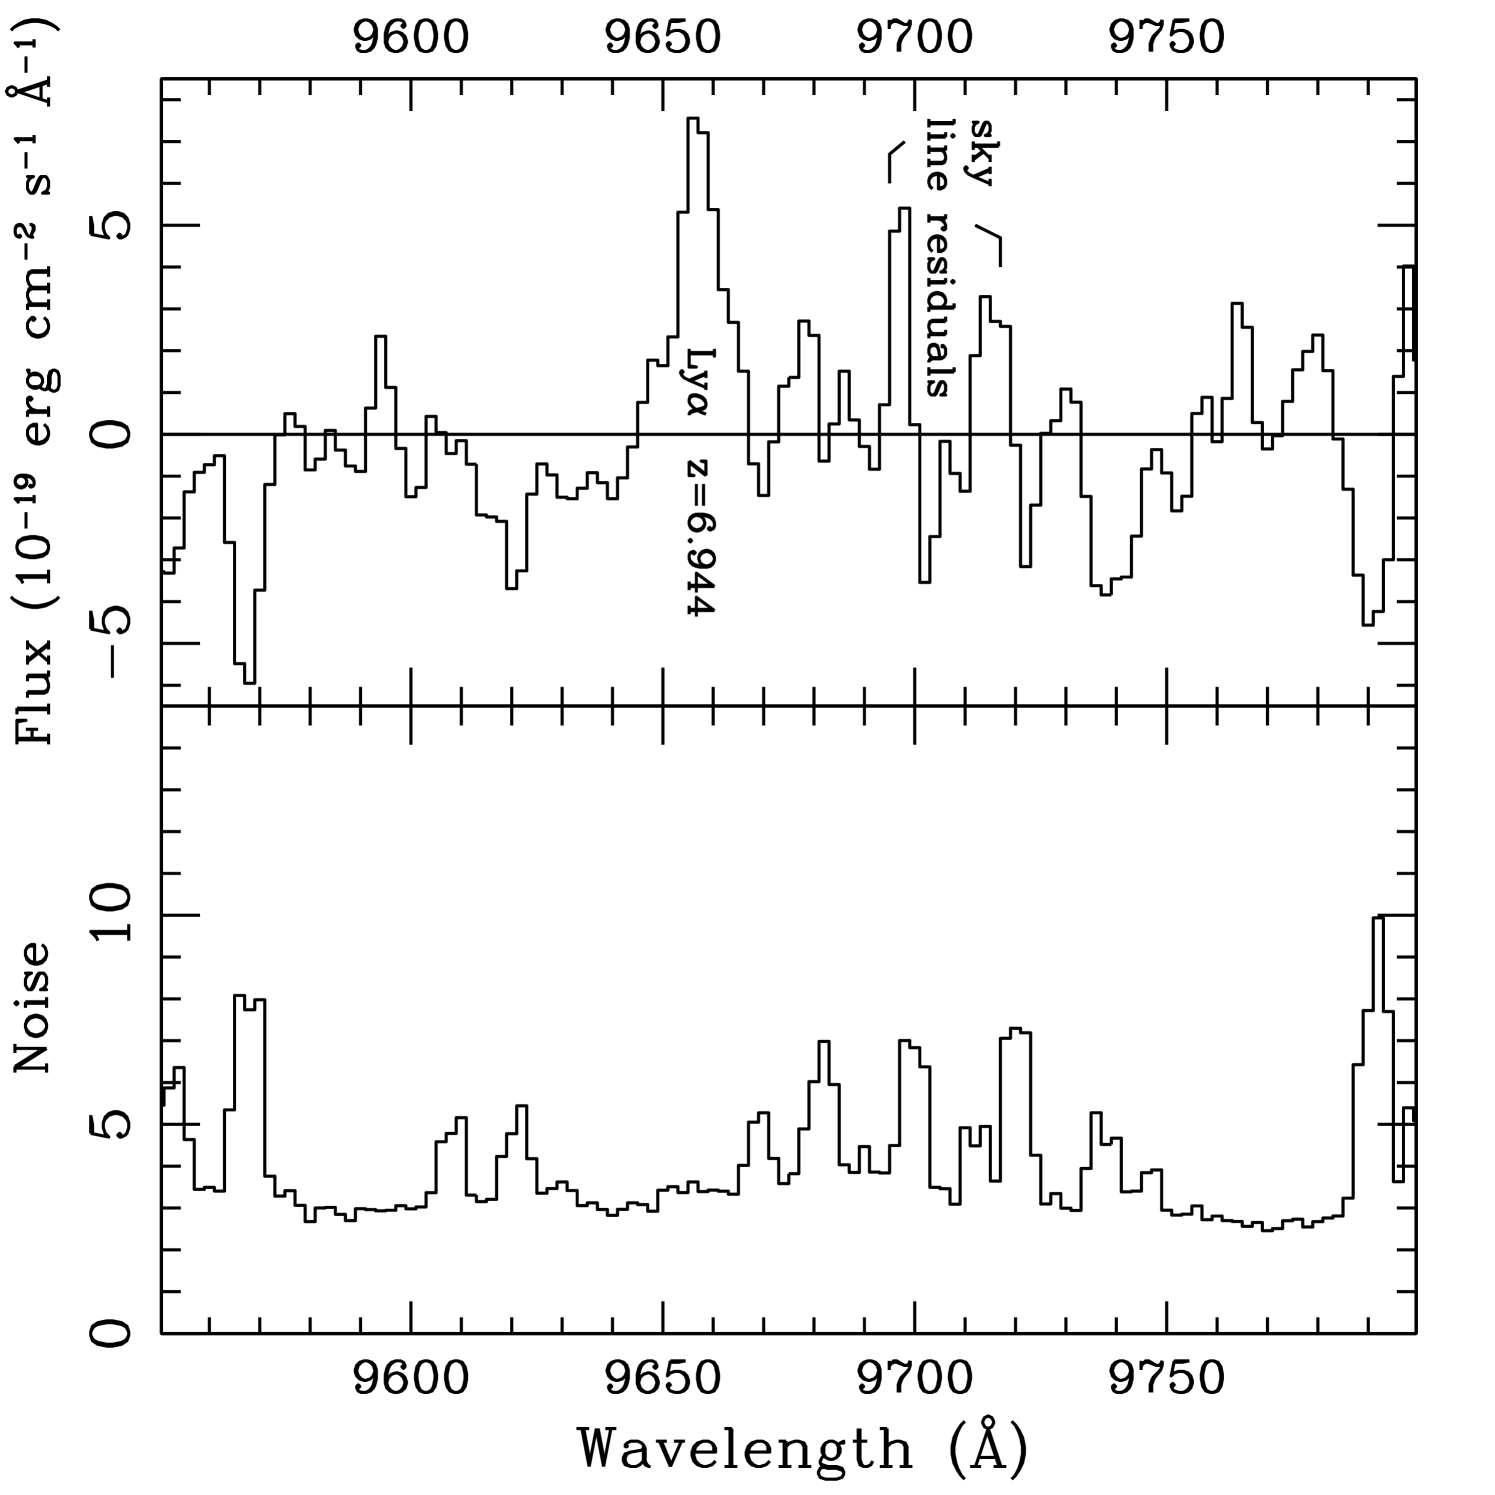
We next extracted a 1D spectrum from the two-stage stacking (method “a”), using the IRAF task “apall” with an unweighted extraction of (7 pixel) window width, centered on the emission line and parallel to the dispersion axis. (COSMOS 2D output has the dispersion axis parallel to the -axis, so we need not fit a trace to the continuum, which is undetected in the present data anyway.) We performed no further sky subtraction, since that too is done by the COSMOS package. To get another estimate of the noise level in the data, we extracted five further 1D spectra from the 2D stacked spectrum, each at a different spatial position along the slit. Each should be essentially a pure noise spectrum. The variance among these five parallel traces provides a wavelength-dependent noise estimate, and the line is significant at the level against this estimate. The extracted 1D spectrum is shown in figure 2.
Significance:
To explore the significance of the line detection, we measured aperture fluxes at a grid of clean locations in the 2D spectrum of LAE J095950.99+021219.1 (after rescaling the 2D spectrum by the noise ratio ). The RMS counts among these apertures corresponds to a noise of , against which our line is a event. Among non-overlapping 5-pixel apertures, the brightest two were and events (65% and 51% as bright as the LAE J095950.99+021219.1 line), suggesting only mildly non-gaussian noise.
The search that found this line was based on 6 candidates, each with a position known to and an expected line wavelength known to Å. Given our spatial and spectral resolution, this corresponds to independent resolution elements. Our significance level estimates range from to , and for Gaussian noise, the corresponding chance probabilities in 240 trials range from to .
Spectroscopic flux calibration:
Each mask included two blue stars with well measured photometry from the COSMOS project (Capak et al., 2007). We flux calibrate the observed emission line of LAE J095950.99+021219.1 by direct comparison with the observed counts in one of these stars, which was observed under identical conditions as our science targets. Both the emission line count rate and the comparison star’s count rate per unit wavelength were measured directly in the 2D spectra and at the same wavelength. For the emission line, we used the 10-pixel diameter (Å) aperture. This yields a flux of for LAE J095950.99+021219.1, corresponding to line luminosity at .
The fractional uncertainties in this flux are from photon counting statistics (with a statistical signal-to-noise ratio of – from the 1D or 2D spectra), from the choice of aperture used to measure the line flux in the 2D spectrum, and from the assumption that the comparison star’s flux density at 9680Å equals its z-band flux density. The final spectroscopic flux measurement is .
2.3 Comparison to narrowband imaging results:
The observed spectroscopic line flux is smaller than the narrowband flux (Hibon et al., 2011). Part of the discrepancy can be attributed to continuum in the narrowband filter. The emission line is near the blue edge of the filter bandpass, so continuum emission redward of the line will contribute relatively strongly to the narrow band flux.
We also re-examined the narrowband flux measurements for LAE J095950.99+021219.1. Following Hibon et al. (2011), we used moderately bright stars that are well detected but unsaturated in both the public COSMOS z-band image and our NB9680 image. The narrowband magnitudes in Hibon et al. (2011) were based on diameter aperture fluxes, with an aperture correction based on the difference between SExtractor “magiso” and aperture fluxes (see Hibon et al. (2011) for more details). In the present work, we omitted the aperture correction step, using instead identical diameter flux measurements for both the science objects and the reference stars in the NB9680 image. (The precise aperture diameter is unimportant, since LAE J095950.99+021219.1 is compact compared to the point spread function.) We obtained a narrowband magnitude . The corresponding narrowband flux is .
This is almost 50% more than the spectroscopically determined emission line flux (a difference). If we attribute the difference to continuum emission in the narrowband filter, the corresponding flux density is , or . The implied observer-frame equivalent width is Å (though consistent with an arbitrarily large equivalent width at ). While the object is undetected in the filter down to , a continuum magnitude of redward of the line at 9657Å remains allowed, since most of the z′ filter’s transmission lies blueward of that wavelength. The object is also undetected in the WIRDS J-band image (Bielby & al, 2012, in prep), with a aperture flux , corresponding to ().
3 Interpretation
We interpret the line at 9657Å in LAE J095950.99+021219.1 as Lyman- at redshift , based on non-detections in all filters blueward of this line, and on the absence of other optical lines.
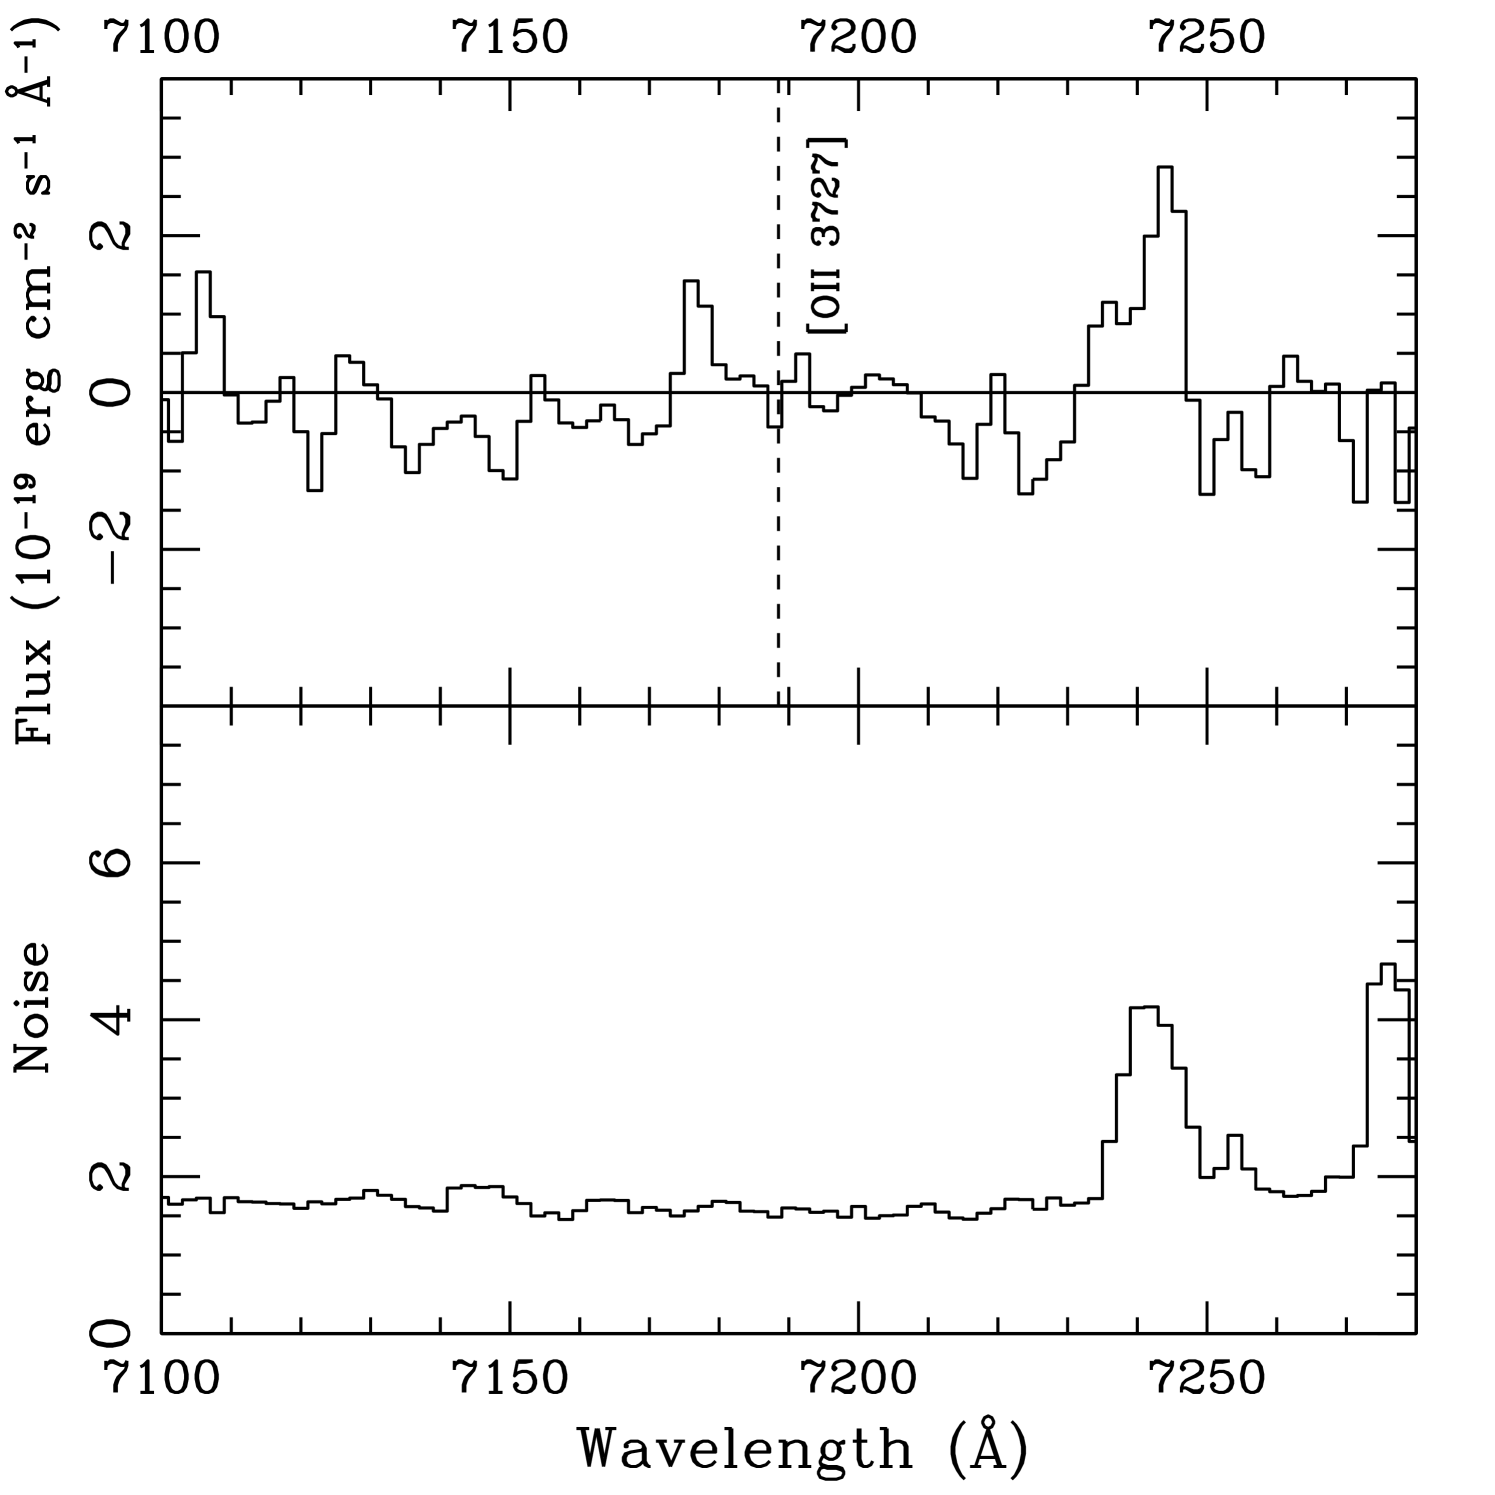
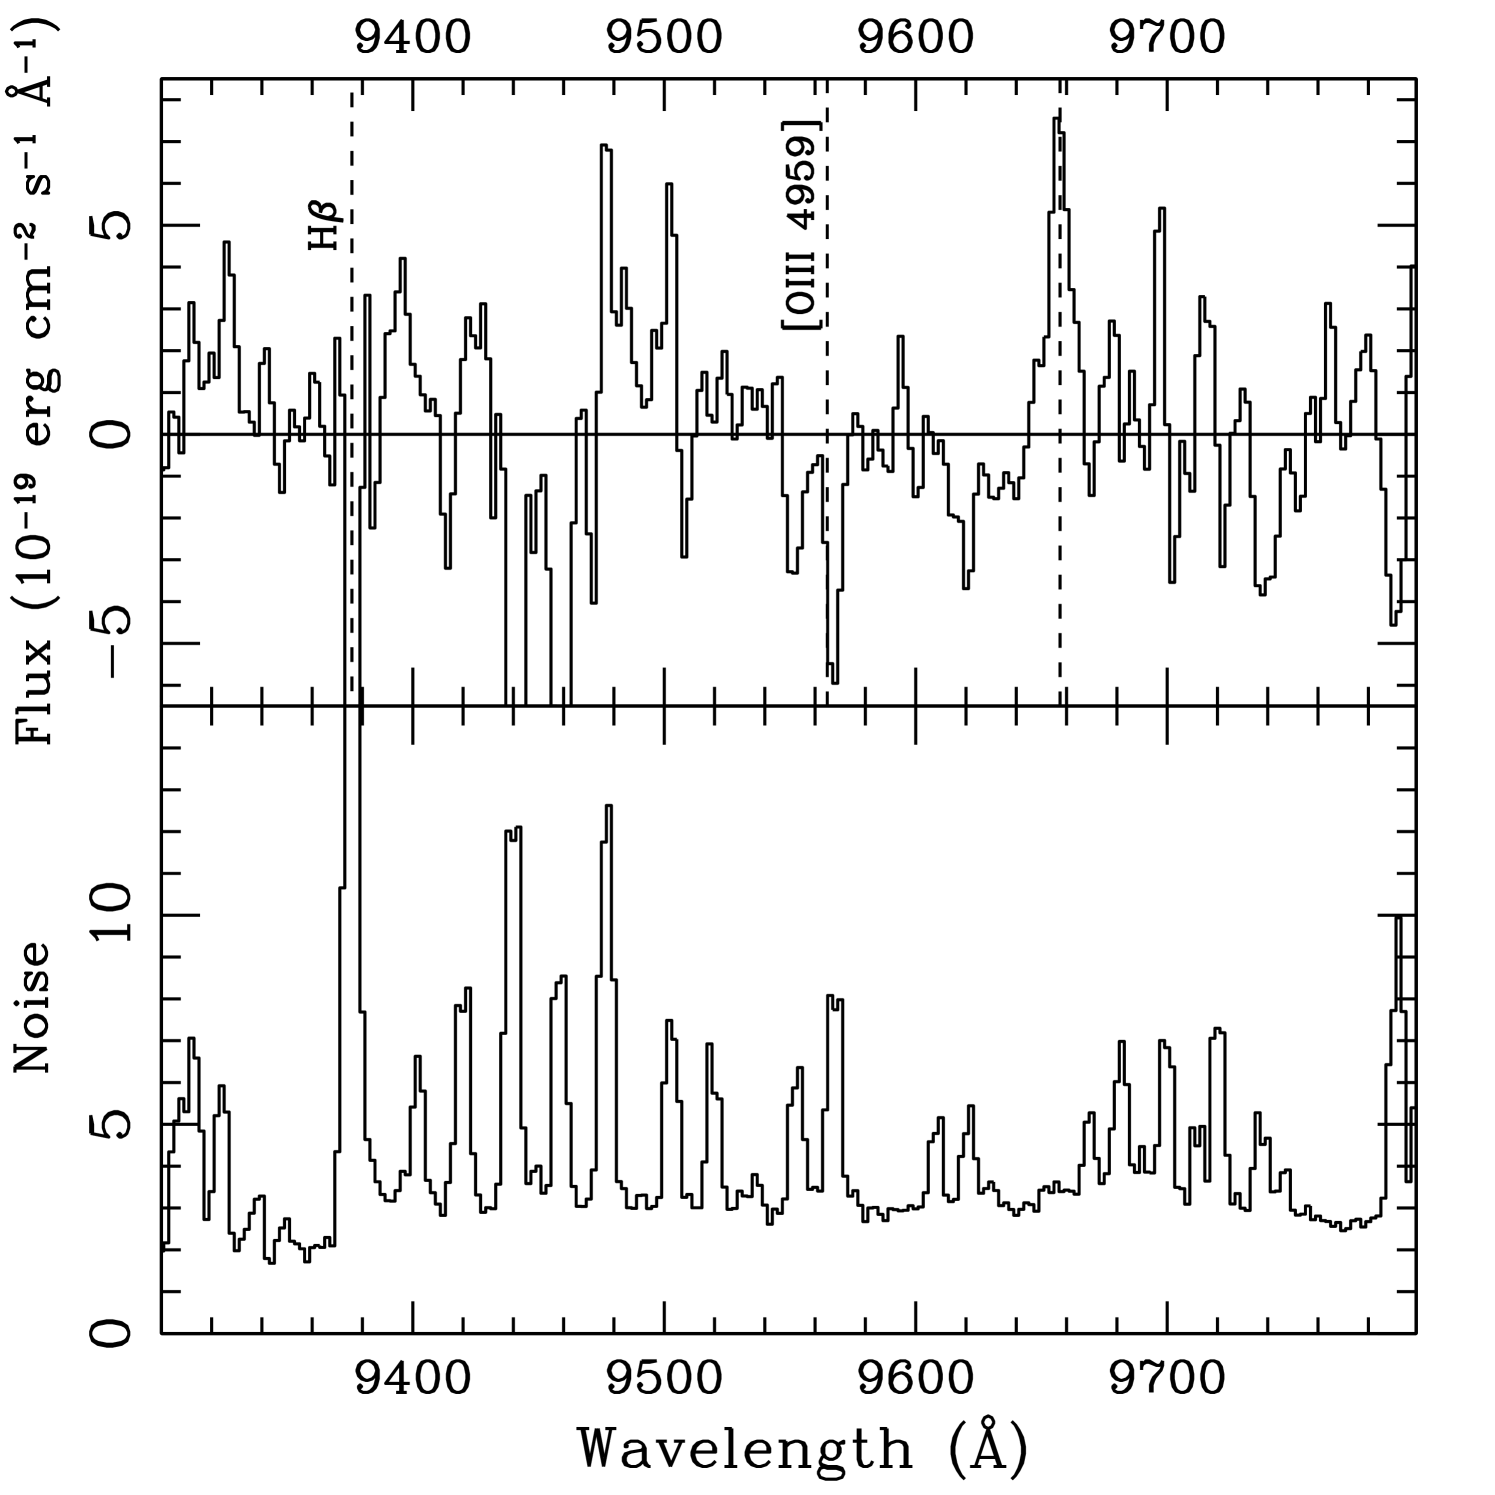
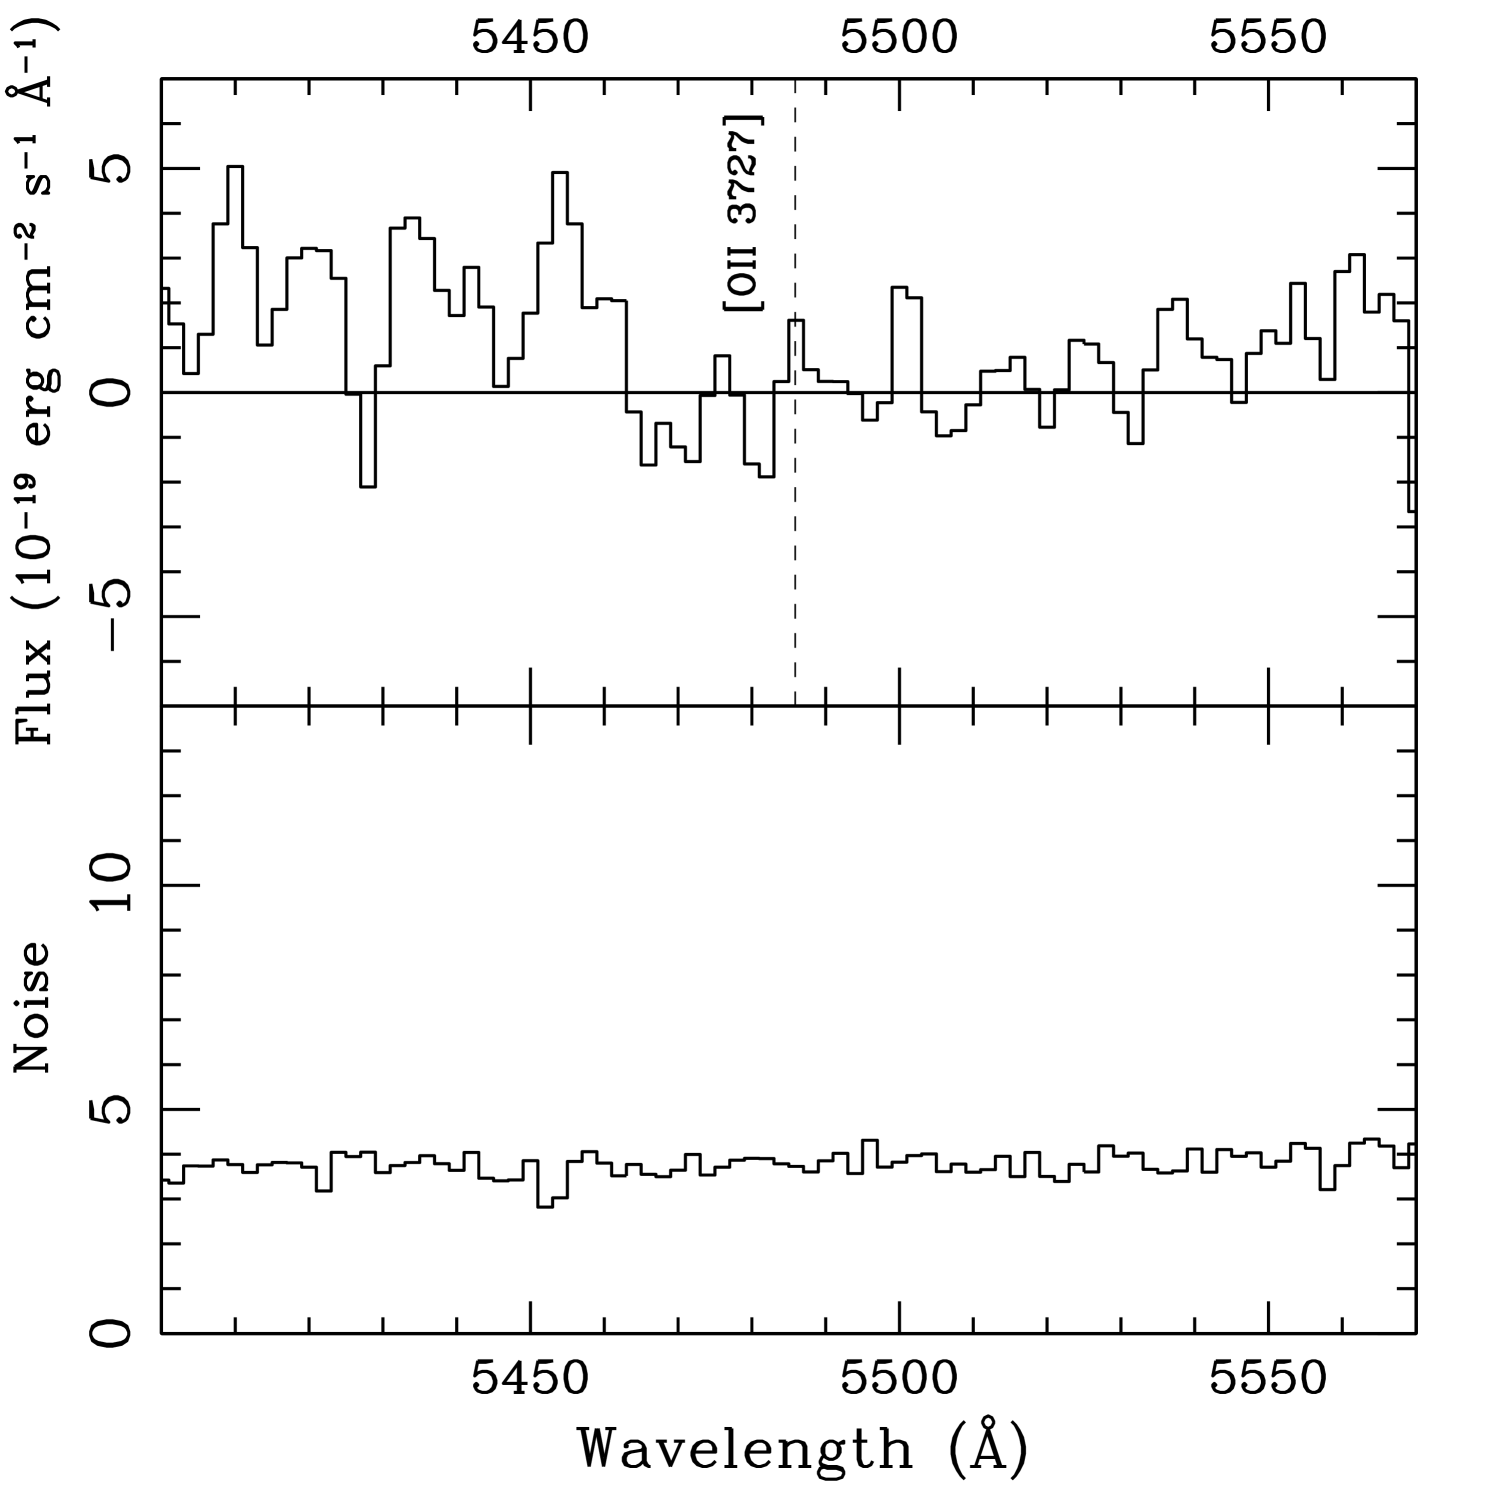
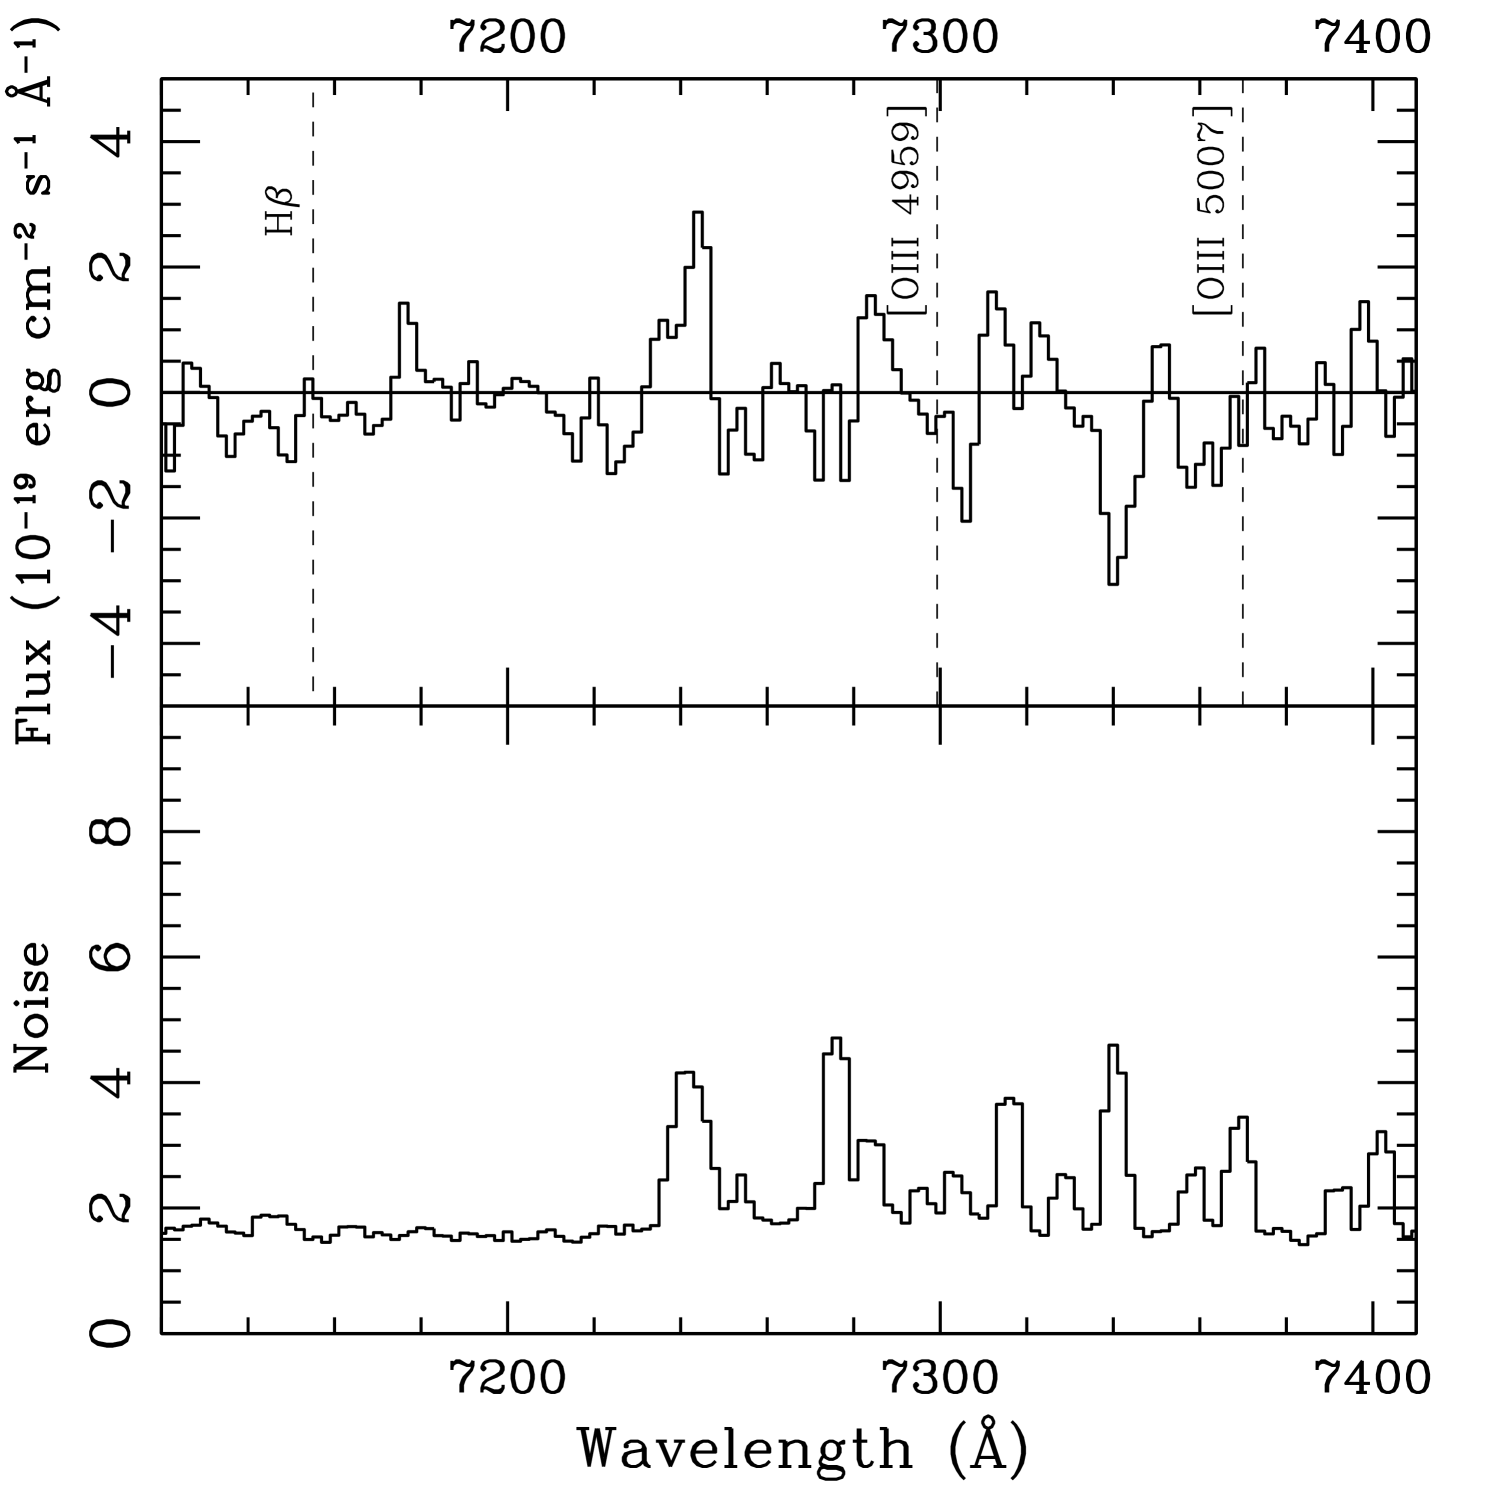
Were the primary line H (at ), or [O III] 5007 (at ), we would expect other prominent emission lines in our IMACS spectrum. Figure 3 shows non-detections in the 1D spectrum at the expected line wavelengths. Corresponding upper limits are summarized in table 2. The “H” case () is disfavored by the non-detections of [O III] 5007 and [O II] 3727, with line ratio limits O III and O II. If the primary line is [O III] 5007, unfortunately placed night-sky line residuals overlap the expected locations of [O III] 4959 and H, precluding interesting limits. Fortunately, the expected [O II] 3727 line location is clean, and gives a tight upper limit O IIO III (). This provides some evidence against the [O III] 5007 interpretation. Ratios of O IIO III this small are seen in a significant minority of star forming galaxies (Xu et al., 2007; McLinden et al., 2011; Richardson et al., 2011, in prep; Xia et al., 2012, in prep), but more can be ruled out by this line ratio.
| If … | Secondary Line | Expected | Formal flux | limit |
| wavelength | () | |||
| 0.472 | [O III] 5007 | 7370Å | 4.1 | |
| 0.472 | [O III] 4959 | 7299Å | 1.8 | |
| 0.472 | H | 7154Å | 2.2 | |
| 0.472 | [O II] 3727 | 5486Å | 5.4 | |
| 0.928 | [O III] 4959 | 9565Å | 9.5 | |
| 0.928 | H | 9375Å | 33 | |
| 0.928 | [O II] 3727 | 7188Å | 1.5 | |
To address the [O II] 3727 possibility and further improve our constraints on [O III] 5007, we examine equivalent widths. Following Hibon et al. (2011), we combine our spectroscopic line flux with optical magnitude limits of 27.9, 27.6, and 27.3 mag (, AB) in g′, r′, and i′ filters respectively. Since star-forming galaxies have , we have . The nondetection in these optical images then implies a limit (observer frame).
While [O III] 5007 and H emission line sources with equivalent widths this large exist (Rhoads et al., 2000; Kakazu et al., 2007; Straughn et al., 2008, 2009; van der Wel et al., 2011; Atek et al., 2011), they are exceptional, rare objects. In Hibon et al. (2011), we estimated the numbers expected in our survey based on published line luminosity functions (Kakazu et al., 2007; Geach et al., 2010) and equivalent width distributions (Straughn et al., 2009). We found that [O III] 5007 emitters and H emitters are expected.
[O II] 3727 emitters have generally smaller equivalent widths. We found no [O II] 3727-selected objects with in the samples from Straughn et al. (2009) (30 objects), Kakazu et al. (2007) (24 objects), Xia et al. (2012, in prep) (11 objects), or Drozdovsky et al. (2005) (400 objects). Thus, of [O II] 3727 emitters might enter our sample as LAE candidates. The luminosity function from Rigopoulou et al. (2005) suggests that our survey volume should contain [O II] 3727 galaxies. Among these, object should pass our Lyman- selection criteria.
Thus, the aggregate sample of foreground emitters expected in our survey is galaxy. In contrast, our survey volume at should contain between and Lyman- galaxies with line fluxes , based on the luminosity functions of Hu et al. (2010) and Ouchi et al. (2010). We thus regard Lyman- as the best interpretation of the observed emission line.
4 Discussion
Redshift is the current frontier in reionization studies, an area of active exploration where our observational knowledge is growing rapidly.
The recently discovered quasar at (Mortlock et al 2011), combined with spectroscopic followup (and occasional confirmation) of galaxy candidates from HST WFC3 surveys, provide an unprecedented look at this epoch. Observations of these objects seem to favor the continued existence of significant neutral intergalactic gas as late as . This is surprising, given that microwave background polarization data from WMAP favor a characteristic reionization redshift , and that the IGM at is highly ionized, with a neutral fraction of only 1–4% based on quasar spectra (Fan et al 2006). Nonetheless, the ionized bubble around the quasar appears too small to be comfortably explained in a fully ionized medium, unless the quasar is itself remarkably young ( years) (Bolton et al 2011). Similarly, three independent research groups have argued that the fraction of Lyman break candidates showing Lyman- emission appears smaller than would be expected in an ionized medium (Vanzella et al 2010; Stark et al 2010; Ono et al 2011; Schenker et al 2011; Pentericci et al 2011). Still, these results depend on the reliability of photometric selection criteria, and a contamination of order 50% could explain the observations without recourse to neutral gas (e.g., Schenker et al 2011).
Lyman- galaxy surveys offer a complementary approach to studying reionization. The underlying physics is the same as for spectroscopic followup of Lyman break samples, but the survey selection proceeds differently, leading to different potential selection biases. The uncertainties in the method are likewise very different from those associated with the quasar near-zone measurement (Mortlock et al., 2011; Bolton et al., 2011), or the Gunn-Peterson trough (Fan et al., 2006). Because of this, conclusions about cosmological reionization will be strongest when they are based on multiple independent methods.
The work we present here is only the second large-area narrowband survey for for Lyman- galaxies at redshift , following on the work of Iye et al. (2006) and Ota et al. (2010). The spectroscopic confirmation of LAE J095950.99+021219.1 demonstrates that such objects can be identified at flux levels considerably fainter than the line of IOK-1 (Iye et al., 2006) or the recently reported narrowband-selected Lyman- galaxy SXDF-NB1006-2 (Shibuya et al., 2011). Our observed line flux, , corresponds to a rest-frame line luminosity of only . This is at or below the characteristic line luminosity from Schechter function fits to Lyman- samples (e.g., and , Ouchi et al. (2010); and ,Hu et al. (2010)).
Thus, our survey has achieved sensitivity to typical Lyman- emitters. Were the luminosity function unchanged from that at , we would expect our survey volume to contain 11 or 2.6 Lyman- emitters brighter than LAE J095950.99+021219.1, based on the LF of Ouchi et al. (2010) or Hu et al. (2010) respectively. This reflects large differences in expectations from different published luminosity functions. We will present a detailed analysis of our survey’s constraints on the Lyman- luminosity function in a future paper, after we have more sensitive spectra for our remaining candidates. For now, the galaxy LAE J095950.99+021219.1 is among the few most distant spectroscopically confirmed galaxies known, and the faintest to be discovered through a direct search for Lyman- line emission.
References
- Atek et al. (2011) Atek, H., et al. 2011, ApJ 743, 121
- Bielby & al (2012, in prep) Bielby, et al. 2012, submitted to A&A, arXiv:1111.6997
- Bolton et al. (2011) Bolton, J. S., Haehnelt, M. G., Warren, S. J., Hewett, P. C., Mortlock, D. J., Venemans, B. P., McMahon, R. G., & Simpson, C. 2011, MNRAS, 416, L70
- Capak et al. (2007) Capak, P., et al. 2007, ApJS, 172, 99
- Dawson et al. (2007) Dawson, S., Rhoads, J. E., Malhotra, S., Stern, E., Wang, J. X., Dey, A., Spinrad, H., & Jannuzi B. T. 2007, ApJ 671, 1227
- Drozdovsky et al. (2005) Drozdovsky, I., Yan, L., Chen, H.-W., Stern, D., Kennicutt, Jr., R., Spinrad, H., & Dawson, S. 2005, AJ, 130, 1324
- Fan et al. (2006) Fan, X., et al. 2006, The Astronomical Journal, 132, 117
- Geach et al. (2010) Geach, J. E., et al. 2010, MNRAS, 402, 1330
- Hibon et al. (2011) Hibon, P., Malhotra, S., Rhoads, J., & Willott, C. J. 2011, ApJ 741, 101
- Hu et al. (2010) Hu, E. M., Cowie, L. L., Barger, A. J., Capak, P., Kakazu, Y., & Trouille, L. 2010, ApJ, 725, 394
- Iye et al. (2006) Iye, M., et al. 2006, Nature, 443, 186
- Kakazu et al. (2007) Kakazu, Y., Cowie, L. L., & Hu, E. M. 2007, ApJ, 668, 853
- Kashikawa et al. (2011) Kashikawa, N., et al. 2011, ApJ, 734, 119
- Kelson (2003) Kelson, D. D. 2003, PASP, 115, 688
- Malhotra & Rhoads (2004) Malhotra, S., & Rhoads, J. E. 2004, ApJ, 617, L5
- Malhotra & Rhoads (2004) Malhotra, S., & Rhoads, J. E. 2004, ApJ, 617, L5
- Malhotra & Rhoads (2006) —. 2006, ApJ, 647, L95
- Malhotra et al. (2012) Malhotra, S., Rhoads, J. E., Finkelstein, S. L., Hathi, N., Nilsson, K., McLinden, E., & Pirzkal, N., ApJ 750, L36
- McLinden et al. (2011) McLinden, E. M., et al. 2011, ApJ, 730, 136
- McQuinn et al. (2007) McQuinn, M., Hernquist, L., Zaldarriaga, M., & Dutta, S. 2007, Monthly Notices of the Royal Astronomical Society, 381, 75
- Mortlock et al. (2011) Mortlock, D. J., et al. 2011, Nature, 474, 616
- Ota et al. (2010) Ota, K., et al. 2010, ApJ 722, 803
- Ouchi et al. (2010) Ouchi, M., et al. 2010, ApJ 723, 869
- Rhoads et al. (2000) Rhoads, J. E., Malhotra, S., Dey, A., Stern, D., Spinrad, H., & Jannuzi, B. T. 2000, ApJ, 545, L85
- Richardson et al. (2011, in prep) Richardson, M. L. A., McLinden, E. M., Malhotra, S., Rhoads, J. E., & Hibon, P. 2012, ApJ, in prep
- Rigopoulou et al. (2005) Rigopoulou, D., Vacca, W. D., Berta, S., Franceschini, A., & Aussel, H. 2005, A&A, 440, 61
- Santos (2004) Santos, M. R. 2004, Monthly Notices of the Royal Astronomical Society, 349, 1137
- Shibuya et al. (2011) Shibuya, T., Kashikawa, N., Ota, K., Iye, M., Ouchi, M., Furusawa, H., Shimasaku, K. & Hattori, T., 2011, ApJ, submitted, arXiv:1112.3997v1
- Stern et al. (2005) Stern, D., Yost, S. A., Eckart, M. E., Harrison, F. A., Helfand, D. J., Djorgovski, S. G., Malhotra, S., & Rhoads, J. E. 2005, ApJ, 619, 12
- Straughn et al. (2008) Straughn, A. N., et al. 2008, The Astronomical Journal, 135, 1624
- Straughn et al. (2009) —. 2009, The Astronomical Journal, 138, 1022
- van der Wel et al. (2011) van der Wel, A., et al. 2011, ApJ 742, 111
- Xia et al. (2012, in prep) Xia, L., et al. 2012, in prep
- Xu et al. (2007) Xu, C., et al. 2007, The Astronomical Journal, 134, 169
- Zheng et al. (2012) Zheng, Z., Finkelstein, S. L., Finkelstein, K., Tilvi, V., Rhoads, J. E., Malhotra, S., Wang, J. X., Miller, N., Hibon, P., & Xia, L. 2011, arXiv:1111.3386, submitted to MNRAS