A minimal model for predicting ventilation rates of subterranean caves
Abstract
The ventilation of carbon dioxide within subterranean caves regulates the growth of speleothems — mineral deposits found in caves that provide important clues about past climate. While previous studies have used internal temperature measurements to predict ventilation rates, such data would not be available for the task of climate reconstruction. Here, we develop a parsimonious model to predict ventilation rates from knowledge of outside temperatures and the cave’s physical dimensions only. In the model, ventilation arises from buoyancy-driven flows created in passageways that connect to the outside. A few key simplifications leads to a system amenable to perturbation analysis, resulting in explicit expressions for ventilation rates. We compare these predictions to time-resolved, in-situ measurements of transported cave gases (carbon dioxide and radon). The theory accurately accounts for the timing and magnitude of seasonal and synoptic variations of these gases, and is therefore diagnostic of seasonal bias in speleothem growth.
1 Introduction
Subterranean caves contain calcium-carbonate () mineral deposits, known as speleothems, which record important clues about past climate. Much like tree-rings and ice cores, these formations can be used to infer past conditions and identify major climatic shifts [8, 14, 73]. Speleothem records, however, can be difficult to interpret due to a number of competing factors that influence chemical and isotopic composition, mineral fabric, and timing of deposition [30, 24, 47, 22, 77]. Early cave researchers realized the potential importance of internal cave conditions [10, 37, 36], but only within the past twenty years has in situ monitoring technology become sufficiently advanced to record microclimate data with which to calibrate speleothem records [13, 55, 64, 6, 7, 52, 46, 49, 4, 69]. These studies highlighted the fact that in order to fully understand a speleothem paleoclimate record, it is necessary to have a holistic understanding of the site-specific parameters that control stalagmite growth. These include but are not limited to rainfall amount, hydrologic saturation, vegetation and soil productivity, dripwater residence time and water-rock interaction, drip rates, and ventilation [22].
Speleothems are the end product of a series of chemical reactions: (1) rainwater combines with soil-zone carbon dioxide to form carbonic acid: ; (2) carbonic acid percolates downward and slowly dissolves carbonate bedrock, creating a high pCO2 solution of calcium and bicarbonate: : and (3) the drip reaches a cave void, where the gradient between low-pCO2 cave air and high-pCO2 dripwater causes the drip to degas CO2, driving the pH of the solution up and causing re-precipitation of calcium carbonate: [57]. Cave ventilation modulates cave air CO2 concentration and thus the gradient between air and drip, driving both the timing and the vigor of speleothem growth. Without ventilation, cave air CO2 would come to chemical equilibrium with dripwater CO2, and speleothem formation would cease.
In addition to controlling the rate and timing of deposition, ventilation has been shown in several long-term cave monitoring studies to have significant impacts on the isotopic composition of dripwater and subsequent speleothem calcite [64, 31, 48, 71, 27]. Results from other field, theoretical, and laboratory studies support the hypothesis that under strong ventilation regimes where CO2 is quickly removed from dripwater, rapid precipitation may induce kinetic isotope fractionation, causing a shift in oxygen and carbon isotopes within the speleothem and making paleoclimatic interpretation of the record much more difficult [74, 62, 54, 58, 18, 65].
Because ventilation controls the rate of calcite precipitation, it not only influences when a speleothem forms (which seasons), but also where the speleothem forms; i.e. on or within the cave ceiling (stalactite) or on the cave floor (stalagmite). Wherever dripwater encounters low-CO2 cave air, there is potential for calcite precipitation up-stream of the stalagmite. This phenomenon is known as Prior-Calcite-Precipitation, or PCP [23]. When PCP occurs, dripwater cation-to-calcium (X/Ca) ratios change as Ca is preferentially removed from solution and minor elements become more concentrated [22]. While PCP is often associated with climate-driven water balance above the cave, where more/less hydrologic saturation and rainfall amount above the cave results in higher/lower drip rates, lower/higher PCP, and lower/higher speleothem X/Ca ratios [42, 43, 53, 72, 70, 45, 66], strong ventilation and low cave-air CO2 also promotes PCP and exerts control on variations in speleothem x/Ca ratios [25, 63, 76, 68].
Given that the process of cave ventilation can have significant impacts on the isotopic and trace element composition of modern calcite, we must endeavor to understand the ventilation of each cave that contains speleothems of paleoclimatic importance. This is especially true in light of recent work that recognized how cave ventilation varies seasonally with well-defined global patterns [41]. While past studies have quantified cave ventilation in terms of internal temperature measurements [17, 12, 33], such data would not be available for the task of climate reconstruction. Instead, predictive models must be developed.
Here, we construct a theoretical framework to predict ventilation rates from a minimal set of external information. Building on previous work [75, 17, 12, 46], we model ventilation as arising from buoyancy-driven flows created by the internal-external temperature difference. [21] showed that the temperature explained more than 99% of variations in cave air density, thus, we used temperature difference to model ventilation rates. Unlike previous studies, though, our model does not rely on any internal measurements. It only requires basic physical parameters of the cave itself and easily obtainable outside temperature data. To close the model, we require the flow to be critical via the composite Froude number — a condition borrowed from the field of oceanography [2, 3, 15, 35, 59]. Analysis of the relevant scales, along with a few key simplifications, produces a system that can be solved through perturbation methods, ultimately giving explicit formulas for how ventilation depends on the system’s physical parameters.
To test our ventilation model, we use two tracers common to all limestone caves; carbon dioxide (CO2) and radon-222 (222Rn). As previously discussed, cave air CO2 is derived from microbial decay and plant-root respiration in the soil zone, as well as dissolved limestone bedrock. Cave air CO2 concentrations are modulated by a combination of input from both dripwaters and gaseous transport through cracks and fissures above the cave, import of atmospheric CO2 via ventilation, and removal via condensation corrosion [61, 32, 5, 51]. 222Rn is a daughter isotope in a radioactive decay chain that begins with 238U and ends with 206Pb. Limestone contains an average 1.3-2.5ppm 238U, and therefore acts as a continuous source of radon production and advection into cave chambers through dripwaters, surfaces, and cracks [28, 34]. 222Rn is an ideal tracer for cave ventilation because atmospheric concentrations of radon are negligible and it is an inert gas with a 3.82-day half-life, which is sufficiently long when compared with most cave-air exchange rates [28, 55, 60, 46]. We report a set of time-resolved measurements of cave air gas concentrations from a subterranean cave located in Florida Caverns State Park [44]. The theory accounts for qualitative trends in the measurements throughout the year, and, over certain periods, even shows quantitative agreement with weekly-scale fluctuations. This comparison also allows the production rates of CO2 and 222Rn to be estimated, which could complement other, more invasive, estimation techniques [20, 46].
2 Study site and micrometeorological station
Dragon’s Tooth Cave (DTC) is a pristine, karst-hosted dry cave located in Florida Caverns State Park, Marianna, northwest Florida (Fig. 1a-b). The cave formed within a carbonate bluff along the nearby Chipola River, and has two primary passages that trend northwest to southeast in alignment with regional bedrock fractures. The two large passages are intersected by a third east-west trending corridor that dips at approximately 45 degrees from west to east, serving as an entrance to both sections. The northern section was first surveyed and mapped in 1978. The floor of the northern section lies at 18 meters above sea level (ASL) and is composed of mud-clay, which is typical of caves in Marianna that are subjected to seasonal groundwater inundation when Chipola River levels exceed 3-4 meters above the riverbed [69]. Passages within DTC are 2-3 meters tall, thus floodwaters tend to fill the passages and remove any stalactites or soda straws that may have formed, minimizing the potential of flowstone decoration.
In 1984, spelunkers observed airflow through a pile of breakdown near the entrance and dug a narrow tunnel making a connection to the southern section of the cave, finding a previously unexplored room that was highly decorated with beautiful speleothem formations. This room later came to be known as the Dragon’s Belly (DB) [50]. The floor of the Belly lies at 21 meters ASL; groundwater slowly fills the Belly from below only during Chipola flooding events that exceed 5 meters above riverbed. Topography above the cave suggests that the Belly is the remains of a large diameter NW-to-SE conduit that has collapsed at both ends of the room. The porous nature of the breakdown materials promotes significant volumetric airflow (ventilation) and therefore the Belly is highly decorated with pristine white stalagmites, flowstones, and moon-milk atop several large sections of breakdown blocks. In 2012, our group mapped the DTC using Leica ScanStationP20 to obtain highly accurate measurements of its dimensions. The main chamber of the DB is nearly rectangular – 41 m long, 12 m wide, and 6 m high with 45 degree slopes at each end of the room that pinch off at the ceiling, and it connects to the entrance of the cave system via a single, narrow passageway (0.6 m high, 0.3 m wide and 3 m long). These geometrically simple features make the DB an ideal site for testing basic ventilation models. Once a firm theoretical foundation is established, future studies could examine more complex cave systems (e.g. complex geometries and/or multiple openings).
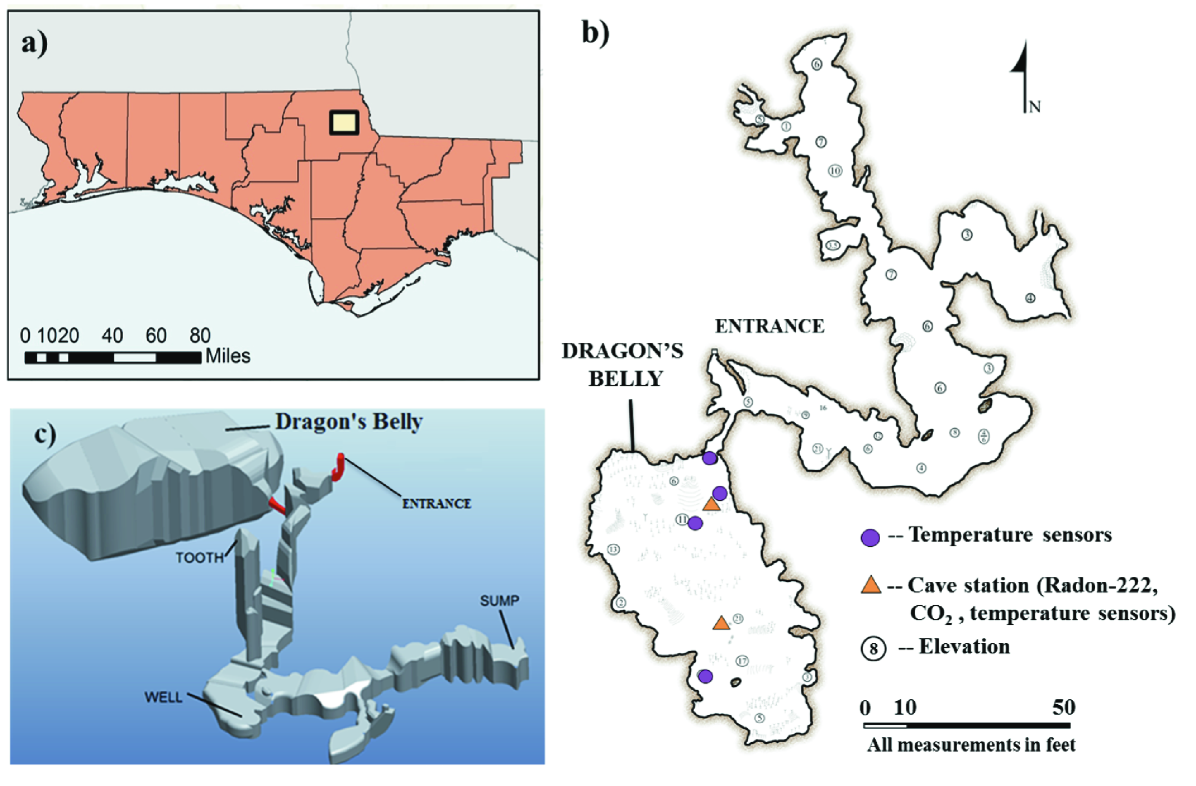
Beginning in November 2011, we established a micrometeorological monitoring program inside the DB cave to continuously collect spatial and temporal variations of 222Rn, CO2, and temperature. 222Rn and CO2 levels were measured via two cave stations deployed 15 meters apart (see Fig. 1b). These stations were equipped with Durridge RAD7 detectors to measure radon, LiCor-820 gas analyzers to measure CO2, as well as Vaisala HMP45C temperature and relative humidity sensors. Four additional Onset HOBO Pro v2 External Temperature Data Loggers were also deployed throughout the Belly. All data was recorded hourly, with the exception of occasional outages due to flooding events or power failures. Meanwhile, we obtained external temperature data from daily measurements taken at Marianna Municipal Airport, located 8 km from the study site.
3 The ventilation model
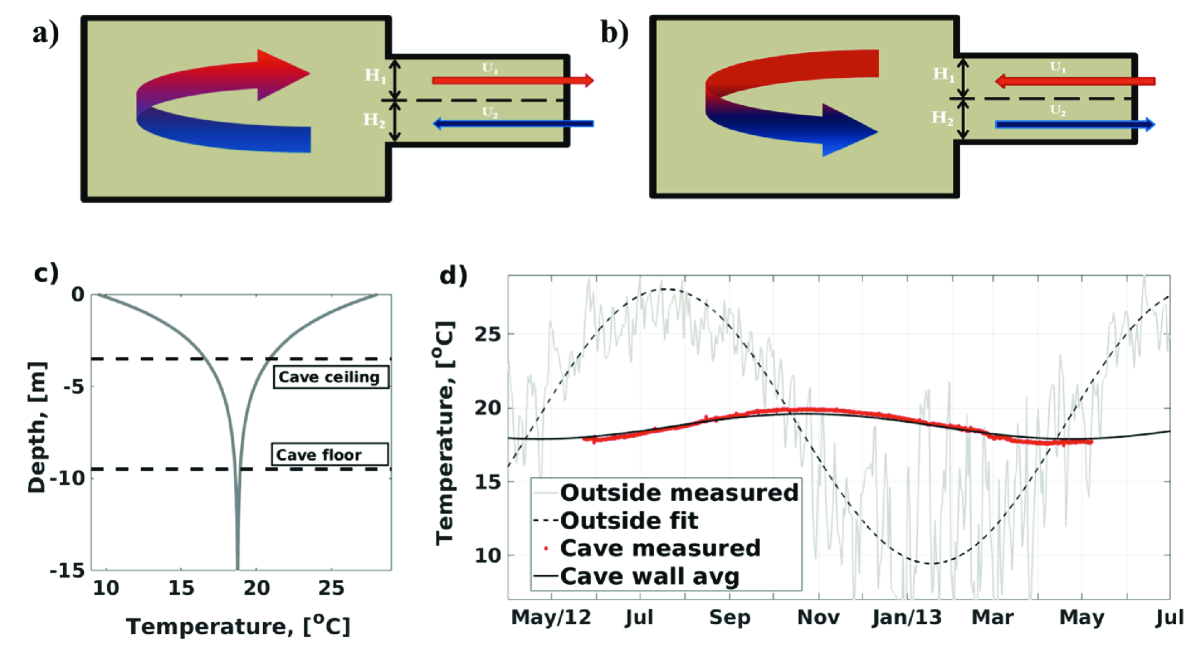
We model the Dragon’s Belly Cave as a well-mixed compartment with a single opening that exchanges heat with the surrounding surfaces and the outside environment. Because the internal cave temperature is typically different from the external temperature , a buoyancy-driven flow is created in the connecting passageway [40, 59, 11]. During the summer, warm outside air flows into the cave through the opening, is cooled by contact with the cave walls, and exits through the lower part of the same opening. The airflow reverses during the winter; see Figs. 2a–b for a schematic. As long as vertical mixing and viscous effects are weak (i.e. large Peclet and Reynolds numbers respectively), the flow in the opening is essentially that of two layers — a top layer of depth and speed , and a bottom layer with values and . Enforcing conservation of volume inside the cave, along with the Boussinesq approximation, results in a symmetric exchange flow; i.e. both the depths and speeds are the same in the two layers, and . Clearly, must be the half-height of the passageway ( m), but must be determined through other considerations, starting with a balance of the cave’s total thermal energy.
3.1 Thermal energy balance and closure condition
Under the assumptions of (1) well-mixed air in the cave interior, (2) the Boussinesq approximation, and (3) a symmetric two-layer exchange flow in the cave opening, the rate of change of the cave’s thermal energy takes the form
| (1) |
The main unknowns in this ordinary differential equation (ODE) are the cave’s internal temperature, , and the exchange speed, . Meanwhile, the outside temperatures, , will be taken from the measurements at Marianna Airport. The parameters are the mean air density kg/m3, the specific heat of air at constant pressure J/(kg K) and at constant volume J/(kg K), the total volume of the cave chamber m3, and the half-area of the cave passageway m2.
The first term on the right of Eq. (1) represents thermal exchange with the outside via the two-layer flow, while the second represents exchange with the cave walls through surface integration of the local heat-transfer-per-unit-area [J/(m2s)]. Temperature differences between these surfaces and the enclosed air give rise to convective flows, which can promote heat transfer greatly. The Nusselt number Nu (the ratio of convective to conductive heat transfer) quantifies this increase and can be estimated through knowledge of the Rayleigh number, . Here, is the temperature and is a lengthscale of the surface under consideration, while m/s2 is the gravitational acceleration, m2/s and m2/s are the viscosity and thermal diffusivity of air, and K is the mean annual temperature in Marianna, Florida. To estimate the Nusselt number, we use the well-established scaling law [38, 9]
| (2) |
Here, is a constant that depends on the orientation of the surface and the direction of the thermal gradient. The sidewalls produce convection regardless of the sign of the temperature gradient, whereas the floor and ceiling only produce convection in the presence of an unstable temperature gradient (see section S1 in the supporting information for further details). The above law holds for , and inside the Dragon’s Belly we typically have .
The local heat transfer on a particular surface is given by [38], and insertion of the Nu-Ra relationship gives
| (3) |
Here, we have adopted the convention for any variable in order to shorten expressions. We will take the wall temperature, , to be a different constant on each surface — the ceiling, the floor, and the four sidewalls — so that the integral in Eq. (3) reduces to a summation over these six faces. We note that the lengthscale has dropped out of Eq. (3) as a consequence of the law. Though easily overlooked, this cancellation simplifies the analysis considerably and avoids certain ambiguities in the definition of (see section S1 in the supporting information). This is one factor that will ultimately allow us to obtain closed-form expressions for the ventilation rate.
Both and are still unknown at this stage, and so a second relationship is required to close the model. Because the Dragon’s Belly is a single-opening cave, we can leverage fundamental results from the study of two-layer exchange flows [26, 15, 35, 59]. Such flows have been found to spontaneously organize into a critical state, characterized in this context by a composite Froude number equal to one. Imposing this condition gives the speed of the exchange flow as
| (4) |
We note that other closure conditions could be used for caves with multiple openings [12, 29].
3.2 Estimating internal-surface temperatures
Our main goal is to solve Eqs. (1)–(4) for the cave temperature, , and the exchange speed, , but first it is necessary to estimate the cave-wall temperatures, , for insertion into Eq. (3). Here, we will use temperature measurements from inside the cave to guide and validate certain approximations made in our model. Once constructed, though, the model will not rely on these internal measurements, and the same framework could be applied to other caves without any recalibration.
We begin with a formula, often used in the design of wine cellars, to estimate the underground temperature at a depth [56, 67],
| (5) |
Here, rad/s is the annual frequency, K is the amplitude of the seasonal temperature variation (illustrated by the dashed curve in Fig. 2d), m2/s is the thermal diffusivity of the limestone medium, m is the attenuation depth, and simply sets an initial time. This formula neglects higher modes, for example diurnal and synoptic variations, since they attenuate much more rapidly with depth. The attenuation depth, , depends on the physical properties of the local geology, thus, by using appropriate values for thermal diffusivity temperature of surfaces of caves formed in other than limestone can be calculated.
Equation (5) is an exact solution to a diffusion problem in a homogeneous domain with periodically driven upper surface. Although the presence of the cave violates the homogeneity assumption, the much lower density of the enclosed air implies that a very large change in air temperature would be required to modify the limestone temperature appreciably. We therefore apply the formula to estimate the temperature of each cave surface. For the sidewalls, we estimate an average temperature by integrating the formula over the height of the wall with a 3-point trapezoid rule. Figure 2c shows the temperature range predicted by the wine-cellar formula as it varies with depth, note that at approximately 12 m depth, the temperature of the ground becomes equal to the annual mean of the outside temperature and there are no seasonal variations below 12 m. That 12 m depth depends on the physical properties of the local geology and varies depending on where the cave is formed. Notably, the temperature of the Dragon’s Belly ceiling varies over a much wider range than does the floor (by a factor of 12).
We now compare these predictions with temperature measurements taken inside the cave. Internal convective flows tend to homogenize the cave-air temperature and so, regardless of where the sensors are placed, the measurements are influenced by all of the surrounding surfaces. We therefore define an average wall temperature, , which incorporates the temperatures of the ceiling, floor, and sidewalls as weighted by surface area
| (6) |
Here, and are the temperature and area of surface , and m2 is the total surface area. Figure 2d shows the estimated (black) as it compares with measurements (red). The prediction captures the phase of the measurements very accurately and under-predicts the amplitude slightly. The under-predicted amplitude is of minor consequence when compared to the scale of the outside-temperature fluctuations, shown by the faint gray data in Figure 2d. Due to their larger magnitude, the outside-temperature fluctuations are primarily responsible for creating the inside/outside temperature difference that drives exchange.
Figure 2d provides one last insight. The predicted agrees well with internal measurements, even though it does not take ventilation into account. This suggests that the cave’s thermal exchange is a wall-dominated process — a fact that is bourn out by scaling analysis in section S3 in the supporting information. It may seem paradoxical that, while ventilation is the main quantity we aim to predict, observations suggest it to be a secondary effect. The resolution is that, while ventilation is indeed secondary for thermal exchange, it is the primary transport mechanism for cave gases such as carbon dioxide and radon. By using simple internal-temperature estimates to predict ventilation rates, our model will be able to accurately describe the transport of these gases.
3.3 Predicting exchange rates
Having obtained reliable wall-temperature estimates, it is now possible to solve Eqs. (1)–(4) for the cave air temperature, , and the speed of the exchange flow, . Once is known, the main quantity we seek is the ventilation rate
| (7) |
which will allow us to determine how cave gases are exchanged with the outside.
We solve Eqs. (1)–(4) with two different approaches. The first is a numerical strategy that tracks the temperature of each individual cave surface and dynamically switches thermal convection on or off depending on the direction of the local temperature gradient. This model thus represents the complex physics of thermal convection with spatial and temporal resolution. See section S2 in the supporting information for further details. The second approach is a course-grained model that assumes spatially uniform convection in order to arrive at a system amenable to perturbation analysis. This analysis ultimately gives an explicit expression for how the ventilation rate depends on cave and climatic parameters. See section S3 in the supporting information for details. With these two approaches, we have both the physical fidelity offered by a computational model and the transparency offered by a purely analytical model. Comparison between the two will allow us to test the additional assumptions made in the perturbation model.
As described in section S3 in the supporting information, analysis of the relevant physical scales identifies two dimensionless parameters, and . Briefly, represents the timescale of wall-thermal exchange compared to the timescale of temperature variation (i.e. a year), while represents the relative strength of ventilation-induced versus wall-induced thermal exchange. In terms of these parameters, perturbation analysis gives the ventilation rate as
| (8) |
This formula shows that the ventilation rate depends primarily on the absolute difference between the cave-wall temperature, , and the outside temperature, . The term involving represents nonlinear damping of ventilation due to the internal air adjusting to the outside temperature. For the Dragon’s Belly Cave, this term only makes a contribution. However, caves with less idealized features will see the contribution of this term, and future studies on such caves could allow us to examine it more closely.
Once is known (from either the numerical or perturbation model), we can determine how cave gases — namely carbon dioxide and radon-222 — are exchanged with the outside environment. The transport of either quantity can be described by the ODE
| (9) |
where is the concentration of CO2 [ppmv] or radon [Bq/m3] inside the cave. The first term on the right represents the flux of CO2 or radon into the cave through internal surfaces. We assume the production term, , to be constant and will estimate its value from measurements. The second term on the the right represents exchange with the outside via ventilation. Here, is the external concentration, where ppmv for CO2 and is negligible for radon. The last term on the right represents decay of radon-222, where s-1 (this term is zero for CO2).
4 Results: Field measurments and theoretical predictions
We now discuss the measurements taken at the Dragon’s Belly site, shown by the red curves in Figs. 3 a–c for CO2 and d–f for radon. Cave air gas concentrations in the Belly were collected at 30-minute intervals over a 14-month period, with occasional interruptions due to flooding and/or power outages. Both the perturbation model and the numerical model were performed at 24-hr resolution, models and measured data are plotted together in Fig. 3. The highest concentrations of cave gases occur during fall and spring, while the lowest concentrations occur during summer. This result is counter to those in caves under predominantly chimney-driven airflow regimes that promote strong winter-time ventilation (e.g. Obir Cave [64]; Inner Space Caverns [7]; Hollow Ridge Cave [46]).
During the winter, carbon-dioxide levels in the Belly are near their minimum, while radon levels are intermediate. Qualitatively, these trends suggest ventilation to be lowest during fall and spring, when daily average inside-outside temperature differences are small, and highest during summer and winter, when the temperature differences are maximal. The observations therefore support the idea of ventilation being caused primarily by buoyancy-driven flows.
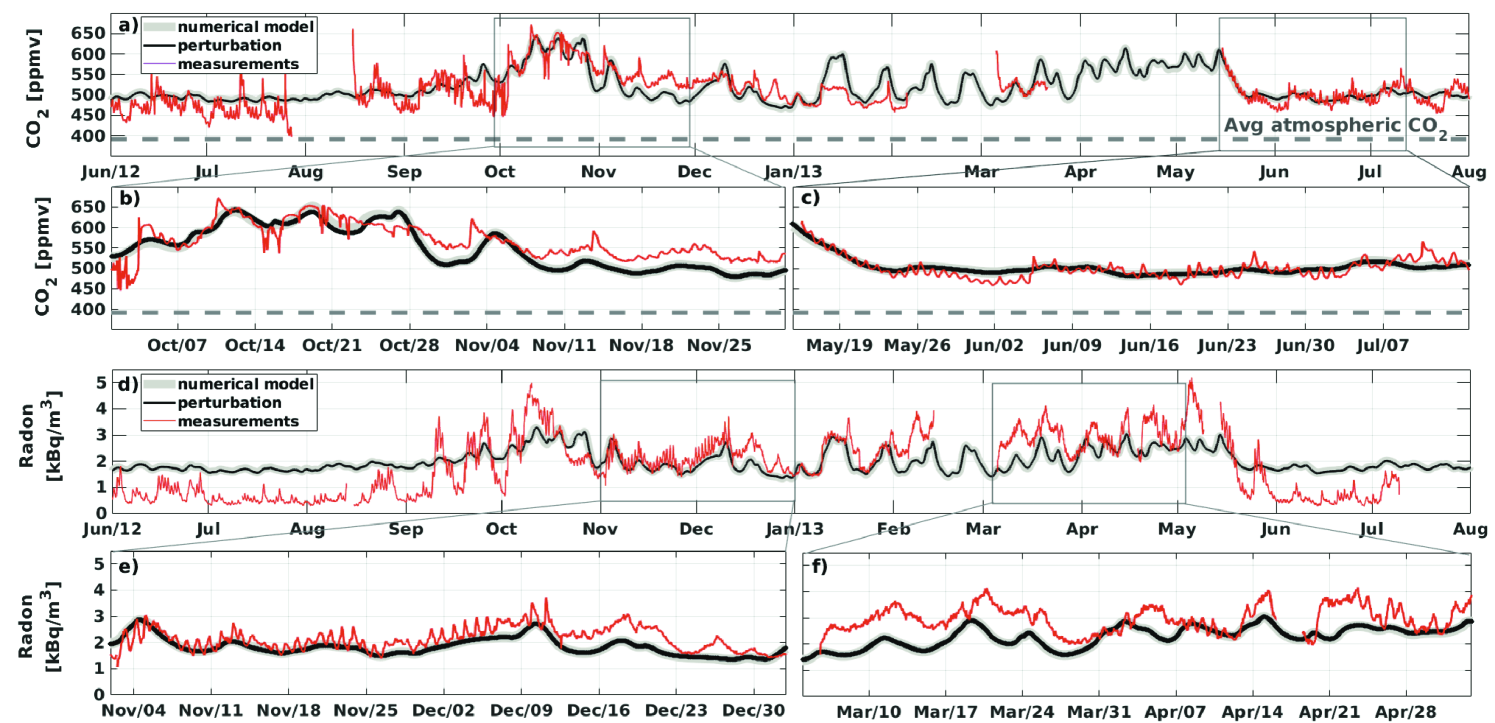
Predictions of CO2 and radon are shown by the dark curves in Fig. 3. The gray curves represent the numerical model, with convection switched on/off for each surface individually, while the black curves show the perturbation solution given by Eq. (8). The two predictions are nearly indistinguishable, providing validation for the additional assumptions made in the perturbation model. We estimate the source term, , by minimizing the difference between model and measurements, giving kg/(m2s) for CO2 and kBq/(m2s) for 222Rn. We note that our estimated source terms for radon and CO2 is comparable to others found in the literature (e.g. Radon: kBq/(m2s) [20]; kBq/(m2s) [46]; CO2: kg/(m2s) [6]; kg/(m2s), [20]). With the source term as the only fit parameter, both the CO2 and radon predictions correspond well with measurements over the majority of the 14-month study. In particular, the model accounts for the higher levels of cave gases in the fall/spring and lower levels in the summer/winter. The only obvious discrepancy is in comparing radon levels in the summer, where the theory predicts a significantly higher level than was measured. Carbon-dioxide shows good agreement during this same period, though, suggesting the discrepancy to be specific to radon.
While not a focus of this study, hydrologic conditions within the rock above the Belly may have a significant influence on agreement between modeled and measured 222Rn over seasonal time periods. [1] demonstrated that radon emanation from limestone occurs from within a surface layer only a few microns thick, and that under dry conditions, alpha-recoil causes radon gas to be ejected from the crystal lattice into inter-crystal cracks and imperfections, eventually to find its way out of the limestone through relatively slow diffusion in air at approximately 10-2 cm2 s-1. Conversely, under wet conditions within the epikarst, alpha-recoil can cause radon particles to be ejected directly into pore water. As dripwater percolates downward, it has a scavenging effect, driving a significantly higher flux of radon during periods when the epikarst is hydrologically saturated. An excellent example of this phenomenon was illustrated by [46] at Hollow Ridge Cave, when a tropical storm delivered 83 mm of rainfall, saturating the epikarst and causing a nearby river to flood and plug up the lower entrances of the cave, temporarily ceasing ventilation. Directly following this rainfall, 222Rn emanation rates increased from ’normal’ 48-222 Bq m-2 hr-1 to approximately 1200 Bq m-2 hr-1. Unpublished data from laboratory testing of limestone from both Dragon’s Tooth and Hollow Ridge Cave confirms that wet transport can increase 222Rn emanation by 1.62.4 times dry transport (William Burnett - FSU, personal communication, 2015).
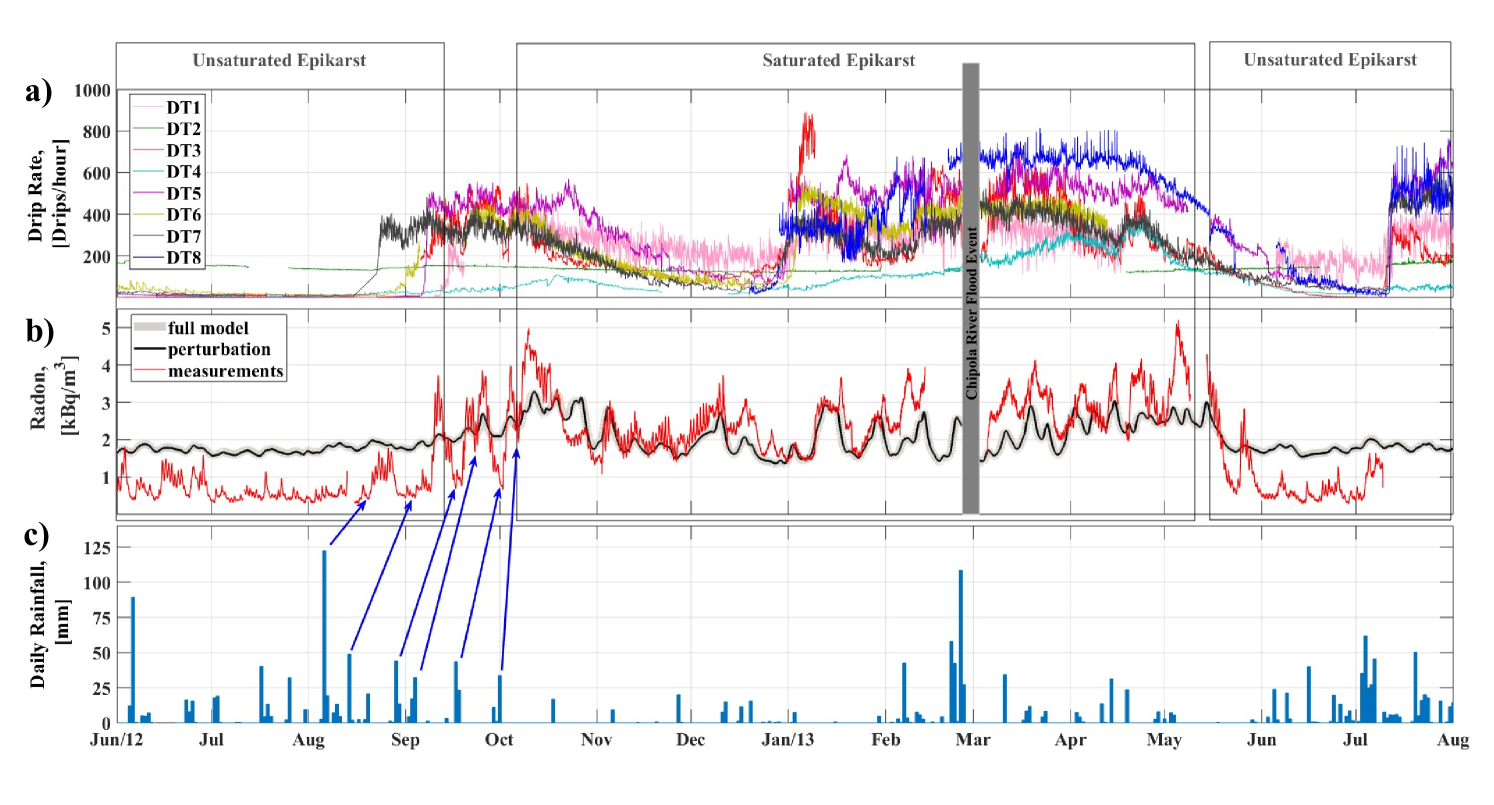
Figure 4 illustrates that prior to August 2012, most of the monitored drip sites were essentially zero. During August, a 120 mm rainfall and several successive 40 mm rainfalls prompted hydroligcal saturation within the overburden. Approximately 1-2 weeks after each event, an increase in 222Rn was observed, followed by a decay to background levels. In September 2012, all monitored sites rapidly increased in drip rate as the epikarst came to full saturation. These saturated conditions persisted until May 2013, when lower rainfall and increased evapotranspiration conspired to reduce the hydrologic saturation, causing measured radon to fall below values predicted by our model.
In additional to the seasonal variation, the CO2 and radon measurements show more rapid fluctuations on a few characteristic scales. Figures 3 b–c and e–f zoom on selected date ranges to highlight these. First, the measurements show very rapid, diurnal fluctuations, which result from the different day/night temperatures. In the model, we only input daily outside temperatures, and so these very fast fluctuations are not present. Presumably they could be captured with more temporal resolution though (e.g. hourly readings). Interestingly, there is a second, intermediate timescale — on the order of 5–9 days — that is also evident in the CO2/radon data. This nearly weekly cycle is likely caused by synoptic-scale meteorology [39], though manmade activity may play a role too [16, 19]. Regardless, the model shows variations over exactly the same scale. This implies that the weekly cycle in cave-gas levels is ultimately tied to a weekly cycle in outside temperatures that drives an exchange flow as described by our theory. Over certain periods, for example Fig. 3e, the theory even shows quantitative agreement with tracer measurements.
5 Conclusions
Here, we have constructed a theoretical framework to predict subterranean-cave ventilation rates from a minimal set of external information — namely, knowledge of the outside temperature and the physical dimensions of the cave. The major advantage is that external temperatures are much more easily measured or, in the application of climate reconstruction, estimated, than are conditions inside the cave. Through scaling analysis and a few key modeling assumptions, we obtained explicit relationships for how ventilation depends on system parameters, given by Eq. (8). Comparison with time-resolved, in-situ measurements demonstrates the theory’s ability to accurately describe seasonal and synoptic-scale fluctuations of transported cave gases. As an immediate application, this theory could be used to improve estimates for production rates of cave gases such as CO2 and 222Rd. Currently-used field techniques can be destructive to the cave’s fragile environment, but our methodology is completely non-invasive as it relies only on knowledge of outside temperatures.
A longer-term application is to use these results to improve speleothem interpretation. Inferring past climate from speleothems is inherently an inverse problem, typically treated by representing the climate’s influence on the proxy (e.g. speleothem, tree ring, etc.) via a transfer function, which is then inverted. While it has been recognized that ventilation plays a critical role in speleothem growth, such effects have not yet been quantitatively incorporated into paleoclimate inference models, likely due to the complexity involved. Our model, however, offers explicit formulas for how ventilation depends on cave and climatic variables. The transparency afforded by this model could therefore prove useful in obtaining tractable transfer functions for climate reconstruction. In essence, the simpler the forward model, the more feasible inference becomes.
6 Acknowledgments
Geophysical Fluid Dynamics Institute contribution number xxx. This research was supported by the NSF Grant AGS-1032403; additional support for K. Khazmutdinova was provided through teaching and research assistantships at Florida State University. The authors sincerely thank the management staff of Florida Caverns State Park, especially Kelly Banta, for providing an incredible opportunity to study the Dragon’s Tooth Cave. Thanks to Cameron Ridgewell for creating a 3D map of the Dragon’s Tooth Cave. We thank William Burnett for help with interpreting radon measurements, and William Dewar for inspiring suggestions and comments. The meteorological data from Marianna Airport is obtained from https://www.ncdc.noaa.gov/cdo-web/. The input files and results of the numerical calculations are available from the authors upon request (kk11m@my.fsu.edu).
References
- [1] J.N. Andrews and D.F. Wood. Mechanism of radon release in rock matrices and entry into groundwaters. Technical report, Bath Univ. of Tech., Eng., 1972.
- [2] L. Armi. The hydraulics of two flowing layers with different densities. J. Fluid Mech., 163:27–58, 1986.
- [3] L. Armi and D.M. Farmer. Maximal two-layer exchange through a contraction with barotropic net flow. J. Fluid Mech., 164:27–51, 1986.
- [4] A.J. Baker, D.P. Mattey, and J.U.L. Baldini. Reconstructing modern stalagmite growth from cave monitoring, local meteorology, and experimental measurements of dripwater films. Earth Planet. Sci. Lett., 392:239–249, 2014.
- [5] J.U.L. Baldini, L.M. Baldini, F. McDermott, and N. Clipson. Carbon dioxide sources, sinks, and spatial variability in shallow temperate zone caves: evidence from Ballynamintra Cave, Ireland. Jour. Cave Karst Stud., 68(1):4–11, 2006.
- [6] J.U.L. Baldini, F. McDermott, and I.J. Fairchild. Spatial variability in cave drip water hydrochemistry: Implications for stalagmite paleoclimate records. Chem. Geol., 235(3-4):390–404, 2006.
- [7] J.L. Banner, A. Guilfoyle, E.W. James, L.A. Stern, and M. Musgrove. Seasonal variations in modern speleothem calcite growth in central Texas, USA. J. Sediment. Res., 77(8):615–622, 2007.
- [8] M. Bar-Matthews, A. Ayalon, and A. Kaufman. Late Quaternary paleoclimate in the eastern Mediterranean region from stable isotope analysis of speleothems at Soreq Cave, Israel. Quaternary Res., 47(2):155–168, 1997.
- [9] T.L. Bergman and F.P. Incropera. Fundamentals of heat and mass transfer. John Wiley & Sons, 2011.
- [10] W.S. Broecker, E.A. Olson, and P.C. Orr. Radiocarbon measurements and annual rings in cave formations. Nature, 185(4706):93–94, 1960.
- [11] R. Camassa, R.M. McLaughlin, M.N.J. Moore, and K. Yu. Stratified flows with vertical layering of density: experimental and theoretical study of flow configurations and their stability. J. Fluid Mech., 690:571–606, 2012.
- [12] C.S. Christoforou, L. G. Salmon, and G. R. Cass. Air exchange within the Buddhist cave temples at Yungang, China. Atmos. Environ., 30(23):3995–4006, 1996.
- [13] C. Collister and D. Mattey. High resolution measurement of water drip rates in caves using an acoustic drip counter. In AGU Fall Meeting Abstracts, 2005.
- [14] F. Cruz, S. Burns, M. Jercinovic, I. Karmann, W. Sharp, and M. Vuille. Evidence of rainfall variations in Southern Brazil from trace element ratios (Mg/Ca and Sr/Ca) in a Late Pleistocene stalagmite. Geochim. Cosmochim. Acta, 71(9):2250–2263, 2007.
- [15] S.B. Dalziel. Two-layer hydraulics: a functional approach. J. Fluid Mech., 223:135–163, 1991.
- [16] J.S. Daniel, R.W. Portmann, S. Solomon, and D.M. Murphy. Identifying weekly cycles in meteorological variables: The importance of an appropriate statistical analysis. J. Geophys. Res.-Atmos., 117(D13), 2012.
- [17] C.R. De Freitas and R.N. Littlejohn. Cave climate: assessment of heat and moisture exchange. J. Climatol., 7(6):553–569, 1987.
- [18] W. Dreybrodt and D. Scholz. Climatic dependence of stable carbon and oxygen isotope signals recorded in speleothems: from soil water to speleothem calcite. Geochim. Cosmochim. Acta, 75(3):734–752, 2011.
- [19] N. Earl, I. Simmonds, and N. Tapper. Weekly cycles in peak time temperatures and urban heat island intensity. Environ. Res. Lett., 11(7):074003, 2016.
- [20] J. Faimon, J. Štelcl, and D. Sas. Anthropogenic -flux into cave atmosphere and its environmental impact: a case study in the Císařská Cave (Moravian Karst, Czech Republic). Sci. Total Environ., 369(1):231–245, 2006.
- [21] J. Faimon, D. Troppová, V. Baldík, and R. Novotnỳ. Air circulation and its impact on microclimatic variables in the Císařská Cave (Moravian Karst, Czech Republic). Int. J. Climatol., 32(4):599–623, 2012.
- [22] I.J. Fairchild and A. Baker. Speleothem science: from process to past environments, volume 3. John Wiley & Sons, 2012.
- [23] I.J. Fairchild, A. Borsato, A.F. Tooth, S. Frisia, C.J. Hawkesworth, Y. Huang, F. McDermott, and B. Spiro. Controls on trace element (Sr–Mg) compositions of carbonate cave waters: implications for speleothem climatic records. Chem. Geol., 166(3-4):255–269, 2000.
- [24] I.J Fairchild, C.L. Smith, A. Baker, L. Fuller, C. Spötl, D. Mattey, F. McDermott, and E.I.M.F. Modification and preservation of environmental signals in speleothems. Earth-Science Reviews, 75(1):105–153, 2006.
- [25] I.J. Fairchild and P.C. Treble. Trace elements in speleothems as recorders of environmental change. Quat. Sci. Rev., 28(5-6):449–468, 2009.
- [26] D.M. Farmer and L. Armi. Maximal two-layer exchange over a sill and through the combination of a sill and contraction with barotropic flow. J. Fluid Mech., 164:53–76, 1986.
- [27] W. Feng, J.L. Banner, A.L. Guilfoyle, M. Musgrove, and E.W. James. Oxygen isotopic fractionation between drip water and speleothem calcite: A 10-year monitoring study, central Texas, USA. Chem. Geol., 304:53–67, 2012.
- [28] P.L. Fernández, I. Gutierrez, L.S. Quindós, J. Soto, and E. Villar. Natural ventilation of the paintings room in the Altamira cave. Nature, 321(6070):586–588, 1986.
- [29] M.R. Flynn and C.P. Caulfield. Natural ventilation in interconnected chambers. J. Fluid Mech., 564:139–158, 2006.
- [30] S. Frisia, A. Borsato, I.J. Fairchild, and F. McDermott. Calcite fabrics, growth mechanisms, and environments of formation in speleothems from the Italian Alps and southwestern Ireland. J. Sed. Res., 70(5):1183–1196, 2000.
- [31] S. Frisia, I. J. Fairchild, J. Fohlmeister, R. Miorandi, C. Spötl, and A. Borsato. Carbon mass-balance modelling and carbon isotope exchange processes in dynamic caves. Geochim. Cosmochim. Acta, 75(2):380–400, 2011.
- [32] F. Gabrovšek and W. Dreybrodt. Role of mixing corrosion in calcite-aggressive H2O-CO2-CaCO3 solutions in the early evolution of karst aquifers in limestone. Water Resour. Research, 36(5):1179–1188, 2000.
- [33] A. Gregorič, J. Vaupotič, and S. Šebela. The role of cave ventilation in governing cave air temperature and radon levels (Postojna Cave, Slovenia). Int. J. Climatol., 34(5):1488–1500, 2014.
- [34] J. Hakl, I. Hunyadi, I. Csige, G. Géczy, L. Lénárt, and A. Várhegyi. Radon transport phenomena studied in karst caves-international experiences on radon levels and exposures. Radiat. Meas., 28(1-6):675–684, 1997.
- [35] K.R. Helfrich. Time-dependent two-layer hydraulic exchange flows. J. Phys. Oceanogr., 25(3):359–373, 1995.
- [36] C. Hendy. The isotopic geochemistry of speleothems. Geochim. Cosmochim. Acta, 35(8):801–824, 1971.
- [37] H. Holland, T. Kirsipu, J. Huebner, and U. Oxburgh. On some aspects of the chemical evolution of cave waters. J. Geol., 72(1):36–67, 1964.
- [38] J.P. Holman. Heat Transfer. McGraw-Hill, New York, USA, 2002.
- [39] J.R. Holton and G.J. Hakim. An introduction to dynamic meteorology, volume 88. Academic press, 2012.
- [40] G.R. Hunt and P.P. Linden. The fluid mechanics of natural ventilation–displacement ventilation by buoyancy-driven flows assisted by wind. Build. Environ., 34(6):707–720, 1999.
- [41] E.W. James, J.L. Banner, and B. Hardt. A global model for cave ventilation and seasonal bias in speleothem paleoclimate records. Geochem. Geophy. Geosy., 16(4):1044–1051, 2015.
- [42] K.R. Johnson, C. Hu, N.S. Belshaw, and G.M. Henderson. Seasonal trace-element and stable-isotope variations in a Chinese speleothem: The potential for high-resolution paleomonsoon reconstruction. Earth Planet. Sci. Lett., 244(1-2):394–407, 2006.
- [43] I. Karmann, F.W. Cruz, O. Viana, and S.J. Burns. Climate influence on geochemistry parameters of waters from Santana–Pérolas cave system, Brazil. Chem. Geol., 244(1-2):232–247, 2007.
- [44] K. Khazmutdinova. Water and Air Flows in Karstic Caves and Conduits. PhD thesis, THE FLORIDA STATE UNIVERSITY, 2016.
- [45] K. Khazmutdinova and D. Nof. Percolation into Dragon’s Tooth Cave, Florida, USA. 16th Congress of Speleology Proceedings, 2:417–422, 2013.
- [46] A.J. Kowalczk and P.N. Froelich. Cave air ventilation and outgassing by radon-222 modeling: How fast do caves breathe? Earth Planet. Sc. Lett., 289(1):209–219, 2010.
- [47] M.S. Lachniet. Climatic and environmental controls on speleothem oxygen-isotope values. Quatern. Sci. Rev., 28(5-6):412–432, 2009.
- [48] W.J. Lambert and P. Aharon. Controls on dissolved inorganic carbon and 13C in cave waters from DeSoto Caverns: Implications for speleothem 13C assessments. Geochim. Cosmochim. Acta, 75(3):753–768, 2011.
- [49] M. Luetscher and F. Ziegler. CORA–a dedicated device for carbon dioxide monitoring in cave environments. Int. Jour. Speleo., 41(2):13, 2012.
- [50] G. Maddox. Dragon’s Tooth Cave Grade 5 Survey. In Florida Caverns State Park Cave Management Plan, 1986.
- [51] D.P. Mattey, T.C. Atkinson, J.A. Barker, R. Fisher, J.P. Latin, R. Durrell, and M. Ainsworth. Carbon dioxide, ground air and carbon cycling in Gibraltar karst. Geochim. Cosmochim. Acta, 184:88–113, 2016.
- [52] D.P. Mattey, I.J. Fairchild, T.C. Atkinson, J.P. Latin, M. Ainsworth, and R. Durell. Seasonal microclimate control of calcite fabrics, stable isotopes and trace elements in modern speleothem from St Michaels Cave, Gibraltar. Geolog. Soc. London Spec. Pub., 336(1):323–344, 2010.
- [53] J. McDonald, R. Drysdale, D. Hill, R. Chisari, and H. Wong. The hydrochemical response of cave drip waters to sub-annual and inter-annual climate variability, Wombeyan Caves, SE Australia. Chem. Geol., 244(3-4):605–623, 2007.
- [54] C. Mühlinghaus, D. Scholz, and A. Mangini. Modelling fractionation of stable isotopes in stalagmites. Geochim. Cosmochim. Acta, 73(24):7275–7289, 2009.
- [55] F. Perrier, P. Richon, and J.C. Sabroux. Modelling the effect of air exchange on 222Rn and its progeny concentration in a tunnel atmosphere. Sci. total environ., 350(1):136–150, 2005.
- [56] Y. Pinchover and J. Rubinstein. An introduction to partial differential equations. Cambridge university press, 2005.
- [57] L.N. Plummer and E. Busenberg. The solubilities of calcite, aragonite and vaterite in CO2-H2O solutions between 0 and 90∘ C, and an evaluation of the aqueous model for the system CaCO3-CO2-H2O. Geochim. Cosmochim. Acta, 46(6):1011–1040, 1982.
- [58] D. Polag, D. Scholz, C. Mühlinghaus, C. Spötl, A. Schröder-Ritzrau, M. Segl, and A. Mangini. Stable isotope fractionation in speleothems: Laboratory experiments. Chem. Geol., 279(1-2):31–39, 2010.
- [59] L.J. Pratt. Critical conditions and composite Froude numbers for layered flow with transverse variations in velocity. J. Fluid Mech., 605:281–291, 2008.
- [60] P. Richon, F. Perrier, J. C. Sabroux, M. Trique, C. Ferry, V. Voisin, and E. Pili. Spatial and time variations of radon-222 concentration in the atmosphere of a dead-end horizontal tunnel. J. environ. radioactiv., 78(2):179–198, 2004.
- [61] S. Sánchez-Moral, V. Soler, J.C. Cañaveras, E. Sanz-Rubio, R. Van Grieken, and K. Gysels. Inorganic deterioration affecting the Altamira Cave, N Spain: quantitative approach to wall-corrosion (solutional etching) processes induced by visitors. Sci. Tot. Environ., 243:67–84, 1999.
- [62] D. Scholz, C. Mühlinghaus, and A. Mangini. Modelling 13C and 18O in the solution layer on stalagmite surfaces. Geochim. Cosmochim. Acta, 73(9):2592–2602, 2009.
- [63] C.M. Sherwin and J.U.L. Baldini. Cave air and hydrological controls on prior calcite precipitation and stalagmite growth rates: Implications for palaeoclimate reconstructions using speleothems. Geochim. Cosmochim. Acta, 75(14):3915–3929, 2011.
- [64] C. Spötl, I.J. Fairchild, and A.F. Tooth. Cave air control on dripwater geochemistry, Obir Caves (Austria): Implications for speleothem deposition in dynamically ventilated caves. Geochim. Cosmochim. Ac., 69(10):2451–2468, 2005.
- [65] H. Stoll, A. Mendez-Vicente, S. Gonzalez-Lemos, A. Moreno, I. Cacho, H. Cheng, and R.L. Edwards. Interpretation of orbital scale variability in mid-latitude speleothem 18O: Significance of growth rate controlled kinetic fractionation effects. Quat. Sci. Rev., 127:215–228, 2015.
- [66] C.V. Tadros, P.C. Treble, A. Baker, I. Fairchild, S. Hankin, R. Roach, M. Markowska, and J. McDonald. ENSO–cave drip water hydrochemical relationship: a 7-year dataset from south-eastern Australia. Hydrol. Earth Syst. Sci., 20(11):4625–4640, 2016.
- [67] F. Tinti, A. Barbaresi, S. Benni, D. Torreggiani, R. Bruno, and P. Tassinari. Experimental analysis of shallow underground temperature for the assessment of energy efficiency potential of underground wine cellars. Energ. Buildings, 80:451–460, 2014.
- [68] P.C. Treble, I.J. Fairchild, A. Griffiths, A. Baker, K.T. Meredith, A. Wood, and E. McGuire. Impacts of cave air ventilation and in-cave prior calcite precipitation on Golgotha Cave dripwater chemistry, southwest Australia. Quat. Sci. Rev., 127:61–72, 2015.
- [69] D.M. Tremaine. Dynamic physicochemical influences on speleothem paleoclimate proxy archives: A story of four north Florida caves. PhD thesis, THE FLORIDA STATE UNIVERSITY, 2015.
- [70] D.M. Tremaine and P.N. Froelich. Speleothem trace element signatures: a hydrologic geochemical study of modern cave dripwaters and farmed calcite. Geochim. Cosmochim. Acta, 121:522–545, 2013.
- [71] D.M. Tremaine, P.N. Froelich, and Y. Wang. Speleothem calcite farmed in situ: Modern calibration of 18O and 13C paleoclimate proxies in a continuously-monitored natural cave system. Geochim. Cosmochim. Acta, 75(17):4929–4950, 2011.
- [72] S. Verheyden, D. Genty, G. Deflandre, Y. Quinif, and E. Keppens. Monitoring climatological, hydrological and geochemical parameters in the Père Noël cave (Belgium): implication for the interpretation of speleothem isotopic and geochemical time-series. Int. Jour. Speleo., 37(3):6, 2008.
- [73] Y. Wang, H. Cheng, R.L. Edwards, X. Kong, X. Shao, S. Chen, J. Wu, X. Jiang, X. Wang, and Z. An. Millennial-and orbital-scale changes in the East Asian monsoon over the past 224,000 years. Nature, 451(7182):1090, 2008.
- [74] E. Wiedner, D. Scholz, A. Mangini, D. Polag, C. Mühlinghaus, and M. Segl. Investigation of the stable isotope fractionation in speleothems with laboratory experiments. Quatern. Int., 187(1):15–24, 2008.
- [75] T.M.L. Wigley and C. Brown. Geophysical applications of heat and mass transfer in turbulent pipe flow. Bound.-Lay. meteorol., 1(3):300–320, 1971.
- [76] C.I. Wong, J.L. Banner, and M. Musgrove. Seasonal dripwater Mg/Ca and Sr/Ca variations driven by cave ventilation: Implications for and modeling of speleothem paleoclimate records. Geochim. Cosmochim. Acta, 75(12):3514–3529, 2011.
- [77] C.I. Wong and D.O. Breecker. Advancements in the use of speleothems as climate archives. Quatern. Sci. Rev., 127:1–18, 2015.