A molecular line study toward massive EGO clumps in the southern sky: Chemical properties
Abstract
We present a molecular line study toward 31 extended green object (EGO) clumps in the southern sky using data from the MALT90 (Millimeter Astronomy Legacy Team 90 GHz). According to previous multiwavelength observations, we divide our sample into two groups: massive young stellar objects (MYSOs) and HII regions. The most detected lines are N2H+ (), HCO+ (), HNC (), HCN (), HC3N (), H13CO+ (), C2H () and SiO (), indicating that most EGOs are indeed associated with dense clumps and recent outflow activities. The velocity widths of the N2H+ (), H13CO+ (), C2H () and HC3N () lines are comparable to each other in MYSOs. However, in HII regions the velocity widths of the N2H+ () and C2H () lines tend to be narrower than those of H13CO+ () and HC3N (). Our results seem to support that N2H+ and C2H emissions mainly come from the gas inside quiescent clumps. In addition, we also find that the [N2H+]/[H13CO+] and [C2H]/[H13CO+] relative abundance ratios decrease from MYSOs to HII regions. These results suggest depletions of N2H+ and C2H in the late stages of massive star formation, probably caused by the formation of HII regions inside. N2H+ and C2H might be used as “chemical clocks” for massive star formation by comparing with other molecules such as H13CO+ and HC3N.
keywords:
stars: formation - ISM: abundances - ISM: molecules - ratio lines: ISM - ISM: clouds| EGO | R.A. | Dec. | V | IRDC? | Type | |
| name | (J2000) | (J2000) | (km s-1) | |||
| MYSOs | ||||||
| G10.340.14 | 18:09:00.0 | -20:03:35 | 12.4 | Y | MSX Dark | |
| G14.630.58 | 18:19:15.4 | -16:30:07 | 18.9 | Y | MSX Dark | |
| G309.380.13 | 13:47:23.9 | -62:18:12 | -50.5 | Y | MSX Dark | |
| G309.91+0.32 | 13:50:53.9 | -61:44:22 | -59.3 | Y | MSX Dark | |
| G313.76-0.86 | 14:25:01.3 | -61:44:57 | -50.7 | Y | radio-quiet RMS | |
| G326.41+0.93 | 15:41:59.4 | -53:59:03 | -41.3 | Y | MSX Dark | |
| G326.48+0.70 | 15:43:17.5 | -54:07:11 | -41.0 | Y | radio-quiet RMS | |
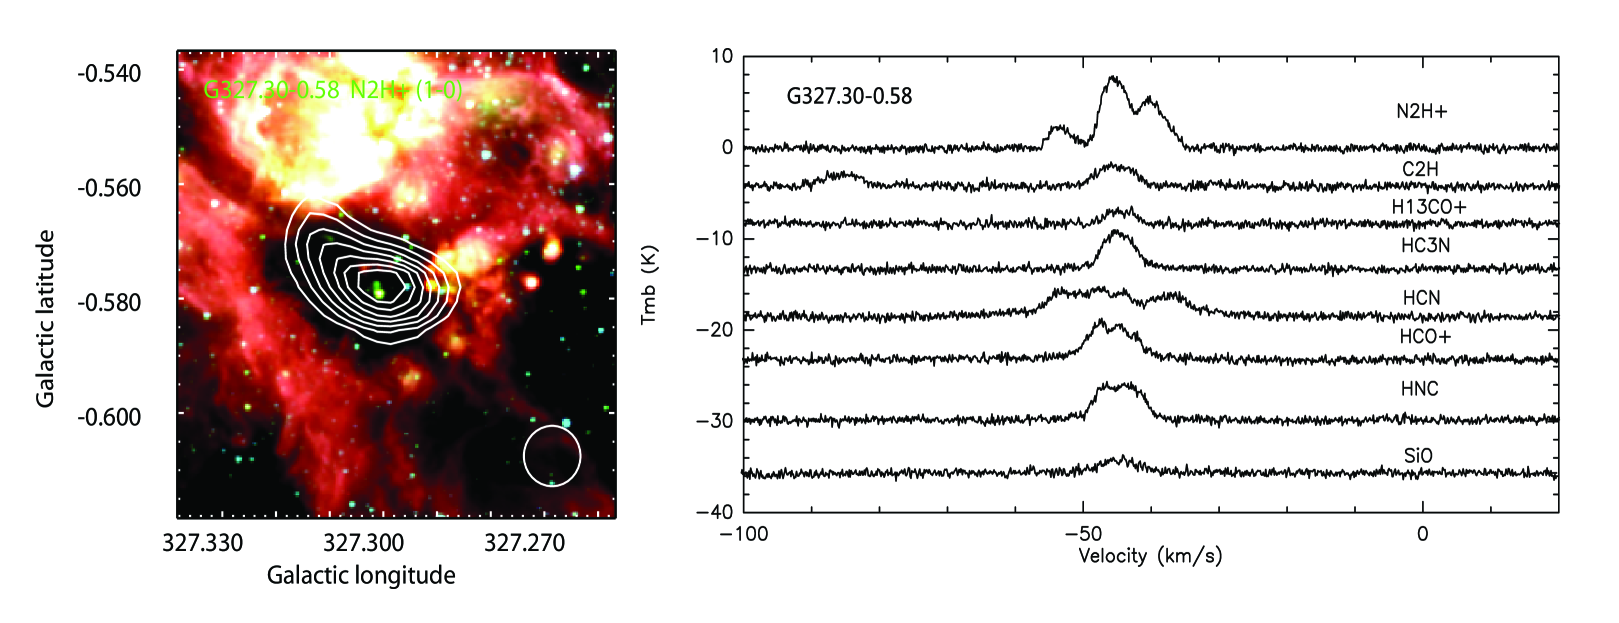
| G327.30-0.58 | 15:53:11.2 | -54:36:48 | -45.6 | Y | MSX Dark | |
| G329.07-0.31 | 16:01:11.7 | -53:16:00 | -42.2 | Y | radio-quiet RMS | |
| G331.51-0.34 | 16:13:11.7 | -51:39:12 | -48.5 | Y | MSX Dark | |
| G331.71+0.58 | 16:10:06.3 | -50:50:29 | -66.6 | Y | MSX Dark | |
| G331.71+0.60 | 16:10:01.9 | -50:49:33 | -67.6 | Y | radio-quiet RMS | |
| G332.35-0.44 | 16:17:31.4 | -51:08:22 | -48.1 | Y | MSX Dark | |
| G332.60-0.17 | 16:17:29.4 | -50:46:13 | -46.4 | Y | MSX Dark | |
| G332.47-0.52 | 16:18:26.5 | -51:07:12 | -51.3 | Y | radio-quiet RMS | |
| G333.13-0.56 | 16:21:36.1 | -50:40:49 | -58.8 | N | MSX Dark | |
| G333.32+0.10 | 16:19:28.9 | -50:04:40 | -46.2 | Y | radio-quiet RMS | |
| G338.92+0.55 | 16:40:33.6 | -45:41:44 | -62.7 | N | radio-quiet RMS | |
| G340.97-1.02 | 16:54:57.3 | -45:09:04 | -24.0 | Y | MSX Dark | |
| G343.50+0.03 | 16:59:10.7 | -42:31:07 | -29.5 | Y | MSX Dark | |
| HII regions | ||||||
| G12.42+0.50 | 18:10:51.1 | -17:55:50 | 18.3 | N | radio-loud RMS | |
| G310.15+0.76 | 13:51:59.2 | -61:15:37 | -54.7 | N | radio-loud RMS | |
| G320.23-0.28 | 15:09:52.6 | -58:25:36 | -65.9 | Y | radio-loud RMS | |
| G327.40+0.44 | 15:49:19.3 | -53:45:10 | -79.6 | Y | radio-loud RMS | |
| G330.88-0.37 | 16:10:19.9 | -52:06:13 | -62.1 | Y | radio-loud RMS | |
| G330.95-0.18 | 16:09:52.7 | -51:54:56 | -88.9 | Y | radio-loud RMS | |
| G331.13-0.24 | 16:10:59.8 | -51:50:19 | -85.8 | N | radio-loud RMS | |
| G337.40-0.40 | 16:38:50.4 | -47:28:04 | -40.4 | Y | radio-loud RMS | |
| G339.58-0.13 | 16:45:59.5 | -45:38:44 | -33.7 | Y | radio-loud RMS | |
| G340.05-0.25 | 16:48:14.7 | -45:21:52 | -52.9 | Y | radio-loud RMS | |
| G345.00-0.22 | 17:05:11.2 | -41:29:03 | -27.7 | Y | radio-loud RMS |
a: Velocity from the N2H+ (, , ) transition.
| EGO | N2H+ | H13CO+ | HCO+ | HNC | C2H | HC3N | SiO | |
| name | (km s-1) | (km s-1) | (km s-1) | (km s-1) | (km s-1) | (km s-1) | (km s-1) | |
| MYSOs | ||||||||
| G10.340.14 | 3.1(0.1) | 2.2(0.3) | 3.7(0.1) | 4.2(0.1) | 3.5(0.3) | 3.4(0.2) | - - - | |
| G14.630.58 | 3.0(0.1) | 2.9(0.3) | Ra | Bb | 3.2(0.2) | 2.5(0.1) | - - - | |
| G309.380.13 | 3.2(0.1) | - - - | R | 5.4(0.2) | - - - | 4.0(0.2) | - - - | |
| G309.91+0.32 | 3.1(0.1) | - - - | 5.3(0.3) | 4.3(0.2) | - - - | 2.4(0.3) | - - - | |
| G313.76-0.86 | 3.8(0.1) | 3.3(0.3) | 5.6(0.1) | 4.8(0.1) | 4.7(0.4) | 3.8(0.3) | - - - | |
| G326.41+0.93 | 3.0(0.1) | - - - | R | 4.1(0.3) | - - - | 6.7(1.1) | - - - | |
| G326.48+0.70 | 3.6(0.1) | 2.4(0.2) | 5.1(0.1) | 4.3(0.1) | 3.6(0.3) | 3.3(0.2) | 7.2(0.9) | |
| G327.30-0.58 | 4.1(0.1) | 4.9(0.2) | Cc | C | 6.2(0.2) | 5.5(0.1) | 7.1(0.3) | |
| G329.07-0.31 | 5.4(0.1) | - - - | 4.2(0.2) | 4.3(0.1) | 3.5(0.4) | 5.2(0.4) | - - - | |
| G331.51-0.34 | 2.2(0.1) | - - - | 2.4(0.1) | 2.1(0.1) | - - - | - - - | - - - | |
| G331.71+0.58 | 5.0(0.2) | 3.8(0.5) | B | R | - - - | 4.5(0.4) | 12.6(1.4) | |
| G331.71+0.60 | 3.9(0.1) | 4.3(0.5) | B | B | 3.8(0.4) | 2.8(0.2) | 5.1(0.5) | |
| G332.35-0.44 | 2.5(0.1) | - - - | 2.8(0.1) | 2.2(0.1) | - - - | - - - | - - - | |
| G332.47-0.52 | 3.5(0.1) | 2.8(0.3) | R | 5.2(0.2) | 3.6(0.2) | 3.4(0.2) | - - - | |
| G332.60-0.17 | 3.2(0.1) | - - - | B | 3.8(0.1) | - - - | - - - | - - - | |
| G333.13-0.56 | 3.5(0.1) | - - - | 4.5(0.2) | 4.0(0.2) | - - - | 5.2(0.4) | 8.7(1.0) | |
| G333.32+0.10 | 3.6(0.1) | - - - | R | 4.5(0.1) | 3.3(0.5) | 3.6(0.3) | - - - | |
| G338.92+0.55 | 7.2(0.2) | 6.9(0.5) | B | B | 7.1(0.5) | 6.5(0.3) | 7.9(0.6) | |
| G340.97-1.02 | 4.3(0.1) | 4.2(0.3) | B | B | 4.1(0.2) | 4.6(0.2) | 7.8(0.4) | |
| G343.50+0.03 | 2.9(0.1) | 2.7(0.4) | 3.4(0.1) | 2.9(0.1) | - - - | - - - | - - - | |
| HII regions | ||||||||
| G12.42+0.50 | 3.2(0.1) | 2.6(0.1) | B | B | 3.1(0.1) | 2.9(0.2) | - - - | |
| G310.15+0.76 | 3.5(0.2) | 2.2(0.2) | 7.9(0.2) | 4.4(0.2) | 2.7(0.2) | 4.4(0.5) | - - - | |
| G320.23-0.28 | 3.8(0.1) | 3.6(0.5) | 6.4(0.2) | 4.9(0.1) | 3.6(0.2) | 2.9(0.2) | - - - | |
| G327.40+0.44 | 4.1(0.2) | 5.0(0.7) | B | B | 4.0(0.4) | 6.2(0.5) | 7.2(0.6) | |
| G330.88-0.37 | 4.2(0.3) | 4.4(0.4) | 6.3(0.1) | 6.6(0.1) | 4.7(0.2) | 4.9(0.2) | - - - | |
| G330.95-0.18 | 11.1(0.6) | 8.2(0.8) | B | 8.6(0.3) | 7.1(0.5) | 9.9(0.6) | 8.9(0.8) | |
| G331.13-0.24 | 5.7(0.2) | - - - | B | B | - - - | 6.8(0.3) | - - - | |
| G337.40-0.40 | 3.6(0.1) | 4.1(0.2) | R | B | 4.0(0.2) | 4.9(0.2) | 7.6(0.6) | |
| G339.58-0.13 | 3.5(0.1) | - - - | 6.5(0.3) | 4.8(0.2) | - - - | - - - | - - - | |
| G340.05-0.25 | 3.8(0.1) | 5.7(0.4) | 7.6(0.2) | B | 3.7(0.3) | 4.8(0.2) | - - - | |
| G345.00-0.22 | 4.1(0.1) | 5.0(0.5) | 5.5(0.3) | R | 6.3(0.6) | 7.0(0.3) | 16.8(0.8) |
a: R denotes red profile.
b: B denotes blue profile.
c: C denotes the spectra is too complex.
| EGO | N2H+ | N2H+ | HCO+ | H13CO+ | C2H | C2H | |||||||
| group 1 | group 2 | ||||||||||||
| name | |||||||||||||
| K | K km s-1 | K | K km s-1 | K | K km s-1 | K | K km s-1 | K | K km s-1 | K | K km s-1 | ||
| MYSOs | |||||||||||||
| G10.340.14 | 1.32 | 3.96 (0.36) | 5.25 | 17.54 (0.37) | 4.17 | 16.39 (0.27) | 0.85 | 1.96 (0.22) | 0.70 | 2.78 (0.26) | 1.45 | 5.55 (0.29) | |
| G14.630.58 | 1.85 | 3.96 (0.18) | 5.02 | 16.23 (0.19) | 2.45 | 10.61 (0.36) | 0.89 | 2.72 (0.22) | 0.95 | 2.98 (0.21) | 1.34 | 4.66 (0.22) | |
| G309.380.13 | 0.80 | 2.19 (0.24) | 2.58 | 08.93 (0.26) | 2.52 | 07.35 (0.39) | - - - | - - - | - - - | - - - | - - - | - - - | |
| G309.91+0.32 | 1.61 | 2.86 (0.19) | 3.62 | 11.96 (0.24) | 1.81 | 10.18 (0.38) | - - - | - - - | - - - | - - - | - - - | - - - | |
| G313.76-0.86 | 1.43 | 3.69 (0.24) | 4.70 | 18.85 (0.31) | 6.84 | 40.49 (0.40) | 1.31 | 4.56 (0.30) | 0.61 | 2.78 (0.33) | 1.11 | 5.40 (0.35) | |
| G326.41+0.93 | 1.24 | 2.79 (0.22) | 5.30 | 17.04 (0.23) | 2.10 | 08.18 (0.68) | - - - | - - - | - - - | - - - | - - - | - - - | |
| G326.48+0.70 | 1.62 | 7.29 (0.45) | 6.08 | 23.35 (0.47) | 6.19 | 33.77 (0.49) | 1.39 | 3.44 (0.28) | 0.65 | 3.59 (0.43) | 1.32 | 5.21 (0.38) | |
| G327.30-0.58 | 2.38 | 9.27 (0.23) | 7.72 | 33.96 (0.53) | 3.84 | 32.70 (0.38) | 1.46 | 7.56 (0.30) | 1.31 | 8.71 (0.34) | 2.30 | 15.12 (0.34) | |
| G329.07-0.31 | 0.82 | 3.39 (0.10) | 2.75 | 15.70 (0.10) | 2.46 | 10.88 (0.34) | - - - | - - - | 0.47 | 1.52 (0.23) | 0.77 | 2.83 (0.25) | |
| G331.51-0.34 | 0.80 | 0.64 (0.14) | 1.64 | 03.86 (0.19) | 2.93 | 07.51 (0.22) | - - - | - - - | - - - | - - - | - - - | - - - | |
| G331.71+0.58 | 1.02 | 3.26 (0.25) | 2.90 | 15.54 (0.38) | 2.43 | 16.12 (0.91) | 0.49 | 2.01 (0.27) | - - - | - - - | |||
| G331.71+0.60 | 1.38 | 4.51 (0.23) | 3.80 | 15.84 (0.45) | 2.99 | 12.72 (0.49) | 0.72 | 3.28 (0.28) | 0.64 | 2.06 (0.27) | 0.95 | 4.04 (0.30) | |
| G332.35-0.44 | 0.84 | 1.42 (0.19) | 2.15 | 05.59 (0.24) | 3.66 | 11.01 (0.26) | - - - | - - - | - - - | - - - | - - - | - - - | |
| G332.47-0.52 | 1.11 | 2.51 (0.20) | 3.91 | 14.61 (0.26) | 3.51 | 21.62 (0.98) | 1.16 | 3.48 (0.27) | 0.76 | 2.64 (0.26) | 1.37 | 5.36 (0.29) | |
| G332.60-0.17 | 0.64 | 1.41 (0.24) | 2.60 | 08.88 (0.28) | 3.17 | 11.83 (0.72) | - - - | - - - | - - - | - - - | - - - | - - - | |
| G333.13-0.56 | 1.20 | 4.97 (0.11) | 3.33 | 12.23 (0.11) | 3.45 | 16.55 (0.57) | - - - | - - - | - - - | - - - | - - - | - - - | |
| G333.32+0.10 | 1.41 | 3.57 (0.14) | 4.54 | 17.26 (0.14) | 3.90 | 19.45 (1.22) | - - - | - - - | 0.56 | 1.12 (0.25) | 0.83 | 2.76 (0.33) | |
| G338.92+0.55 | 2.05 | 9.45 (0.39) | 5.93 | 51.66 (0.77) | 6.37 | 31.78 (0.50) | 1.07 | 7.87 (0.44) | 0.63 | 4.78 (0.46) | 0.98 | 7.72 (0.47) | |
| G340.97-1.02 | 1.53 | 5.64 (0.26) | 5.45 | 24.75 (0.36) | 7.60 | 38.63 (0.46) | 1.45 | 6.53 (0.33) | 0.69 | 2.64 (0.27) | 1.59 | 6.93 (0.31) | |
| G343.50+0.03 | 1.03 | 2.39 (0.19) | 3.75 | 11.41 (0.22) | 3.63 | 13.03 (0.23) | 0.65 | 1.88 (0.24) | - - - | - - - | - - - | - - - | |
| HII regions | |||||||||||||
| G12.42+0.50 | 0.66 | 1.98 (0.20) | 2.99 | 10.27 (0.22) | 8.33 | 24.25 (0.46) | 1.77 | 4.85 (0.22) | 1.01 | 3.35 (0.25) | 1.67 | 5.50 (0.23) | |
| G310.15+0.76 | 0.53 | 1.22 (0.22) | 1.78 | 06.53 (0.27) | 2.49 | 20.99 (0.43) | 1.27 | 2.97 (0.23) | 0.67 | 2.16 (0.26) | 1.38 | 4.18 (0.25) | |
| G320.23-0.28 | 1.12 | 3.10 (0.24) | 3.12 | 12.77 (0.34) | 2.58 | 17.46 (0.40) | 0.82 | 3.11 (0.31) | 0.89 | 3.43 (0.29) | 1.44 | 6.04 (0.31) | |
| G327.40+0.44 | 0.91 | 4.78 (0.40) | 2.78 | 12.01 (0.68) | 2.51 | 15.52 (0.64) | 0.58 | 3.05 (0.35) | 0.52 | 2.02 (0.30) | 0.87 | 3.51 (0.32) | |
| G330.88-0.37 | 0.34 | 2.38 (0.39) | 1.73 | 07.67 (0.40) | 5.62 | 37.74 (0.39) | 1.02 | 4.81 (0.33) | 0.96 | 5.47 (0.34) | 1.83 | 9.76 (0.33) | |
| G330.95-0.18 | - - - | - - - | 1.28 | 15.14 (0.71) | 4.58 | 45.80 (3.69) | 0.89 | 7.77 (0.63) | 0.40 | 2.80 (0.50) | 1.22 | 9.87 (0.59) | |
| G331.13-0.24 | 0.76 | 2.98 (0.29) | 2.48 | 15.51 (0.48) | 2.29 | 20.59 (1.95) | - - - | - - - | - - - | - - - | - - - | - - - | |
| G337.40-0.40 | 0.71 | 3.50 (0.30) | 3.10 | 11.94 (0.24) | 3.31 | 20.29 (0.55) | 1.61 | 6.97 (0.27) | 1.03 | 4.58 (0.27) | 1.99 | 8.36 (0.27) | |
| G339.58-0.13 | 1.04 | 3.27 (0.27) | 4.20 | 15.54 (0.30) | 1.66 | 11.47 (0.42) | - - - | - - - | - - - | - - - | - - - | - - - | |
| G340.05-0.25 | 1.11 | 3.68 (0.28) | 3.78 | 15.23 (0.33) | 2.90 | 23.48 (0.52) | 0.98 | 5.97 (0.39) | 0.72 | 3.89 (0.38) | 1.41 | 5.57 (0.30) | |
| G345.00-0.22 | 1.09 | 4.42 (0.24) | 2.94 | 12.85 (0.53) | 1.75 | 10.24 (0.37) | 0.72 | 3.94 (0.30) | 0.41 | 1.80 (0.29) | 0.72 | 4.25 (0.26) | |
| EGO | N2H+ | H13CO+ | C2H | ||||||
| name | Texa | Tex | N | ||||||
| (K) | (1013 cm-2) | (K) | (1013 cm-2) | (1014 cm-2) | |||||
| MYSOs | |||||||||
| G10.340.14 | 21.2(2.1) | 0.35(0.04) | 7.5(0.9) | 7.2(1.4) | 0.23(0.03) | 2.2(0.5) | 0.88(0.21) | 4.0(0.8) | |
| G14.630.58 | 14.8(0.5) | 0.56(0.08) | 6.2(0.3) | 5.5(1.1) | 0.44(0.04) | 3.8(1.0) | 1.78(0.34) | 4.8(0.5) | |
| G309.380.13 | 9.1(0.4) | 0.56(0.07) | 3.0(0.2) | - - - | - - - | - - - | - - - | - - - | |
| G309.91+0.32 | 15.4(1.0) | 0.49(0.06) | 4.6(0.4) | - - - | - - - | - - - | - - - | - - - | |
| G313.76-0.86 | 15.3(7.9) (A) | 0.49(0.04) | 7.2(3.8) | 9.9(2.0) | 0.21(0.03) | 5.1(1.5) | 0.36(0.10) | 5.1(1.9) | |
| G326.41+0.93 | 15.3(7.9) (A) | 0.57(0.10) | 6.7(3.4) | - - - | - - - | - - - | - - - | - - - | |
| G326.48+0.70 | 11.5(0.2) | 1.30(0.17) | 11.2(0.4) | 9.3(1.8) | 0.25(0.04) | 3.8(1.0) | 0.88(0.21) | 5.0(0.5) | |
| G327.30-0.58 | 16.6(1.4) | 0.85(0.08) | 15.8(1.6) | 6.9(1.4) | 0.47(0.06) | 9.6(2.1) | 0.54(0.18) | 15.1(3.5) | |
| G329.07-0.31 | 18.1(8.1) | 0.20(0.03) | 5.7(2.5) | - - - | - - - | - - - | 0.90(0.27) | 3.7(1.0) | |
| G331.51-0.34 | 15.3(7.9) (A) | 0.14(0.08) | 4.9(2.3) | - - - | - - - | - - - | - - - | - - - | |
| G331.71+0.58 | 7.4(0.5) | 1.10(0.12) | 6.6(0.6) | 6.0(1.2) | 0.18(0.02) | 2.3(0.8) | - - - | - - - | |
| G331.71+0.60 | 9.2(0.3) | 0.98(0.05) | 6.3(0.4) | 6.0(1.2) | 0.27(0.03) | 3.9(1.1) | 1.45(0.43) | 4.4(0.5) | |
| G332.35-0.44 | 7.8(0.8) | 0.59(0.05) | 1.9(0.4) | - - - | - - - | - - - | - - - | - - - | |
| G332.47-0.52 | 18.2(7.5) | 0.30(0.17) | 5.6(2.3) | 7.1(1.4) | 0.37(0.04) | 4.0(1.1) | 0.44(0.13) | 5.5(1.5) | |
| G332.60-0.17 | 15.3(7.9) (A) | 0.24(0.10) | 3.0(1.4) | - - - | - - - | - - - | - - - | - - - | |
| G333.13-0.56 | 6.7(0.4) | 2.30(0.17) | 8.2(0.6) | - - - | - - - | - - - | - - - | - - - | |
| G333.32+0.10 | 15.3(7.9) (A) | 0.47(0.06) | 6.5(3.1) | - - - | - - - | - - - | 1.49(0.45) | 4.4(1.8) | |
| G338.92+0.55 | 15.3(7.9) (A) | 0.67(0.10) | 16.4(8.2) | 9.5(1.8) | 0.18(0.03) | 8.6(2.4) | 1.14(0.34) | 9.2(2.3) | |
| G340.97-1.02 | 23.4(3.0) | 0.31(0.08) | 11.1(1.9) | 10.7(1.9) | 0.21(0.03) | 7.5(1.6) | 0.88(0.21) | 10.5(1.8) | |
| G343.50+0.03 | 33.6(3.5) | 0.13(0.05) | 6.1(0.7) | 6.6(1.3) | 0.20(0.02) | 2.1(0.6) | - - - | - - - | |
| HII regions | |||||||||
| G12.42+0.50 | 7.7(2.8) (A) | 1.10(0.15) | 4.3(1.6) | 11.4(2.2) | 0.24(0.04) | 5.6(1.7) | 0.90(0.27) | 5.1(0.4) | |
| G310.15+0.76 | 7.7(2.8) (A) | 0.50(0.08) | 2.1(0.8) | 6.0(1.2) | 0.55(0.06) | 4.1(1.1) | 0.48(0.19) | 2.9(0.9) | |
| G320.23-0.28 | 10.9(0.6) | 0.51(0.07) | 4.3(0.3) | 5.6(1.1) | 0.37(0.04) | 4.1(1.1) | 0.97(0.29) | 5.3(0.6) | |
| G327.40+0.44 | 6.2(0.3) | 2.20(0.13) | 8.1(0.8) | 5.8(1.1) | 0.23(0.03) | 3.6(1.0) | 0.60(0.18) | 3.0(0.4) | |
| G330.88-0.37 | 5.3(0.6) | 1.27(0.11) | 4.1(0.7) | 8.9(1.8) | 0.19(0.03) | 5.2(1.5) | 0.09(0.11) | 6.1(0.9) | |
| G330.95-0.18 | 7.7(2.8) (A) | 0.33(0.07) | 4.5(1.6) | 8.5(1.7) | 0.18(0.02) | 8.3(2.4) | 0.48(0.19) | 6.7(1.8) | |
| G331.13-0.24 | 7.7(2.8) (A) | 0.78(0.09) | 5.7(2.2) | - - - | - - - | - - - | - - - | - - - | |
| G337.40-0.40 | 7.8(0.5) | 1.08(0.09) | 5.0(0.6) | 6.3(1.2) | 0.67(0.08) | 10.0(2.7) | 0.07(0.13) | 5.3(0.5) | |
| G339.58-0.13 | 31.6(7.6) | 0.16(0.04) | 8.0(1.9) | - - - | - - - | - - - | - - - | - - - | |
| G340.05-0.25 | 12.5(6.1) | 0.52(0.04) | 5.3(1.7) | 6.5(1.3) | 0.33(0.04) | 7.2(2.1) | 0.11(0.21) | 4.1(1.2) | |
| G345.00-0.22 | 6.7(0.7) | 1.60(0.15) | 6.7(0.7) | 4.8(0.9) | 0.49(0.05) | 6.4(1.6) | 0.62(0.18) | 4.0(0.7) | |
a: The of N2H+ values marked with “A” represent the average value derived from other sources.
1 Introduction
Massive stars play an important role in the evolution of galaxies. They deposit large amounts of radiation and inject kinetic energy into their surrounding interstellar medium (ISM) in the form of outflows and stellar winds during their short lives. At the end of their lives they release various heavy elements into the cosmic space by means of supernova explosions. Understanding the formation of massive star is thus important to our knowledge of galaxy evolution. However, their formations are far less clear than their low-mass counterparts. Because they are rare and most of them have large distances ( 1 kc) from our solar system. Besides, young massive stars tend to form in clusters or groups with high dust extinction, which further makes observations of them challenging. In the last two decades, a lot of research has been done in astrophysics to understand the formation of massive stars and the feedback to their surrounding ISM (e.g. Zinnecker et al. 2007; Deharveng et al. 2010, and references therein). It is generally accepted that massive stars evolve through starless cores in infrared dark clouds (IRDCs) to hot cores with central young stellar objects, then to hypercompact and ultracompact HII regions, the final stages are compact and classical HII regions. However, these divisions of the process of massive star formation are rough. Many questions are still unresolved. More observations are needed for detailed understanding of their formation, and it is also essential to identify their chemical properties in different evolutionary stages.
To date many attempts have been done to search for massive star formation regions, using data from IRAS (e.g. Molinari et al. 1996), MSX (e.g. Lumsden et al. 2002; 2013) and/or Spitzer (e.g. Cyganowski et al. 2008) sky surveys. Cyganowski et al. (2008) identified more than 300 Galactic extended 4.5 m sources, naming extended green objects (EGOs) or “green fuzzies” for the common color coding of the 4.5 m band is green in Spitzer Infrared Array Camera (IRAC) three-color images. Although the exact nature of this enhanced emission is still uncertain (e.g. Reach et al. 2006; De Buizer Vacca 2010), EGOs seem to be mostly related to massive YSOs as the majority of them are associated with infrared dark clouds (IRDCs) and/or Red MSX Sources (RMSs) (Lumsden et al. 2002). Molecular line observations support that EGOs indeed trace a population with ongoing outflow activity and the central young protostars are still embedded in infalling envelopes (e.g. Chen et al. 2010; Cyganowski et al. 2011; He et al. 2012; Yu Wang 2013 ). In our sample of EGO clumps, 26 ( 84) are found to be associated with IRDCs. IRDCs provide us with the possibility to investigate the subsequently early stages of high mass star formation. Molecular line and dust continuum observations of IRDCs have shown that they are cold ( 30 k), dense (n(H2) 105 cm-3, N(H2) 1022 cm-3), and massive (in the range of 102 and 105 M⊙) structures with sizes of several parsec (e.g. Carey et al. 2000). The GLIMPSE and MIPSGAL surveys indicate different evolutionary stages of IRDCs (e.g. Churchwell et al. 2009; Carey et al. 2009). Chambers et al. (2009) proposed an evolutionary sequence in which “quiescent” clumps (contain no IR-Spitzer emission) evolve into “intermediate” (EGOs without 24 m emission), “active” (EGOs with 24 m emission) and “red” clumps (with bright 8m emission, probably HII regions).
Chemical composition of molecular gas is also thought to evolve due to the physical changes that occur during star formation processes. As material collapses and gets ionized by central young stars, densities and temperature rise, leading to the production and destruction of different molecular species. Although several studies have been carried out to investigate whether the evolutionary stages defined by Chambers et al. (2009) chemically distinguishable (e.g. Vasyunina et al. 2011; Sanhueza et al. 2012; Hoq et al. 2013; Miettinen 2014), chemical properties of massive star formation regions are still far less explored than their low-mass counterparts. Some observations (e.g. Hoq et al. 2013) indicate chemical processes in massive star formation may differ from those of low-mass star formation, as their physical conditions (such as density, temperature) are very different. With the aim to better understand the chemical evolution of massive star formation, we made a molecular line study toward 31 EGO clumps in the southern sky. We introduce our data and source selections in Section 2, results and analysis are given in Section 3 and 4, finally we summarize in Section 5.
2 data and source selections
Our multi-molecular line data is from MALT90. The MALT90 is a large international project aimed at characterizing the sites within our Galaxy where high-mass stars will form. The target clumps are selected from the 870 m ATLASGAL (APEX Telescope Large Area Survey of the Galaxy) to host the early stages of high-mass star formation. Exploiting the unique broad frequency range and fast-mapping capabilities of the Mopra 22-m telescope, MALT90 maps 16 emission lines simultaneously at frequencies near 90 GHz. These molecular lines will probe the physical, chemical properties and evolutionary states of dense high-mass star-forming clumps. The survey covers a Galactic longitude range of -60 to 15∘ and Galactic latitude range of -1 to +1 ∘. The observations were carried out with the newly upgraded Mopra Spectrometer (MOPS). The full 8 GHz bandwidth of MOPS was split into 16 zoom bands of 138 MHz each providing a velocity resolution of 0.11 km s-1. The angular resolution of Mopra is about 38 arcsec, with beam efficiency between 0.49 at 86 GHz and 0.42 at 115 GHz (Ladd et al. 2005). The maps were made with 9′′ spacing between adjacent rows. The MALT90 data includes (l, b, v) data cubes and (l, b) moment and error maps, and is publicly available from the MALT90 Home Page111See http://atoa.atnf.csiro.au/MALT90. More information about this survey can be found in Foster et al. (2011) and Jackson et al. (2013). The data processing was conducted using CLASS (Continuum and Line Analysis Single-Disk Software) and GreG (Grenoble Graphic) software packages.
With the aim to better understand the chemical evolution of massive star formation, we made a molecular line study toward 31 EGOs in the southern sky by applying the following criteria. (i)According to the work of Contreras et al. (2013) and Urquhart et al. (2014), the effective diameter of an EGO clump should be larger than the Mopra beam size ( 38 arcsec). (ii) At least one molecular line emission should be detected by MALT90. (iii)If an EGO clump is associated with a RMS source, it should be classified as “YSO” or “HII” by Urquhart et al. (2007). (iv)Sources should be far from bubble or known HII regions, considering the large beam of the 22 m Mopra telescope. Our sample involves 13 MSX dark sources and 18 RMSs. MSX dark sources are defined by Sakai et al. (2008) as objects with 8 m extinction features. Generally speaking, MSX dark sources correspond to the “intermediate” or “active” clumps defined by Chambers et al. (2009). We also have checked the GLIMPSE images of these MSX dark sources, none of them shows bright 8 m emission, indicating they are probably at earlier stages than HII regions. The RMS survey was conceived at Leeds to systematically search the entire Galaxy for MYSOs, by comparing the colors of sources from the MSX and Two-Micron All-Sky Survey (2MASS) point sources (Lumsden et al. 2002). Using the Australia Telescope Compact Array (ATCA), Urquhart et al. (2007) completed the 5 GHz observations of 892 RMS sources in the southern sky. Since radio interferometers may have difficulty imaging extended emission in the Galactic plane, we also have checked radio sky surveys such as NRAO VLA Sky Survey (NVSS) (1420 MHz; Condon et al. 1998), Sydney University Molonglo Sky Survey (SUMSS) (843 MHz; Mauch et al. 2003) and Westerbork Northern Sky Survey (WENSS) (325 MHz; Rengelink et al. 1997). These programmes divide our RMSs into two groups: radio-quiet and radio-loud RMSs. Finally, we divide our sample into two groups: MYSOs (13 MSX dark sources plus 7 radio-quiet RMSs) and HII regions (11 radio-loud RMSs). The information of our selected sources is listed in Table 1.
3 results
The most detected lines are N2H+ (), HCO+ (), HNC (), HCN (), HC3N (), H13CO+ (), C2H () and SiO () in our sources. Their detection rates are 100, 100, 100, 100, 71, 58, 61 and 33, respectively. N2H+ is a good tracer of dense gas in the early stages of star formation as it is more resistant to freeze-out on grains than the carbon-bearing species (Bergin et al. 2001). Although N2H+ () has 15 hyperfine transitions out of which seven have a different frequency (e.g. Daniel et al. 2006; Pagani et al. 2009), only three groups can be resolved in high-mass star formation regions because of turbulent line widths. In our sources all of the N2H+ spectra show a three-group line profile except G330.95-0.18. To get the line center velocity, line width and line intensity, we fitted the three groups with three Gaussian profiles with a fixed frequency separation between the transitions. For G330.95-0.18 we fitted a single Gaussian profile. C2H () has six hyperfine components out of which two ( and ) could easily be detected in our sample (see Figure 1). Like the method described above, we used a multi-Gaussian function to derive its line parameters. Although C2H was first detected by Tucker et al. (1974) in interstellar clouds, it has not been systematically studied in massive star formation regions. Observations indicate that C2H could trace photodissociation region (PDR) (e.g. Fuente et al. 1993). Beuther et al. (2008) proposed C2H could also trace dense gas in early stages of star formation, but later it is rapidly transformed to other molecules in the hot-core phase. Sanhueza et al. (2012) found no clear evolutionary trends for C2H column densities and abundances in their sample of IRDCs. On the other hand, Miettinen (2014) found that both the mean and median values of the C2H abundance are higher towards IR-dark clumps than towards IR-bright clumps, indicating C2H tend to trace the cold gas. More observations should be carried out to study C2H in massive star formation regions. H13CO+ and HC3N are also dense gas tracers and could always be regarded as optically thin lines as their line shape are relatively simple in our sources. According to chemical models the H13CO+ abundance does not vary so much with time (e.g. Bergin et al. 1997; Nomura Millar 2004). HC3N can trace both the cold molecular clouds and hot cores (e.g. Chapman rt al. 2009). We have fitted a single Gaussian profile to get their line parameters. HCO+ often shows infall signatures and outflow wings(e.g., Rawlings et al. 2004; Fuller et al. 2005). HNC is particularly prevalent in cold gas (Hirota et al. 1998). The HCO+ () and HNC () lines tend to show the so-called red or blue profiles in our sources, indicating outflow and/or large scale infall activities. SiO is often seen when SiO is formed from shocked dust grains, typically in outflows (Schilke et al. 1997). The detection rate of SiO is 50 in our H13CO+ detected EGO clumps. This value is consistent with that of He et al. (2012). Considering the large beam of Mopra, this detection rate is just a lower limit. HCN() has three hyperfine components. In the optically thin case, these components have relative intensities of 1:3:5. However, it is difficult to perform Gaussian fits and analyze the HCN lines, because most HCN transitions in our sources are blended, showing self-absorbed line profiles and extended wing emissions.
3.1 line widths
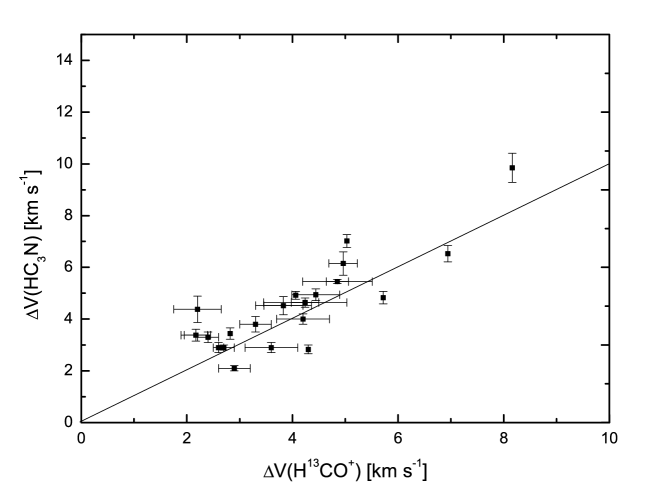
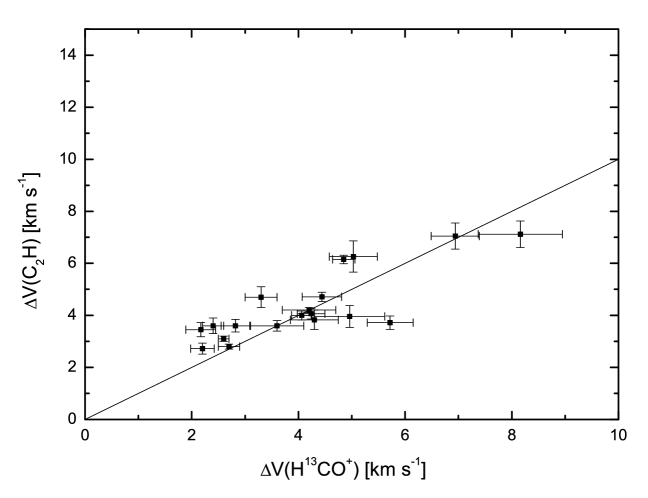
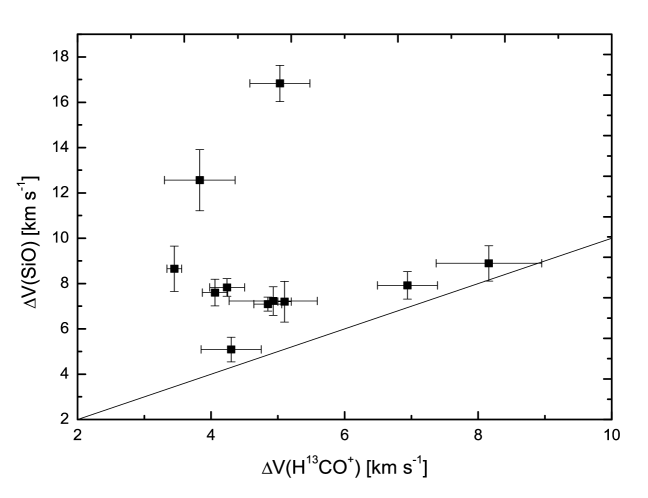
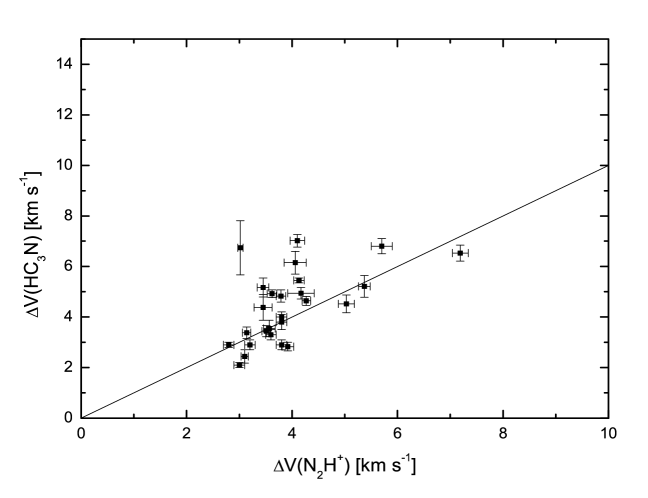
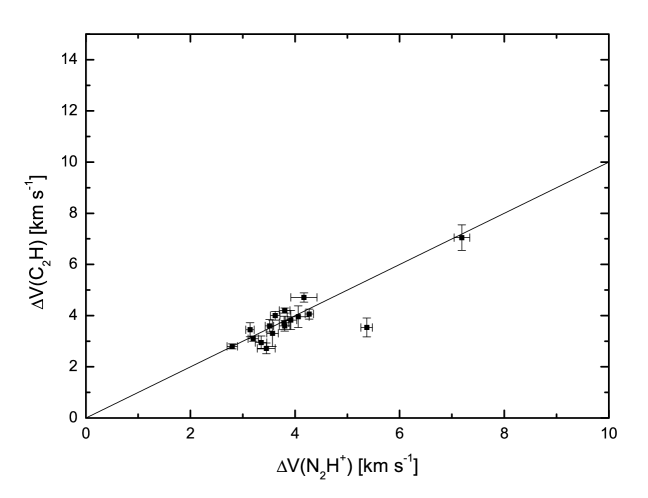
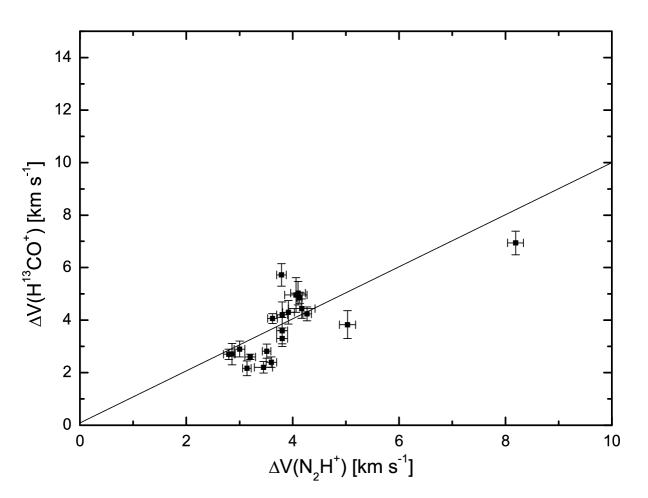
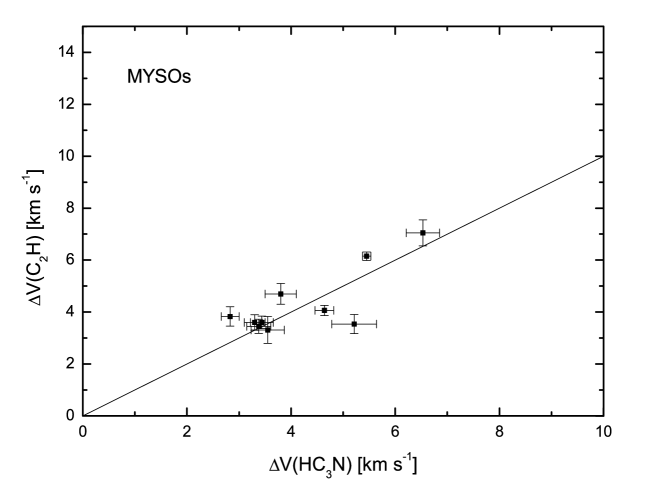
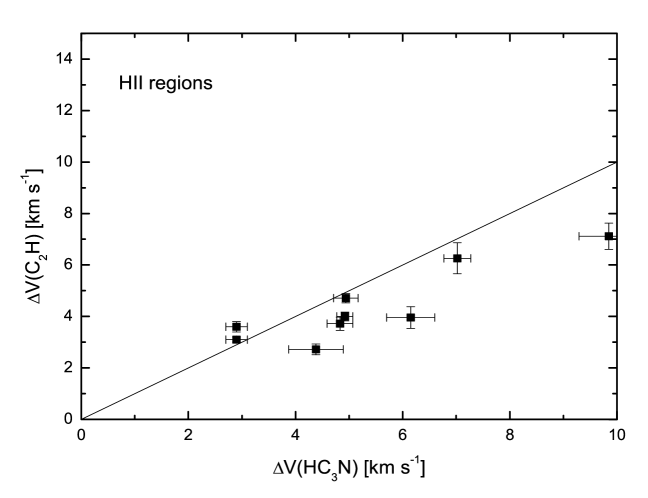
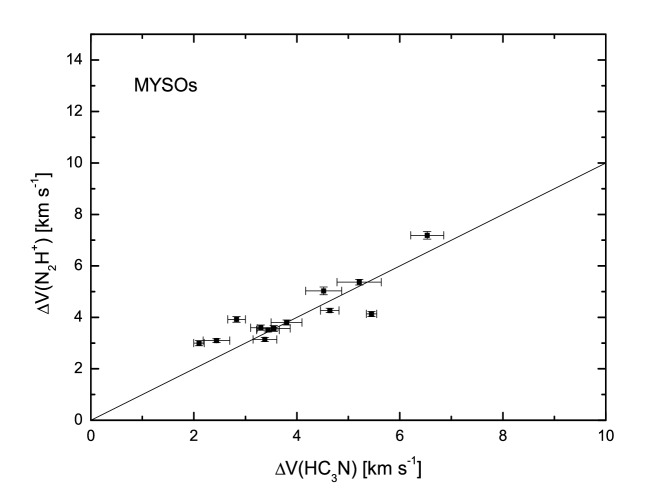
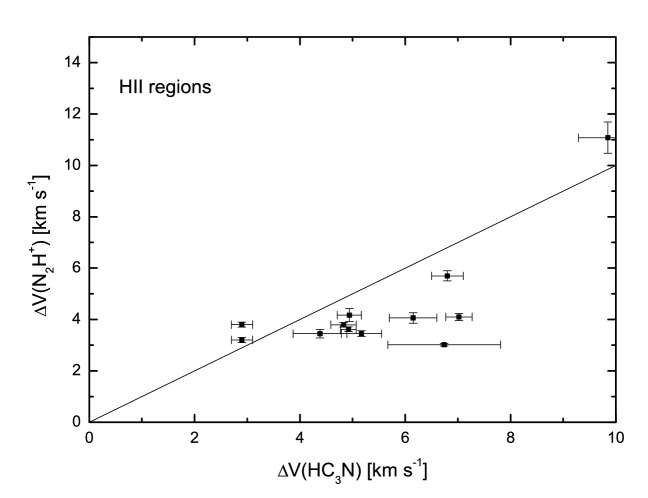
Molecular line widths observed in interstellar clouds give information about gas kinematics (such as turbulence, rotation, outflow and infall) inside. Optical depth could also enlarge line widths. Here we assume N2H+, C2H, H13CO+ and HC3N are all optically thin and their line widths mainly arise from turbulence. Figure 2 shows the line widths of several lines against those of H13CO+ and N2H+. It can be noted that the velocity widths of HC3N and C2H are similar to that of H13CO+. The width of SiO is always broader than that of H13CO+, showing a high degree of scatter. The scatter is probably caused by molecular outflow activities. The best V correlation with N2H+ is C2H, indicating their emissions might originate from the same region. Figure 3 shows plots of the velocity widths of C2H and N2H+ against those of HC3N in MYSOs and HII regions respectively. Velocity widths of C2H and N2H+ against H13CO+ have the similar situation and are omitted from display here. It is apparent that the velocity widths of these lines are comparable to each other in MYSOs. However, in HII regions the velocity widths of N2H+ and C2H tend to be narrower than those of H13CO+ and HC3N. Our results seem to support that N2H+ and C2H emissions do not come from the stirred up gas in the center of the clumps.
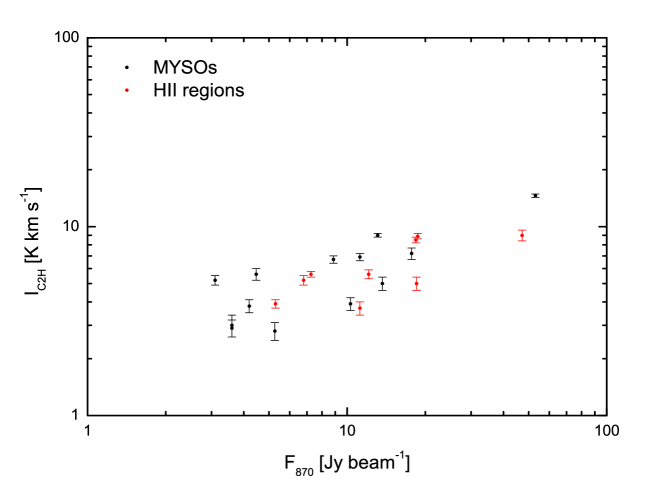
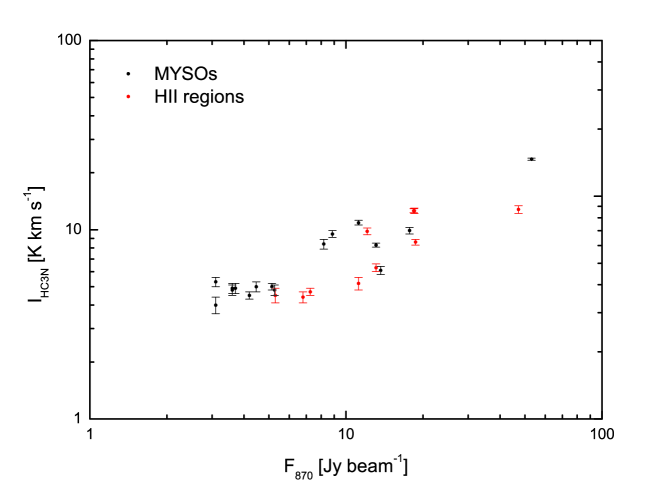
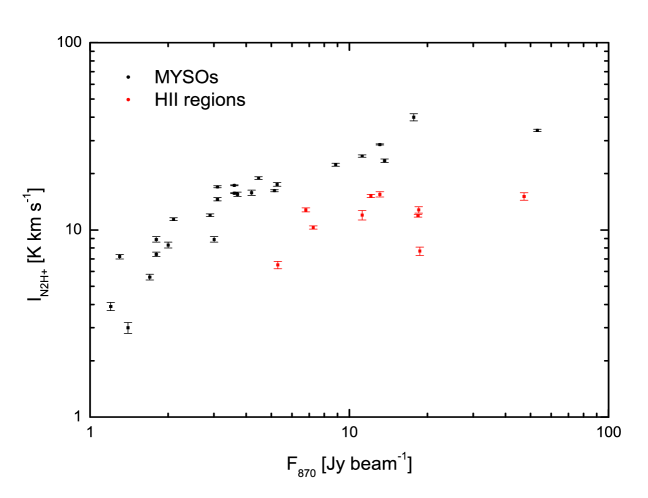
3.2 integrated intensities
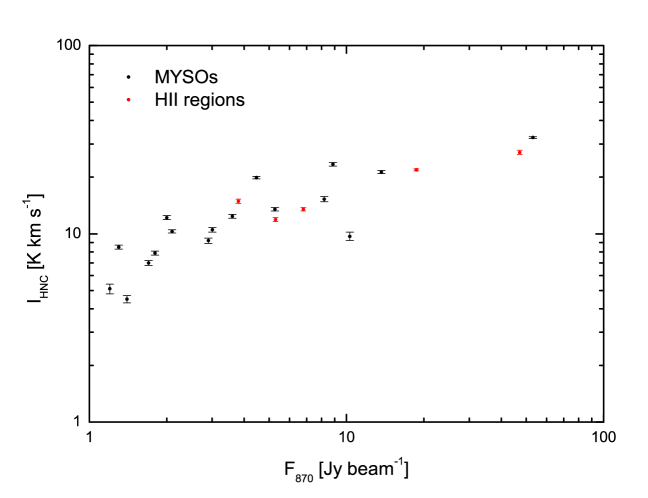
In Figure 4, we plot the integrated intensities of HNC (), C2H (), HC3N () and N2H+ (group 2 defined by Purcell et al. (2009)) against the 870 m peak flux from Contreras et al. (2013) and Urquhart et al. (2014). The HNC integrated intensity increases with the APEX 870 m peak flux both in MYSOs and HII regions. The integrated intensities of C2H and HC3N are not very different between MYSOs and HII regions. However, the N2H+ integrated intensities in MYSOs tends to be larger than those in HII regions. This may be caused by the depletions of N2H+ in HII regions. Both theories and observations of low mass star formation regions indicate N2H+ could be destroyed by CO (N2H+ + CO HCO+ + N2) and/or through dissociative recombination with electrons produced by UV photons from the central stars (N2H+ + e- N2 + H or NH + N). We may use this method to identify whether HII regions have formed in massive star formation regions.
3.3 column densities
Even though the 4.5m extent of an EGO is much smaller than the Mopra beam, it is not a viable proxy for the size of the 3 mm molecular line emission region. As the true size of our line emission region is unknown, we assume a beam filling factor of 1 for all lines. We derived the column densities of N2H+, H13CO+ and C2H from the observed lines by assuming the local thermodynamic equilibrium (LTE) conditions.
We followed the procedure outlined by Purcell et al. (2009) to estimate the optical depth of N2H+. Assuming the line widths of the individual hyperfine components are all equal, the integrated intensities of the three blended groups should be in the ratio of 1:5:3 under optically thin conditions. The optical depth can then be derived from the ratio of the integrated intensities of any groups using the following equation:
| (1) |
where is the expected ratio of under optically thin conditions. We determined the optical depth only from the intensity ratio of group 1/group 2, as anomalous excitation of the = 10-11 and 12-12 components (in our group 3) has been reported by Caselli et al. (1995). The optical depth of group 2 is listed in table 4 because it provides a better estimate for the excitation temperature when . Then the excitation temperature () for N2H+ could be calculated with the following formula:
| (2) |
The N2H+ optical depth of some clumps could not be derived through this method. Because their ( )/( ) ratios are less than 0.2, which is inconsistent with the assumptions we have made above. For these cases, we adopted the mean derived excitation temperature of 15.3 7.9 K for MYSOs and 7.7 2.8 K for HII regions. The column densities of N2H+ can be derived using Eq. (1) in Chen et al. (2013). The derived parameters are listed in Table 4. The derived optical depth of N2H+ (group 2) range from 0.10 to 2.3, with 79 below 1.0.
For HCO+ and H13CO+ the assumptions inherent in the LTE method are (1) the HCO+ emission is optically thick, (2) the molecules along the same LOS have a uniform excitation temperature, and (3) the excitation temperature is the same for the two isotopic species. With these assumptions, we calculate the excitation temperature according to
| (3) |
where is the rest frequency, is the temperature of the background radiation (2.73 K) and
| (4) |
The optical depth of H13CO+ can be derived by
| (5) |
Thus the column density of H13CO+ could also be determined using Eq. (1) in Chen et al. (2013). The derived parameters are listed in Table 4. It can be noted that H13CO+ (1-0) is optically thin in all our sources, ranging from 0.18 to 0.67. Assuming the [HCO+]/[H13CO+] abundance ratio is 50 (e.g. Purcell et al. 2006), the optical depths of HCO+ (1-0) should be in the range of 9.0 to 33.5, consistent with our assumptions. We also assumed H13CO+ (1-0) shares a common excitation temperature. Using Eq. (7) of Wienen et al. (2012), we recalculated the brightness temperature of H13CO+ (1-0). The derived values are nearly the same as the observed ones, suggesting beam dilution may be not a serious problem in our analysis.
The optical depth of C2H can be calculated through the intensity ratio of its hyperfine components. Under the assumption of optically thin, the intensity ratio of C2H () and C2H () should be 2.0 (Tucker et al. 1974). Thus, the opacity of the brightest component () is given by
| (6) |
The excitation temperature of C2H could not be derived directly. We assume that its is equal to that of N2H+, as has a good correlation with (see section 3.1). Although C2H is a linear molecular, its rotational energy levels are described by the rotational quantum number instead of (Sanhueza et al. 2012). Thus we used Eq. (1) and table 7 in Sanhueza et al. (2012) to calculate the column density of C2H. The derived parameters are also listed in Table 4.
4 discussions
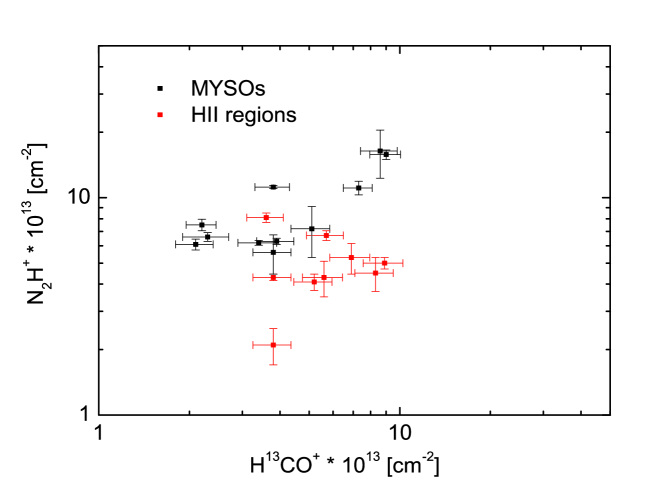
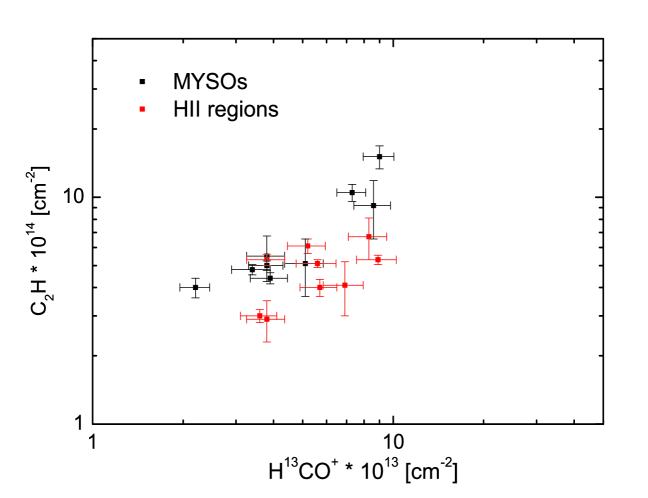
As is mentioned above, N2H+ is widely detected in low- and high-mass prestellar and protostellar cores, owing to its resistance of depletion at low temperature and high densities. In star formation regions, it is mainly destroyed by CO and through dissociative recombination with electrons produced by UV photons from the central stars (e.g. Yu et al. 2015). In the chemical models of low mass star formation, a relative enhancement of N2H+ abundance is expected in the cold prestellar phase, as CO is thought to be depleted in starless cores (e.g. Lee et al. 2003; Bergin & Tafalla 2007). When the central star evolves, the gas gets warm and CO should be evaporated from the dust grains if the dust temperature exceeds about 20 K (Tobin et al. 2013). Thus the N2H+ abundance should decrease as a function of evolutionary stage. Our column density of N2H+ ranges from 9.0 1012 to 1.8 1014 cm-2, with an average of 6.3 1013 cm-2. This value is consistent with that derived by Miettinen (2014) and is also very similar to that of Sakai et al. (2008). The top panel of Figure 5 shows column densities of N2H+ versus those of H13CO+. It is apparent that column densities of N2H+ in HII regions tend to be smaller than those in MYSOs. The H13CO+ column density could reflect the total amount of H2 density in a clump as its abundance does not vary so much with time according to the chemical models (e.g. Bergin et al. 1997; Nomura Millar 2004). HII regions are more evolved than MYSOs and should have accreted more material, which means the N2H+ column density should also increases. One good reason for this is the depletion of N2H+ in the late stages of massive star formation, probably caused by the formation of HII regions inside.
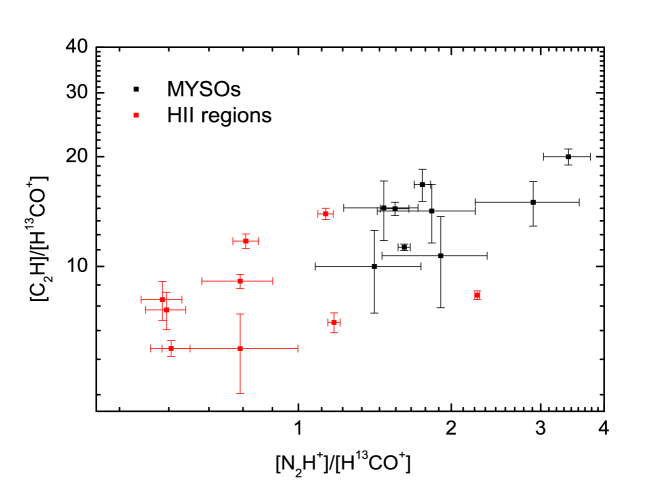
C2H was first detected by Tucker et al. (1974) in interstellar clouds. However, it has not been systematically studied in massive star formation regions. Only a few observations have been carried out to study chemical evolution of C2H in massive star formation regions. C2H could be formed through the photodissociation of acetylene (C2H2): C2H2 + C2H + H (Fuente et al. 1993). Thus it is regarded to be a photodissociation region tracer. However,Beuther et al. (2008) suggest C2H may preferentially exist in the outer part of dense gas clumps, as they found that the distribution of C2H shows a hole in the hot core phase. Given the large beam of Mopra, we cannot know the detail spatial distributions of C2H in our EGO clumps. Our study shows that the C2H velocity width is as narrow as the HC3N velocity width in the stage of MYSO. However, in HII regions the C2H velocity width tends to be narrower than that of HC3N, indicating the C2H emissions do not come from the stirred up gas in the center of the clumps. We could also note that the best V correlation with C2H is N2H+, indicating their emissions might originate from the same region. Li et al. (2012) observed 27 massive star formation regions with water masers. They found the C2H optical depth declines when molecular clouds evolve to a later stage, suggesting that C2H might be used as a “chemical clock” for molecular clouds. In our sample, the average optical depth of C2H is 0.88 in MYSOs and decreases to 0.48 in HII regions, consistent with their results. Figure 5 shows column densities of C2H versus those of H13CO+. It seems like that the C2H column densities in HII regions also tend to be smaller than those in MYSOs. Our result is consistent with the work of Beuther et al. (2008) and Miettinen (2014), who found that both the mean and median values of the C2H abundance are higher towards IR-dark clumps than towards IR-bright clumps. We guess in the hot dense core, carbon-chain molecules like C2H may rapidly transformed to other molecules, however, most of the carbon atoms in the central core are converted into CO, leading the production of C2H to be less effective. Since our limited data, more studies should be done in the near future to check out this speculation. Figure 6 shows the [N2H+]/[H13CO+] and [C2H]/[H13CO+] relative abundance ratios. The difference between MYSOs and HII regions is remarkable. Our study suggests depletions of N2H+ and C2H in the late stages of massive star formation, probably caused by the formation of HII regions inside. N2H+ and C2H might be used as “chemical clocks” for massive star formation by comparing with other molecules such as H13CO+ and HC3N.
5 summary
We present a molecular line study toward 31 EGO clumps in the southern sky using data from the MALT90. We divide our sample into two groups: MYSOs and HII regions, according to previous multiwavelength observations. We have found that the velocity widths of N2H+, C2H, H13CO+ and HC3N are comparable to each other in MYSOs. However, in HII regions the velocity widths of N2H+ and C2H tend to be narrower than those of H13CO+ and HC3N. These results support that N2H+ and C2H emissions mainly come from the gas inside quiescent clumps. We also found column densities of N2H+ and C2H decrease from MYSOs to HII regions. In addition, the [N2H+]/[H13CO+] and [C2H]/[H13CO+] abundance ratios also decrease with the evolutionary stage of the EGO clumps. These results suggest depletions of N2H+ and C2H in the late stages of massive star formation, probably caused by the formation of HII regions inside. N2H+ and C2H might be used as “chemical clocks” for massive star formation by comparing with other molecules such as H13CO+ and HC3N.
ACKNOWLEDGEMENTS
We thank the anonymous referee for constructive suggestions. This paper made use of information from the Red MSX Source survey database http://rms.leeds.ac.uk/cgi-bin/public/RMS-DATABASE.cgi and the ATLASGAL Database Server http://atlasgal.mpifr-bonn.mpg.de/cgi-bin/ATLASGAL-DATABASE.cgi. The Red MSX Source survey was constructed with support from the Science and Technology Facilities Council of the UK. The ATLASGAL project is a collaboration between the Max-Planck-Gesellschaft, the European Southern Observatory (ESO) and the Universidad de Chile. This research made use of data products from the Millimetre Astronomy Legacy Team 90 GHz (MALT90) survey. The Mopra telescope is part of the Australia Telescope and is funded by the Commonwealth of Australia for operation as National Facility managed by CSIRO. This paper is supported by National Key Basic Research Program of China ( 973 Program ) 2015CB857100.
References
- Bergin et al. (2007) Bergin, E. A., & Tafalla, M. 2007, ARA&A, 45, 339
- Bergin et al. (1997) Bergin, E. A., Goldsmith, P. F., Snell, R. L., Langer, W. D. 1997, ApJ, 482, 285
- Bergin et al. (2001) Bergin, E. A., Ciardi, D. R., Lada, C. J., Alves, J., & Lada, E. A. 2001, ApJ, 557, 209
- Beuther et al. (2008) Beuther, H., Semenov, D., Henning, T., & Linz, H. 2008, ApJ, 675, L33
- Carey et al. (2000) Carey, S. J., Feldman, P. A., Redman, R. O., et al. 2000, ApJ, 543, L157
- Carey et al. (2009) Carey, S. J. et al. 2009, PASP, 121, 76
- Caselli et al. (1995) Caselli, P., Myers, P. C., Thaddeus, P., 1995, ApJ, 455, 77
- Chambers et al. (2009) Chambers, E. T., Jackson, J. M., Rathborne, J. M., & Simon, R. 2009, ApJS, 181, 360
- Chapman et al. (2009) Chapman, J. F., Millar, T. J.,Wardle, M., et al. 2009, MNRAS, 394, 221
- Chen et al. (2010) Chen, X., Shen, Z., Li, J., Xu, Y., He, J. 2010, ApJ, 710, 150
- Chen et al. (2013) Chen, X., Gan, C.G., Ellingsen, S., He, J.H., Shen, Z.Q., Titmarsh, A., 2013, ApJS, 206, 22
- Churchwell et al. (2009) Churchwell, E., Babler, B. L., Meade, M. R., et al. 2009, PASP, 121, 213
- Condon et al. (1998) Condon, J. J., Cotton, W. D., Greisen, E. W., Yin, Q. F., Perley, R. A., Taylor, G. B., Broderick, J. J., 1998, AJ, 115, 1693
- Contreras et al. (2013) Contreras, Y., Schuller, F., Urquhart, J.S., et al. 2013, A&A, 549, A45
- Cyganowski et al. (2008) Cyganowski, C. J., Whitney, B. A., Holden, E., et al. 2008, AJ, 136, 2391
- Cyganowski et al. (2011) Cyganowski, C. J., Brogan, C. L., Hunter, T. R., Churchwell, E., Zhang, Q., et al. 2011, ApJ, 729, 124
- Daniel et al. (2006) Daniel, F., Cernicharo, J., & Dubernet, M.-L. 2006, ApJ, 648, 461
- De Buizer et al. (2010) De Buizer, J. M., & Vacca, W. D. 2010, AJ, 140, 196
- Deharveng et al. (2010) Deharveng, L., Schuller, L. D., Zavagno, A., et al. 2010, A&A, 523, 6
- Foster et al. (2011) Foster, J. B., Jackson, J. M., Barris, E. et al., 2011, ApJS, 197, 25
- Fuente et al. (1993) Fuente, A., Martin-Pintado, J., Cernicharo, J., & Bachiller, R. 1993, A&A, 276, 473
- Fuller et al. (2005) Fuller, G. A., Williams, S. J., Sridharan, T. K., 2005, A&A, 442, 949
- He et al. (2012) He, J. H., Takahashi, S., Chen, X., 2012, ApJS, 202, 1
- Hirota et al. (1998) Hirota, T., Yamamoto, S., Mikami, H., & Ohishi, M. 1998, ApJ, 503, 717
- Hoq et al. (2013) Hoq, S., Jackson, J. M., Foster, J. B., et al. 2013, ApJ, 777, 157
- Jackson et al. (2013) Jackson J. M. et al., 2013, PASA, 30, 57
- Ladd et al. (2005) Ladd, N., Purcell, C.,Wong, T., Robertson, S., 2005, Publ. Astron. Soc. Aust., 22, 62
- Lee et al. (2003) Lee, J.-E., Evans, N. J., II, Shirley, Y. L., & Tatematsu, K., 2003, ApJ, 583, 789
- Li et al. (2012) Li, J., Wang, J.Z., Gu, Q.S., Zhang, Z.Y., Zheng, X.W., 2012, ApJ, 745, 47
- Lumsden et al. (2012) Lumsden S. L., Hoare M. G., Urquhart, J. S. et al. 2013, ApJS, 208, 11.
- Lumsden et al. (2002) Lumsden, S. L., HoareM. G., Oudmaijer, R. D., Richards, D. 2002, MNRAS, 336, 621
- Mauch et al. (2003) Mauch, T., Murphy, T., Buttery, H. J., Curran, J., Hunstead, R.W., Piestrzynski, B., Robertson, J. G., Sadler, E., 2003, MNRAS, 342, 1117
- Miettinen et al. (2014) Miettinen, O., 2014, A&A, 562, A3
- Molinari et al. (1996) Molinari, S., Brand, J., Cesaroni, R., Palla, F. 1996, A&A, 308, 573
- Nomura et al. (2004) Nomura, H., & Millar, T. J. 2004, A&A, 414, 409
- Pagani et al. (2009) Pagani, L., Daniel, F., & Dubernet, M.-L. 2009, A&A, 494, 719
- Purcell et al. (2006) Purcell, C. R. et al. 2006, MNRAS, 367, 553
- Purcell et al. (2009) Purcell, C. R., Longmore, S. N., Burton, M. G., et al. 2009, MNRAS, 394, 323
- Rawlings et al. (2004) Rawlings, J. M. C., Redman, M. P., Keto, E., Williams, D. A., 2004, MNRAS, 351, 1054
- Reach et al. (2006) Reach, W.T., et al. 2006, AJ, 131, 1479
- Rengelink et al. (1997) Rengelink, R. B., Tang Y., de Bruyn, A. G., Miley, G. K., Bremer, M. N., Roettgering, H. J. A., Bremer, M. A. R., 1997, A&AS, 124, 259
- Sakai et al. (2008) Sakai, T., Sakai, N., Kamegai, K., et al. 2008, ApJ, 678, 1049
- Sanhueza et al. (2012) Sanhueza, P., Jackson, J. M., Foster, J. B., et al. 2012, ApJ, 756, 60
- Schilke et al. (1997) Schilke, P., Walmsley, C. M., Pineau des Forets, G., Flower, D. R., 1997, A&A, 321, 293
- Tobin et al. (2013) Tobin, J. J., Bergin, E. A., Hartmann, L., et al. 2013, ApJ, 765, 18
- Tucker et al. (1974) Tucker, K. D., Kutner, M. L., & Thaddeus, P. 1974, ApJ, 193, L115
- Urquhart et al. (2007) Urquhart, J. S., Busfield, A. L., Hoare, M. G., et al. 2007, A&A, 461, 11
- Urquhart et al. (2014) Urquhart, J. S., Csengeri, T., Wyrowski, F., et al. 2014, A&A, 568, 41
- Vasyunina et al. (2011) Vasyunina, T., Linz, H., Henning, Th., Zinchenko, I., Beuther, H., Voronkov, M., 2011, A&A, 527, A88
- Wienen et al. (2012) Wienen, M., Wyrowski, F., Schuller, F., et al. 2012, A&A, 544, A146
- Yu et al. (2013) Yu, N. P., Wang, J. J., 2013, RAA, 13, 28
- Yu et al. (2015) Yu, N. P., Wang, J. J., Li, N., 2015, MNRAS, 446, 2566
- Zinnecker et al. (2007) Zinnecker, H., & Yorke, H. W. 2007, ARA&A, 45, 481