A Multi-Wavelength Study of the Dynamic Environment surrounding the FUor V960 Mon
Abstract
The evolution of young stars and planet-forming environments is intrinsically linked to their nascent surroundings. This is particularly evident for FU Orionis (FUor) objects—a class of young protostars known for dramatic outbursts resulting in significant increases in brightness. We present a case study of V960 Mon, an FUor that has recently been found to show signs of a fragmenting spiral arm, potentially connected to planet formation. Our study explores the large-scale environment ( au) and incorporates ALMA band 3, band 4 and band 6 continuum data, molecular emissions from 12CO, 13CO, C18O, SiO, DCO+, N2D+and DCN, alongside optical and near-infrared observations from VLT/MUSE and VLT/SPHERE. We map a region of across where we find tantalizing emissions that provide a unique view of a young group of protostars, including the discovery of a class-0 protostar to the east of the FUor. The 12CO and SiO tracers suggest that this object is at the base of an outflow, potentially impacting the surrounding medium. The MUSE and SPHERE observations indicate the presence of an elongated feature towards a prominent source to the southeast that may represent interaction between V960 Mon and its surrounding. Moreover, the C18O emission overlaps with the clumps of the detected fragmenting spiral arm. These findings provide the strongest evidence to date for a connection between infalling material, fragmentation, and the intensity outburst of a protostar. Our case study highlights the complex interactions between young stars and their surroundings that drive the evolution of the planet forming environment.
1 Introduction
FUor events represent a transient phase in early stellar evolution, characterized by sudden and dramatic increases in luminosity. These luminous outbursts, typically elevating the star’s brightness by several magnitudes, are believed to result from episodic accretion events, during which a significant amount of material from the circumstellar disk is rapidly dumped onto the star (Hartmann & Kenyon, 1996; Audard et al., 2014). Such events not only alter the star’s appearance but also have profound implications for the evolution of the surrounding protoplanetary disk. It has been suggested that these episodic accretion events could play a pivotal role in the early stages of planet formation.
Firstly, the occurrence of an accretion burst has been suggested to be directly linked to planet-forming processes such as the Gravitational Instability (GI) (Armitage et al., 2001; Zhu et al., 2009; Stamatellos et al., 2011)111For a broader discussion on the origin of FUor events, see the review by Fischer et al. (2023). This association makes FUor objects prime targets for searching for signs of planet formation via GI. An important question in this context is how the high disk mass required to trigger GI can be sustained.
Secondly, the feedback from the enhanced accretion rates and consequent disk heating during FUor outbursts may influence the coagulation and composition of dust grains, potentially accelerating the formation of planetesimals (e.g. Zhu et al., 2009). As such, understanding FUor phenomena could provide valuable insights into the dynamic processes underpinning the birth and early evolution of planetary systems.
Building on these theoretical foundations, observational studies have significantly advanced our understanding of FUor phenomena and their implications for planet formation. Early observational efforts primarily focused on documenting the outburst characteristics, such as the rapid rise in brightness and spectral evolution (Herbig, 1977; Hartmann & Kenyon, 1985). More recently, high-resolution observations in the (sub)millimetre and polarimetric imaging in the near-infrared (NIR) have provided more information on the FUors’ surroundings. Some of these observations have revealed intricate details of the circumstellar environment during and after FUor outbursts, including changes in disk structure, temperature profiles, and dust grain properties (Cieza et al., 2016; Zurlo et al., 2017; Takami et al., 2018; Zurlo et al., 2024). The rapid temperature rise around FUor objects also reveals their chemical composition by evaporating disk compounds that would otherwise remain in solid form. This has facilitated the study of disks’ chemistry, in particular the detection and study of complex organic molecules (Lee et al., 2019, Jeong et al., 2025, Cruz-Sáenz de Meira et al. subm.) and water vapor (Tobin et al., 2023).
Recent numerical simulations support the notion that the origin of an FUor event can trace back to the extensive environment of the young star. For example, Kuffmeier et al. (2018) found that the material that falls from the molecular cloud onto the circumstellar disc could locally induce GI. GI facilitates the rapid transport of angular momentum and a subsequent accretion burst. Similarly, Dullemond et al. (2019) described a scenario in which material is captured from an adjacent cloudlet, triggering an accretion burst.
In a broader context, the structure and composition of the disk have been found to depend on the interaction with the environment, which can affect the processes of stellar evolution and planet formation (Pineda et al., 2023; Winter et al., 2024).
V960 Mon has received significant interest in the astronomical community due to its characteristic outburst properties and potential insights into early stellar evolution. First identified in its outburst state in 2014 (Maehara et al., 2014; Hillenbrand, 2014), V960 Mon presents an exceptional opportunity to study the mechanisms and consequences of FUor-type eruptions in real time. According to Gaia DR3, the system is located at a distance of pc (Gaia Collaboration et al., 2023). We employ this value with caution, as a high RUWE indicates possible systematic uncertainties, but it remains our distance estimate throughout this study. At a distance of kpc—which prevents resolving substructures around individual objects—this system offers an exceptional view into the accretion dynamics of young stellar systems and their interaction with the protostellar envelope.
V960 Mon poses a spectacular circumstellar environment, which putatively revealed the first evidence of GI-fragments of planetary masses. Weber et al. (2023) presented a polarimetric image in the NIR obtained with the VLT/SPHERE instrument which shows characteristic large-scale spiral arms. A complementing ALMA observation detected that one of those spiral arms seems to be undergoing fragmentation, indicated by several clumps of mm-emission that align along a spiral arm. Here, we further study the case of V960 Mon, turning our attention to the environment at an even larger scale (104 au), presenting continuum and molecular line emission in the mm regime and scattered light in the optical and NIR.
2 Observations and Data Reduction
2.1 ALMA
V960 Mon was observed by ALMA in band 6 (2016.1.00209.S, PI: M.Takami) on 20 April 2017 (compact configuration) and on 27 July 2017 (extended configuration). The observation included in total five spectral windows: two of a bandwidth of 1.875 GHz dedicated to the continuum at central frequencies of 216.877 GHz and 232.178 GHz; and three spectral windows of a bandwidth of 0.059 GHz to cover the transitions of 12CO, 13CO and C18O centered at 230.514 GHz, 220.375 GHz and 219.537 GHz, and channel widths of 15.259 kHz, 30.158 kHz, and 30.158 kHz, respectively.
The band 6 continuum data of a reduced field of view (FOV) around V960 Mon were presented in Kóspál et al. (2021, ) and further analyzed in Weber et al. (2023, ). Here, we used the band 6 continuum reduction with natural weighting presented in Weber et al. (2023), where self-calibration was performed on the compact and extended configurations separately before combining them. For details about the data reduction, we refer the reader to that article. For the spectral windows targeting the CO molecular lines, we subtracted the continuum from the lines and cleaned each channel with the CASA task tclean. We predefined cleaning masks by only permitting signal above three times the channel’s rms-noise, but where appropriate, we added user-defined masks to avoid losing the faint signal that reappears over several channels. We further inspected the continuum channels for the detection of molecular lines (see Appendix A), and identified SiO, N2D+, DCO+ and DCN. Because each molecular emission region has a unique spatial extent, we examined each case individually to identify baselines that produced sinusoidal artifacts from extended emission contamination and flagged them accordingly.
ALMA band 3 and band 4 data (both 2019.1.01144.S, PI: H.B. Liu) were taken on the 23 August 2021 and 22 August 2021, respectively. We reduced these data using natural weights. Both observations included four spectral windows dedicated to the continuum of a bandwidth of 1.875 GHz. They were centered at 86.00 GHz, 87.86 GHz, 98.19 GHz and 100.00 GHz for band 3 and 146.00 GHz, 147.86 GHz, 158.19 GHz and 160.00 GHz for band 4. Because the continuum emission shows a low signal-to-noise ratio (SNR) in bands 3 and 4, and no significant improvement was expected, we did not perform any self-calibration. We list the resulting dimensions of the clean beam and the SNR of each band in Table 1.
| ALMA Band | Beam | Project-ID | |
|---|---|---|---|
| Band 6 | 28 | 2016.1.00209.S | |
| Band 4 | 25 | 2019.1.01144.S | |
| Band 3 | 23 | 2019.1.01144.S |
2.2 VLT/MUSE
V960 Mon was observed on the night of 24 January 2021 using the Multi Unit Spectroscopic Explorer (MUSE) at the VLT (0106.C-0510, PI: F. Cruz-Saenz de Miera) with a total integration time of 25.6 min. The observing conditions were excellent (seeing: 0.7”, a coherence time of 5 ms, a wind speed of 6 m s-1 at 30 m altitude). The spectrograph divided the light into 3721 channels of nm, ranging from nm to nm. To process the data, we used the mpdaf.obj-package222https://mpdaf.readthedocs.io/en/latest/index.html (Bacon et al., 2016, version 3.6). To generate an image with sufficient signal, we stacked the spectral channels. Our analysis of the data revealed that the signals of interest, particularly those emanating from the large-scale environment of the FUor object, are predominantly found in the longer wavelength channels. Therefore, in our stacking process, we selectively included the 1000 channels with the longest wavelengths (810–935 nm). We then binned these 1000 channels into 50 representative channels. In each representative channel, we subtracted the average of columns and rows to remove the vertical and horizontal stripes seen on the detector. A spectral analysis of the line emission will be carried out in a later study.
2.3 VLT/SPHERE total intensity
The -band VLT/SPHERE image presented in Weber et al. (2023), focused exclusively on the polarized component of the observed light. However, the same observation (098.C-0422, PI: L. Cieza) also provides the total intensity (i.e., the sum of both beams on the detector). To obtain the total intensity, we summed all the aligned object frames. We produced the total intensity using the IRDAP reduction pipeline333https://irdap.readthedocs.io/en/latest/ (van Holstein et al., 2020, version 1.3.5).
3 Results
3.1 ALMA continuum emission
V960 Mon was observed by ALMA in band 6, band 4 and band 3. In a previous study, Weber et al. (2023) reported a fragmenting spiral arm in the band 6 continuum. Their analysis focused on unresolved clumps detected at roughly the 5 level. We do not find any band 3 or band 4 counterparts to these clumps. This non-detection is consistent with thermal emission from the clumps, which would yield fluxes of in band 4 and in band 3 for the rms-noise values listed in Table 1.
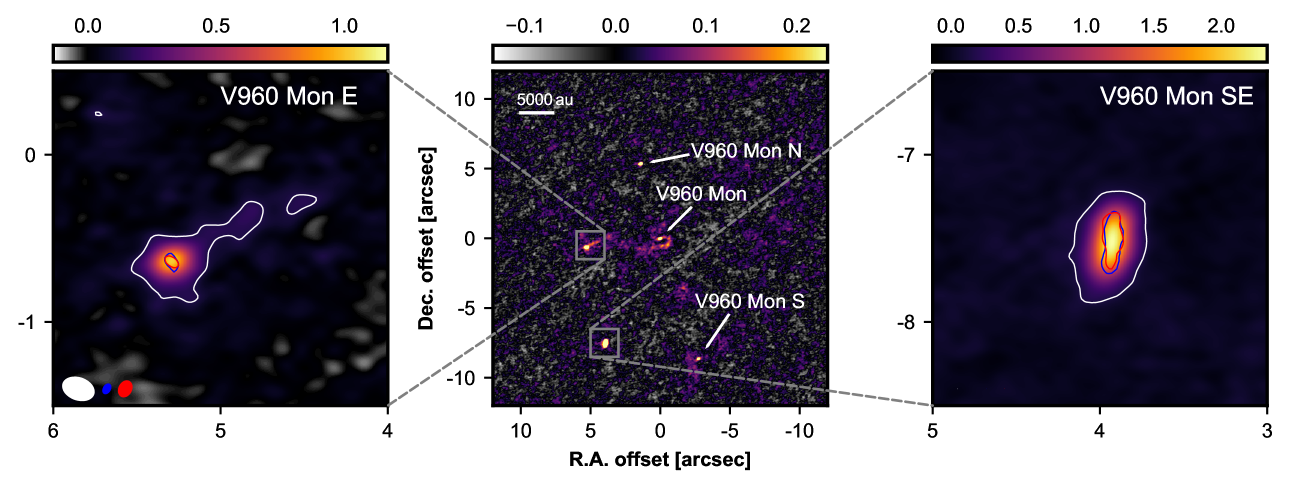
When inspecting the large-scale environment of the FUor, several bright sources appear in the FOV as shown in the band 6 image in the central panel of Fig. 1. Following Kóspál et al. (2021), we labeled these sources V960 Mon for the outbursting star at the center of the image, V960 Mon N for the northern object, V960 Mon E for the eastern object, V960 Mon SE for the southeastern object and V960 Mon S for the southern object. The sources, their projected position relative to V960 Mon, their continuum flux in the different bands, the corresponding estimated dust masses and spectral indices are listed in Table 2. To convert flux into mass, we assumed a dust temperature of 20 K and an opacity of .
Sources and Limits
V960 Mon N has been detected several times (see e.g. Kóspál et al., 2015), as it is also present in the optical and NIR. We detected it in all three analyzed continuum bands.
V960 Mon E was previously reported from the same ALMA band 6 data set in Kóspál et al. (2021), but was not confirmed in any other observations. Here, we found that it also shows significant emission in ALMA bands 3 and 4, as shown in the left panel of Fig. 1 where the contours show the emission at 5 for the different bands. The peak emission reaches , and in bands 3, 4 and 6, corresponding to 0.161 mJy beam-1, 0.35 mJy beam-1 and 1.12 mJy beam-1.
The source V960 Mon SE is even more luminous. It was first reported in Kóspál et al. (2015), where the authors showed that the compact emission does not appear for observational wavelengths µm but already dominates the flux of the system at µm. The right panel of Fig. 1 shows the 5 contours for the three different ALMA bands, centered on V960 Mon SE. In contrast to V960 Mon E, this source appears resolved in all three observations, at least along the North-South axis. It clearly shows that the emission is elongated along this axis, ruling out emission from a single point source. To estimate the structure’s spatial extent, we fitted a two-dimensional Gaussian to the band 4 data. The fit yielded full width at half maximum (FWHM) values for a major axis of and a minor axis of . If this continuum emission stems from a disk-like configuration, the corresponding disk radius would be au, with an inclination of , and a position angle of .
Finally, we detected the unresolved source V960 Mon S in band 6 and band 4, while band 3 does not yield a significant detection.
Spectral Index
To investigate the nature of the detected emission, we calculated the spectral indices for the sources in the FOV, for different band combinations, following the formula:
| (1) |
where is the observed flux from an object in two distinct bands and , and is the corresponding representative frequency. We calculated the representative frequencies by averaging the respective values of the continuum spectral windows and find GHz, GHz and GHz.
| Name | |||||||||||
|---|---|---|---|---|---|---|---|---|---|---|---|
| V960 Mon | – | – | 0.045 | 0.36 | 0.94 | 40 | 77 | 71 | 1.9 | 2.30.5 | 2.10.3 |
| N | 5.54 | 14.7 | 0.17 | 0.42 | 1.09 | 151 | 90 | 82 | 3.10.2 | 1.70.4 | 2.30.2 |
| E | 5.32 | 96.6 | 0.12 | 0.42 | 1.66 | 107 | 92 | 125 | 2.80.2 | 1.60.2 | 2.10.1 |
| SE | 8.46 | 152.4 | 0.62 | 2.49 | 6.41 | 558 | 540 | 482 | 1.70.4 | 2.70.5 | 2.10.4 |
| S | 9.05 | 197.7 | – | 0.20 | 0.82 | – | 42 | 62 | 2.10.4 | – | – |
Table 2 lists the spectral indices calculated from different bands for the five most prominent flux sources in the band 6 FOV. The uncertainties given for the spectral indices in Table 2 stem from error propagation of the uncertainties in the flux measurement due to the rms-noise. We add a note of caution: while including band 6 in the spectral index calculation is advantageous—thanks to its higher S/N and greater frequency separation—it may also introduce a systematic error. The band 6 observations were carried out approximately four years before the band 4 and band 3 data. Since V960 Mon (and possibly other detected sources) appears variable, a variability on anual timescales would significantly compromise the spectral index analysis. Band 3 and band 4 data were taken on subsequent days.
In source S, the only measurement of the spectral index, , is consistent with 2. In the remaining four sources, the values of are also consistent with 2. These sources are likely optically thick at 225 GHz with optical depth 5, similar to the bright Class-II disks in the Taurus-Auriga region (Chung et al., 2024), which is expected by Delussu et al. (2024). We briefly discuss the better-detected sources – V960 Mon, N, E, and SE – in the following.
V960 Mon, Source SE
The values of are comparable to or slightly smaller than 2. In the latter case, the maximum dust grain sizes, , may be close to 100 m, causing the spectra to appear anomalously reddened due to dust scattering (Liu, 2019). The values of are larger than . This may imply that the optical depths of the dominant (sub)millimeter emitters become 1–3 at the central frequency of our ALMA band 4 observations, 153 GHz, although uncertainties remain depending on the assumed dust temperatures, , and dust opacity tables (cf. Section 5.2.1 of Chung et al. 2024).
Source N, E
The values of are likely somewhat smaller than 2, while the values of are close to 2.5–3. These are similar to what was observed in the archetypal FUor, FU Ori (Liu et al., 2019, 2021), which were also resolved in many Class 0/I YSOs (Li et al., 2017). There are two probable interpretations: (1) Dust emission is very optically thick at 93 GHz frequencies, and the value of in the dominant (sub)millimeter emitters is a few times 100 µm (depending on the assumed dust composition and porosity). In such cases, the dust albedo can increase around 100 GHz and then decrease at higher frequencies (cf. Figure 3 in Liu 2019). This leads to anomalously reddened and bluened spectra at 100 GHz and 200 GHz, respectively (for an example, see the SED model for DM Tau in Liu et al. 2024). (2) Dust emission is very optically thick, and there is a temperature gradient in the line of sight and the warmer emitters are obscured by the colder ones. This configuration may be realized for edge-on sources (Galván-Madrid et al., 2018), or for sources that are dominantly heated by dissipative processes in the gaseous disks (e.g., viscous or shock heating, etc; Liu et al. 2019, 2021; Zamponi et al. 2021). These two interpretations are not mutually exclusive. To discern the values of , future spatially resolved observations at more frequency bands, or the (sub)millimeter linear polarization observations to probe signatures of dust self-scattering, are necessary. The observed, lower in these two sources may also be partly explained by the contribution of optically thin free-free emission. Nevertheless, previous JVLA surveys toward the Corona Australis, Ophiuchus, and Orion molecular clouds showed that free-free emission in low-mass YSOs (without including proplyds around OB stars) is commonly not bright enough to contribute significantly at 90 GHz frequencies (Liu et al., 2014; Coutens et al., 2019; Tychoniec et al., 2021).
3.2 Molecular line emission
| Molecule | log | |||||
|---|---|---|---|---|---|---|
| 12CO | 2–1 | 230.538 | 0.04 | 16.6 | 0.024 | |
| 13CO | 2–1 | 220.399 | 0.08 | 15.9 | 0.024 | |
| C18O | 2–1 | 219.560 | 0.08 | 15.8 | 0.024 | |
| DCN | 3–2 | 217.238 | 0.67 | 20.9 | 80.5 | |
| DCO+ | 3–2 | 216.113 | 0.68 | 20.7 | 142.0 | |
| N2D+ | 3–2 | 231.322 | 0.63 | 22.2 | 312.1 | |
| SiO | 5–4 | 217.105 | 0.67 | 31.2 | 48.0 |
The spectral windows of the ALMA band 6 observation cover several molecular transition lines. For line detection, we extracted spectra directly from the visibilities of each spectral window, identifying signals corresponding to rotational transitions of 12CO, 13CO, C18O, SiO, DCO+, N2D+ and DCN. This approach is effective for detecting the brightest emission lines, as visibilities inherently integrate spatial information including noise. To achieve more robust detections and isolate emission from individual sources, we subsequently performed the analysis on the reconstructed data cubes for each line. These molecules, the detected rotational transitions, their reference frequency, the velocity resolution of the observation in the respective spectral window, and the upper energy level of the transitions are listed in Table 3.
3.2.1 CO isotopologues
We measured the rms-noise per respective channel width of , and . We collapsed the CO data cubes and calculated the moment-0 (integrated intensity) and moment-1 (intensity‐weighted mean velocity) maps using the bettermoments package (Teague & Foreman-Mackey, 2018). For both moments, we applied sigma clipping below 2 and smoothed the threshold mask over one beam size to avoid steep edges in the mask.
| Object | [ km s-1] | molecule |
|---|---|---|
| V960 Mon | 24.25 | 12CO |
| V960 Mon E | 23.19 | 13CO |
| V960 Mon SE | 23.55 | 12CO |
| V960 Mon S | 26.38 | 12CO |
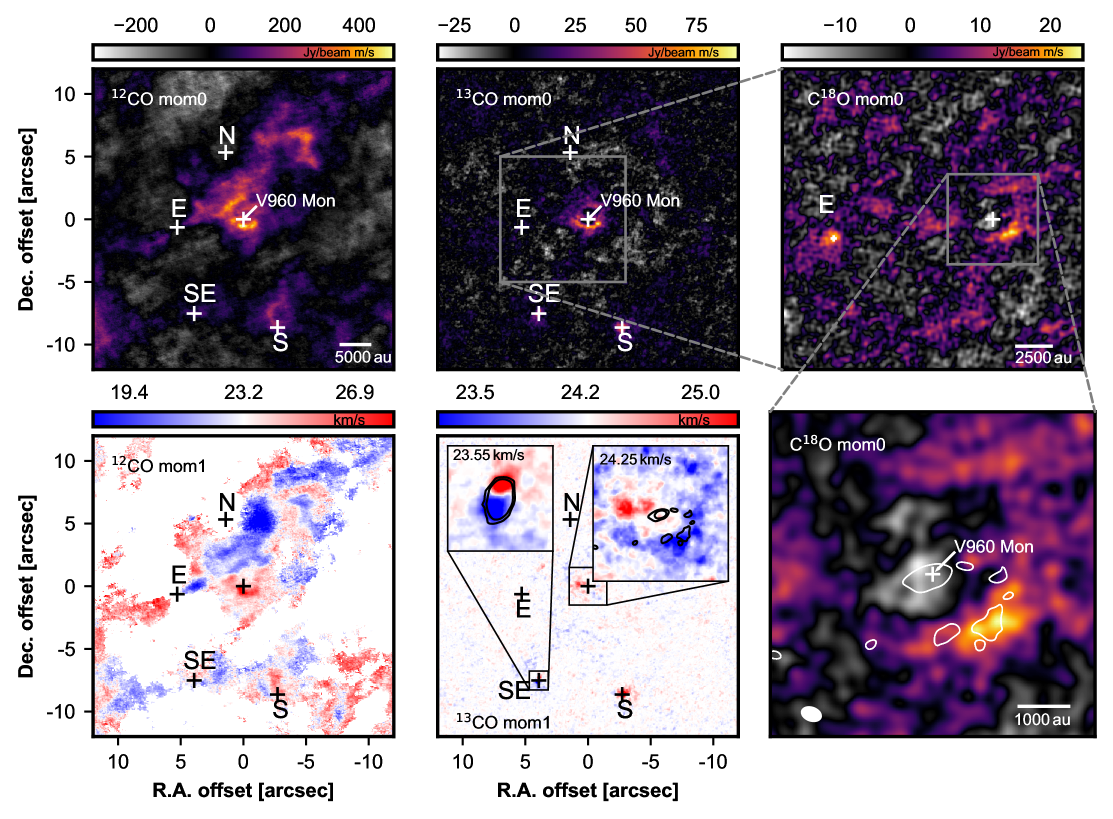
Fig. 2 shows the resulting moment-0 maps of the CO isotopes at different spatial scales and moment-1 maps for 12CO and 13CO. From these data, we inferred the line of sight velocities listed in Table 4 and described in Appendix B.
12CO
The left column of Fig.2 presents the 12CO isotopologue, where significant foreground emission obscures the region surrounding V960 Mon. We estimated the rms-noise of the moment-0 map to be . Examination of the 12CO kinematics in the central left bottom panel reveals blue- and red-shifted lobes spectrally centered around a velocity of approximately km s-1, and spatially centered on the mm-continuum source designated as V960 Mon E. This pattern suggests a projected outflow velocity of about km s-1, originating from the unclassified object V960 Mon E. We further discuss this feature in Sec. 3.2.2 and Sec. 4.
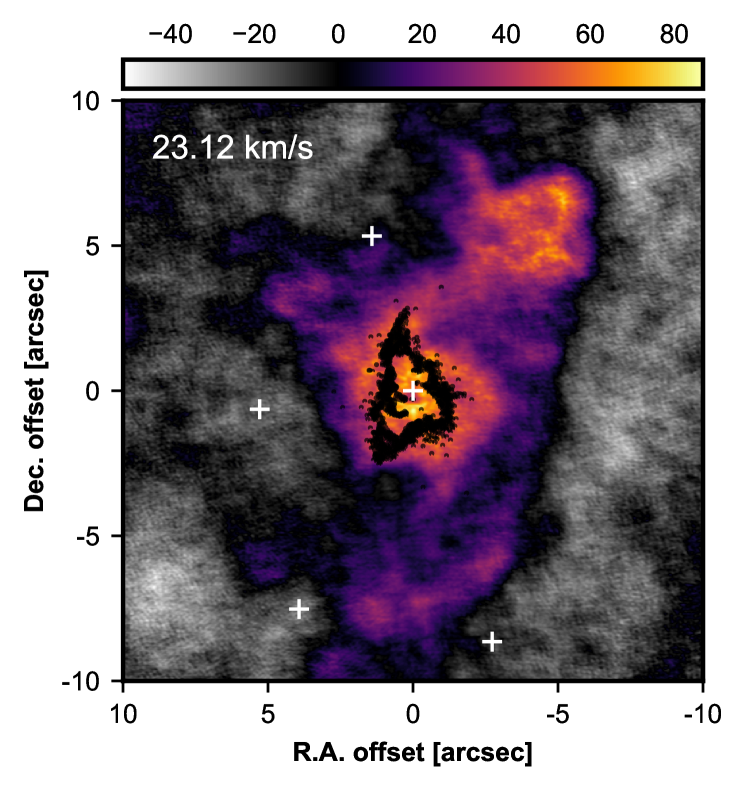
When integrating over the entire spectral axis, multiple emission components blend along the line of sight. Fig. 3 shows the emission of 12CO recorded at 23.12 km s-1 (we stacked channels from 22.92 km s-1to 23.32 km s-1to increase the SNR). At these velocities, the signal shows gas around the primary, while also including what seems to be interaction with slightly blue-shifted gas reservoirs to the northwest and south. For comparison, the black contours show the polarized light of the SPHERE -band image (Weber et al., 2023), which delineate a spiral structure possibly related to the large-scale interaction.
13CO
The central panels of Fig. 2 show the moments of the optically thinner 13CO emission. We estimated the noise of the moment-0 map to be . Within the field of view, we identified three principal regions of 13CO emission: in the vicinity of the primary source V960 Mon, near V960 Mon SE, and around V960 Mon S. Notably, all three regions coincide with band 6 continuum emission at levels above . The bottom central panel of Fig. 2 shows the moment-1 map of the 13CO line, where a blue/red-pattern centered on the continuum emission of V960 Mon SE becomes apparent, suggesting rotation around a massive compact source. Around V960 Mon, we found red-shifted contributions towards the northeast, while the clumps in the southwest are co-located with blue-shifted line emission.
C18O
The right column of Fig. 2 displays the moment-0 map of detected C18O emission around V960 Mon. The measured noise of the map is . The top right panel shows the region including V960 Mon and the E source. Emission from the V960 Mon E is detected with a maximum of . The bottom right panel focuses on the area closer to V960 Mon, coinciding with the fragmented continuum spiral presented in Weber et al. (2023). The C18O emission at the clumps’ location reaches a maximum value of . The detection of C18O suggests a substantial gas content associated with the clumps, indicating that the fragmentation is not confined solely to the dust phase.
3.2.2 Further species
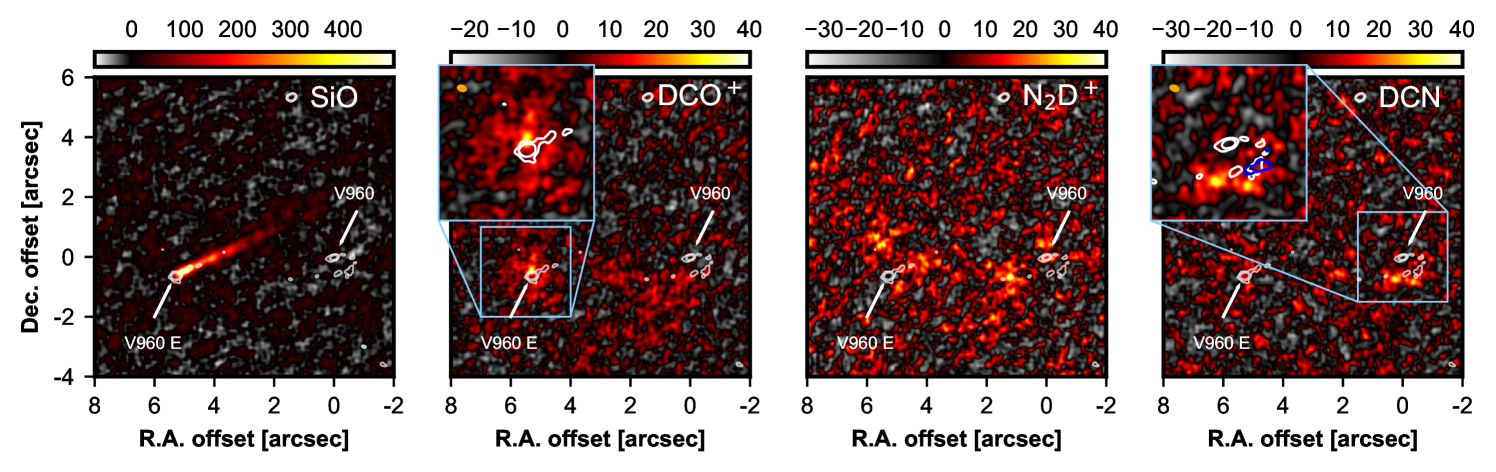
In Fig. 4 we show the tracers, SiO, DCO+, N2D+ and DCN, that we detected in the spectral windows that were dedicated to the continuum emission. To produce the moment-0 map we used bettermoments without any sigma-clipping or smoothing. The following paragraphs discuss the distribution and significance of each tracer. The deuterated species are thought to be a product of deuterium fractionation that distributes deuterium from HD into other species (Nomura et al., 2023). The deuterium fraction is expected to be significantly enhanced in cold areas (K), the detection of deuterium can therefore inform about the local temperature. Nevertheless, the different deuterated species are detected at very different locations in the image, necessitating investigation of each molecule individually. As seen from Table 3, DCO+, N2D+ and DCN all have similar upper energy states (K). This implies that differences in the distribution of their emission arise primarily due to different local abundances and line strengths, rather than excitation temperatures.
SiO
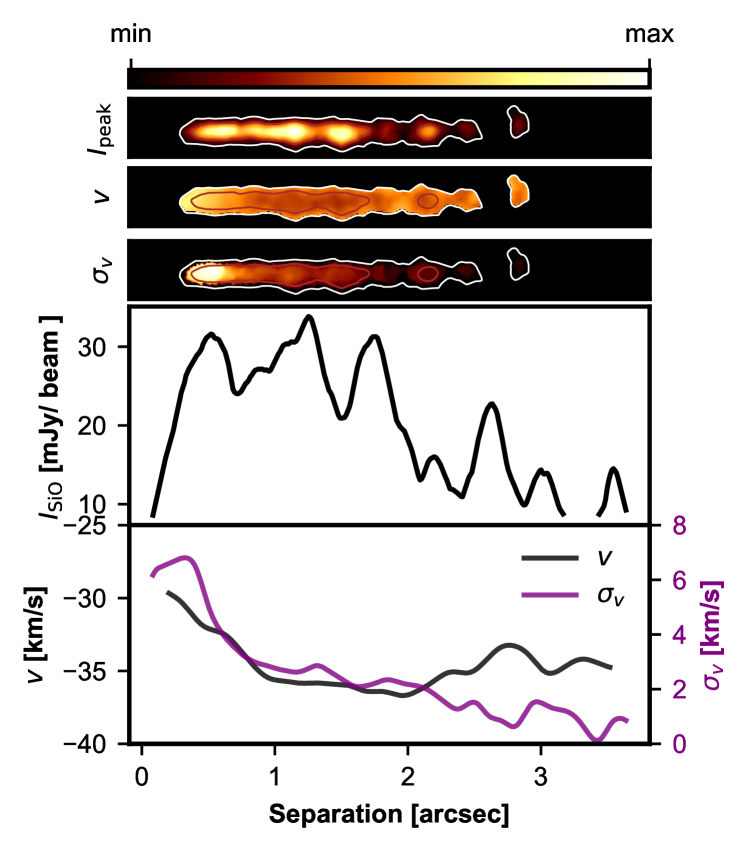
The left panel of Fig. 4 displays the moment-0 map of Silicon monoxide (SiO) with an rms-noise of . The image shows a strong and collimated emission feature attached to V960 Mon E. The peak emission of the SiO feature is shifted by km s-1 with respect to the restframe, so about 37.1 km s-1 relative to the systematic velocity of V960 Mon E (22.3 km s-1). Such collimated SiO emission is typically linked to a high velocity jet shocking with the surrounding medium. This is characteristic for actively accreting class-0 stars (e.g. Codella et al., 2007). While the SiO feature is spatially very confined, it is widely spread over different velocity channels, with a typical FWHM line width of about 10 km s-1 (from km s-1 to km s-1 with respect to V960 Mon E). These broad emission lines are typical of shocked regions (e.g. Bachiller & Pérez Gutiérrez, 1997). For Fig. 5, we rotated the jet by to align it horizontally. In the three upper panels of Fig. 5, we show the peak intensity, moment-1 and moment-2 (intensity weighted velocity dispersion, ), overlayed with the peak intensity contours at 10, 20 and 40. The white contours display that the width of the jet is roughly constant with separation. We fit a Gaussian function to the jet width and retrieve a FWHM of , similar to the band 6 beam size. For the two lower panels of Fig. 5, we extract the maximum values (minimum, for moment-1) along the vertical direction in the top panels. To reduce the spiky structure of the velocity profiles, we smoothed the distribution with a Gaussian kernel. The intensity profile highlights that the emission is distributed in several knots along the jet. Similar behavior has been detected in SiO jets for several other class-0 objects (e.g. Codella et al., 2007; Podio et al., 2016; Wang et al., 2019). Here, we measure a periodic reoccurrence of the knots with a distance of about 055 between consecutive maxima and a clear detection of at least seven peaks. In the bottom panel of Fig. 5 we show that the relative line of sight velocity to V960 Mon E becomes more blue-shifted with distance, ranging from about km s-1 at the base of the jet, to about km s-1 at distances larger than . However, this effect may not represent a genuine acceleration but could instead reflect jet rotation within . By contrast, the velocity dispersion is greatest near to V960 Mon E ( km s-1) and declines with distance. To estimate the time interval between jet expulsions from the angular separations measured in the image plane, we assume that the jet velocity in the plane of the sky is comparable to its line of sight velocity ( km s-1) and that all the knots have this same constant velocity. From this, we find that the knots correspond to expulsion events roughly every 150 years, consistent with the periodicity found for molecular jets in other systems (see Lee, 2020, for a review). This variability implies that V960 Mon E is episodically accreting.
DCO+
We detected the deuterated formylium ion (DCO+) in the vicinity of V960 Mon E. The moment-0 map presented in the center-left panel of Fig. 4 has a rms-noise of . Notably, the DCO+ emission is spatially offset from the continuum source by , corresponding to a projected distance of approximately 644 au. The presence of DCO+ requires some amount of gas-phase CO and low temperatures. The asymmetry of the DCO+ emission near V960 Mon E might result from low SNR or indicate an intrinsically non-uniform environment, possibly shaped by outflows from V960 Mon E itself and by the complex gravitational interactions with the surrounding system. We further detect some DCO+ emission from around V960 Mon S which is shown in Appendix A.
N2D+
The center right panel of Fig. 4 shows the moment-0 map of N2D+ with an rms-noise of . The ion N2D+ is destroyed by reactions with CO, inhibiting its detection in CO-rich regions (e.g. Caselli et al., 2002). Hence, N2D+ emission is strongly anti-correlated with CO. Such conditions typically arise in cold environments where CO freeze-out onto dust grains prevails, supporting both the presence of N2D+ and its deuterium enrichment. In contrast to the more spatially localized DCO+ emission, the detected N2D+ distribution is relatively diffuse, appearing as sparse emission to the northeast of V960 Mon E and in the region between V960 Mon E and V960 Mon. The emission is only marginally above 3 in four channels and primarily appears in the channel centered at 23.72 km s-1 (see Appendix A). Notably, the detected N2D+ signal locally overlaps with faint continuum band 6 emission, suggesting the presence of a potential bridging structure. Such filamentary connections have been discussed in the context of multiple stellar-formation scenarios (e.g., Kuffmeier et al., 2019; Gieser et al., 2024) and in cases involving stellar flybys (e.g., Cuello et al., 2020; Ménard et al., 2020).
DCN
The right panel of Fig. 4 shows the moment-0 map of DCN with an rms-noise of .
The DCN emission is co-located with portions of the fragmented continuum spiral arm around V960 Mon.
The detection is based on four adjacent spectral channels between 23.03–25.05 km s-1, with the maximum emission at 23.70 km s-1 (see Appendix A).
In the right panel of Fig. 4, we overlay the moment-0 contours of the C18O transition on the DCN emission.
This comparison highlights a clear anti-correlation: DCN is more prominent in the outer regions of the spiral, whereas it is depleted toward the inner clumps, where C18Ois strongest.
The presence of DCN in the outer clumps implies a substantial gas reservoir at these locations, and the C18O detection farther inward suggests that gas extends along the entire fragmented continuum spiral.
Furthermore, the detection of DCN—alongside the non-detections of DCO+ and N2D+—implies that this region has recently evolved from a very cold environment to one that is slightly warmer.
The ionized deuterated species such as DCO+ and N2D+ are more easily depleted than DCN once the temperature rises (e.g. Rodgers & Millar, 1996; Aikawa et al., 2005; Liu et al., 2015).
Therefore, the observed DCN emission, combined with the lack of DCO+ and N2D+, supports a scenario in which the local chemistry is transitioning from a cold to a mildly warmer state.
This is consistent with the recent FUor event, which is expected to heat the surrounding region through irradiation.
However, a temperature increase could also be connected to contraction of the related clumps.
As stated in Tychoniec et al. (2021), the protostellar envelope is well-traced by C18O, DCO+ and N2D+, all of which are detected around V960 Mon E. The different locations and distributions at which we detect the signal indicate warmer and colder regions, characterized by the freeze-out of CO. Additionally, it is noteworthy that we do not detect any significant 13CO or C18O emission above the noise level centered on the outbursting star V960 Mon. This might be due to large-scale contamination in the image that is filtering out the emission from the primary. The deuterated lines originate in smaller regions, making them less affected by this. The northern companion, V960 Mon N, shows no trace of any molecular tracer, nor does it show any connections to other objects in the field of view. This raises the question if V960 Mon N is truly associated with V960 Mon, or whether it is a fore- or background star.
3.3 MUSE imaging
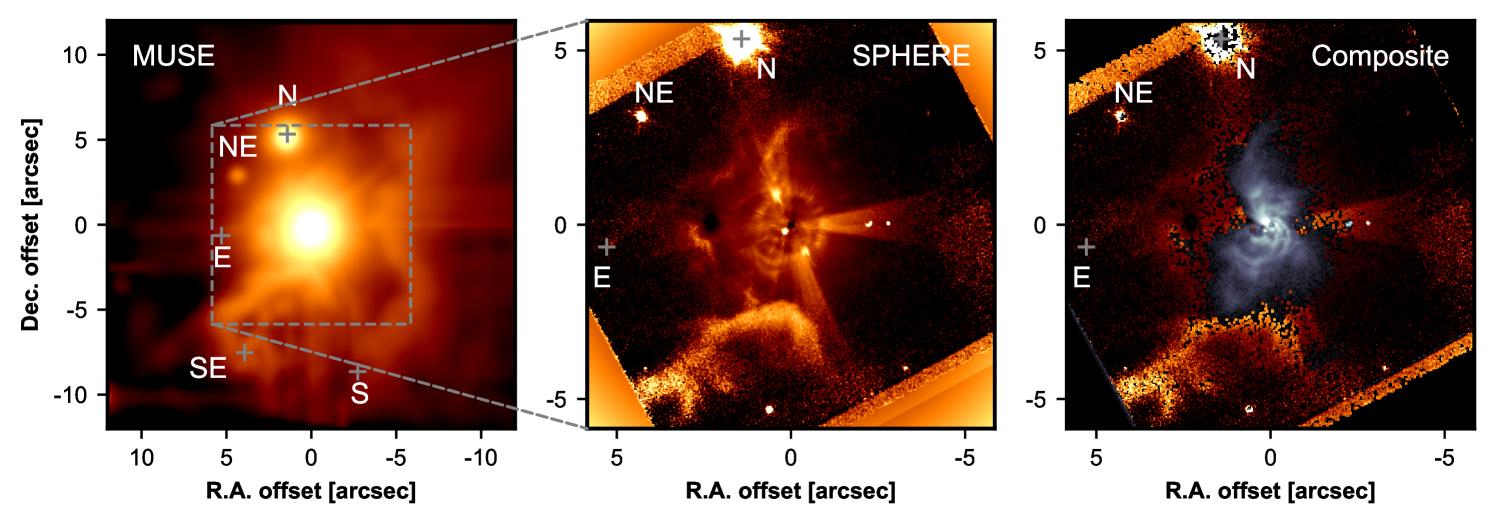
The left panel of Fig. 6 displays the image obtained by stacking the MUSE channels as described in Sec. 2.2. Across the entire MUSE detector field of view (), we detected 24 point sources. Within the area covered by the ALMA band 6 primary beam (), only V960 Mon and V960 Mon N among the band 6 continuum sources have a clear MUSE counterpart. In addition, we find a faint point source in the northeast of V960 Mon, which we label V960 Mon NE.
In the vicinity of the primary object (at separations ), V960 Mon’s luminosity dominates at these shorter wavelengths. However, the MUSE image reveals intriguing large-scale structures. Notably, the source identified as V960 Mon SE appears as the nucleus of a diffuse clump or cloudlet, intriguingly connected to the primary system via a structure of intertwined gas. Remarkably, this represents the first detection of material associated with V960 Mon SE at wavelengths below 4.5 µm, seen in reflection rather than in emission. Previously, V960 Mon SE was reported as undetected at these shorter wavelengths (Kóspál et al., 2015). The observed decrease in brightness with increasing distance from V960 Mon suggests that the structure is primarily illuminated by the central FUor object, rather than being self-luminous at these wavelengths.
Meanwhile, the enigmatic object to the east, V960 Mon E, shows no visible counterpart in the MUSE image. One plausible explanation is that material closer to the primary star casts a shadow over V960 Mon E, preventing direct illumination from the FUor object due to the observed geometry.
To the west of V960 Mon, the image reveals what appears to be the illuminated interior of a surrounding envelope. This observation corroborates the subtle emission noted in the 13CO moment-0 map, as shown in the central column of Fig. 2. While the molecular lines trace emission, the MUSE counterpart likely shows light reflected from mircon-sized grains entrailed in the structure. The observed structure is present in a large wavelength range, excluding the possibility of being associated with distinct molecular line emission in the optical and NIR.
Finally, the MUSE image in Fig. 6 underscores the value of stacked MUSE data in probing the interactions between young stars and their large-scale environments.
3.4 SPHERE total intensity
Polarized intensity () is a measure for imaging circumstellar environments because initially unpolarized light becomes polarized after scattering off dust grains. Consequently, observations of polarized light trace the surfaces of dusty environments. However, this technique has several limitations. First, by design, polarized light observations do not capture light directly emitted from companions (which is generally unpolarized), nor do they capture light scattered from unresolved dust structures around the light source, such as that expected from a circumstellar or circumplanetary disk. However, if this disk is sufficiently inclined or very asymmetric, the observed light from the central unresolved beam could be polarized. Therefore, this method is not suitable for direct imaging of companions and can only detect them if their emission becomes net-polarized within the telescope’s point spread function along the light path (see e.g., van Holstein et al., 2021, for a discussion). Furthermore, the assumption that scattered light contributes to the polarized intensity relies on single scattering of photons. If the majority of stellar photons in a certain region undergo multiple scatterings before escaping the system toward the observer, the emergent light becomes unpolarized due to the summation over randomly oriented polarization states.
Consequently, we analyzed the total intensity in which photons from companions and multiple scattering events still contribute, even if at a contrast that is difficult to detect. The central panel of Fig. 6 displays the VLT/SPHERE -band total intensity image, where the flux is scaled by the squared distance from the center to emphasize large-scale features. A bright elongated structure appears to the south of V960 Mon. Additionally, in the right panel of Fig. 6, we show the polarized light -band image (presented in Weber et al., 2023) in black and white. This comparison shows that the elongated total intensity feature disappears approximately at the distances to where the spiral structures observed in scattered light extend. Notably, we do not detect any polarization from the -band counterpart, even after applying the same -scaling. Here, we discuss the reason for why this might be. Even if the assumption of single-scattering holds true, the efficiency of polarization in a scattering event still depends on the scattering angle . In particular, polarization is predicted to be suppressed for backward scattering () (e.g., Min et al., 2005). Observations of multiple disks confirm a decrease in polarization efficiency at large scattering angles (e.g., Ginski et al., 2023).
Consequently, the lack of polarized light from the elongated feature in V960 Mon indicates a low polarization efficiency, likely due to backward scattering of the primary’s light. This, in turn, implies that the elongated feature is situated behind the star from our viewpoint. In fact, the feature disappears closer to the star, where the spiral structure is visible in scattered light, a result consistent with the spirals’ optically thick region blocking the line of sight.
Finally, we also note that although V960 Mon E lies within the SPHERE field of view, as in the MUSE image, it is detected in neither the total intensity nor the polarized intensity at -band. We conclude that V960 Mon E is deeply embedded, causing its flux to be heavily attenuated at short wavelengths.
4 Discussion
The different observations of V960 Mon reveal a dynamic system around an FUor star, including several companions, spiral structures, clumps, and a connection to the large-scale environment. The concurrence of these effects paints a complicated picture, where it remains unclear which process causes which effect. This section considers several scenarios that connect the presented observations with concepts of star- and planet formation. In particular, we will discuss the possibilites of large-scale infall perturbing the circumstellar environment (Sec. 4.1), a possible stellar flyby (Sec. 4.2) and the ejection of compact objects from around V960 Mon by a stellar intruder to the circumstellar environment (Sec. 4.3).
4.1 Fragmentation and outburst induced by infall?
Assuming the Gaia-measured distance to V960 Mon is accurate, the VLT/SPHERE image in scattered light (Weber et al., 2023) shows material present around V960 Mon up to a separation of au. How such a vast environment can be sustained is an intriguing question. As suggested by the detection of the elongated feature (see Fig. 6, Sec. 3.4), one possibility is that V960 Mon is currently being fed by asymmetric infall from the neighboring SE source, separated by about 84. While infalling streamers onto circumstellar environments have been increasingly reported in recent years (e.g., Ginski et al., 2021; Garufi et al., 2022; Cacciapuoti et al., 2024), this could mark an interesting case where the associated reservoir of the streamer’s origin is observed. From the optical and NIR evidence alone, it is not discernible whether the feature connecting V960 Mon SE and V960 Mon represents infall onto the FUor. A similar feature can also be observed during a flyby in which the gravitational interaction between the two objects creates an over-dense bridge (e.g. Cuello et al., 2020), or from colliding flows in dense star formation regions (e.g. Kuffmeier et al., 2019).
Guided by the detection in the optical and NIR, we investigated the ALMA band 6 cube for molecular counterparts. From a channel-by-channel analysis, we found faint 13CO signal between 21.17 km s-1 and 22.36 km s-1 co-located with the MUSE elongated feature. This implies that the line of sight velocity in the connecting gas is blue-shifted by km s-1 with respect to V960 Mon. We combine the channels in this velocity range of the cube using bettermoments, masking out signal below 2 in each of the 14 channels. The resulting moment-0 map limited to this velocity range has an rms-noise of Jy beam-1 m s-1.
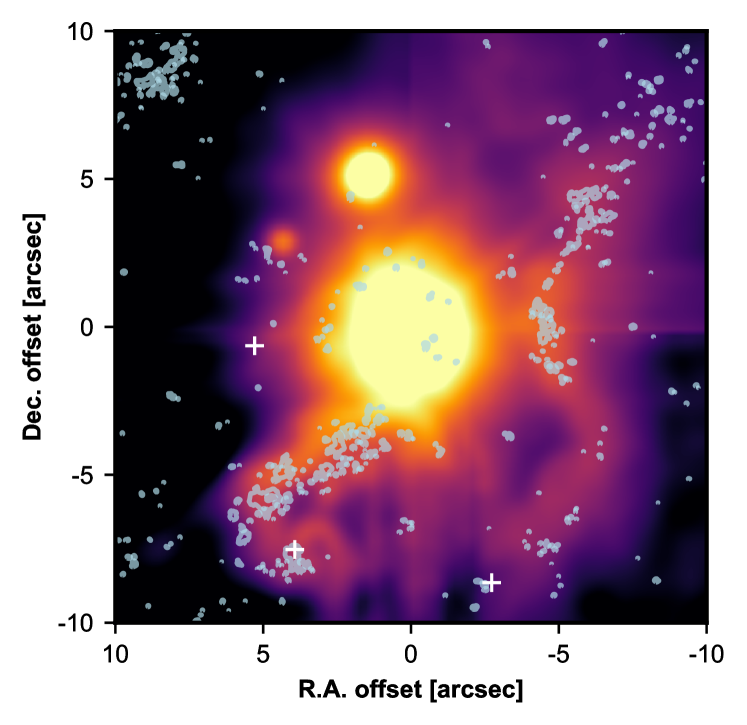
Fig. 7 shows the MUSE image superimposed by the emission contours from these combined 13CO channels at 6 Jy beam-1 m s-1 (corresponding to ). In addition to the emission indicating the connection between V960 Mon and V960 Mon SE, there is faint 13CO emission at these velocities west of the primary, which could trace the inner wall of the surrounding envelope.
Having concluded in Sec. 3.4 that the elongated structure is likely back-grounded with respect to V960 Mon, the blue-shifted velocity of the gas in the feature indicates that it is moving towards the outbursting star V960 Mon. Hence, the combined analysis of optical, NIR and 13CO data gives evidence that the observed feature indeed represents infall onto the primary.
Kuffmeier et al. (2018) demonstrated that in a circumstellar environment the infall of material can locally reduce the Toomre parameter, leading to a localized GI and the formation of spiral structures in the disk around the star. However, the simulation results presented there focused on an area much closer to the star. The very extended structure around V960 Mon raises the question of whether the spirals are part of a gravitationally unstable disk or if they arise from infalling material that becomes twisted as it moves inward. Testing a connection between the spirals and disk instability requires measuring underlying Keplerian rotation, evidence that enhanced 13CO observations could provide. Moreover, although Kuffmeier et al. (2018) showed that localized GI induced by infall can generate a spiral structure, no fragmentation was observed in their simulations. However, Longarini et al. (2023) suggest that in certain scenarios, fragmentation occurs only in the dust phase, a finding consistent with the ALMA continuum observation and not at odds with Kuffmeier et al. (2018), where dust was not implemented. If the spiral structure arises from non-Keplerian motion, it remains an open question under what conditions the infalling material might fragment.
GI in the outer parts of a protoplanetary disk can generate significant angular momentum transport. This may lead to an increased gas flow towards the inner disk region where the switching on and off of the magnetorotational instability may trigger outbursts (Armitage et al., 2001; Zhu et al., 2009; Stamatellos et al., 2011). If the disk gas is replenished via infall, outbursts could also be initiated due to GI-enhanced accretion (Kuffmeier et al., 2018) or due to clump formation by fragmentation and subsequent accretion (Vorobyov & Basu, 2015).
4.2 A possible stellar flyby?
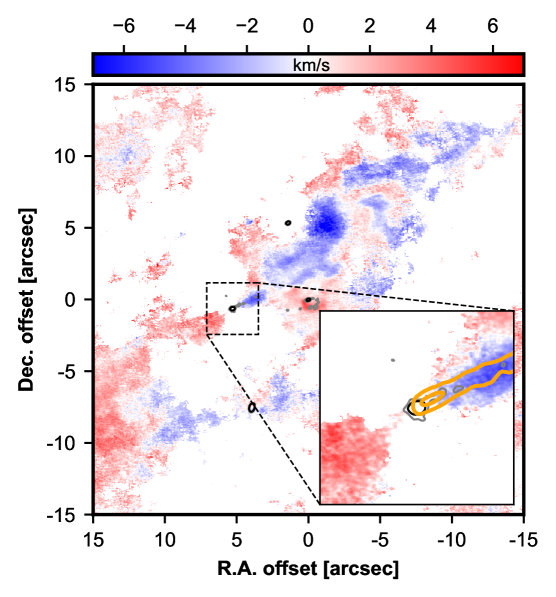
Originally identified by Kóspál et al. (2021), the continuum source V960 Mon E was re-detected in the band 3 and band 4 continuum data, yet remains undetected in the optical and NIR. This implies that V960 Mon E is deeply embedded in dust that is optically thick at these wavelengths. As discussed in Section 3.2, a substantial portion of the 12CO emission lies in the foreground of V960 Mon and appears spatially anchored near V960 Mon E. Fig. 8 shows the 12CO moment-1 map where regions of negative moment-0 are masked. The velocity field is centered on V960 Mon E’s velocity, with blue- and red-shifted lobes on opposite sides of its continuum emission. The inset of Fig. 8 highlights the spatial alignment between the SiO jet and the blue-shifted cone of 12CO emission. This alignment supports the interpretation of the observed 12CO feature as part of an outflow driven by V960 Mon E. From 13CO we measure a central line of sight velocity of approximately km s-1(see Appendix B). We note that this value is subject to large systematic errors from contamination within the region that is not included in the presented uncertainty, so the resulting velocity estimate should be treated with caution. This velocity is blue-shifted by about km s-1 with respect to V960 Mon. This measurement sets as a lower limit for their relative motion and suggests that V960 Mon E is above the escape velocity of the system, hence probably not on a gravitationally bound orbit around V960 Mon. Still, the close spatial and spectral proximity between V960 Mon E to V960 Mon suggests a dynamical association, further supported by a tentative connecting structure, faintly suggested in both C18O and N2D+ moment-0 maps.
These observations raise the question of the dynamic history of the object driving the 12CO outflow. The detection of C18O, DCO+, and N2D+ is commonly interpreted as indicative of a protostellar envelope (Tychoniec et al., 2021). Thus, V960 Mon E may represent a protostar forming from the same molecular reservoir that V960 Mon is accreting from (similar to scenarios described by e.g. Kuffmeier et al., 2019), or it could be a stellar flyby. In fact, the object V960 Mon SE presents another viable flyby candidate. The line of sight velocity of V960 Mon SE is measured to be 23.55 km s-1 from 12CO, so blue-shifted by 0.7 km s-1 with respect to V960 Mon and likely above the escape velocity of the system. Flybys have been shown to produce spiral features in circumstellar dust and gas and connecting structures between the flyby components (e.g., Cuello et al., 2020), suggesting that such a scenario may be at play here. Interestingly, recent work by Fu et al. (2024) discussed the possibility that such a connecting feature induced by a flyby may gravitationally fragment to form future free-floating giant planets.
In terms of stellar accretion behavior, several studies pointed out that flybys may generate periods of enhanced accretion rates on the interacting stars, causing FUor events (e.g., Forgan & Rice, 2010; Vorobyov et al., 2021; Borchert et al., 2022). However, the simulated flybys produced sharply peaked bursts that are very unlike the observed extended classic FUor outbursts (cf. section 5.4 in Nayakshin & Elbakyan, 2024, for a discussion). To determine whether V960 Mon E or V960 Mon SE are bound to or unbound from the FUor, more accurate line of sight velocity measurements are needed. In addition, a deeper examination of the surrounding environment may reveal connecting structures that can inform on their dynamical relationship.
4.3 Ejection from circumstellar environment?
Finally, we want to discuss the scenario that some of the observed mm-sources represent compact objects ejected from the circumstellar environment of V960 Mon due to a stellar intruder, and the connection of this with the outbursting state of V960 Mon.
Recent work indicated that disk Thermal Instability (Bell & Lin, 1994) in conjunction with thermal evaporation of massive planets formed by GI in the outer parts of protoplanetary disks presents an attractive scenario for FU Ori itself (Nayakshin et al., 2023), and potentially for several other observed FUor objects (Nayakshin & Elbakyan, 2024; Nayakshin et al., 2024). The key to this scenario is a massive protoplanetary disk that is able to both hatch the fragments at au and to also drive them inward into the inner au rapidly enough. We note that GI fragment interactions with other fragments were shown to occasionally speed up the process of fragment migration from the outer into the inner disk (Cha & Nayakshin, 2011; Vorobyov & Elbakyan, 2018). The mechanics of this process is simple. The two bodies exchange angular momentum, with one of them gaining and the other losing angular momentum in a close interaction, the former thus gets onto an eccentric orbit with a much smaller peri-center distance, whereas the latter gets kicked to a larger orbit or ejected. The more massive the interaction partner, the more pronouced is the dynamic effect. In this regard, Vorobyov et al. (2017) have shown that close passages of stellar intruders may unbind GI-fragments from the disk, scattering them towards the star or ejecting them from the system. Importantly, these fragments may be massive enough to be in the high-mass brown dwarf and even low-mass star regime (cf. their Table 1). Previous 2D and 3D GI disk simulations showed prolific formation of such fragments (e.g. Vorobyov & Basu, 2006, 2010; Cha & Nayakshin, 2011), but were unable to resolve the innermost region where FUor outbursts originate. Nayakshin et al. (2023) showed that there in the inner disk Thermal Instability creates such a hot environment that these fragments may evaporate in a steady-state manner, providing an explanation for the bewilderingly long duration of FUor outbursts.
There is a potential connection of this scenario for FUor outbursts to the very disturbed and surprisingly large-scale gaseous environment of V960 Mon. There are several candidates for an intruder star in the immediate environment of V960 Mon. Caratti o Garatti et al. (2015) reported a stellar object at a separation of about mas from the primary, confirmed as a bright source in SPHERE -band in Weber et al. (2023). Further, VLT/ERIS observations in -band (µm) detected a candidate companion at a distance of to the southwest of V960 Mon, roughly co-located with the fragmented spiral arm observed in the band 6 continuum (Dasgupta et al. in prep.). A potential intruder star may carry with it a part of the disk of the primary; and the ejected objects also tend to be surrounded by a gaseous disk. As a result, shortly after passage, the system looks very disturbed, with one or more gaseous filaments connecting the primary with the intruder and the ejectees (cf. Figs. 2 and 3 in Vorobyov et al., 2017). The structure naturally has a scale much larger than that of a typical protoplanetary disk, extending well outside a thousand au.
Finally, even if the interaction between fragment and intruder failed to be sufficiently strong, flybys may still encourage faster GI-fragment destruction via more rapid disk migration. As 3D simulations of disk flybys show (Forgan & Rice, 2010; Vorobyov et al., 2021; Borchert et al., 2022), the inner au of disks get sufficiently perturbed by the interaction to lead to higher accretion rates onto the primary star. Although this effect itself is unlikely to produce a steady FUor-outburst-type light curve, as we argued above, the increased gas accretion rate in the inner au may promote much more rapid fragment migration, which could then evaporate in the inner disk as in the scenario of Nayakshin et al. (2023).
Thus, an interaction with an intruder could simultaneously explain the formation of the southeastern elongated feature that is connecting V960 Mon SE and V960 Mon, and V960 Mon’s FUor outburst. This scenario could be further tested by future observations of the system. In particular, constraints on the grain size in the southeastern elongated structure could help to differentiate between an infalling filament and the flyby “bridge” scenarios, as the grains would be larger in the latter case.
5 Conclusions
We presented ALMA, VLT/MUSE, and VLT/SPHERE observations of the outbursting star V960 Mon. Our analysis places the 2014 FUor outburst (Maehara et al., 2014) and the fragmenting spiral arm reported by Weber et al. (2023) into the broader environmental context:
-
•
We identified multiple compact objects emitting at millimeter wavelengths and found signs of direct interaction with V960 Mon for at least two of them, V960 Mon SE and V960 Mon E.
-
•
From the millimeter spectral index, we infer that the ALMA continuum signal of those compact objects traces thermal emission emanating from the center of dense gas cores.
-
•
The fragmenting spiral arm is not detected in band 4 or band 3, also consistent with thermal emission at given sensitivities.
-
•
V960 Mon E shows characteristics of a class-0 protostar and drives an outflow composed of a slower component traced by 12CO and a faster, more collimated jet identified through SiO emission.
-
•
V960 Mon SE is the most prominent in mm continuum emission and we detect rotation in 12CO and 13CO line data, indicating a compact object at its center.
-
•
MUSE and SPHERE imaging show a connection between V960 Mon SE and V960 Mon. We infer that the structure is situated behind V960 Mon, and from counterparts in 13CO channels we find that it is blue-shifted – the material is moving towards V960 Mon, likely representing infall onto the system.
-
•
This directly raises the question how this infall is connected to the outbursting state of the FUor V960 Mon, and the large-scale spirals observed in the NIR and the fragmenting spiral arm observed by ALMA (Weber et al., 2023).
These multi-wavelength observations suggest that V960 Mon is in a unique and transient evolutionary phase. The system displays dynamic disruption across multiple scales—ranging from eruptive accretion onto the stellar surface, to gravitationally unstable spiral arms in dust and gas, and extending to large-scale ( au) gravitational interactions with neighboring protostars. This raises key questions about how processes at different scales interconnect and whether the observed scenario is representative of the general star and planet formation paradigm.
References
- Aikawa et al. (2005) Aikawa, Y., Herbst, E., Roberts, H., & Caselli, P. 2005, ApJ, 620, 330, doi: 10.1086/427017
- Armitage et al. (2001) Armitage, P. J., Livio, M., & Pringle, J. E. 2001, MNRAS, 324, 705, doi: 10.1046/j.1365-8711.2001.04356.x
- Audard et al. (2014) Audard, M., Ábrahám, P., Dunham, M. M., et al. 2014, in Protostars and Planets VI, ed. H. Beuther, R. S. Klessen, C. P. Dullemond, & T. Henning, 387–410, doi: 10.2458/azu_uapress_9780816531240-ch017
- Bachiller & Pérez Gutiérrez (1997) Bachiller, R., & Pérez Gutiérrez, M. 1997, ApJ, 487, L93, doi: 10.1086/310877
- Bacon et al. (2016) Bacon, R., Piqueras, L., Conseil, S., Richard, J., & Shepherd, M. 2016, MPDAF: MUSE Python Data Analysis Framework, Astrophysics Source Code Library, record ascl:1611.003
- Bell & Lin (1994) Bell, K. R., & Lin, D. N. C. 1994, ApJ, 427, 987, doi: 10.1086/174206
- Borchert et al. (2022) Borchert, E. M. A., Price, D. J., Pinte, C., & Cuello, N. 2022, MNRAS, 517, 4436, doi: 10.1093/mnras/stac2872
- Cacciapuoti et al. (2024) Cacciapuoti, L., Macias, E., Gupta, A., et al. 2024, A&A, 682, A61, doi: 10.1051/0004-6361/202347486
- Caratti o Garatti et al. (2015) Caratti o Garatti, A., Garcia Lopez, R., Ray, T. P., et al. 2015, ApJ, 806, L4, doi: 10.1088/2041-8205/806/1/L4
- CASA Team et al. (2022) CASA Team, Bean, B., Bhatnagar, S., et al. 2022, PASP, 134, 114501, doi: 10.1088/1538-3873/ac9642
- Caselli et al. (2002) Caselli, P., Walmsley, C. M., Zucconi, A., et al. 2002, ApJ, 565, 344, doi: 10.1086/324302
- Cha & Nayakshin (2011) Cha, S.-H., & Nayakshin, S. 2011, MNRAS, 415, 3319, doi: 10.1111/j.1365-2966.2011.18953.x
- Chung et al. (2024) Chung, C.-Y., Andrews, S. M., Gurwell, M. A., et al. 2024, ApJS, 273, 29, doi: 10.3847/1538-4365/ad528b
- Cieza et al. (2016) Cieza, L. A., Casassus, S., Tobin, J., et al. 2016, Nature, 535, 258, doi: 10.1038/nature18612
- Codella et al. (2007) Codella, C., Cabrit, S., Gueth, F., et al. 2007, A&A, 462, L53, doi: 10.1051/0004-6361:20066800
- Coutens et al. (2019) Coutens, A., Liu, H. B., Jiménez-Serra, I., et al. 2019, A&A, 631, A58, doi: 10.1051/0004-6361/201935340
- Cuello et al. (2020) Cuello, N., Louvet, F., Mentiplay, D., et al. 2020, MNRAS, 491, 504, doi: 10.1093/mnras/stz2938
- Delussu et al. (2024) Delussu, L., Birnstiel, T., Miotello, A., et al. 2024, A&A, 688, A81, doi: 10.1051/0004-6361/202450328
- Dullemond et al. (2019) Dullemond, C. P., Küffmeier, M., Goicovic, F., et al. 2019, A&A, 628, A20, doi: 10.1051/0004-6361/201832632
- Fischer et al. (2023) Fischer, W. J., Hillenbrand, L. A., Herczeg, G. J., et al. 2023, in Astronomical Society of the Pacific Conference Series, Vol. 534, Protostars and Planets VII, ed. S. Inutsuka, Y. Aikawa, T. Muto, K. Tomida, & M. Tamura, 355, doi: 10.48550/arXiv.2203.11257
- Forgan & Rice (2010) Forgan, D., & Rice, K. 2010, MNRAS, 402, 1349, doi: 10.1111/j.1365-2966.2009.15974.x
- Fu et al. (2024) Fu, Z., Deng, H., Lin, D. N. C., & Mayer, L. 2024, arXiv e-prints, arXiv:2410.21180, doi: 10.48550/arXiv.2410.21180
- Gaia Collaboration et al. (2023) Gaia Collaboration, Vallenari, A., Brown, A. G. A., et al. 2023, A&A, 674, A1, doi: 10.1051/0004-6361/202243940
- Galván-Madrid et al. (2018) Galván-Madrid, R., Liu, H. B., Izquierdo, A. F., et al. 2018, ApJ, 868, 39, doi: 10.3847/1538-4357/aae779
- Garufi et al. (2022) Garufi, A., Podio, L., Codella, C., et al. 2022, A&A, 658, A104, doi: 10.1051/0004-6361/202141264
- Gieser et al. (2024) Gieser, C., Pineda, J. E., Segura-Cox, D. M., et al. 2024, A&A, 692, A55, doi: 10.1051/0004-6361/202450653
- Ginski et al. (2023) Ginski, C., Tazaki, R., Dominik, C., & Stolker, T. 2023, ApJ, 953, 92, doi: 10.3847/1538-4357/acdc97
- Ginski et al. (2021) Ginski, C., Facchini, S., Huang, J., et al. 2021, ApJ, 908, L25, doi: 10.3847/2041-8213/abdf57
- Hartmann & Kenyon (1985) Hartmann, L., & Kenyon, S. J. 1985, ApJ, 299, 462, doi: 10.1086/163713
- Hartmann & Kenyon (1996) —. 1996, ARA&A, 34, 207, doi: 10.1146/annurev.astro.34.1.207
- Herbig (1977) Herbig, G. H. 1977, ApJ, 217, 693, doi: 10.1086/155615
- Hillenbrand (2014) Hillenbrand, L. 2014, The Astronomer’s Telegram, 6797, 1
- Hunter (2007) Hunter, J. D. 2007, Computing In Science & Engineering, 9, 90, doi: 10.1109/MCSE.2007.55
- Jeong et al. (2025) Jeong, J.-H., Lee, J.-E., Lee, S., et al. 2025, ApJS, 276, 49, doi: 10.3847/1538-4365/ad9450
- Kóspál et al. (2015) Kóspál, Á., Ábrahám, P., Moór, A., et al. 2015, ApJ, 801, L5, doi: 10.1088/2041-8205/801/1/L5
- Kóspál et al. (2021) Kóspál, Á., Cruz-Sáenz de Miera, F., White, J. A., et al. 2021, ApJS, 256, 30, doi: 10.3847/1538-4365/ac0f09
- Kuffmeier et al. (2019) Kuffmeier, M., Calcutt, H., & Kristensen, L. E. 2019, A&A, 628, A112, doi: 10.1051/0004-6361/201935504
- Kuffmeier et al. (2018) Kuffmeier, M., Frimann, S., Jensen, S. S., & Haugbølle, T. 2018, MNRAS, 475, 2642, doi: 10.1093/mnras/sty024
- Lee (2020) Lee, C.-F. 2020, A&A Rev., 28, 1, doi: 10.1007/s00159-020-0123-7
- Lee et al. (2019) Lee, J.-E., Lee, S., Baek, G., et al. 2019, Nature Astronomy, 3, 314, doi: 10.1038/s41550-018-0680-0
- Li et al. (2017) Li, J. I.-H., Liu, H. B., Hasegawa, Y., & Hirano, N. 2017, ApJ, 840, 72, doi: 10.3847/1538-4357/aa6f04
- Liu (2019) Liu, H. B. 2019, ApJ, 877, L22, doi: 10.3847/2041-8213/ab1f8e
- Liu et al. (2015) Liu, H. B., Galván-Madrid, R., Jiménez-Serra, I., et al. 2015, ApJ, 804, 37, doi: 10.1088/0004-637X/804/1/37
- Liu et al. (2014) Liu, H. B., Galván-Madrid, R., Forbrich, J., et al. 2014, ApJ, 780, 155, doi: 10.1088/0004-637X/780/2/155
- Liu et al. (2019) Liu, H. B., Mérand, A., Green, J. D., et al. 2019, ApJ, 884, 97, doi: 10.3847/1538-4357/ab391c
- Liu et al. (2021) Liu, H. B., Tsai, A.-L., Chen, W. P., et al. 2021, ApJ, 923, 270, doi: 10.3847/1538-4357/ac31b9
- Liu et al. (2024) Liu, H. B., Muto, T., Konishi, M., et al. 2024, A&A, 685, A18, doi: 10.1051/0004-6361/202348896
- Longarini et al. (2023) Longarini, C., Armitage, P. J., Lodato, G., Price, D. J., & Ceppi, S. 2023, MNRAS, 522, 6217, doi: 10.1093/mnras/stad1400
- Maehara et al. (2014) Maehara, H., Kojima, T., & Fujii, M. 2014, The Astronomer’s Telegram, 6770, 1
- Ménard et al. (2020) Ménard, F., Cuello, N., Ginski, C., et al. 2020, A&A, 639, L1, doi: 10.1051/0004-6361/202038356
- Min et al. (2005) Min, M., Hovenier, J. W., & de Koter, A. 2005, A&A, 432, 909, doi: 10.1051/0004-6361:20041920
- Nayakshin et al. (2024) Nayakshin, S., Cruz Sáenz de Miera, F., Kóspál, Á., et al. 2024, MNRAS, 530, 1749, doi: 10.1093/mnras/stae877
- Nayakshin & Elbakyan (2024) Nayakshin, S., & Elbakyan, V. 2024, MNRAS, 528, 2182, doi: 10.1093/mnras/stae049
- Nayakshin et al. (2023) Nayakshin, S., Owen, J. E., & Elbakyan, V. 2023, MNRAS, 523, 385, doi: 10.1093/mnras/stad1392
- Nomura et al. (2023) Nomura, H., Furuya, K., Cordiner, M. A., et al. 2023, in Astronomical Society of the Pacific Conference Series, Vol. 534, Protostars and Planets VII, ed. S. Inutsuka, Y. Aikawa, T. Muto, K. Tomida, & M. Tamura, 1075
- Perez & Granger (2007) Perez, F., & Granger, B. E. 2007, Computing in Science and Engg., 9, 21, doi: 10.1109/MCSE.2007.53
- Pineda et al. (2023) Pineda, J. E., Arzoumanian, D., Andre, P., et al. 2023, in Astronomical Society of the Pacific Conference Series, Vol. 534, Protostars and Planets VII, ed. S. Inutsuka, Y. Aikawa, T. Muto, K. Tomida, & M. Tamura, 233, doi: 10.48550/arXiv.2205.03935
- Podio et al. (2016) Podio, L., Codella, C., Gueth, F., et al. 2016, A&A, 593, L4, doi: 10.1051/0004-6361/201628876
- Rodgers & Millar (1996) Rodgers, S. D., & Millar, T. J. 1996, MNRAS, 280, 1046, doi: 10.1093/mnras/280.4.1046
- Stamatellos et al. (2011) Stamatellos, D., Whitworth, A. P., & Hubber, D. A. 2011, ApJ, 730, 32, doi: 10.1088/0004-637X/730/1/32
- Takami et al. (2018) Takami, M., Fu, G., Liu, H. B., et al. 2018, ApJ, 864, 20, doi: 10.3847/1538-4357/aad2e1
- Teague & Foreman-Mackey (2018) Teague, R., & Foreman-Mackey, D. 2018, Research Notes of the American Astronomical Society, 2, 173, doi: 10.3847/2515-5172/aae265
- Tobin et al. (2023) Tobin, J. J., van’t Hoff, M. L. R., Leemker, M., et al. 2023, Nature, 615, 227, doi: 10.1038/s41586-022-05676-z
- Tychoniec et al. (2021) Tychoniec, Ł., van Dishoeck, E. F., van’t Hoff, M. L. R., et al. 2021, A&A, 655, A65, doi: 10.1051/0004-6361/202140692
- van der Walt et al. (2011) van der Walt, S., Chris Colbert, S., & Varoquaux, G. 2011, Computing in Science & Engineering, 13, 22 , doi: 10.1109/MCSE.2011.37
- van Holstein et al. (2020) van Holstein, R. G., Girard, J. H., de Boer, J., et al. 2020, A&A, 633, A64, doi: 10.1051/0004-6361/201834996
- van Holstein et al. (2021) van Holstein, R. G., Stolker, T., Jensen-Clem, R., et al. 2021, A&A, 647, A21, doi: 10.1051/0004-6361/202039290
- Vorobyov & Basu (2006) Vorobyov, E. I., & Basu, S. 2006, ApJ, 650, 956, doi: 10.1086/507320
- Vorobyov & Basu (2010) —. 2010, ApJ, 714, L133, doi: 10.1088/2041-8205/714/1/L133
- Vorobyov & Basu (2015) —. 2015, ApJ, 805, 115, doi: 10.1088/0004-637X/805/2/115
- Vorobyov & Elbakyan (2018) Vorobyov, E. I., & Elbakyan, V. G. 2018, A&A, 618, A7, doi: 10.1051/0004-6361/201833226
- Vorobyov et al. (2021) Vorobyov, E. I., Elbakyan, V. G., Liu, H. B., & Takami, M. 2021, A&A, 647, A44, doi: 10.1051/0004-6361/202039391
- Vorobyov et al. (2017) Vorobyov, E. I., Steinrueck, M. E., Elbakyan, V., & Guedel, M. 2017, A&A, 608, A107, doi: 10.1051/0004-6361/201731565
- Wang et al. (2019) Wang, L.-Y., Shang, H., & Chiang, T.-Y. 2019, ApJ, 874, 31, doi: 10.3847/1538-4357/ab07b5
- Weber et al. (2023) Weber, P., Pérez, S., Zurlo, A., et al. 2023, ApJ, 952, L17, doi: 10.3847/2041-8213/ace186
- Winter et al. (2024) Winter, A. J., Benisty, M., & Andrews, S. M. 2024, ApJ, 972, L9, doi: 10.3847/2041-8213/ad6d5d
- Zamponi et al. (2021) Zamponi, J., Maureira, M. J., Zhao, B., et al. 2021, MNRAS, 508, 2583, doi: 10.1093/mnras/stab2657
- Zhu et al. (2009) Zhu, Z., Hartmann, L., Gammie, C., & McKinney, J. C. 2009, ApJ, 701, 620, doi: 10.1088/0004-637X/701/1/620
- Zurlo et al. (2017) Zurlo, A., Cieza, L. A., Williams, J. P., et al. 2017, MNRAS, 465, 834, doi: 10.1093/mnras/stw2845
- Zurlo et al. (2024) Zurlo, A., Weber, P., Pérez, S., et al. 2024, A&A, 686, A309, doi: 10.1051/0004-6361/202348526
Appendix A ALMA spectrum
We examined the band 6 continuum channels to identify any notable molecular emission. We focused on the continuum sources in the field of view, placing a circular aperture mask of radius on each source. By integrating the flux in each channel, we derived the spectra shown in Fig. 9 (before continuum subtraction).
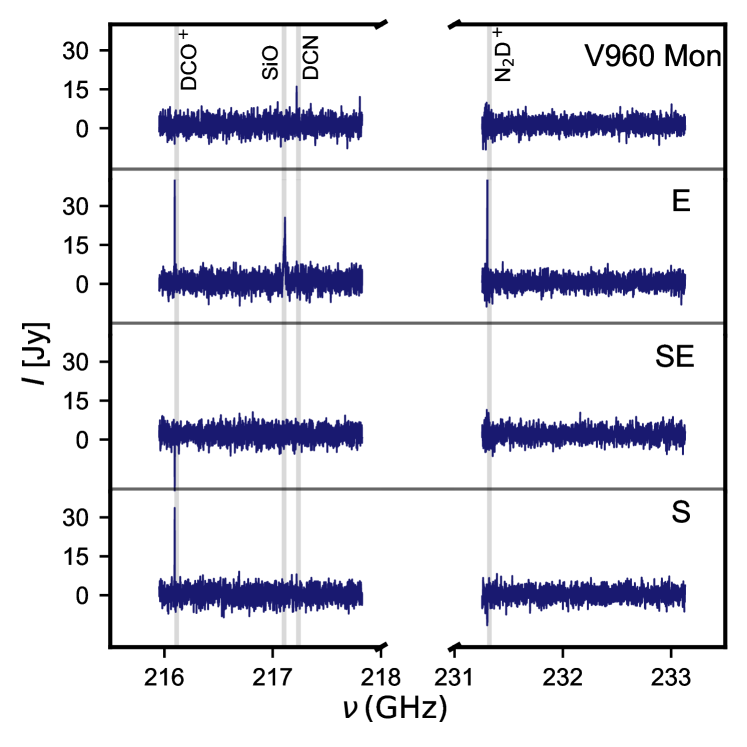
The spectrum of V960 Mon is dominated by DCN. The right panel of Fig. 4 shows that this contribution stems from the fragmenting spiral arm inside the aperture centered on V960 Mon. In V960 Mon E, three lines (DCO+, SiO, and N2D+) are clearly present. V960 Mon SE displays no significant detections, although strong negative values near the DCO+ line are attributed to contaminated baselines. For V960 Mon S, DCO+ is the only pronounced feature.
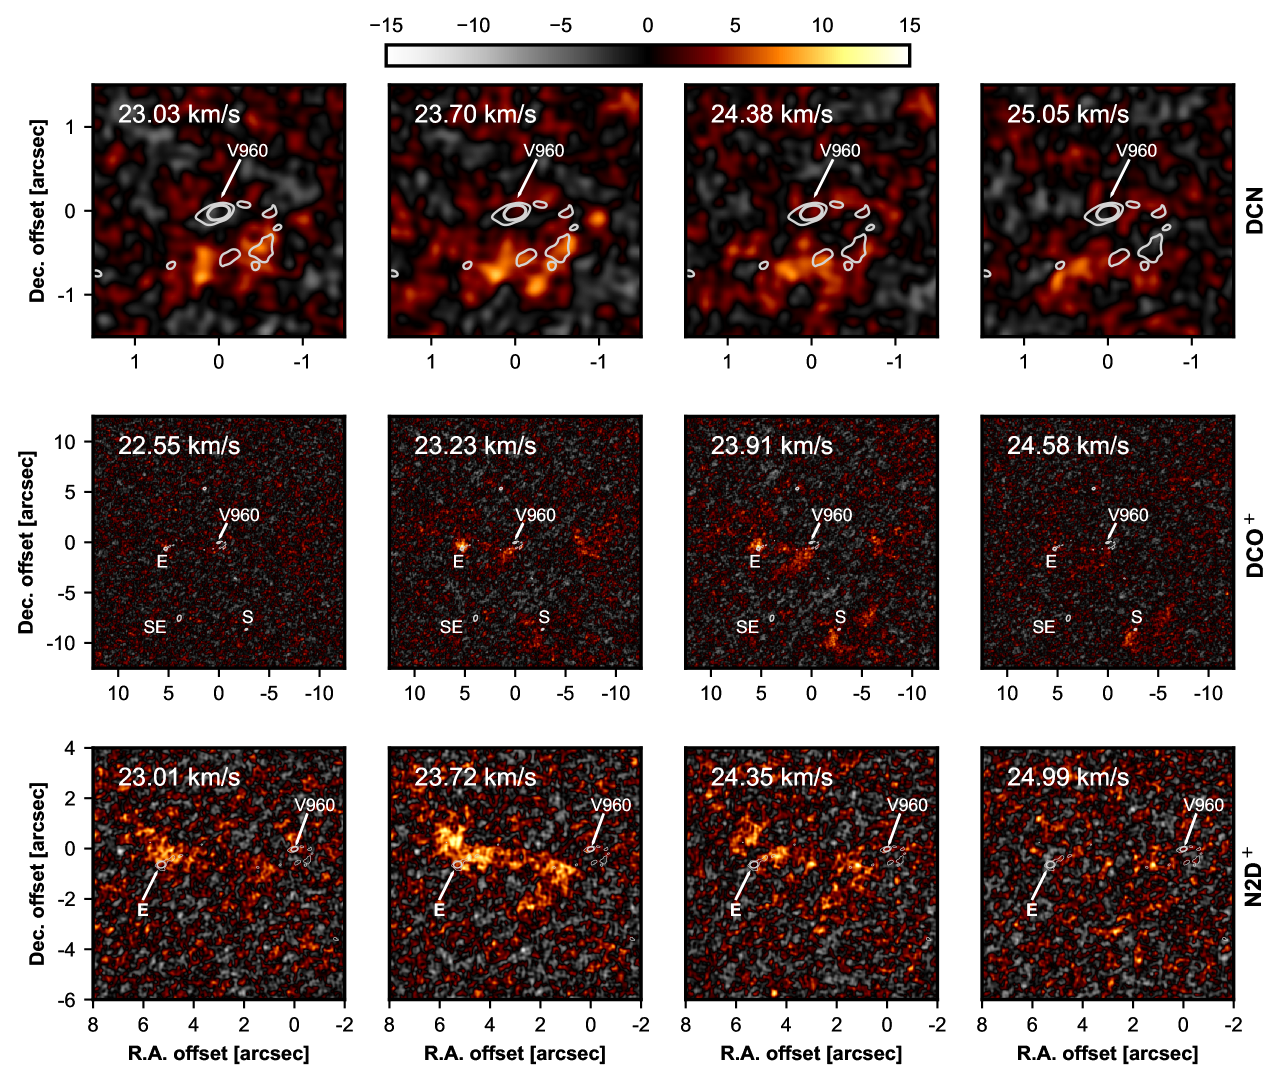
Fig. 10 illustrates the individual channels containing notable flux for DCN, DCO+, and N2D+. The fields of view vary to highlight different sources. Both DCN and DCO+ channels reach an rms-noise level of , while N2D+ has . In the top row of Fig. 10, DCN emission exceeding 3 appears only around the band 6 continuum clumps, outlined by white contours. In the central row (DCO+), emission is strongest around V960 Mon E and V960 Mon S, with tentative flux in the area between V960 Mon E and V960 Mon that appears to connect to the fragmented continuum spiral arm. This interpretation is further supported by N2D+ in the bottom row, which shows a similar alignment in those channels. In both cases (DCO+ and N2D+) the emission from the area between V960 Mon and V960 Mon E is strongest for the channel that lies between the two objects systematic line of sight velocities.
Appendix B Line of sight Velocities
We aim to measure the line of sight velocities for the compact objects in the FOV from the Doppler shifts of CO molecular lines. The contamination and low SNR of the optically thinner molecules complicate precise velocity measurements around the continuum sources. We estimate the systematic velocity of V960 Mon, V960 Mon E, V960 Mon SE and V960 Mon S. V960 Mon N does not show any associated molecular line emission, so is not included in this analysis.
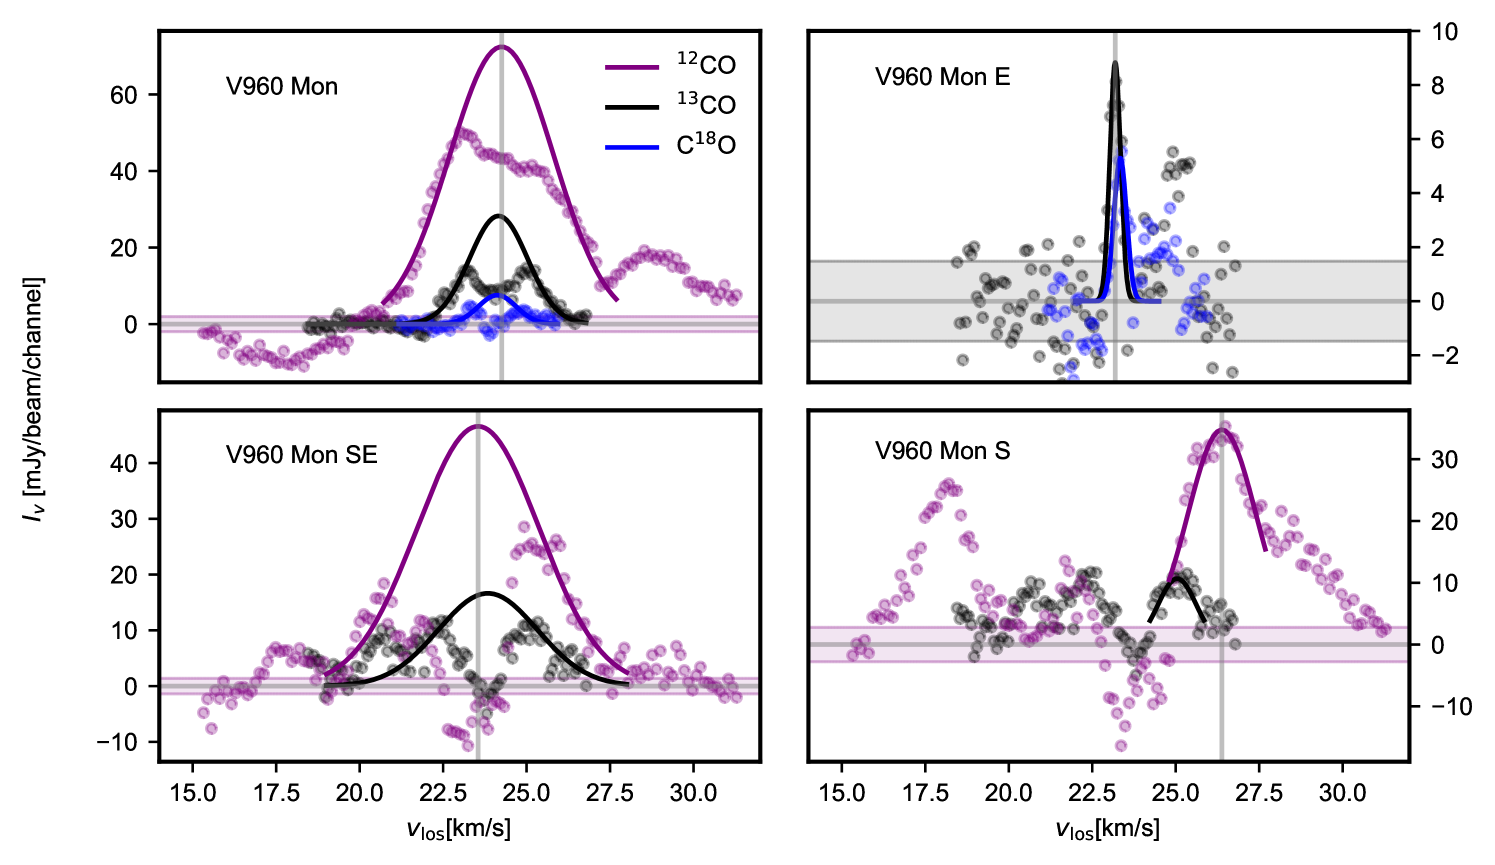
For V960 Mon, the spectrum was extracted using a aperture on the position of the star. We calculate the rms-noise of the spectrum from the aperture-averaged data. The four panels of Fig. 11 show the spectra in dependence on the systematic velocity for four different objects. The shaded area depicts the rms-noise between and , for V960 Mon, V960 Mon SE and V960 Mon S corresponding to 12CO, for V960 Mon E corresponding to 13CO. For V960 Mon, for all three species, we fit a Gaussian to the wings of the emission profile. The center of these Gaussians is very similar for the different isotoplogues, with km s-1, km s-1 and km s-1, for 12CO, 13CO and C18O, respectively. We choose the value of the 12CO measurement as a representative value, due to the higher SNR and the better velocity resolution. The double-peak feature for 13CO and C18O probably indicates of rotation around the primary. However, we can not rule out that the diminution at the systematic velocity is due to self-absorption of the molecular line.
For V960 Mon E, the 12CO emission is strongly attenuated. The SNR for 13CO and C18O is low, but we detect a peak at the object’s location (using a mask radius of ) that is spectrally roughly consistent between the two isotopologues. The fit to the data points is shown in the second panel of Fig. 11, with values of km s-1 and km s-1. We note that especially at higher velocities the CO that is co-moving with the primary seems to contaminate the spectrum.
The third panel of Fig. 11 shows the 12CO and 13CO spectrum for V960 Mon SE. Here, we limit the fit to the area in which we detect significant band 6 continuum emission mJy beam-1. We do this because we detect rotation centered on the continuum in this area. From visual inspection of the 13CO moment-1 map (shown in the inset of the lower central panel of Fig. 2) that shows rotation around V960 Mon SE, we expect the central velocity of this rotation between 23 and 24 km s-1. Also the emission around V960 Mon SE seems to be strongly attenuated at these velocities. We, therefore, fit the Gaussian only to the wings, which seem to be less affected by the contamination. Same as for V960 Mon we fit a Gaussian to the wings of the emission from around V960 Mon SE, and retrieve velocity centers of km s-1 and km s-1.
Finally, the rightmost channel of Fig. 11 shows the spectrum from V960 Mon S using a mask of . The 13CO emission shows a low SNR, the 12CO emission shows two peaks, one blue-shifted and one red-shifted with respect to V960 Mon. From inspecting the channels, we find that the blue shifted peak at around 18 km s-1is very extended over the entire southeastern area and thus probably due to cloud contamination. The red-shifted peak, on the other hand, represents concentrated emission from around the continuum source. We fit a Gaussian to the peak and measure a velocity of 26.38 km s-1.