A multiband look at ultraluminous X-ray sources in NGC 7424
Abstract
We studied the multiband properties of two ultraluminous X-ray sources (2CXO J225728.9410211 = X-1 and 2CXO J225724.7410343 = X-2) and their surroundings, in the spiral galaxy NGC 7424. Both sources have approached X-ray luminosities erg s-1 at some epochs. Thanks to a more accurate astrometric solution (based on Australia Telescope Compact Array and Gaia data), we identified the point-like optical counterpart of X-1, which looks like an isolated B8 supergiant (, age Myr). Instead, X-2 is in a star-forming region (size of about 100 pc 150 pc), near young clusters and ionized gas. Very Large Telescope long-slit spectra show a spatially extended region of He II 4686 emission around the X-ray position, displaced by about 50 pc from the brightest star cluster, which corresponds to the peak of lower-ionization line emission. We interpret the He II 4686 emission as a signature of X-ray photo-ionization from the ULX, while the other optical lines are consistent with UV ionization in an ordinary He II region. The luminosity of this He++ nebula puts it in the same class as other classical photo-ionized ULX nebulae such as those around Holmberg II X-1 and NGC 5408 X-1. We locate a strong (5.5-GHz luminosity erg s-1), steep-spectrum, unresolved radio source at the peak of the low-ionization lines, and discuss alternative physical scenarios for the radio emission. Finally, we use WISE data to obtain an independent estimate of the reddening of the star-forming clump around X-2.
keywords:
accretion, accretion disks – stars: black holes – X-rays: binaries – galaxies: individual: NGC 74241 Introduction
X-ray and multiband studies of the most luminous off-nuclear sources in nearby galaxies (ultraluminous X-ray sources, ULXs; see reviews by Pinto & Walton 2023; King et al. 2023; Kaaret et al. 2017; Feng & Soria 2011) have proved that such sources are usually powered by accretion onto stellar-mass compact objects. In most cases, they are fed by a high mass donor star (i.e., they are high mass X-ray binaries) and can reach X-ray luminosities in excess of erg s-1, well above their critical Eddington limit (super-critical accretion regime). Investigating super-critical stellar-mass sources in the local universe helps our modelling of accretion and feedback properties in this accretion regime at all scales, including for example in the early phases of supermassive black hole growth (e.g., King & Pounds, 2015; Tombesi et al., 2015; Volonteri et al., 2015; Parker et al., 2017).
One of the distinguishing properties of super-critical accretion is the strong effect such sources have on the surrounding medium, particularly as the most powerful sources tend to be located in gas-rich, young stellar environments. X-ray photo-ionization effects are expected because of their high luminosity and long mean-free-path of their X-ray photons. It was also speculated that ULXs may have played a role in cosmic re-ionization (e.g., Mirabel et al., 2011; Fragos et al., 2013; Madau & Fragos, 2017; Douna et al., 2018), at least for the pre-heating of the intergalactic medium and the formation of extended partially ionized zones (e.g., Jeon et al., 2014; Knevitt et al., 2014; Xu et al., 2014). Moreover, super-critical sources produce strong radiatively-driven outflows (e.g., King & Pounds, 2003; Poutanen et al., 2007; Dotan & Shaviv, 2011; Kosec et al., 2018; Pinto & Kosec, 2023). Magneto-hydrodynamical simulations (e.g., Ohsuga & Mineshige, 2011; Kawashima et al., 2012; Jiang et al., 2014; Ogawa et al., 2017; Narayan et al., 2017; Kitaki et al., 2021) show that the massive wind from a geometrically thick disk produce a lower-density polar funnel, inside which a collimated jet may also be launched. Theoretical studies show (Poutanen et al., 2007; Yoshioka et al., 2022) that the kinetic power of the super-Eddington outflows can reach 10–30% of the radiative luminosity, and possibly even exceed the radiative luminosity for accretion rates in excess of about 40 times the critical limit (Kitaki et al., 2021). This is supported by observational discoveries of large (diameters of 100–300 pc) shock-ionized bubbles around several ULXs, inflated by mechanical powers of 1039–1040 erg s-1 (Pakull & Mirioni, 2002; Pakull et al., 2010; Cseh et al., 2012; Soria et al., 2021; Gúrpide et al., 2022; Zhou et al., 2023). In summary, by studying the gas and stellar environment around a ULX, we constrain the age and activity phase of the super-Eddington source, and its ionizing effect on the surrounding gas.
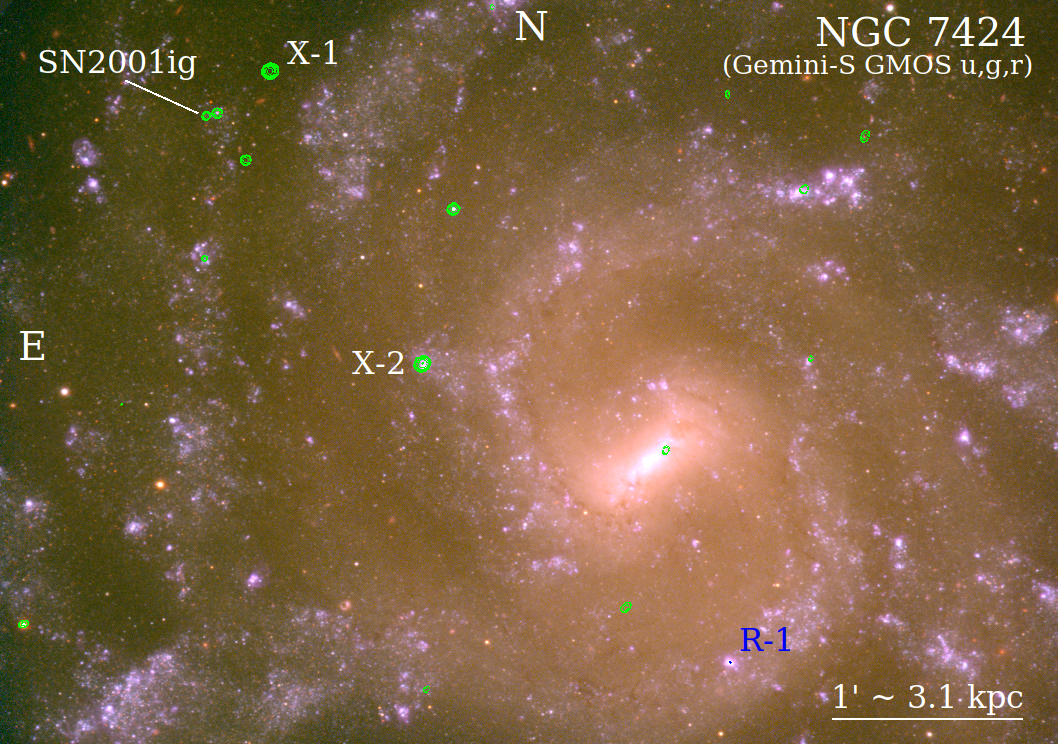
In this paper, we investigate two ULXs in the grand-design, face-on spiral galaxy NGC 7424 (Figure 1), with morphological classification SABcd. In the absence of Cepheid distances to this galaxy, we adopt the average between the Hubble Flow distance (10.1 Mpc) and the Tully-Fisher distance (11.5 Mpc), both listed in the NASA/IPAC Extragalactic Database (NED) 111https://ned.ipac.caltech.edu.; thus, we take Mpc (distance modulus 30.17 mag, scale of 52 pc arcsec-1). The star formation rate is 0.2–0.3 yr-1 (Larsen 2002; Iglesias-Páramo et al. 2006, accounting for the slightly lower distance assumed here). NGC 7424 was host to the Type-IIb supernova SN 2001ig; some of the observational datasets used for this work were originally collected for a study of that SN. We will report on the evolution of SN 2001ig in a separate paper, and focus here instead on the ULXs and their environments.
2 Observations and data analysis
2.1 Chandra
NGC 7424 was observed with the Advanced CCD Imaging Spectrometer (ACIS) camera on board the Chandra X-ray Observatory three times (Table 1): on 2002 May 21 and June 11, and on 2020 December 2 (ObsIDs 3495, 3496, 23572 respectively). The sources of interest for this work were located on the S3 chip. The live time was 23 ks, 24 ks and 5 ks for the three observations.
We retrieved the data from the public archives, and reprocessed them with the Chandra Interactive Analysis of Observations (ciao) version 4.15 (Fruscione et al., 2006), with calibration database version 4.9.8. Specifically, we created new level-2 event files with the ciao task chandra_repro. We used merge_obs to create stacked event files and images, and dmcopy for energy filtering. Point-like sources were identified and located with wavdetect, in the images from each observation.
We used specextract to create spectra and associated response and ancillary response files (“correctpsf” parameter set to yes) for the two ULXs. We chose source extraction circles of 25 radius, and local background annuli with an area approximately ten times larger. We used the ftools222http://heasarc.gsfc.nasa.gov/ftools package (Blackburn, 1995; Nasa High Energy Astrophysics Science Archive Research Center (Heasarc), 2014) from NASA’s High Energy Astrophysics Science Archive Research Center (HEASARC) for further data analysis. We regrouped the spectra to a minimum number of counts per bin with ftools’s grppha task. In particular, we created spectra with 1 count per bin, suitable for fitting with the Cash statistics (Cash, 1979), and corresponding spectra grouped to 15 counts per bin, for fitting.
We modelled the X-ray spectra over the 0.3–8 keV band with XSPEC version 12.12.1 (Arnaud, 1996), with standard models suitable to accreting compact objects. The spectra for some of the observations (e.g., X-2 in ObsIDs 3495 and 23573) only have 100 counts and are mildly undersampled when rebinned for fitting; therefore, for consistency, we report the modelling results obtained with the Cash statistics for all spectra, unless explicitly mentioned. Observed fluxes and unabsorbed luminosities were calculated with the cflux convolution model.
2.2 Gemini
NGC 7424 was imaged with the Gemini Multi-Object Spectrograph (GMOS) on the Gemini South telescope, on 2004 September 14 (Ryder et al., 2006, Program ID GS-2004B-Q-6). Conditions were not photometric (thin cirrus clouds) but the seeing was exceptionally good (035–04). The images were taken in the set of Sloan filters, with a 00807/pixel sampling. A series of dithered sub-exposures were taken for each filter, and combined to remove cosmic rays and chip gaps; see Ryder et al. (2006) for details of the observational set-up and data reduction. The 55 55 field of view of GMOS covers most of the star-forming disk of NGC 7424 and is well suited for a search of the optical counterparts to the Chandra sources (Figure 1).
2.3 Hubble Space Telescope (HST)
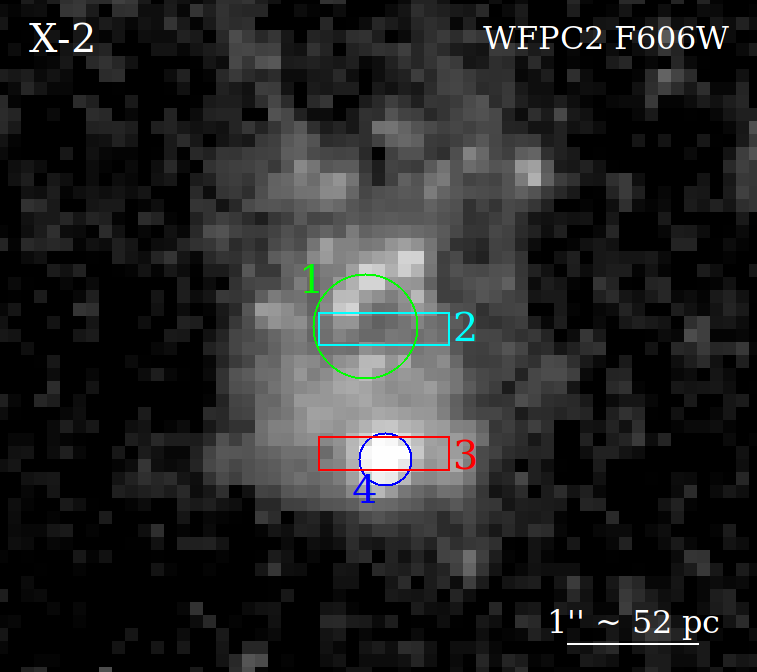
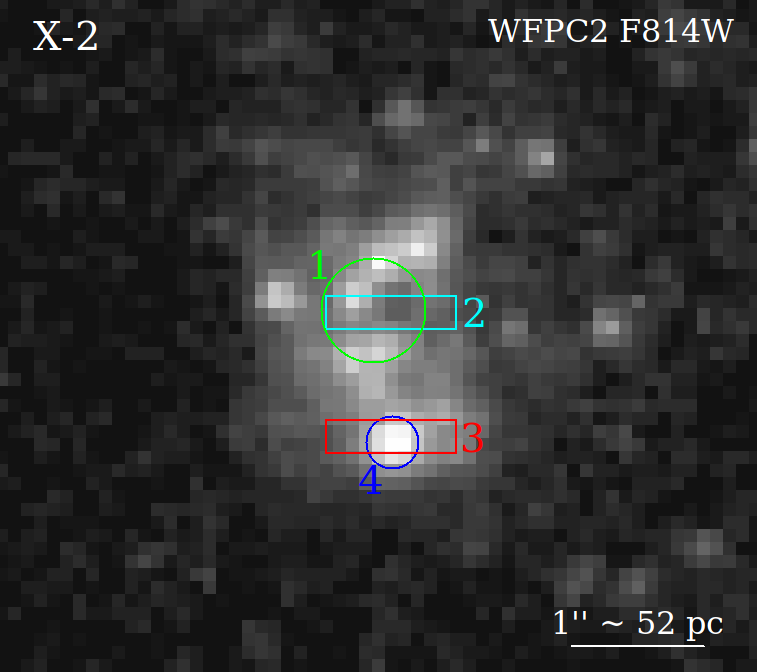
For the imaging study of our main target of interest, the optical nebula around X-2, we used an HST Wide Field Planetary Camera 2 (WFPC2) image in the F606W filter, taken on 1994 July 16 (exposure time 160 s), and a WFPC2 image in the F814W filter taken on 2001 June 1 (exposure time 640 s). To image the star-forming complex around the bright radio source R1 (S. Cheng et al.,in prep.), in the southern half of the galaxy, we used a different set of WFPC2 images, taken on 2001 July 7, in the F450W filter (460-s exposure) and in the F814W filter (460-s exposure). The latter pair of WFPC2 images do not cover the X-2 field. For a search of the optical counterpart of X-1, we used two Wide Field Camera 3 (WFC3) UVIS images, taken on 2016 April 28 (Ryder et al., 2018): in the F275W (8694-s exposure) and in F336W (2920-s exposure). The field of view of those WFC3/UVIS images includes also the counterpart of SN 2001ig but not the field around X-2.
We downloaded the drizzled, calibrated data from the Hubble Legacy Archive 333https://hla.stsci.edu for the WFPC2 images files, and from the Mikulski Archive for Space Telescopes444https://mast.stsci.edu/search/ui/{#}/hst for the WFC3 ones. We used ds9 imaging tools to determine the centroids of bright point-like sources and improve the astrometric solution (Section 3.1), and, subsequently, for direct comparisons of X-ray, optical and radio positions of our targets of interest.
2.4 Very Large Telescope (VLT)
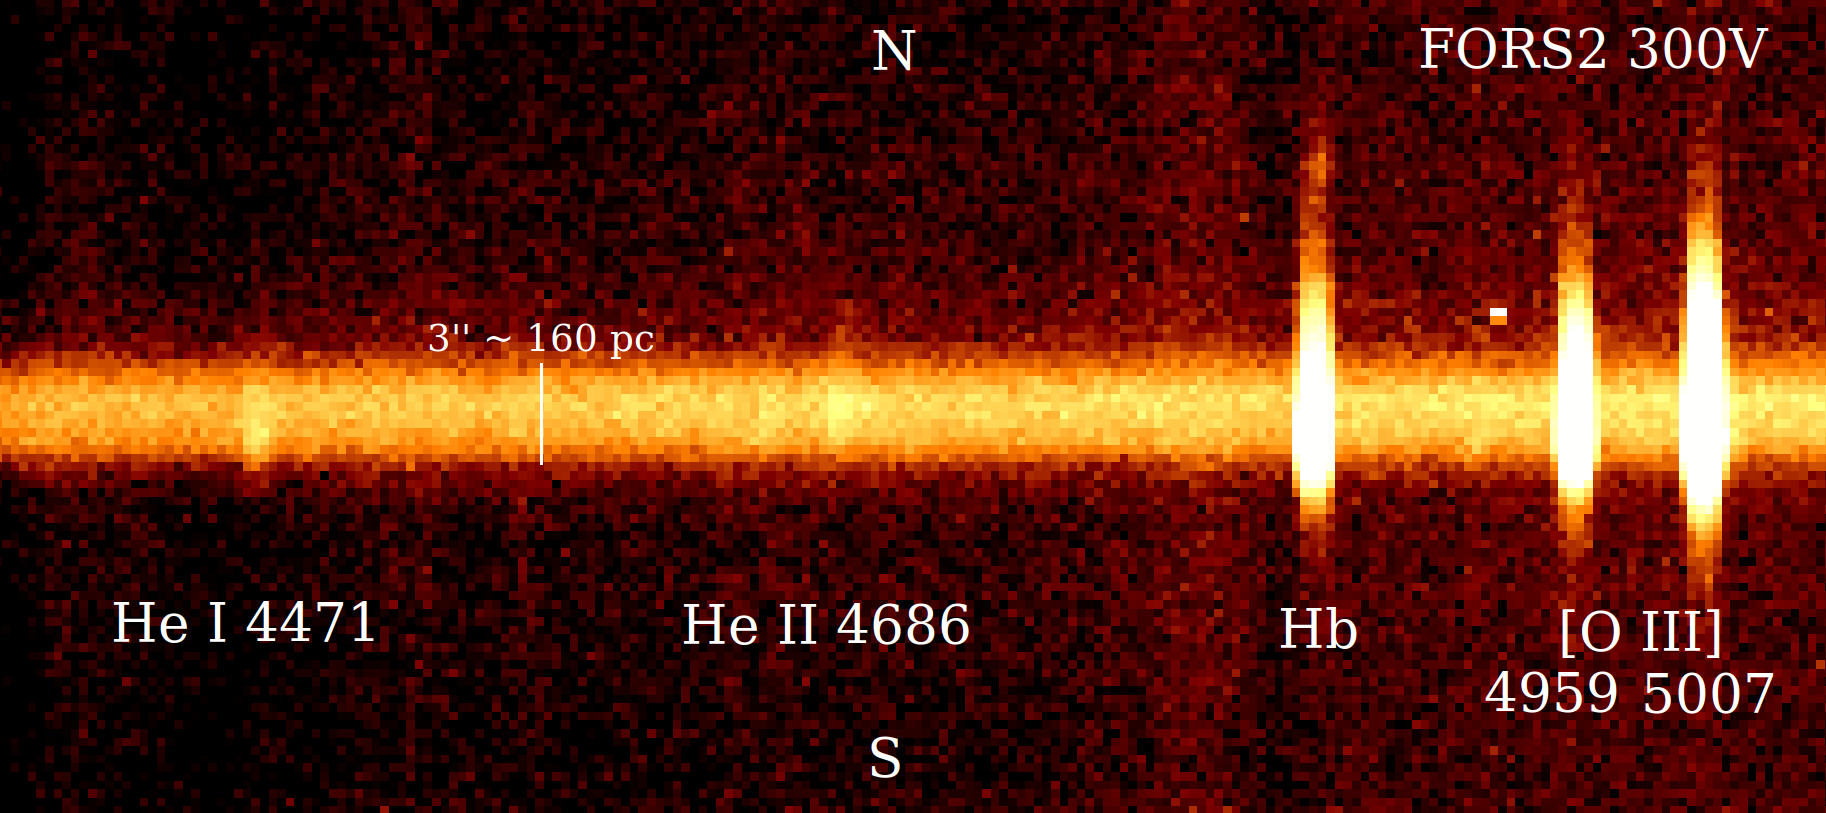
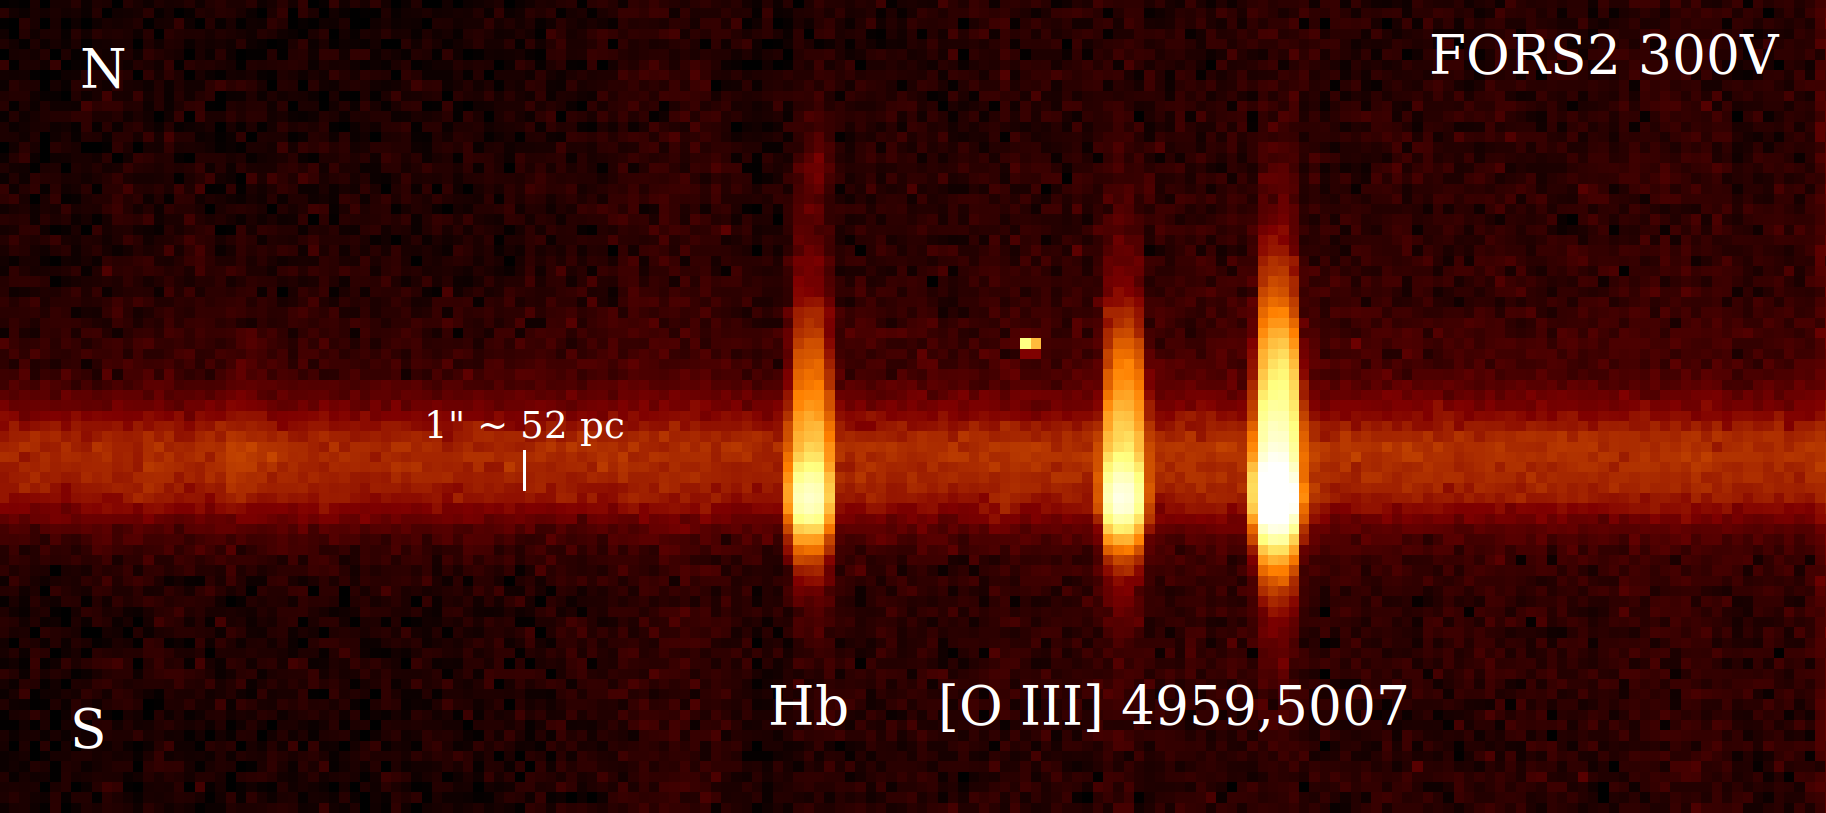
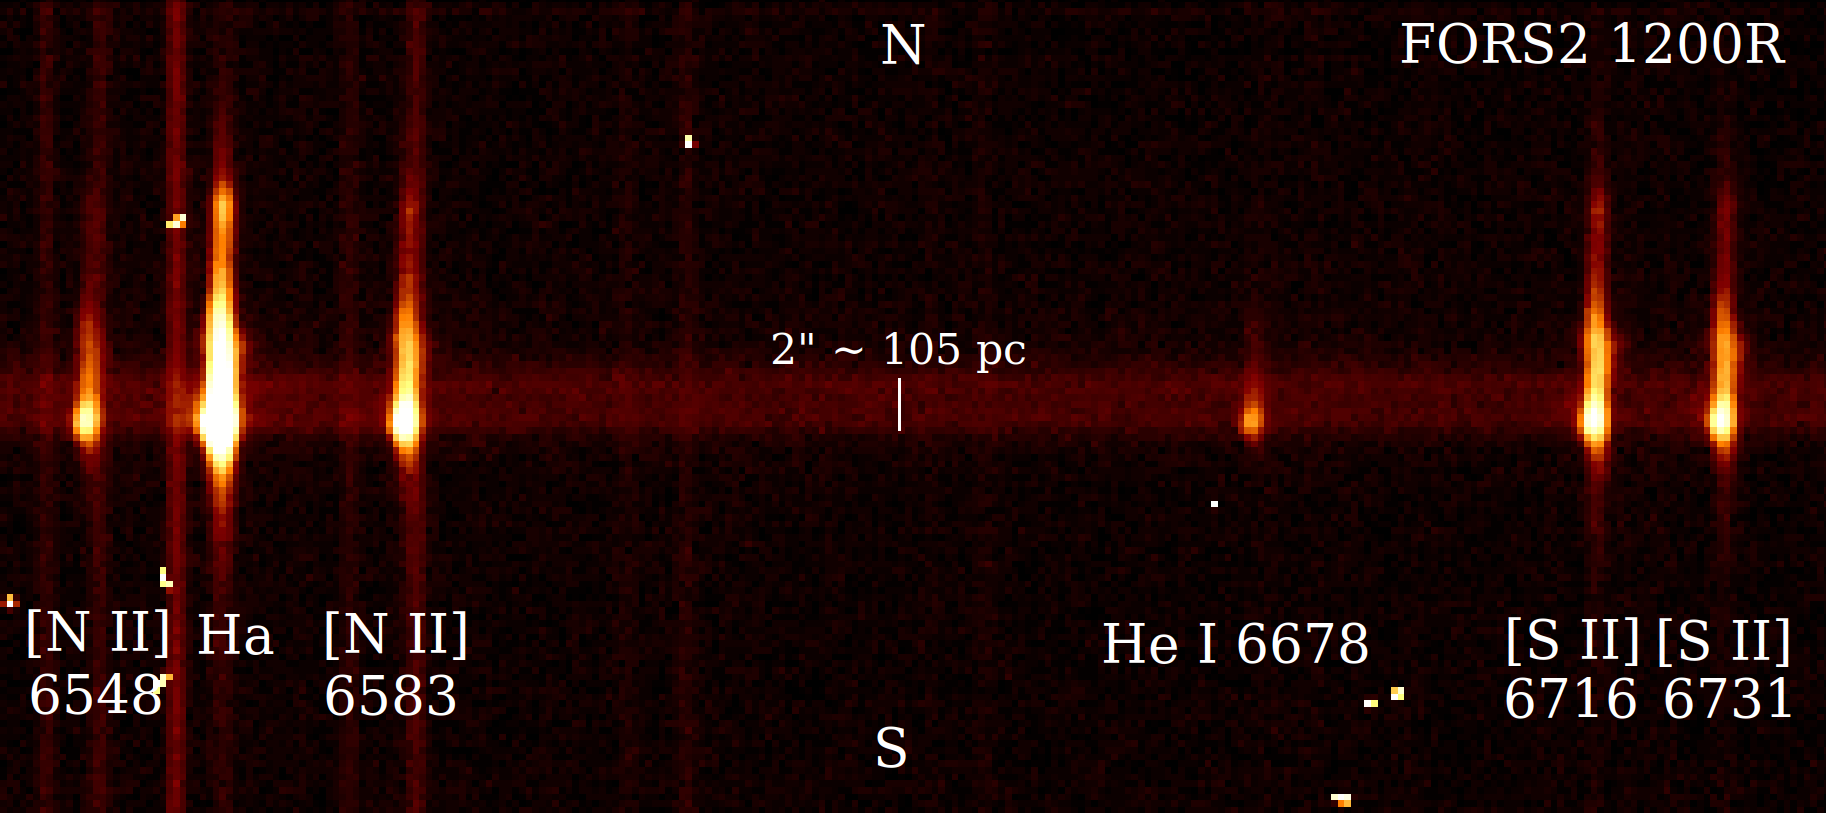
We observed the X-2 nebula with the FOcal Reducer and low dispersion Spectrograh 2 (FORS2) on the VLT of the European Southern Observatory, on 2011 September 1, from MJD 55805.09 to MJD 55805.11 (corresponding to UT time between about 02:05 and 02:40) (Table 1). Specifically, we took two spectra with the 300V grating (covering 3300 Å to 9500 Å) and one spectrum with the 1200R grating (covering 5750 Å to 7310 Å), and an acquisition image before each choice of grating (Table 1). In the spatial direction, the scale was 025 per pixel (2 2 pixel binning). The dispersion was 3.30 Å per pixel for the 300V grating, and 0.75 Å per pixel for the 1200R grating. The instrumental resolution was 9.4 Å full-width-half-maximum (FWHM) for the 300V grism, and 1.8 Å FWHM for the 1200R one. The slit width was 10 for the 300V grating (matched to a delivered seeing of 11) and 07 for the 1200R grating (delivered seeing of 09). In both cases, the slit was oriented north to south, passing roughly through the middle of the X-2 nebula.
Spectra were corrected for bias, flat-fielded and calibrated in wavelength and flux using the EsoReflex FORS package (Freudling et al., 2013) version 5.6.5. Flux calibration was derived from the spectrophotometric standard LTT7379. We used software from both the Munich Image Data Analysis System (midas: Warmels 1992) (in particular, the integrate/line task) and from the Image Reduction and Analysis Facility (iraf) Version 2.16. In particular, we used the iraf splot sub-package to determine central wavelengths of the emission lines, their equivalent widths (EWs), FWHM, and fluxes.
2.5 Australia Telescope Compact Array (ATCA)
We observed NGC 7424 with the ATCA on 2021 April 10–13 (Table 1), under project code C3421. The aimpoint was near the position of X-2. The array was in its most extended 6 km configuration (6D)555https://www.narrabri.atnf.csiro.au/operations/array_configurations/configurations.html. The data were recorded simultaneously at central frequencies of 5.5 and 9.0 GHz, with a bandwidth of 2 GHz at each frequency. The total observing time on source was 21 hr. We used the primary ATCA calibrator PKS B1934638 for flux density calibration, and the nearby source PKS B2310417 for phase calibration. We processed data following standard procedures666https://casaguides.nrao.edu/index.php/ATCA_Tutorials within the Common Astronomy Software Application (casa, version 5.1.2; CASA Team et al. 2022). To image the data we used the casa task clean, using a Briggs robust parameter of 0 (Briggs, 1995), balancing sensitivity and resolution. These choices resulted in synthesized beams with FWHM of 25 14 at 5.5 GHz (position angle , east of north), and 15 09 at 9 GHz (position angle ). To determine the centroids of our sources of interest, we used the casa task imfit, fitting a 2-D Gaussian with a FWHM fixed to the parameters of the synthesized beam.
3 Main Results
| Chandra/ACIS | |||
| ObsID | Obs. Date | Exp. Time | Aimpoint |
| (ks) | |||
| 3495 | 2002 May 21 | 23.4 | SN 2001ig |
| 3496 | 2002 Jun 11 | 23.9 | SN 2001ig |
| 23572 | 2020 Dec 02 | 5.0 | SN 2001ig |
| HST | |||
| Detector | Obs. Date | Exp. Time | Targets covered |
| (s) | |||
| WFPC2/F606W | 1994 Jul 16 | 160 | X-2 |
| WFPC2/F814W | 2001 Jun 1 | 640 | X-2 |
| WFPC2/F450W | 2001 Jul 7 | 460 | R1 |
| WFPC2/F814W | 2001 Jul 7 | 460 | R1 |
| WFC3/F275W | 2016 Apr 28 | 8694 | X-1, SN 2001ig |
| WFC3/F336W | 2016 Apr 28 | 2920 | X-1, SN 2001ig |
| VLT/FORS2 | |||
| Grism | Obs. Date | Obs. Time | Exp. Time |
| (UT) | (s) | ||
| (Acq. image) | 2011 Sep 01 | 02:05:26 | 30 |
| 300V | 2011 Sep 01 | 02:10:09 | 600 |
| 300V | 2011 Sep 01 | 02:20:52 | 600 |
| (Acq. image) | 2011 Sep 01 | 02:35:20 | 30 |
| 1200R | 2011 Sep 01 | 02:40:48 | 900 |
| ATCA | |||
| Project ID | Obs. Date | Exp. Time | Bandwidth |
| (min) | (GHz) | ||
| C3421 | 2021 Apr 10 | 370 | 2.0 |
| C3421 | 2021 Apr 11 | 279 | 2.0 |
| C3421 | 2021 Apr 12 | 403 | 2.0 |
| C3421 | 2021 Apr 13 | 195 | 2.0 |
3.1 Astrometric alignment
In addition to the use of new observations not available at the time, our multiband study improves on the results of Soria et al. (2006) because of a more accurate astrometric alignment between X-ray, optical and radio images. The two main reasons for this improvement are: i) an astrometric calibration based on the Gaia results (Gaia Collaboration et al., 2023); ii) a new ATCA observation with higher sensitivity and more uniform coverage of the uv plane.
In particular, the new 9-GHz ATCA images were not hampered by the side lobes that affected the 2001–2004 ATCA dataset, and provided a more precise and accurate reference position of SN 2001ig. Since this object is detected as a point-like source in Chandra, HST, Gemini and ATCA, it provides a useful anchor for relative astrometry between X-ray, optical and radio bands. We determined a radio position of SN 2001ig of R.A.(J2000) , Dec.(J2000) , which is 07 away from the reference position currently listed in the SIMBAD database777http://simbad.cds.unistra.fr/simbad/ and in most SN catalogues in the literature. This revised position (unlike the old one) is perfectly consistent with the alignment of the Chandra and Gemini images onto the Gaia reference frame. This also enables a more precise localization of X-2 inside its associated star-forming complex and nebula (Figures 2–4), and a more fruitful search for the optical counterpart of X-1 (Section 3.8).
The first step was the alignment of the Gemini images. We selected eight Gaia sources with a bright, point-like, isolated, not saturated Gemini counterpart, as well as the radio position of SN 2001ig. We calculated the average R.A. and Dec. offsets of those nine sources, and their scatter. We corrected the Gemini astrometry (simple translation) with standard iraf imcoords tasks. After the re-alignment, we verified that the residual root-mean-square scatter of the Gemini positions with respect to the Gaia frame was 01 in R.A. and 01 in Dec.
The second step was the alignment of the HST/WFPC2 and WFC3 images. For the WFPC2 fields that cover X-2 and the north-eastern sector of the galaxy, there are eight Gaia sources that appear point-like and unsaturated in the Wide Field chips of the WFPC2 F814W image, and six useful Gaia/WFPC2 associations in the F606W image. For the other pair of WFPC2 images, which cover R1 and the southern spiral arm, we found ten associations with Gaia sources. For the WFC3/UVIS fields, we found seven useful associations in both the F275W and F336W images. For each HST image, we applied a simple coordinate translation to align to the Gaia frame. In addition, as a secondary calibrator, we checked the revised HST astrometry with the help of several other sources without a Gaia identification but with a bright point-like appearance in both Gemini and HST. We verified that after our astrometric improvement, there is no systemic offset between HST and Gemini positions (only random scatter within 02).
| Model Parameters | Values | ||
|---|---|---|---|
| 2002 May 21 | 2002 June 11 | 2020 December 02 | |
| tbabs tbabs simpl diskbb | |||
| ( cm-2) | |||
| FracScatt | |||
| (keV) | |||
| (km2)a | |||
| (km)b | |||
| C-stat/dof | (1.06) | (0.91) | (0.91) |
| ( erg cm-2 s-1)c | |||
| ( erg s-1)d | |||
| tbabs tbabs (diskbb + powerlaw) | |||
| ( cm-2) | |||
| (keV) | – | – | |
| (km2)a | – | – | |
| (km)b | – | – | |
| C-stat/dof | (1.05) | (0.91) | (0.91) |
| ( erg cm-2 s-1)c | |||
| ( erg s-1)d | |||
| tbabs tbabs (apec + powerlaw) | |||
| ( cm-2) | |||
| (keV) | – | – | |
| – | – | ||
| C-stat/dof | (1.07) | (0.87) | (0.91) |
| ( erg cm-2 s-1)c | |||
| ( erg s-1)d | |||
a: , where is the apparent inner disk radius in km, the distance to the source in units of 10 kpc (here, ), and is our viewing angle ( is face-on).
b: for a standard disk (Kubota et al., 1998).
c: observed fluxes in the 0.3–10 keV band
d: isotropic unabsorbed luminosities in the 0.3–10 keV band, defined as times the de-absorbed fluxes.
e: units of photons keV-1 cm-2 s-1 at 1 keV.
Third, we improved the Chandra astrometry, starting from the two longer observations. There are three associations of point-like X-ray sources with Gaia sources. A fourth reference point comes from the radio position of SN 2001ig, which is also detected as an X-ray source in the 2002 Chandra observations. Finally, two Chandra sources have Gemini counterparts. We determined the observed centroids of the Chandra sources with the ciao task wavdetect. Then, we corrected the Chandra coordinates with the tasks wcs_match and wcs_update. We did so first using only the three Gaia and one ATCA associations; then, including also the two Gemini associations. We obtained the same result. We also verified that there is no need to include rotation and scaling corrections, as they do not improve the alignment compared with a simple translation. The third, shorter Chandra observation was aligned to the coordinates of the first two observations, based on the brightest X-ray sources visible in all three looks. For the main target of our study, the X-2 ULX, we obtain a refined position of R.A.(J2000) , Dec.(J2000) .
Taking into account the residual random scatter in the X-ray and optical positions (combined in quadrature), we estimate that we can locate the position of the brightest X-ray sources onto the HST/WFPC2 and Gemini images within a 90% confidence radius of 04, and onto the HST/WFC3 images within a 90% confidence radius of 03. The greater precision of the UVIS alignment is partly due to their smaller pixel size (004, compared with the resampled pixel size of 01 for the WFPC2 images), and partly to the fact that the UVIS field include the optical counterpart of SN 2001ig, whose radio coordinates are now well-determined from the ATCA maps.
3.2 X-ray properties of X-2
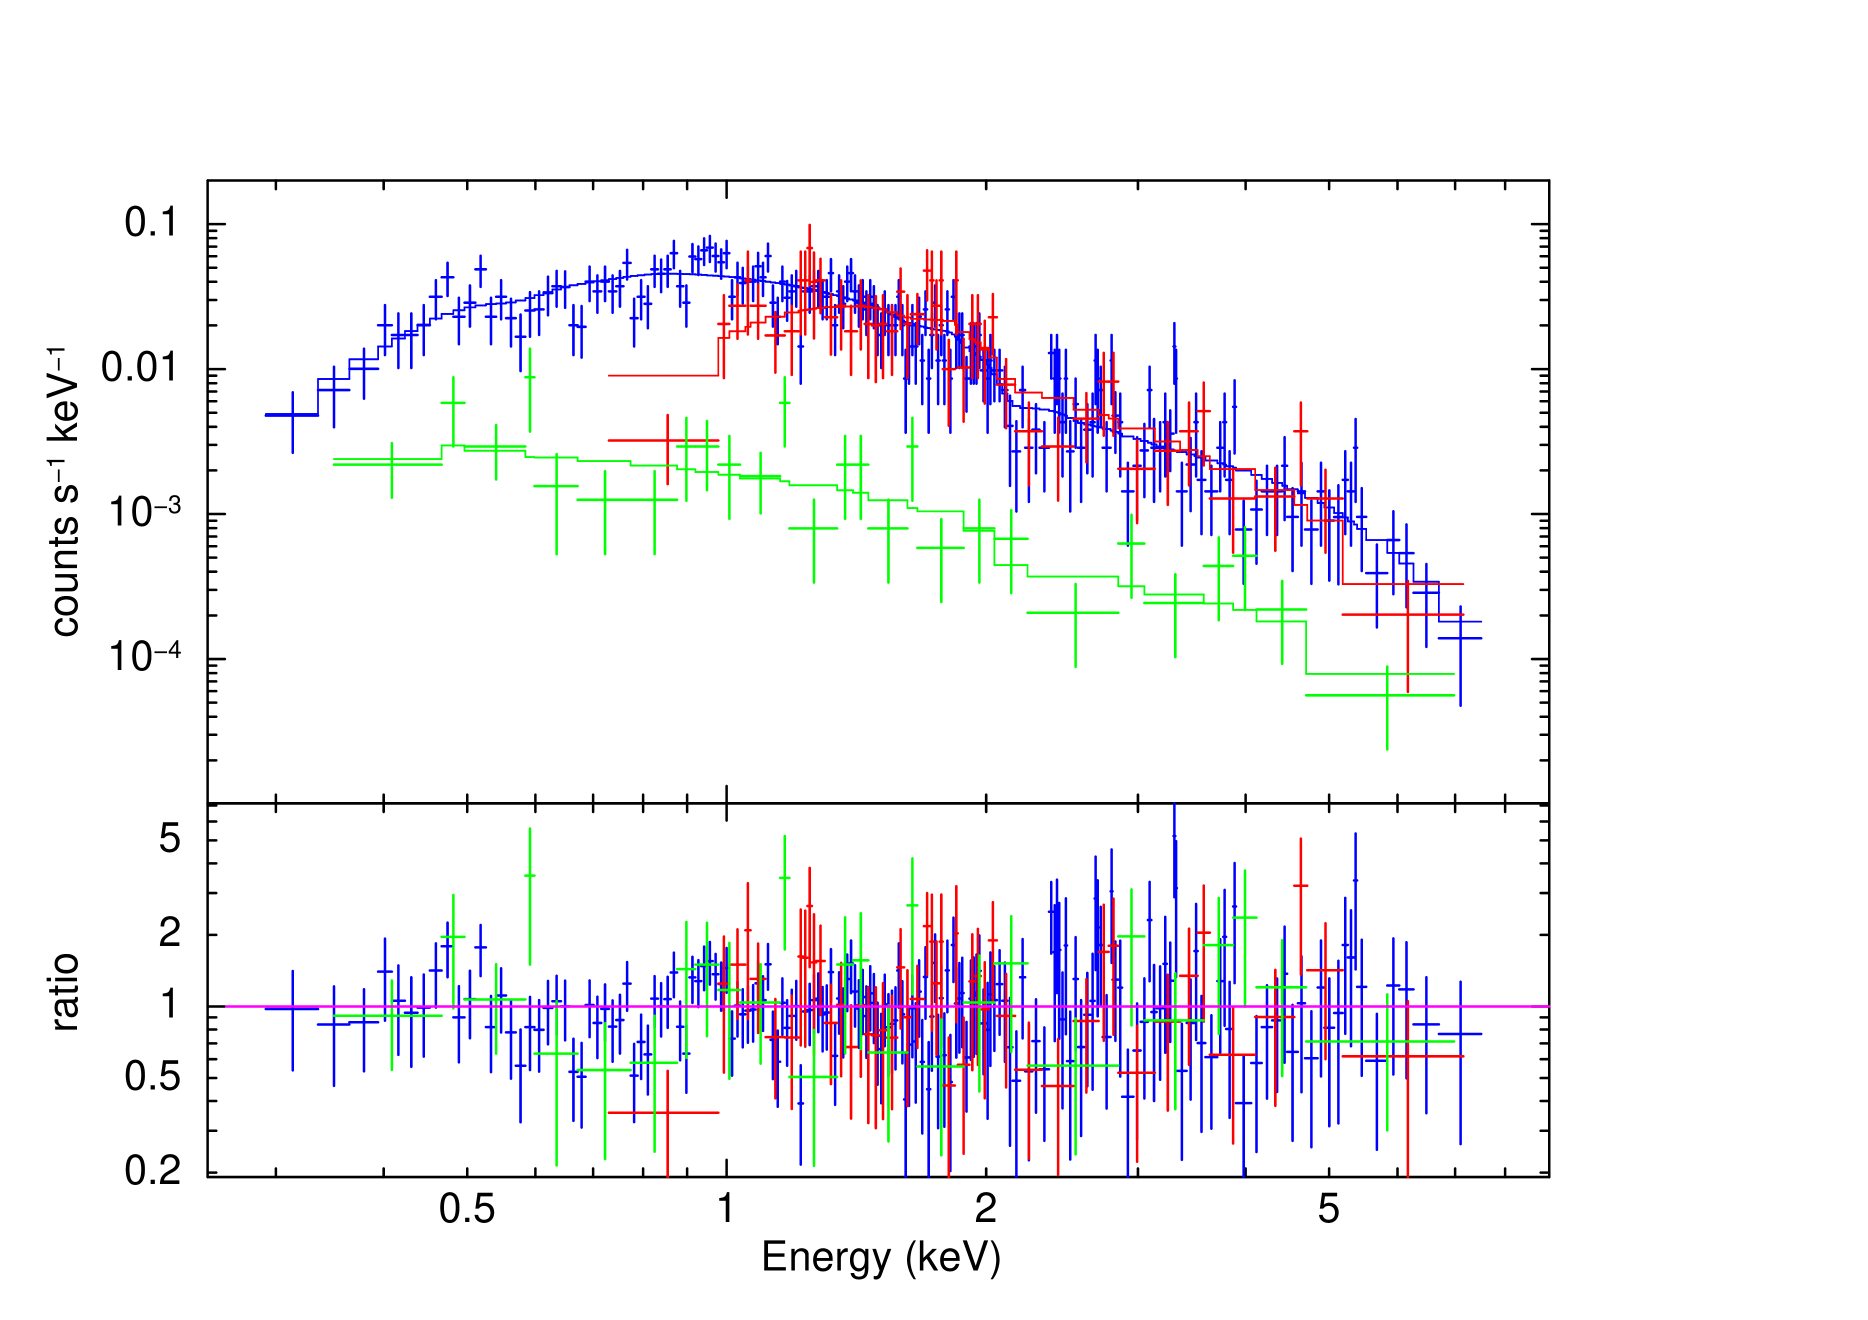
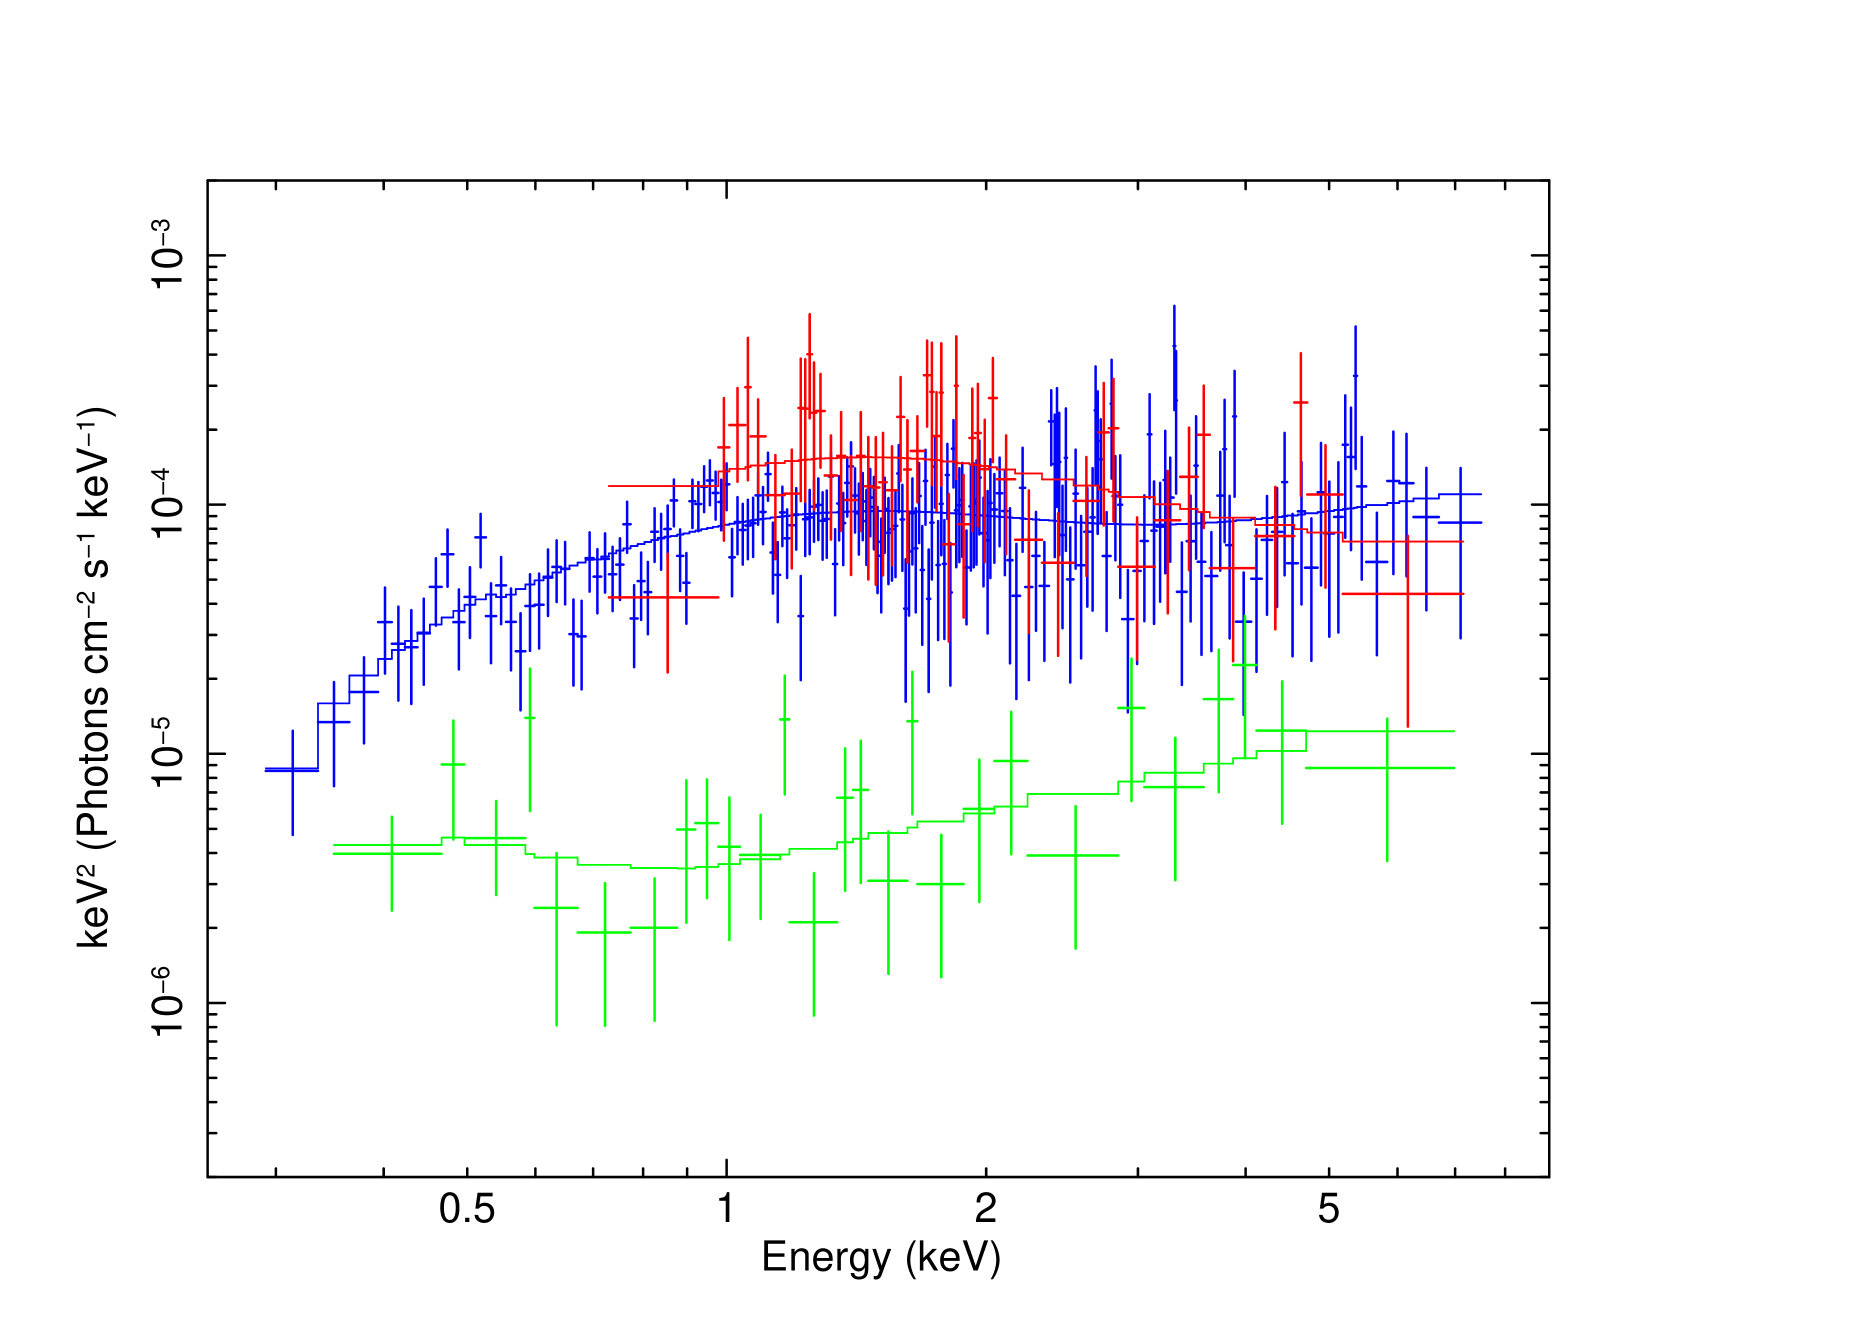
In 2002, X-2 rose from erg s-1 to erg s-1 in the space of 20 days (Figure 5, Table 2 and Soria et al. 2006). In the 2020 Chandra data, it is seen again in an ultraluminous state. We fitted the new spectrum with the C statistics, because of the limited number of counts (caused by a short exposure time and a sharp decline in ACIS sensitivity since 2002). For consistency, we also refitted the two spectra from 2002 with the C statistics, which for a high number of counts give identical results to the fitting used in Soria et al. (2006).
The 2020 spectrum is mildly curved (Figure 5), well fitted (C-stat degrees of freedom) by standard Comptonization models; e.g., simpl diskbb (Table 2), based on the Comptonization model of Steiner et al. (2009) applied to a seed disk-blackbody spectrum. For this fit, we froze the value of the intrinsic column density in the 2020 dataset to the best-fitting value obtained in the 2002 spectra ( cm-2), because such low values of are essentially unconstrained with the current low sensitivity of ACIS below 0.8 keV. The unabsorbed isotropic 0.3–10 keV luminosity for the Comptonization model is erg s-1. A simple power-law model (Table 2) can fit the 2020 data equally well (C-stat ) but only with the addition of a suspiciously high level of intrinsic absorption ( cm-2), inconsistent with the low values of found in the much deeper 2002 observations. An absorbed diskbb model provides a worse fit (C-stat ) than a power law or a Comptonization model, because it has too much spectral curvature. A -free disk gives a marginal improvement, (C-stat ) for a characteristic temperature keV and km. The unabsorbed 0.3–10 keV luminosity of the diskbb and diskpbb model fits are erg s-1.
For the 2002 June 11 dataset, we confirm (in agreement with what was reported by Soria et al. 2006) that the fit is significantly improved with the addition of a thermal plasma component (modelled in xspec with apec888https://heasarc.gsfc.nasa.gov/xanadu/xspec/manual/node134.html) to any smooth continuum model. For example (Table 2), adding the optically thin thermal plasma emission ( keV) to an absorbed power-law model brings the C statistics from 242.5 over 265 degrees of freedom, down to 229.0 over 263 degrees of freedom: an improvement significant to the 99% confidence limit (simftest in xspec). Similar improvements of are also obtained when an apec component is added to a Comptonization model. The presence of emission line residuals in the 2002 June 11 spectrum, at high , can be interpreted as typical evidence of ULX outflows (Middleton et al., 2015b; Pinto et al., 2016; Kosec et al., 2018). In 2020, the X-ray luminosity was even higher, but unfortunately the exposure time was shorter and ACIS has lost too much sensitivity below 1 keV (Figure 5), so that we cannot test the significance of an additional apec component in that epoch.
In summary, the 2020 Chandra observations show that the X-2 ULX remains very bright–in fact, more luminous than in 2002. This supports the hypothesis that X-2 provides an abundant supply for ionizing photons for the surrounding nebula. Extrapolating the best-fitting Comptonization model simpl diskbb for the 2020 dataset, we estimate an intrinsic flux of 3.5 photons s-1 emitted in the 54–300 eV range. For the best-fitting diskpbb model, the isotropic flux is 2 photons s-1 in the same energy range. The average luminosity and ioinizing flux over all three Chandra observations is of course lower, because of the lower state seen in 2002 May 21 (Table 2).
3.3 Morphology of the star-forming complex around X-2
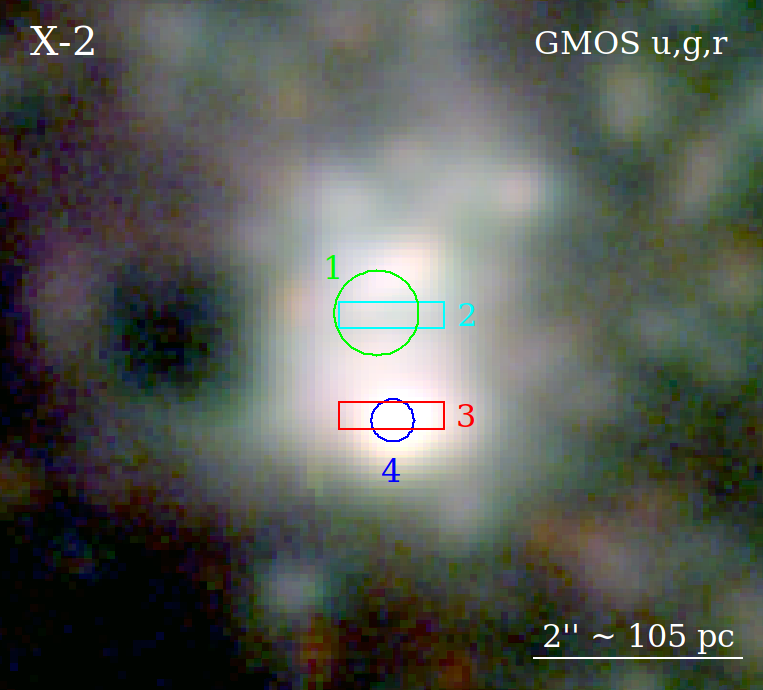
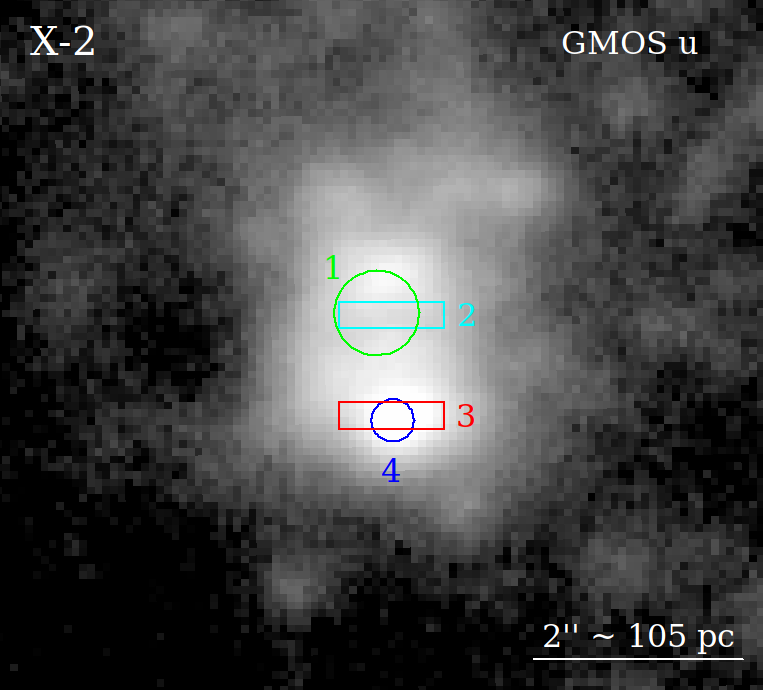
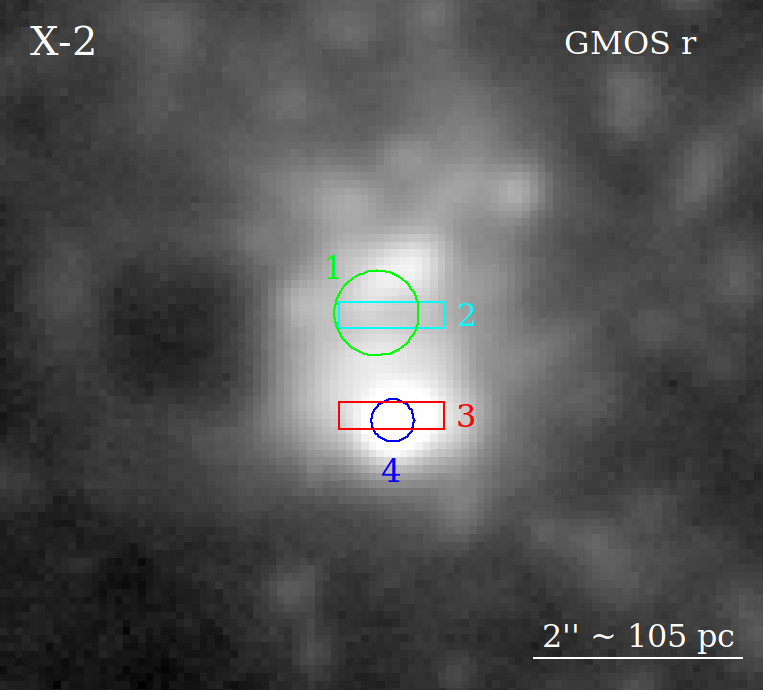
The star-forming region around X-2 has a central region (diameters of 100 150 pc) with bright continuum emission from young stars and star clusters (Gemini and HST images, Figures 2,3) together with strong line emission. In addition, line-emitting gas without significant broadband emission extends at least another 200 pc to the north and 100 pc to the south of the starlight-dominated region (compare the north-south extent of continuum and line emission in Figures 6,7).
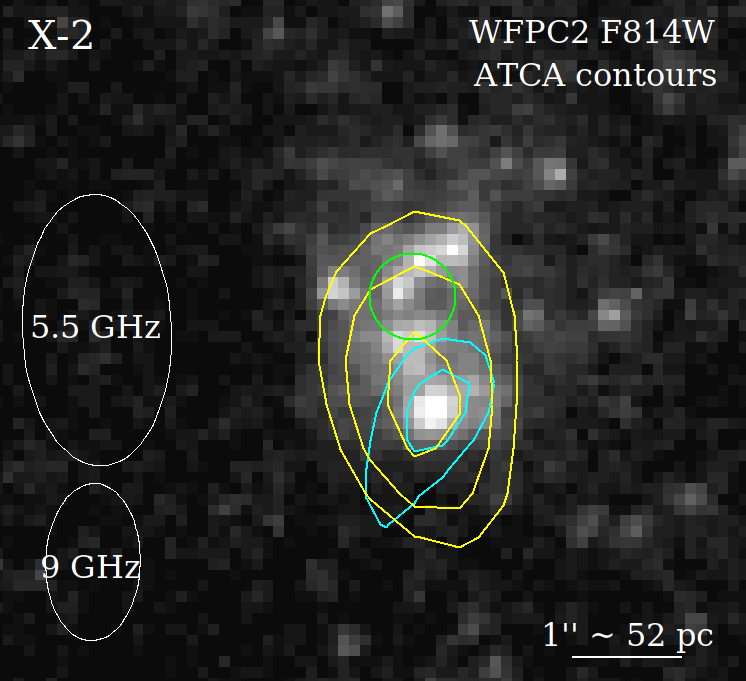
In the continuum-dominated regions, two specific location stand out for their multiband properties. Near the southern part of the complex, we find the brightest star cluster, coincident (within a 90% confidence limit of 02) with the unresolved radio source (Figures 3,4). About 11 north of the radio source, in the central/upper part of the star-forming complex, it is the location of the X-2 ULX. There is at least one point-like optical source (a candidate star cluster) within the Chandra error circle, which must be considered the best candidate optical counterpart of the ULX, but nothing outstanding compared with other young star clusters in the surroundings. It was already noted by Soria et al. (2006) that X-ray and radio positions appeared to be different; now we can confirm that result, with the help of the 2021 ATCA observations and a more accurate multi-instrument astrometric alignment. Moreover, we have now ascertained that the radio source coincides with the optically brightest star cluster.
For the radio source, the 2021 ATCA data at 9 GHz give a centroid at R.A.(J2000) , Dec.(J2000) . The flux density is Jy at 5.5 GHz (corresponding to a luminosity density erg s-1 Hz-1) and Jy at 9.0 GHz ( erg s-1 Hz-1). These values are consistent with the average flux densities determined from the 2001–2004 dataset, namely Jy at 4.8 GHz and Jy at 8.6 GHz (Soria et al., 2006). The spectral index suggests optically thin synchrotron emission, typical of SN remnants and/or ULX bubbles.
The radio luminosity erg s-1 (i.e., 2.5 times more luminous than Cas A) is near the upper end of the observed radio luminosity function for SNRs in nearby galaxies (Chomiuk & Wilcots, 2009; Thompson et al., 2009). Models of SNR radio luminosity evolution suggest that such high values can be reached for a normal SN (explosion energy 1051 erg) exploding in an relatively dense ambient medium with cm-3 (Berezhko & Völk, 2004; Sarbadhicary et al., 2017, 2019; Leahy et al., 2022). We will see from our diagnostic line ratio analysis (Section 3.6) that such higher-than-usual interstellar medium (ISM) density is indeed plausible.
The bright star cluster coincident with the radio source is the peak both of the continuum and of the Balmer line emission. From the HST/WFPC2 images, we obtain an apparent brightness of mag (Vega system) and mag. If we only consider line-of-sight Galactic extinction, this corresponds to dereddened absolute magnitudes mag and mag. However, our analysis of the Balmer decrement in the VLT spectra suggest a higher intrinsic reddening, as we shall discuss later (Section 3.4).
Moving now our attention to the upper part of the star-forming complex, near the location of the X-ray source, we see in the HST/WFPC2 images several optical peaks, candidate (small) star clusters, standing out from an unresolved, bright background (Figures 3,4). Only one of those sources is fully inside the Chandra error circle, and is consistent with the peak of the He ii 4686 emission (Section 3.6). The apparent brightness of that source is mag, mag. If corrected only for line-of-sight Galactic extinction, this corresponds to de-reddened absolute brightness mag, mag. However, we will discuss how also in this case, the Balmer decrement measured in the VLT spectra suggests additional intrinsic reddening.
None of the individual optical sources in the northern part of the bright complex (inside or at the edge of the Chandra error circle for the ULX) is spatially resolved. From the broadband continuum brightness and colours alone, we cannot completely rule out that they are individual supergiant stars rather than small star clusters. For example, using the Padova isochrones computed with the parsec code999http://stev.oapd.inaf.it/cgi-bin/cmd_3.7 (Bressan et al., 2012), we find that the optical source closest to the Chandra position is also consistent with a yellow supergiant with initial mass in the range of 17–20 at an age of 9.0–11.5 Myr, and with a radius of 240–330 . However, we consider this scenario very unlikely, because the strong Balmer line emission (Section 3.4) indicates a much younger age for the whole star-forming clump, an age at which stars in this mass range have not left the main sequence yet.
| Line ID | Flux near X-2 | Flux near SC | |
|---|---|---|---|
| (Å) | |||
| [O II]3726,3729 | 3739.3 | 2.76 | 2.20 |
| H10 | 3810.0 | 0.02 | 0.039 |
| H9 | 3846.5 | 0.025 | 0.053 |
| [Ne III]3869 | 3880.7 | 0.29 | 0.22 |
| H8 He I | 3900.8 | 0.16 | 0.15 |
| H [Ne III] | 3981.2 | 0.18 | 0.17 |
| H | 4114.2 | 0.19 | 0.18 |
| H | 4353.2 | 0.49 | 0.46 |
| [O III] | 4376.5 | 0.047 | 0.031 |
| He I | 4484.8 | 0.047 | 0.047 |
| a,bHe II | 4698.9 | 0.073 | 0.013 |
| c,dH | 4875.9 | 1.00 | 1.00 |
| [O III] | 4973.4 | 1.22 | 1.21 |
| [O III] | 5021.4 | 3.67 | 3.65 |
| [N I] | 5213.5 | 0.010 | 0.015 |
| He I | 5893.2 | 0.15 | 0.15 |
| [O I] | 6319.2 | 0.068 | 0.045 |
| [S II] | 6331.0 | 0.026 | 0.021 |
| [O I] | 6382.8 | 0.027 | 0.015 |
| [N II] | 6567.8 | 0.18 | 0.18 |
| e,fH | 6582.5 | 3.54 | 4.08 |
| [N II] | 6603.2 | 0.55 | 0.56 |
| [N II] | 6615.6 | 0.005 | 0.005 |
| He I | 6698.1 | 0.049 | 0.054 |
| [S II] | 6736.5 | 0.41 | 0.32 |
| [S II] | 6751.0 | 0.30 | 0.26 |
| He I | 7086.2 | 0.037 | 0.052 |
| [Ar III] | 7157.1 | 0.14 | 0.19 |
| [N II] | 7236.5 | 0.030 | 0.030 |
| [O II]7320,7330 | 7345.0 | 0.076 | 0.092 |
| [Ar III] | 7775.4 | 0.042 | 0.045 |
a: Observed fluxes of He II : erg cm-2 s-1 on the 1′′ slit around X-2; erg cm-2 s-1 on the 1′′ slit around the brightest SC; erg cm-2 s-1 extrapolated from the whole continuum-emitting star-forming clumps;
b: EW Å around X-2; EW Å around the brightest SC;
c: Observed fluxes of H: erg cm-2 s-1 on the 1′′ slit around X-2; erg cm-2 s-1 on the 1′′ slit around the brightest SC; erg cm-2 s-1 extrapolated from the whole continuum-emitting star-forming clumps;
d: EW Å around X-2; EW Å around the brightest SC;
e: Observed fluxes of H: erg cm-2 s-1 on the 1′′ slit around X-2; erg cm-2 s-1 on the 1′′ slit around the brightest SC; erg cm-2 s-1 extrapolated from the whole continuum-emitting star-forming clumps;
f: EW Å around X-2; EW Å around the brightest SC.
3.4 Star formation properties near X-2 from the VLT spectra
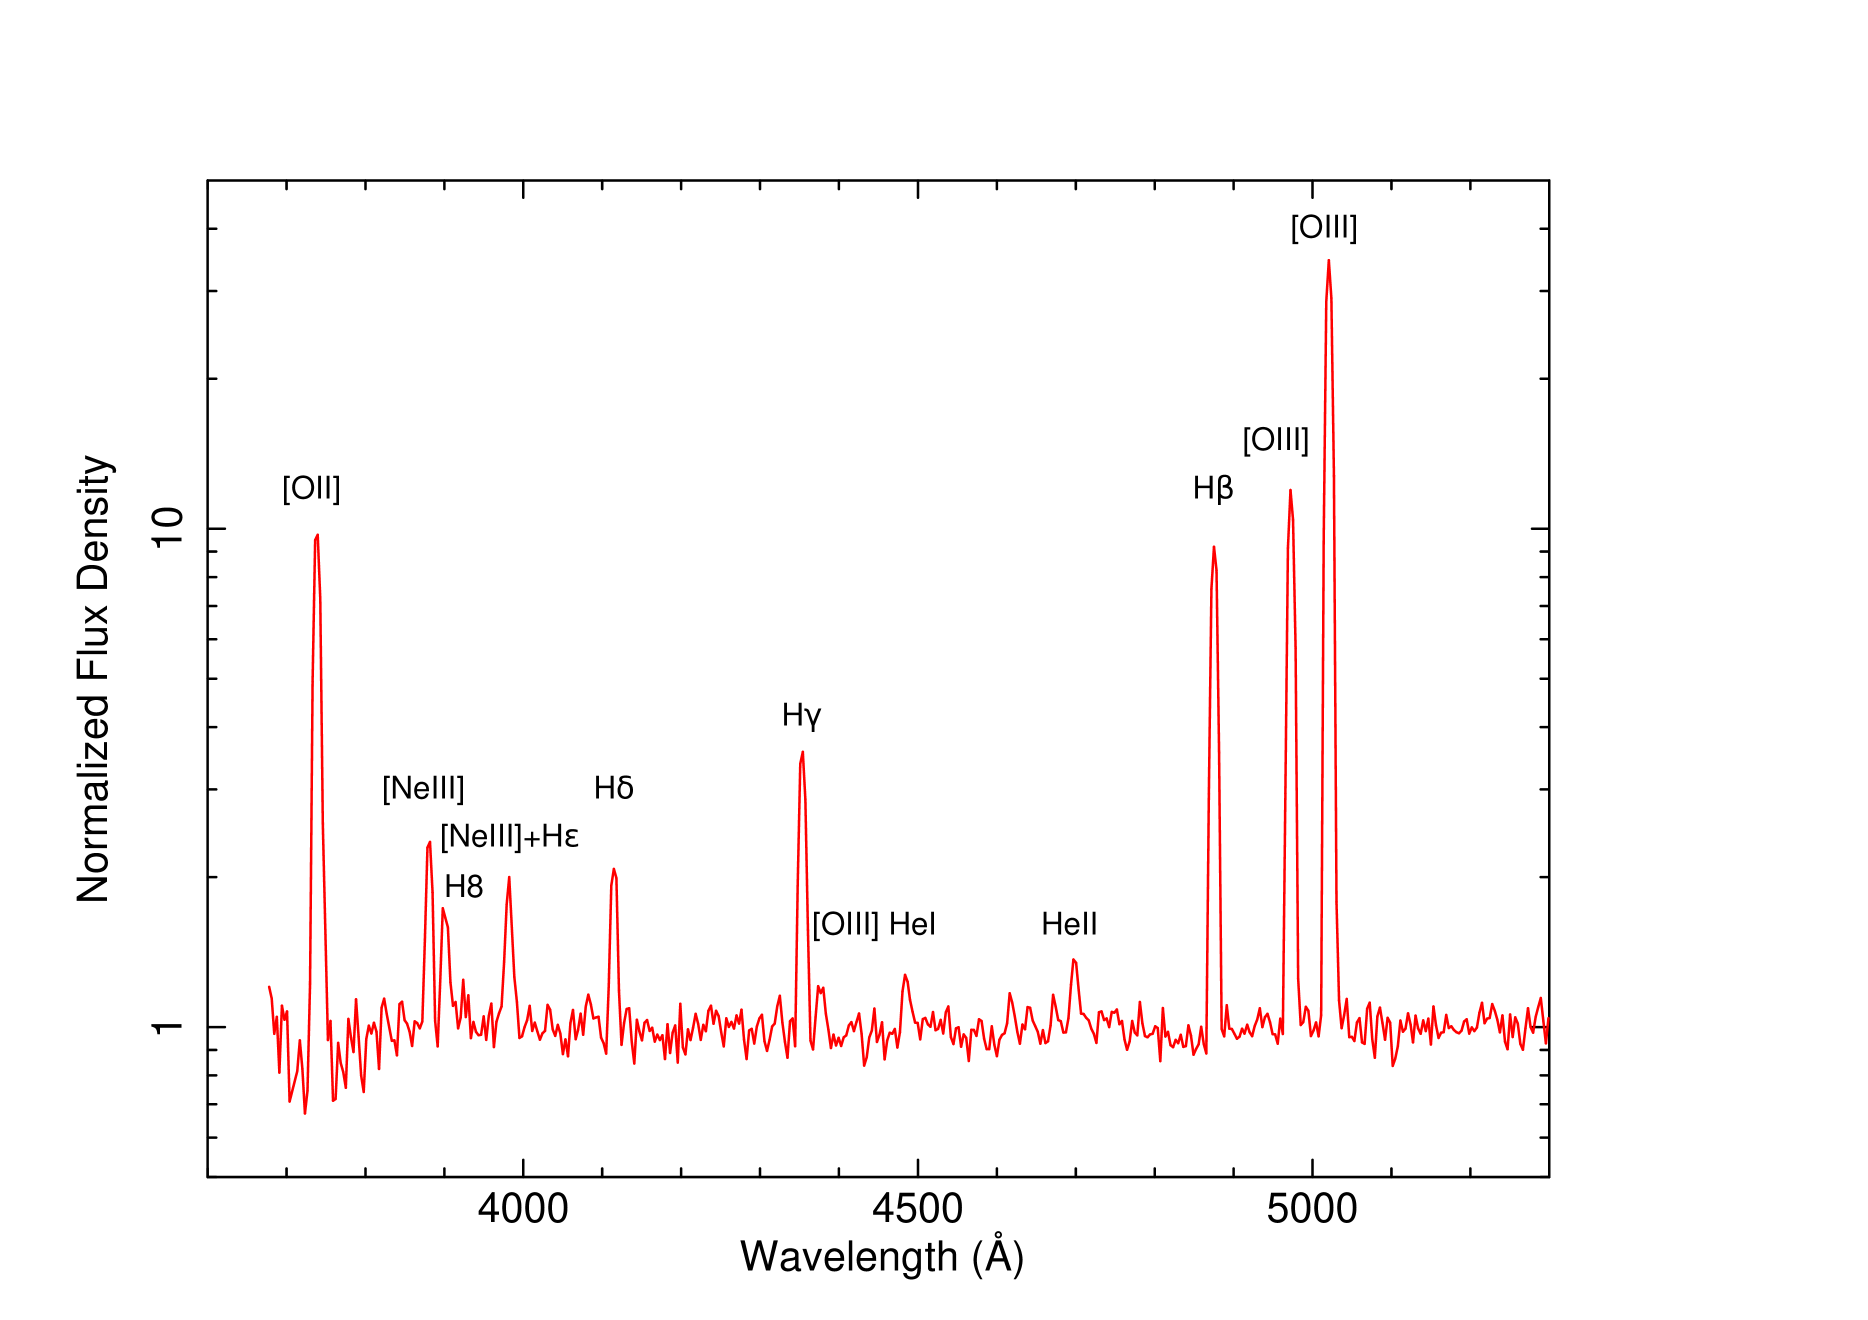
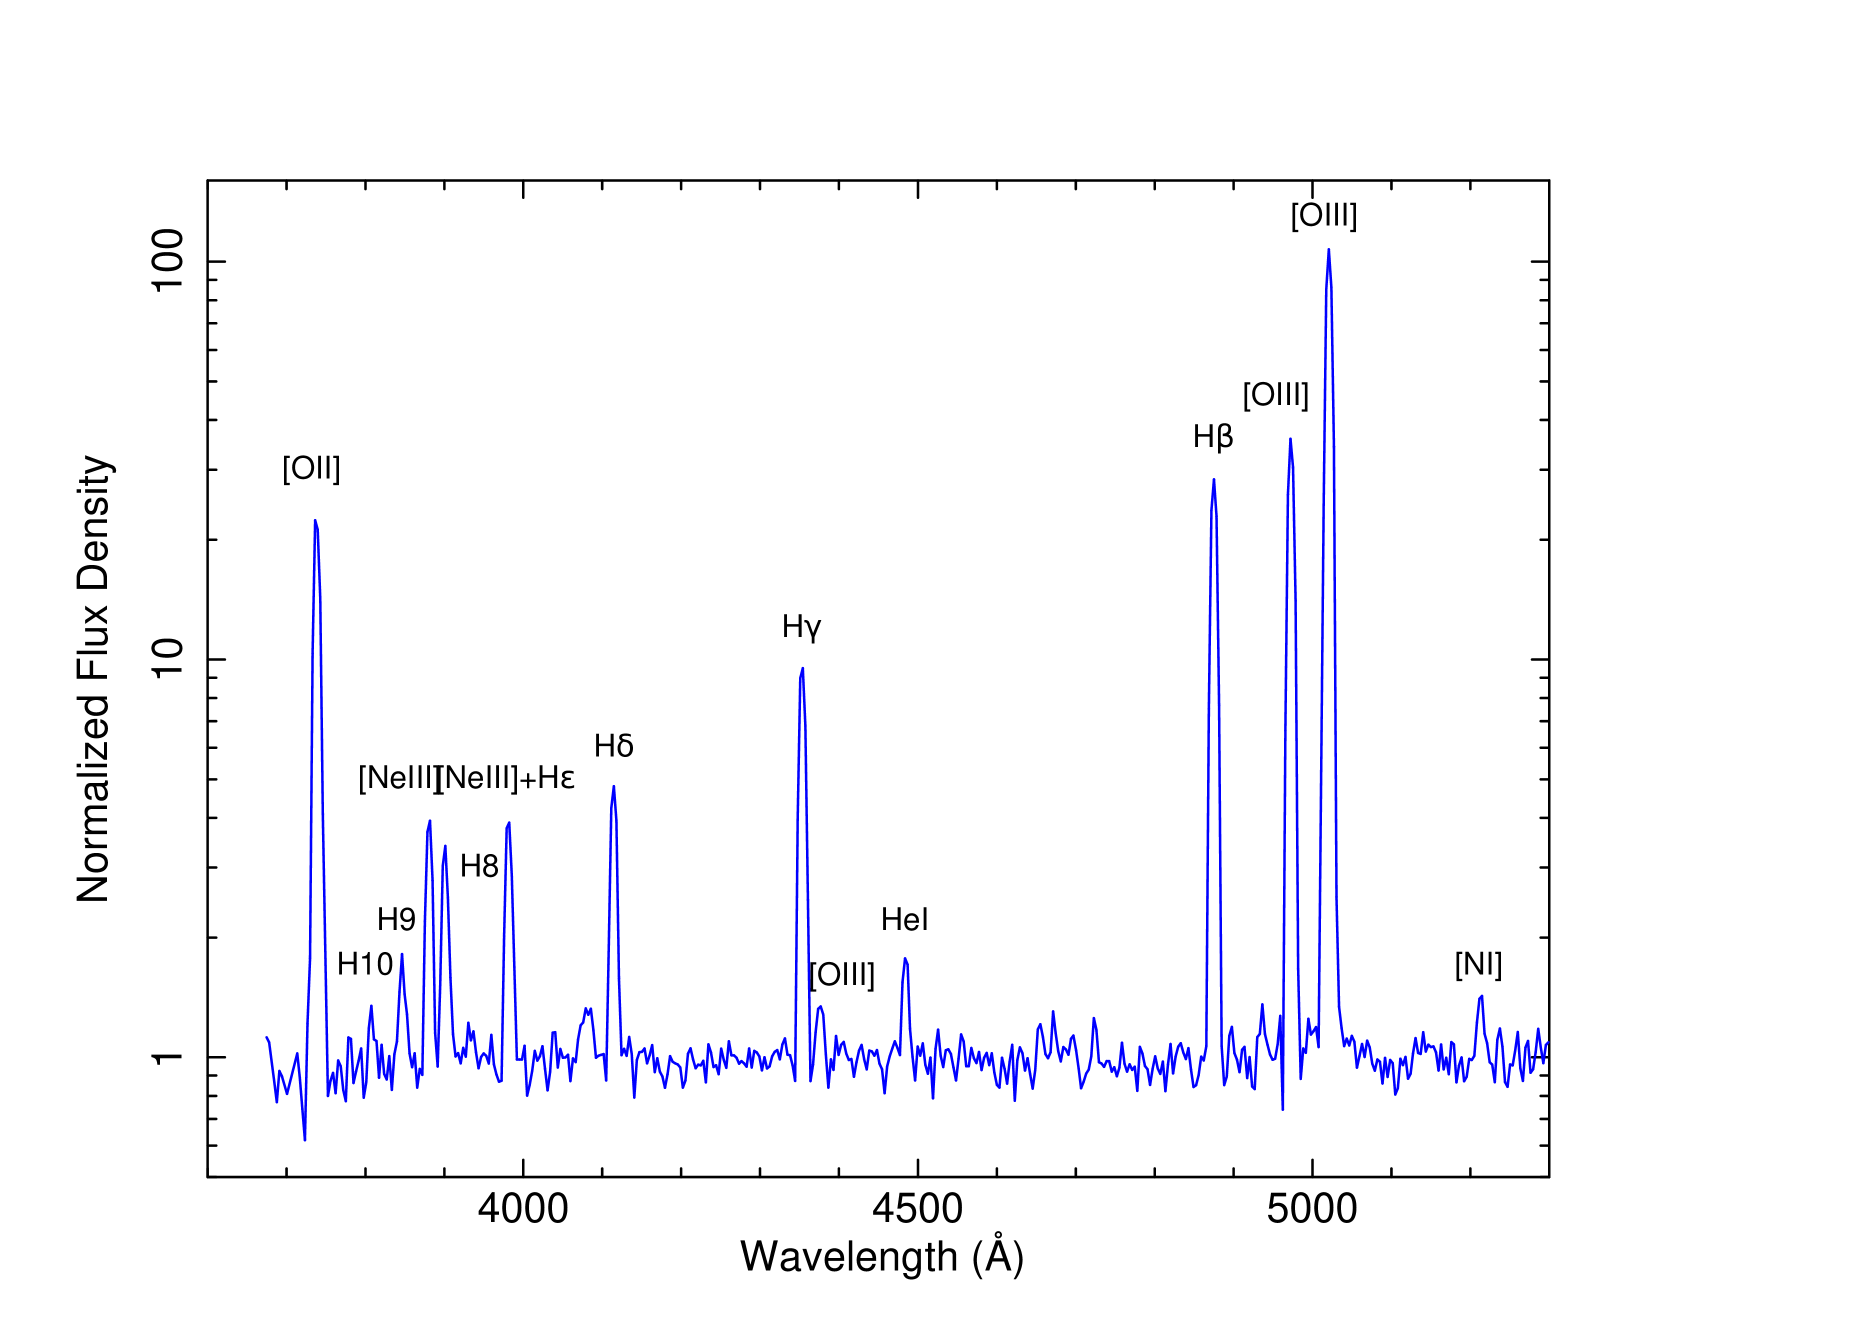
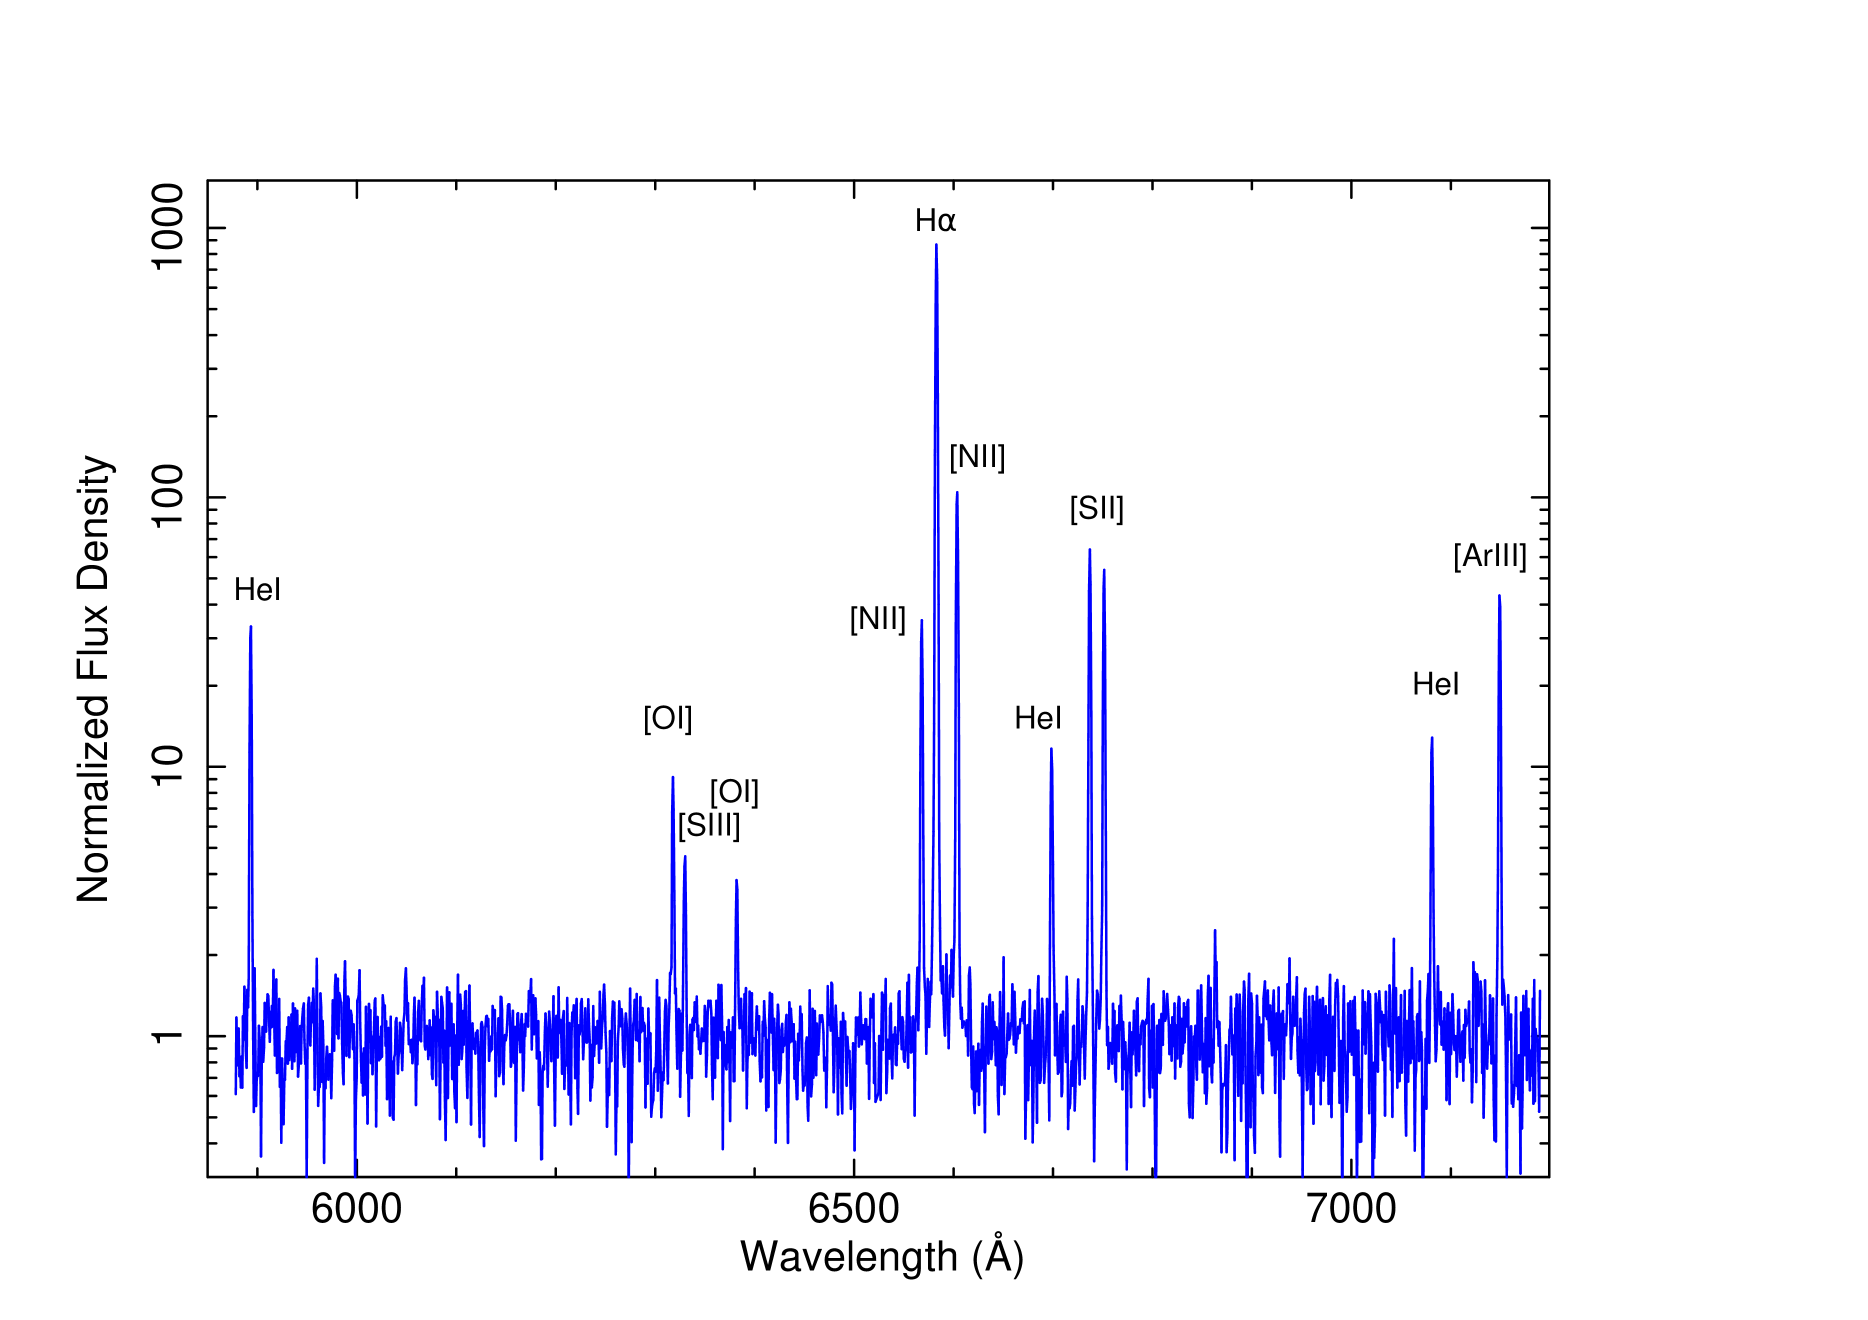
For a better understanding of the star formation properties of this clump, we turn to the VLT/FORS2 spectra. Following up on the arguments discussed in Section 3.3, we identified two characteristic regions: one around the southern star cluster and radio source, and the other around the Chandra source, 1′′ to the north. Thus, we defined two extraction regions along the slit (both for the 300V and 1200R grisms), centred on the two positions, and with a spatial extent of 4 pixels 1′′. In Table 3, we summarize the main properties of the lines detected in the two regions. This is more informative than the average properties over the whole complex, as we are looking for differences between the two positions.
We do not find significant velocity differences between northern and southern section in any of the lines. Thus, in Table 3 we report the average central wavelength of each line measured from the spectrum of the whole complex. The average recession speed is of km s-1. This redshift is in excellent agreement with the expected value at the location of X-2, derived from the neutral hydrogen maps of Sorgho et al. (2019) and Sardone et al. (2021).
We selected the five strongest lines in the 1200R spectra to constrain line broadening, comparing their observed FWHMs from the X-2 region with those of sky lines. We obtain a marginally significant result of a mean intrinsic FWHM Å around the X-ray source position and intrinsic FWHM Å around the radio source position. Thus, the intrinsic FWHM is 40 km s-1, a plausible value considering thermal broadening and turbulent motion of the gas in an H ii region. Moreover, we did double Gaussian fits of the strongest lines to test for the presence of a secondary, broader component in addition to the main narrow component. We found that the line profile in the radio source region does hint at the presence of broader wings extending up to 120 km s-1 from the central position. This is consistent with a shock ionization component associated with that non-thermal radio emitting region. The flux in the broader component is only a few percent of the total line flux. We would need higher dispersion spectra to investigate that further. No such broad component was found for the region around the x-ray source. We also did not find any evidence of P-Cygni profiles (signature of strong outflows) in the Balmer lines.
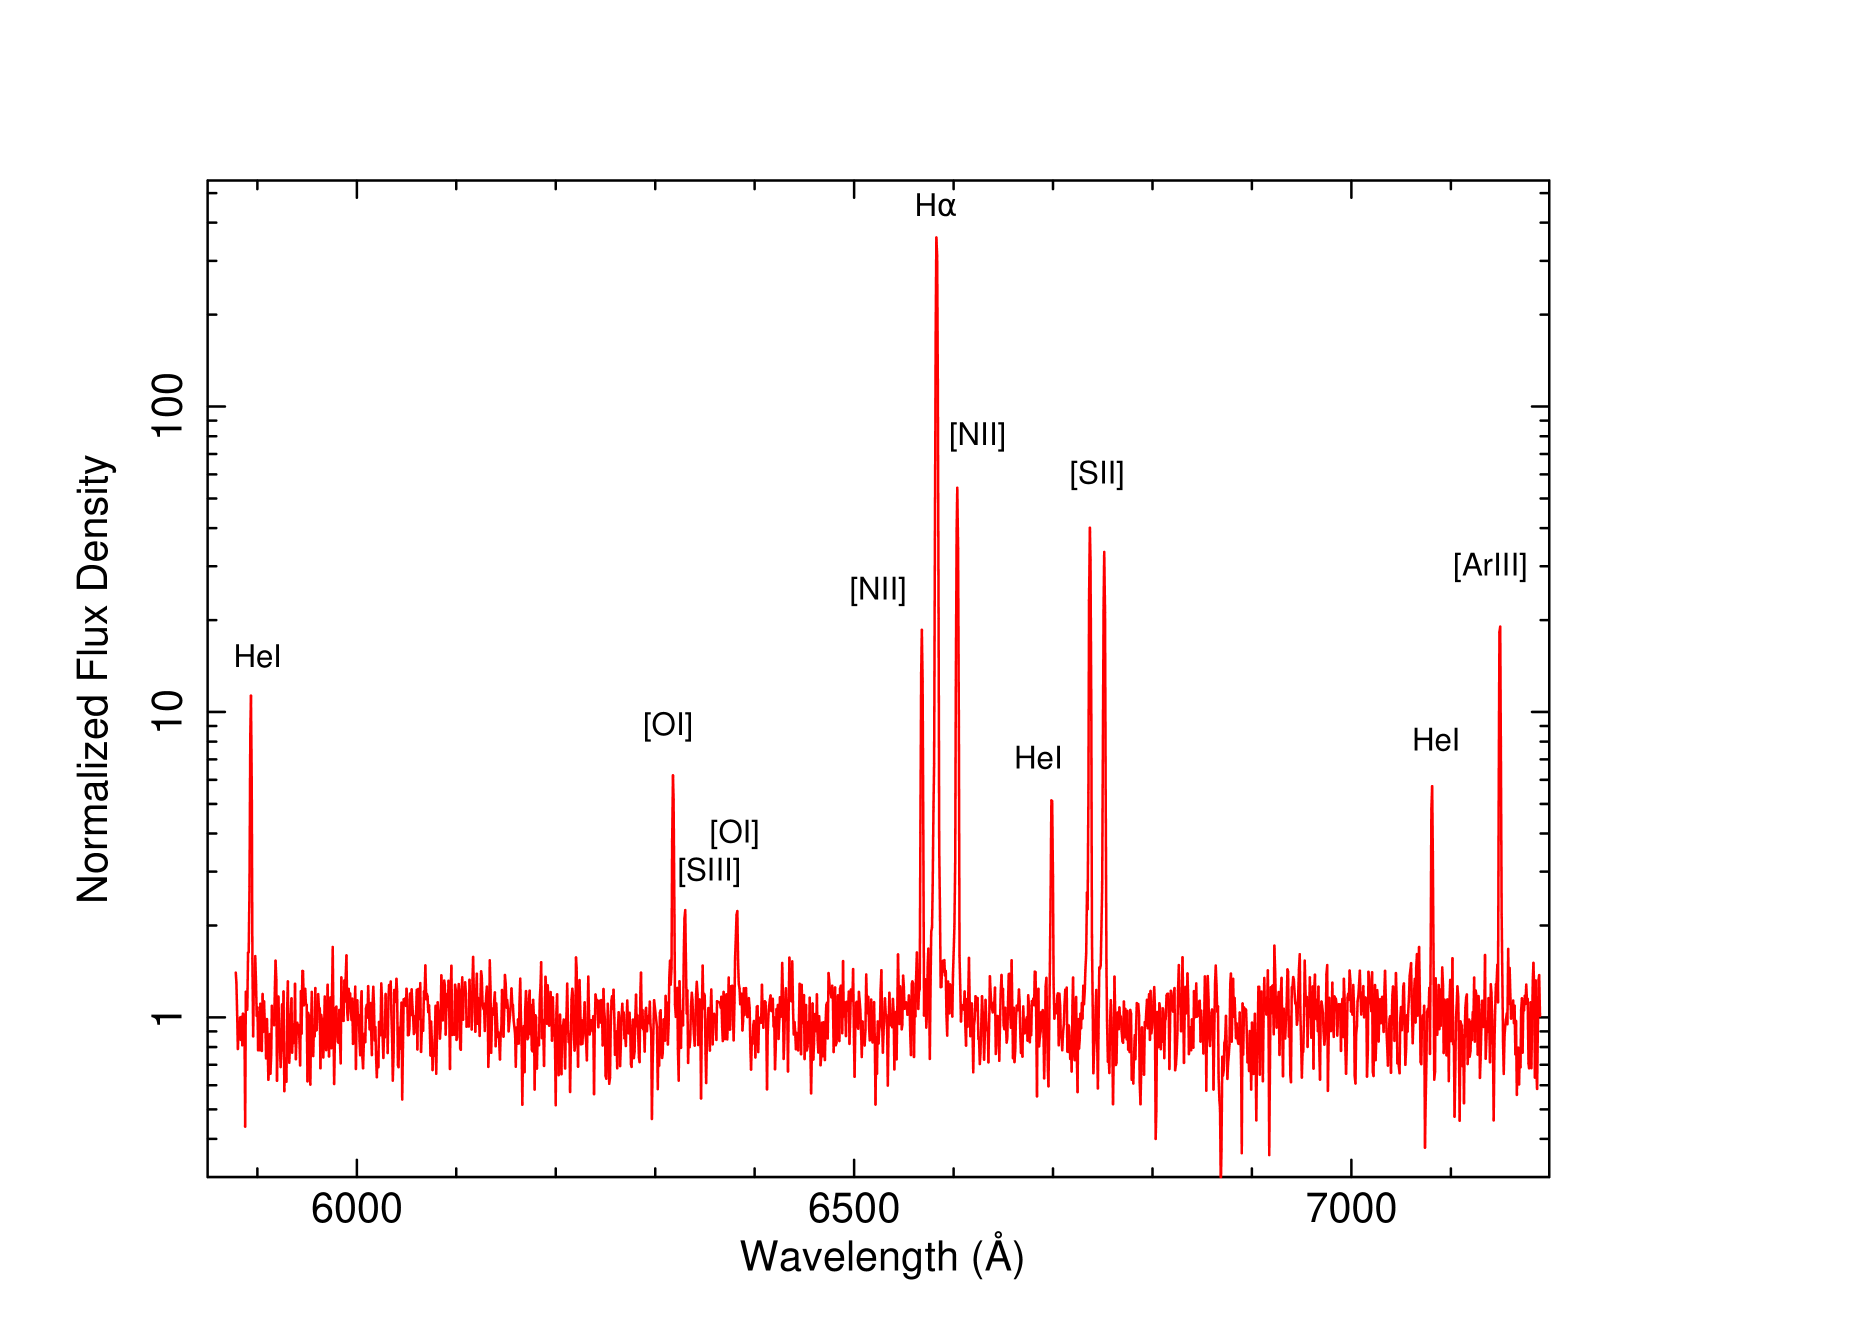
The flux of each line was computed from the average of the two 300V spectra, whenever possible. This was done for two reasons. First, because the 300V grisms covers both the red and the blue part of the optical spectrum, which reduces potential systematic errors for a flux comparison, for example between H and H. Second, because the 1200R spectrum was taken in not perfectly photometric conditions (thin cirrus clouds). However, some of the lines can only be resolved in the 1200R spectrum: for example, [O I] 6300 and [S II] 6313 are partly blended in the 300V spectra, and so are [N II] and H. In that case, we measured the relative flux of those lines to H in the 1200R spectrum, and then converted those values to absolute fluxes based on the 300V measurements.
In this Section, and in Section 3.5, we focus on the properties of the Balmer lines. Properties of other lines will be discussed in Sections 3.6 and 3.7. For very young star clusters, the observed H and H EWs and flux ratio (Balmer decrement) are a much better proxy for age and intrinsic reddening than the broadband continuum. From the VLT spectra, we determine EW(H) Å, and EW(H) Å at the location of the southern optical/radio peak (Table 4). Star cluster simulations with starburst99101010https://www.stsci.edu/science/starburst99/docs/default.htm (Leitherer et al., 1999, 2014), assuming instantaneous star formation and solar metallicity, indicate a well-constrained age of Myr for the observed EWs. The Balmer ratio is significantly higher than the canonical value of 2.86 for photoionized gas. Using a Milky Way extinction curve with , the total (intrinsic plus line-of-sight Galactic) reddening required to explain the high Balmer ratio is mag, corresponding to mag, mag, mag. Subtracting this extinction from the observed values of optical brightness (Section 3.3), we obtain our best estimate for the de-reddened absolute brightness mag, mag. This agrees well with the expected broadband colour between the two bands for a star cluster at the age of 2.5 Myr111111starburst99 predicts for a cluster age of Myr (instantaneous star formation, solar metallicity, Kroupa IMF). The F814W filter is essentially identical to the standard band. Instead, the F606W filter is broader than the standard towards longer wavelengths, and includes H (Holtzman et al., 1995). For a young star cluster with EW(H) Å, we estimate that is 0.6 mag brighter than standard . Thus, we estimate that mag corresponds to mag, mag.. Combining the cluster age and the extinction-corrected -band absolute brightness of mag, from starburst99 we obtain an estimate of for the total stellar mass in the southern cluster.
We can apply similar arguments for the smaller star clusters near the Chandra position. The VLT spectra extracted from 05 around the ULX position give EW(H) Å, and EW(H) Å (Table 4), and a Balmer ratio . The EWs suggest an age of Myr for the central/northern part of the clump, consistent with the scenario that star formation is propagating southwards in time. The Balmer decrement implies a total reddening mag, which corresponds to mag, mag, mag. If we apply these values of age and extinction to the point-like optical source closest to the X-ray position, we find absolute brightnesses mag, mag, which correspond to a stellar mass of , and similar masses 2,000–3,000 for each of the other three small clusters within 05 of the X-ray position (Figure 3).
An average extinction mag corresponds to an equivalent neutral hydrogen column density –2 cm-2, depending on the choice of conversion factor in the literature (Foight et al., 2016; Willingale et al., 2013; Watson, 2011; Güver & Özel, 2009). This is marginally higher than the total values of cm-2 fitted to the Chandra spectra in the most reliable Comptonization or disk-blackbody models (Table 2). However, the optical extinction is an average value over a projected 50 pc 50 pc region around the X-ray source. The latter may be in a lower-density cavity (perhaps because the gas is ionized by the ULX itself), or may be located on the near side of the ionized nebula rather than inside one of the small star clusters.
3.5 Total H emission around X-2
We used the FORS2 300V grism spectrum (average of the two 600-s exposures) to measure the observed flux on the slit. We found erg cm-2 s-1 on the 1′′ slit around the southern star cluster, coincident with the radio detection. Because the seeing is approximately the same as the slit width, we need to take into account that a fraction of light from the cluster does not fall on the slit. We estimated this fraction by inspecting the acquisition images taken before and after the two 300V spectra, and determining the fraction of emission from bright, isolated stars that falls within a 1′′-wide rectangular box. One of the two acquisition images was taken in slightly worse seeing conditions (115) than the spectra, the other image had better seeing (065); thus we took a weighted average of the two estimates. We also verified the result by blurring the HST/WFPC2 image in the F606W filter to simulate the ground-based seeing. We obtain that 35% of the light from isolated point-like sources is lost off the slit in the 300V spectra. However, in the case of the slit extraction around the southern star cluster, this loss is partly compensated by the additional emission from the star-forming complex east and west of the slit that ends up into the slit. Taking both effects into account, we estimate the total absorbed flux from the star cluster is erg cm-2 s-1.
Next, we need to correct for dust reddening. As mentioned earlier (Section 3.4), the Balmer decrement of 4.08 at the position of the star cluster suggests mag, that is mag, corresponding to . Thus, our best estimate for the H emission of the brightest cluster is erg cm-2 s-1 and a luminosity erg s-1. The 5.5-GHz flux density for the free-free radio emission associated with this Balmer flux is Jy (Caplan & Deharveng, 1986). The observed 5.5-GHz flux density (unresolved and spatially coincident with the star cluster) is Jy (Section 3.3). We conclude that free-free emission alone is a significant but not dominant component of the radio source in the X-2 complex.
Furthermore, we estimate the total H luminosity from the whole star-forming clump, defined as the 2 pc) region with both starlight continuum and nebular line emission. The FORS2 spectra show a flux erg cm-2 s-1 on the slit. From the VLT/FORS2 acquisition image taken the same night and with the same seeing, we estimate that the emission along the slit is 60% of the total emission from the star-forming clump. Thus, we estimate that erg cm-2 s-1. The emission-weighted average Balmer decrement along the slit is 3.9 (running from 4.1 at the younger, brighter southern end to 3.5 at the slightly older, fainter northern end). This corresponds to mag, mag, and . Thus, our best estimate for the dereddened H flux of the star-forming region is erg cm-2 s-1 and a luminosity erg s-1.
| ULX | Ratio | |||
|---|---|---|---|---|
| (Mpc) | ||||
| NGC 7424 X-2 | 10.8 | 8c | 7 (0.6–8) | 11 |
| Ho II X-1 | 3.05 | 2.7 | 7 (2–18) | 4 |
| M 81 X-6d | 3.6 | 0.11e | 5 (2–9) | 0.2 |
| NGC 5408 X-1 | 4.8 | 1.1 | 7 (2–12) | 2 |
| NGC 6946 X-1f | 7.7 | 40 | 9(6–20) | 45g |
| M 51 X107h | 8.6 | 0.8 | 2 | 4 |
| 1 Zw 18 X-1 | 19 | 123 | 3.2 | 380i |
| Mrk 1434 X-Nj | 31 | 86 | 16 | 54k |
a: Extinction-corrected luminosity of the nebular He II line. Line-of-sight Galactic extinction is assumed, when an intrinsic value was not given in the literature;
b: unabsorbed (0.3–10)-keV luminosity of the ULX. As ULXs are typically variable, a ”characteristic” value (not a precise mathematical average) is reported, as well as a range of luminosities found at different epochs;
c: assuming that the He II photons see an average extinction mag (based on the Balmer decrement);
d: CXO J095532.9690033;
e: includes only the emission integrated along the slit;
f: the nebula is best known as NGC 6946 MF16;
g: He II emission requires both a photo-ionized and a shock-ionized component;
h: CXOM51 J132940.0471237
i: He II emission probably not powered (only) by X-1; ionization by a hot superbubble proposed by (Oskinova & Schaerer, 2022) but ruled out by Franeck et al. (2022);
j: CXO J103410.1580349;
k: He II emission probably not powered (only) by X-N;
References: for NGC 7424 X-2: this work; for from Ho II X-1: Moon et al. (2011); Lehmann et al. (2005); Kaaret et al. (2004); Pakull & Mirioni (2002); for from Ho II X-1: Barra et al. (2023); Gúrpide et al. (2021b); Walton et al. (2015); Sutton et al. (2013); Grisé et al. (2010); for from M 81 X-6: Moon et al. (2011) for from M 81 X-6: Bernadich et al. (2022); Evans et al. (2020); Webb et al. (2020); Swartz et al. (2003); for from NGC 5408 X-1: Kaaret & Corbel (2009); for from NGC 5408 X-1: Caballero-García et al. (2013); Sutton et al. (2013); Grisé et al. (2013); Kaaret & Corbel (2009); for from NGC 6946 X-1: Abolmasov et al. (2008); for from NGC 6946 X-1: Earnshaw et al. (2019); Middleton et al. (2015a); Sutton et al. (2013); Roberts & Colbert (2003); see also Kaaret et al. (2010) for the ionizing UV flux in this source; for from M 51 X107: Urquhart et al. (2018); for from M 51 X107: Urquhart & Soria (2016); Kuntz et al. (2016); for from 1 Zw 18: Rickards Vaught et al. (2021); Kehrig et al. (2021, 2015); for from 1 Zw 18 X-1: Thuan et al. (2004); for from Mrk 1434: Thygesen et al. (2023); for from Mrk 1434 X-N: Thygesen et al. (2023); Lemons et al. (2015).
3.6 He II emission near X-2 and other line diagnostics
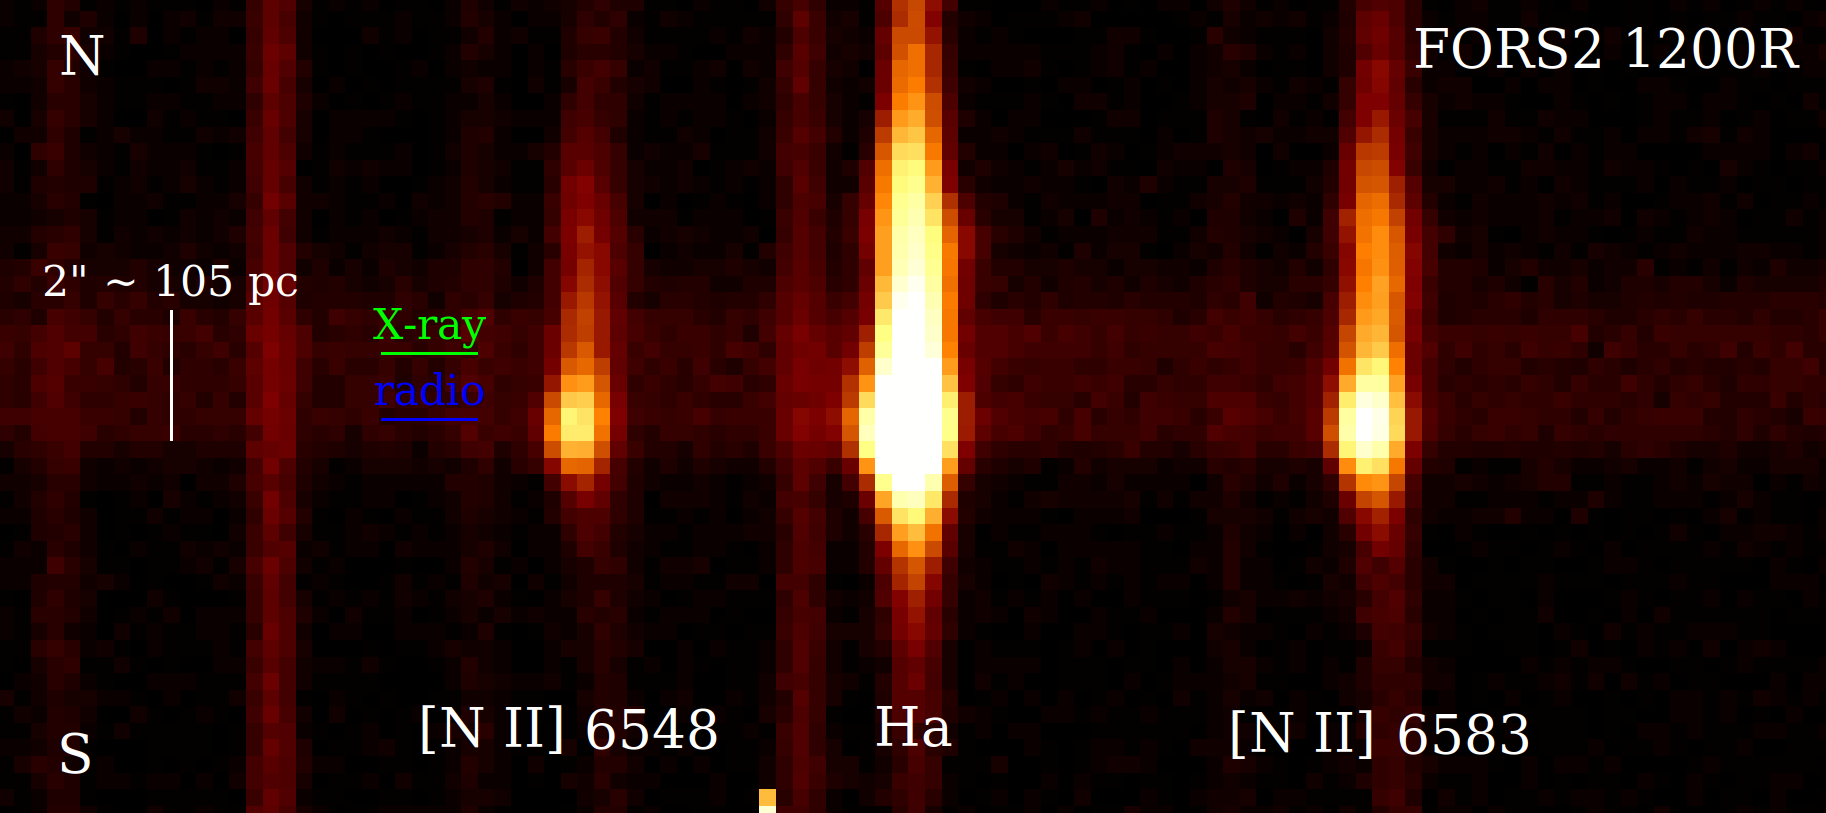
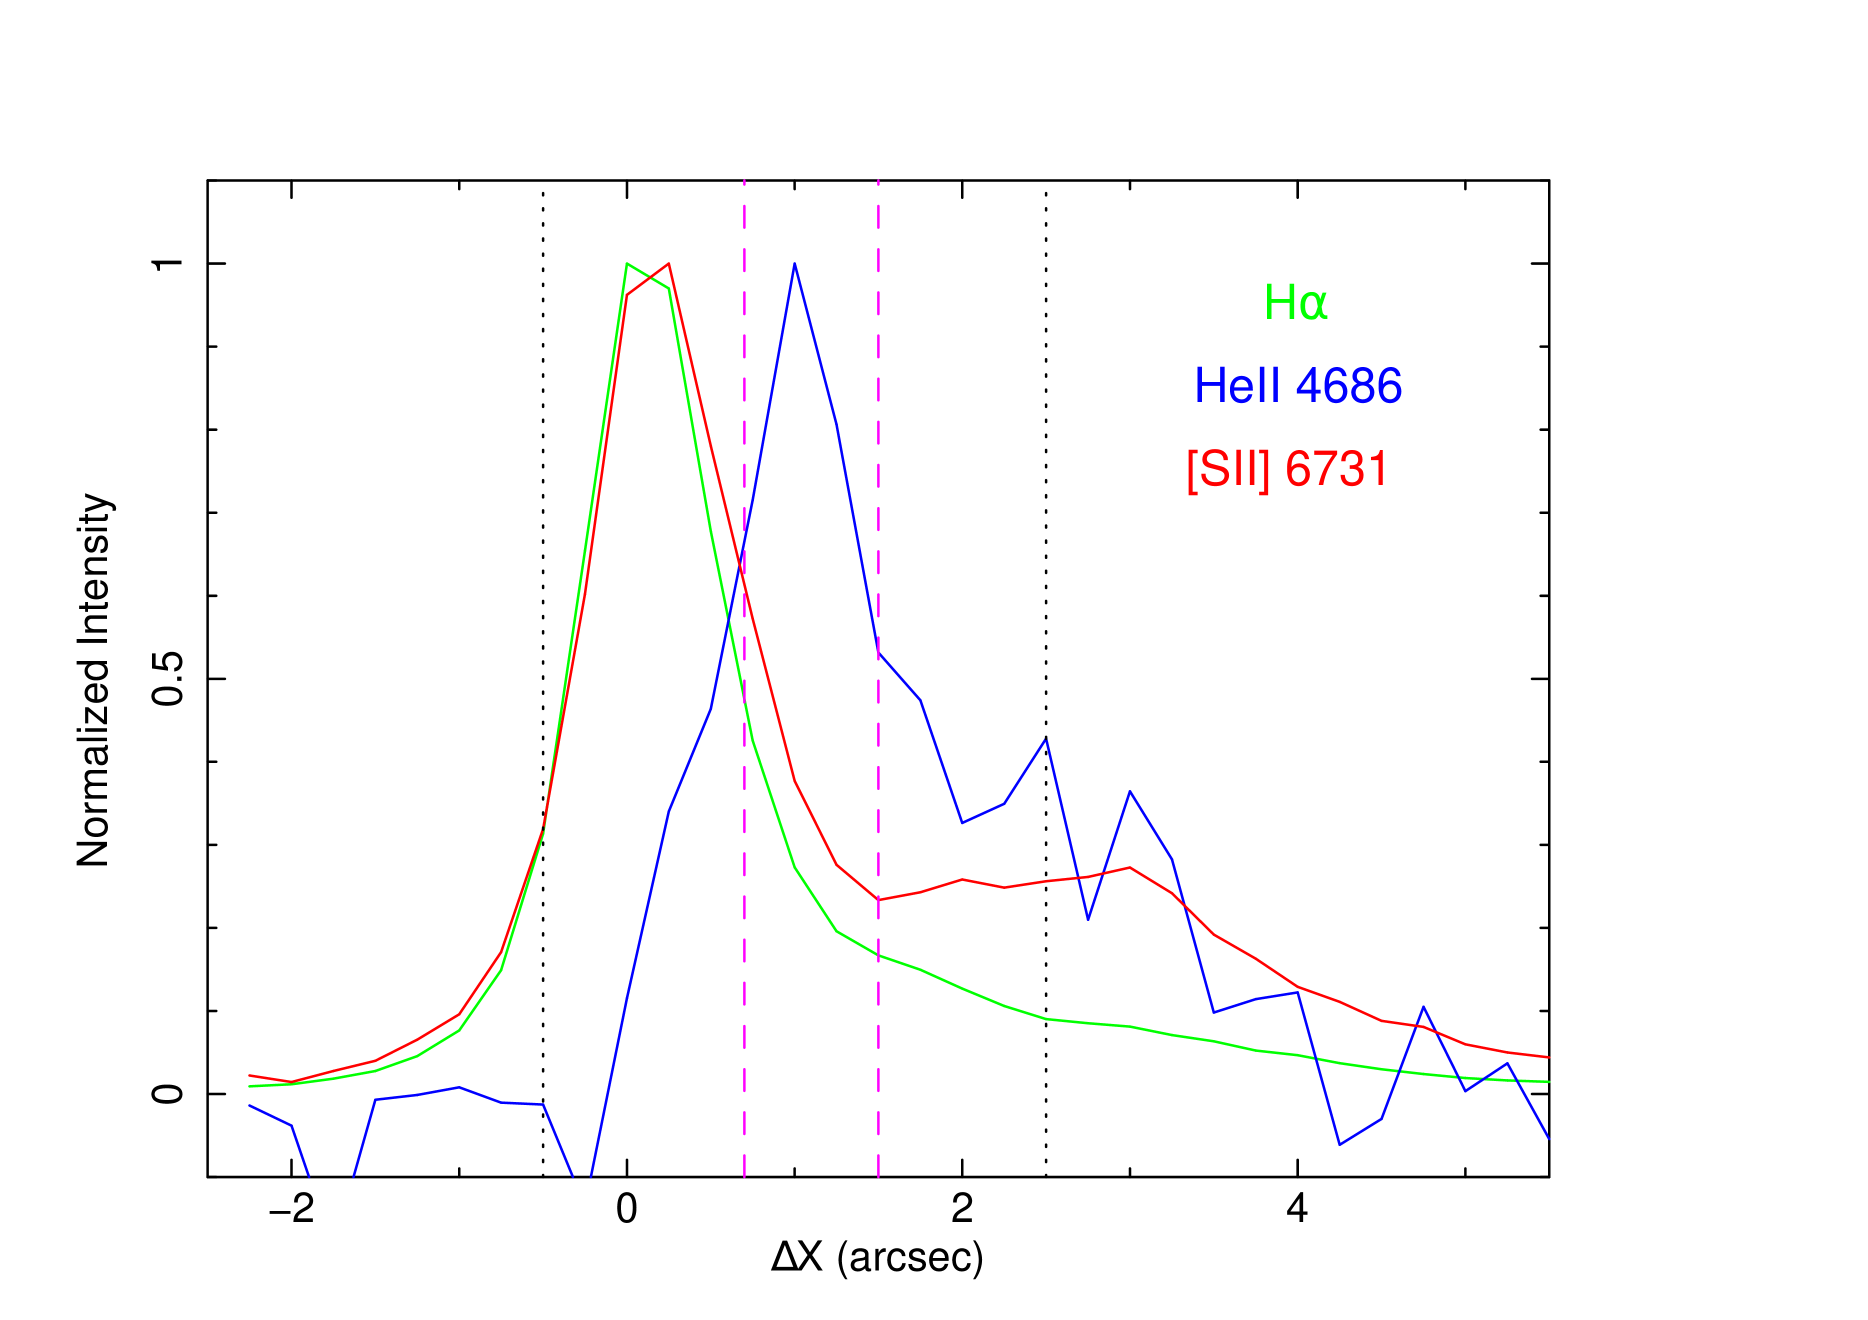
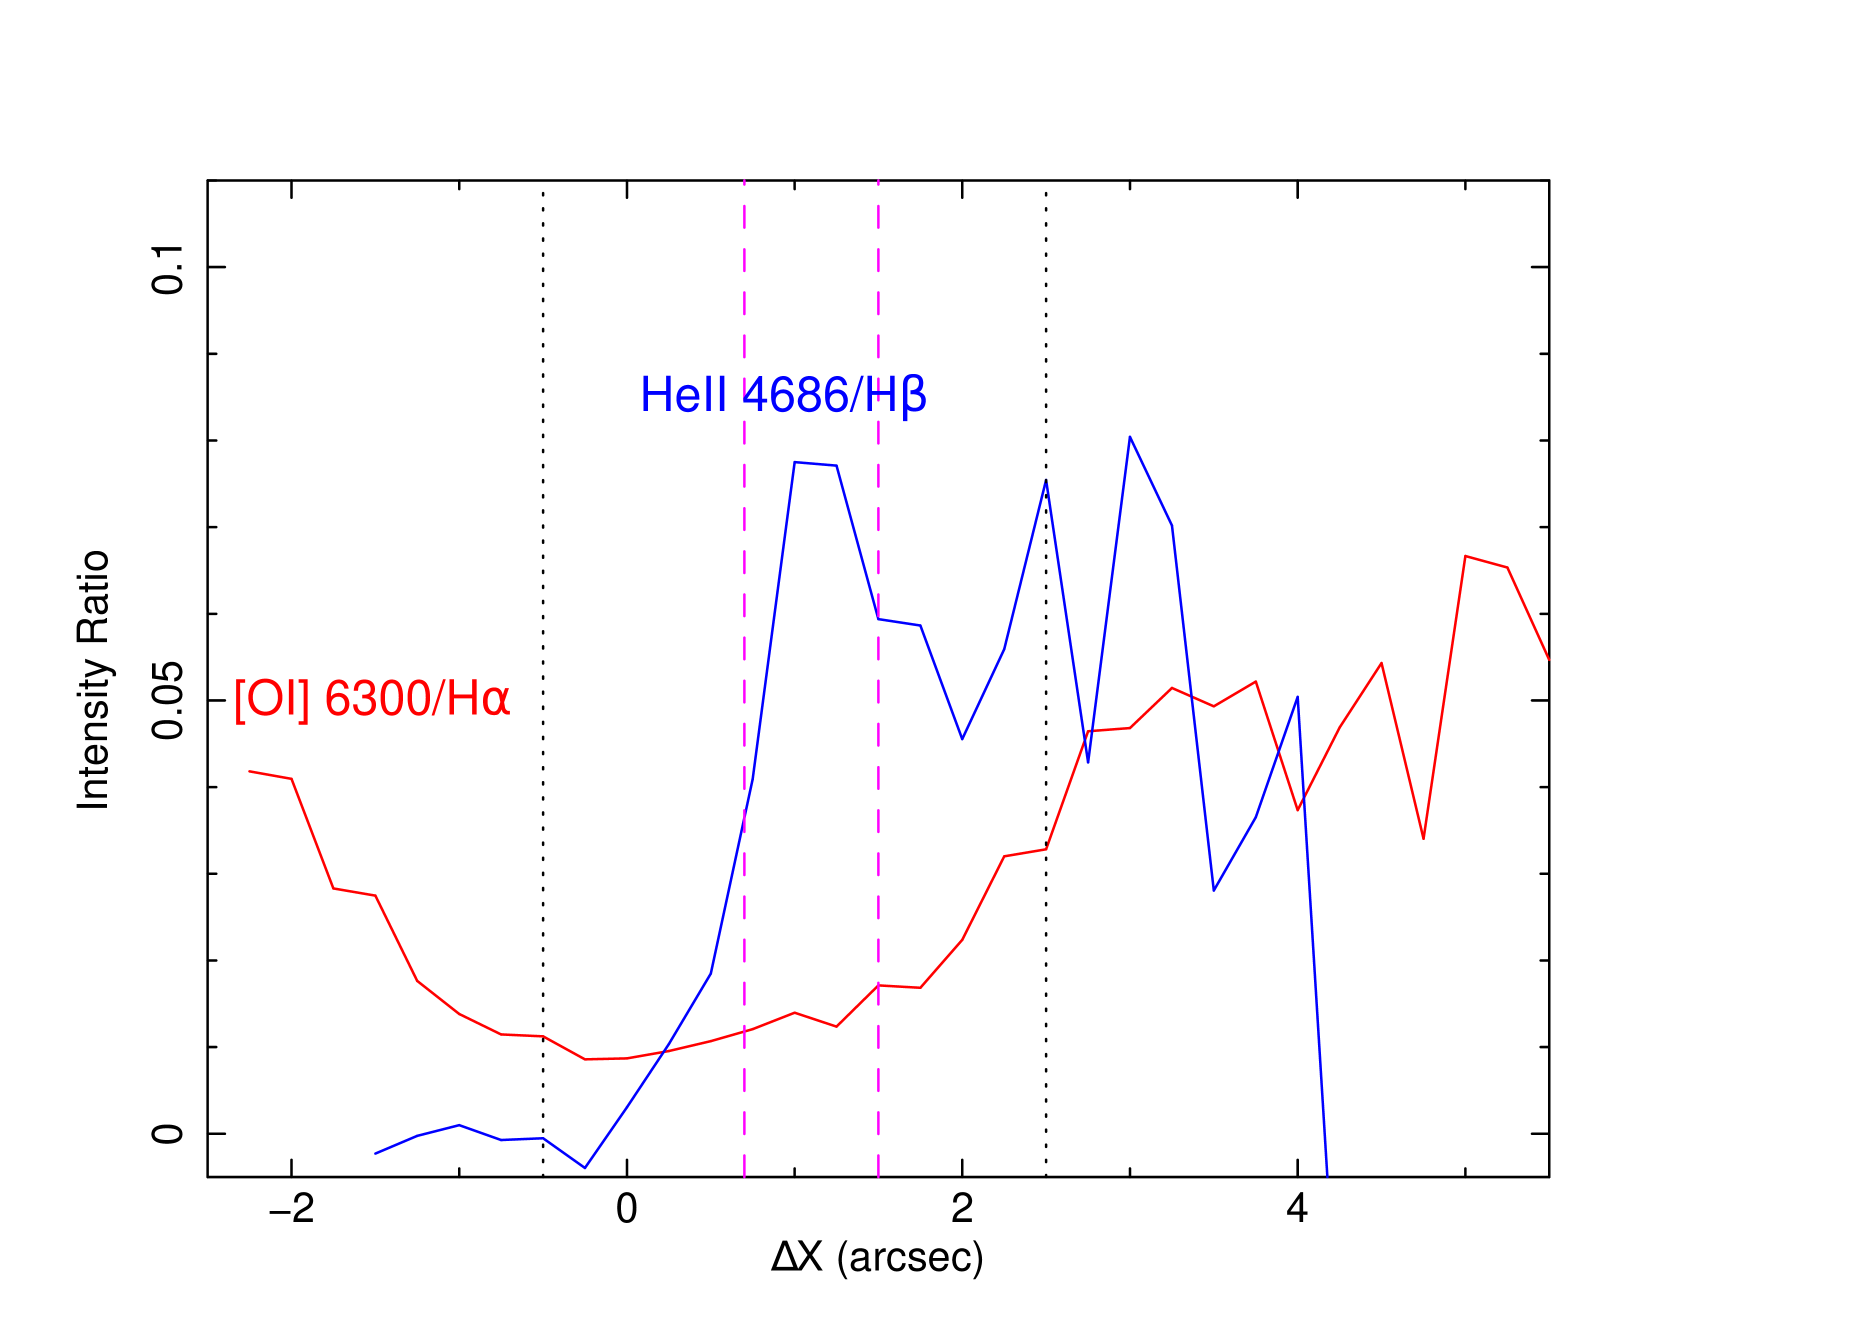
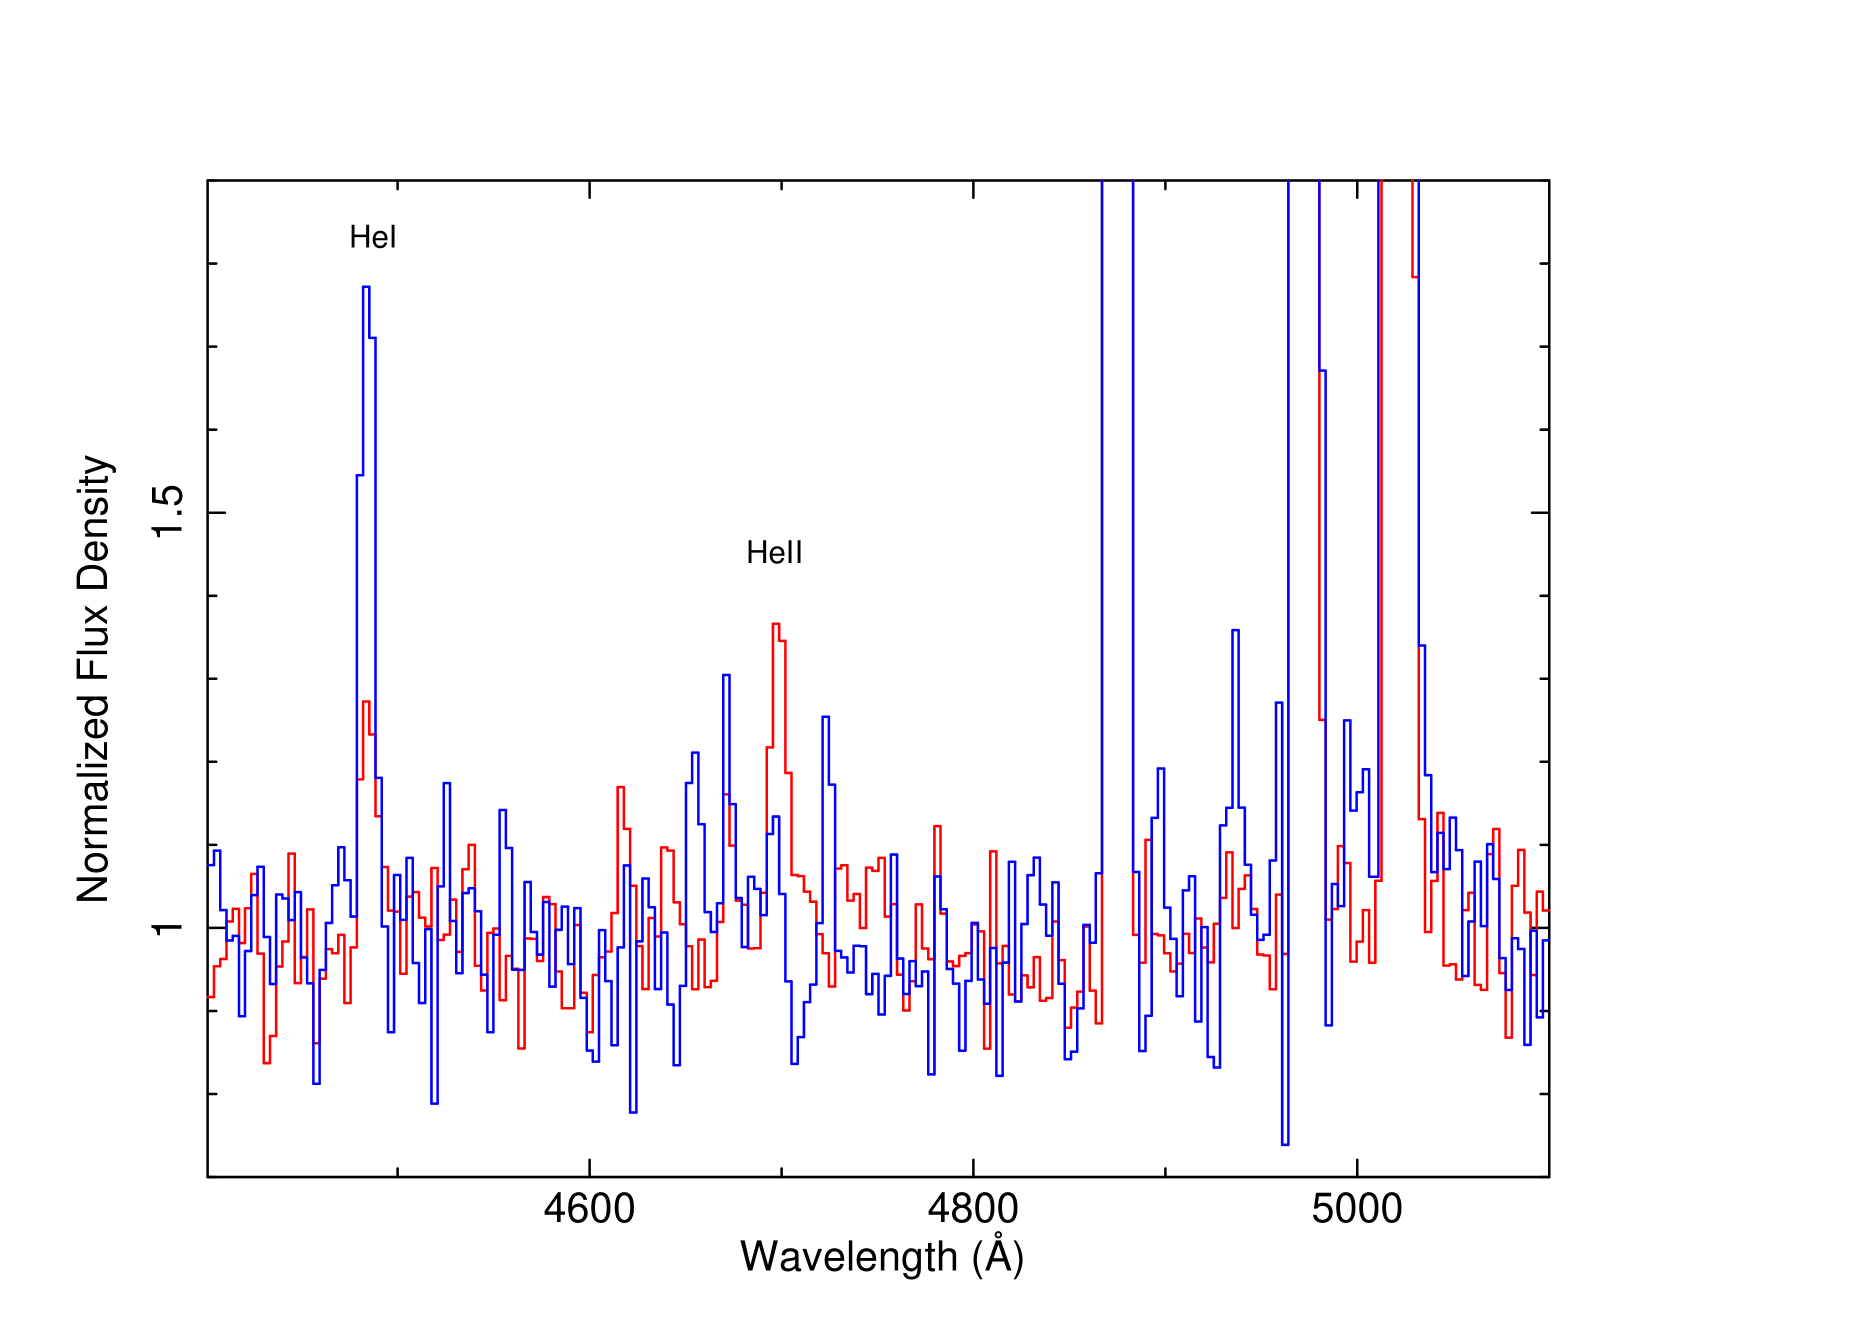
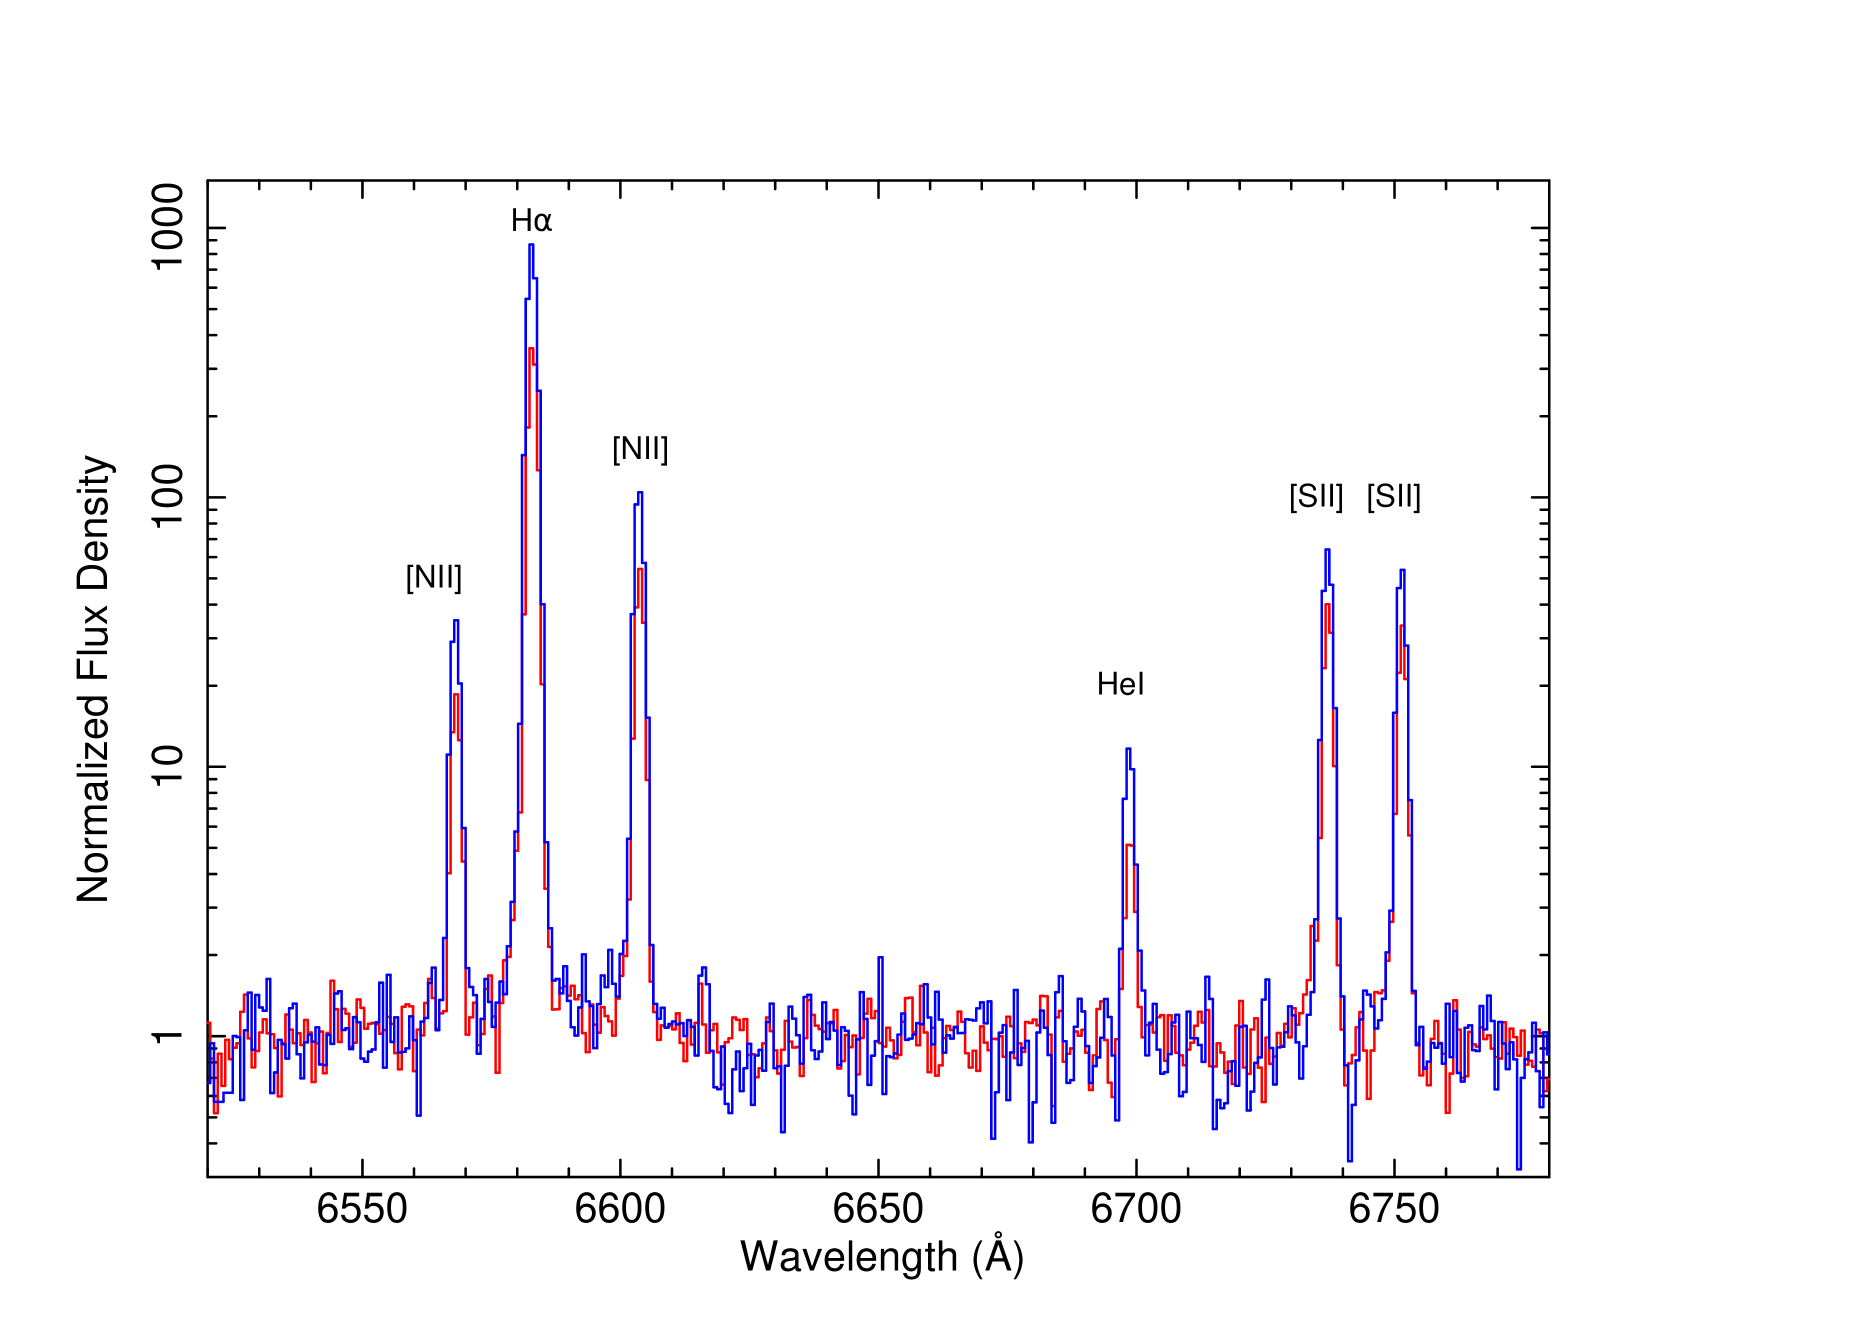
Our VLT spectra reveal for the first time He ii 4686 emission peaking around the Chandra position for X-2 (Figure 8, Table 4). This is strongly indicative of X-ray photo-ionization near the ULX, while the rest of the star-forming complex is consistent with a normal H ii region (UV photo-ionized by OB stars). The He++ emission extends 3 pc to the north of the ULX (Figures 8,9), that is 15 into the purely nebular region, but is much weaker or undetected to the south of the ULX, towards the peak Balmer emission and radio source. A comparison between the two spectra extracted around the position of the radio source and around the position of the ULX show (Figure 10, Table 4) that He i 4471 is stronger than He ii 4686 in the former, and weaker in the latter.
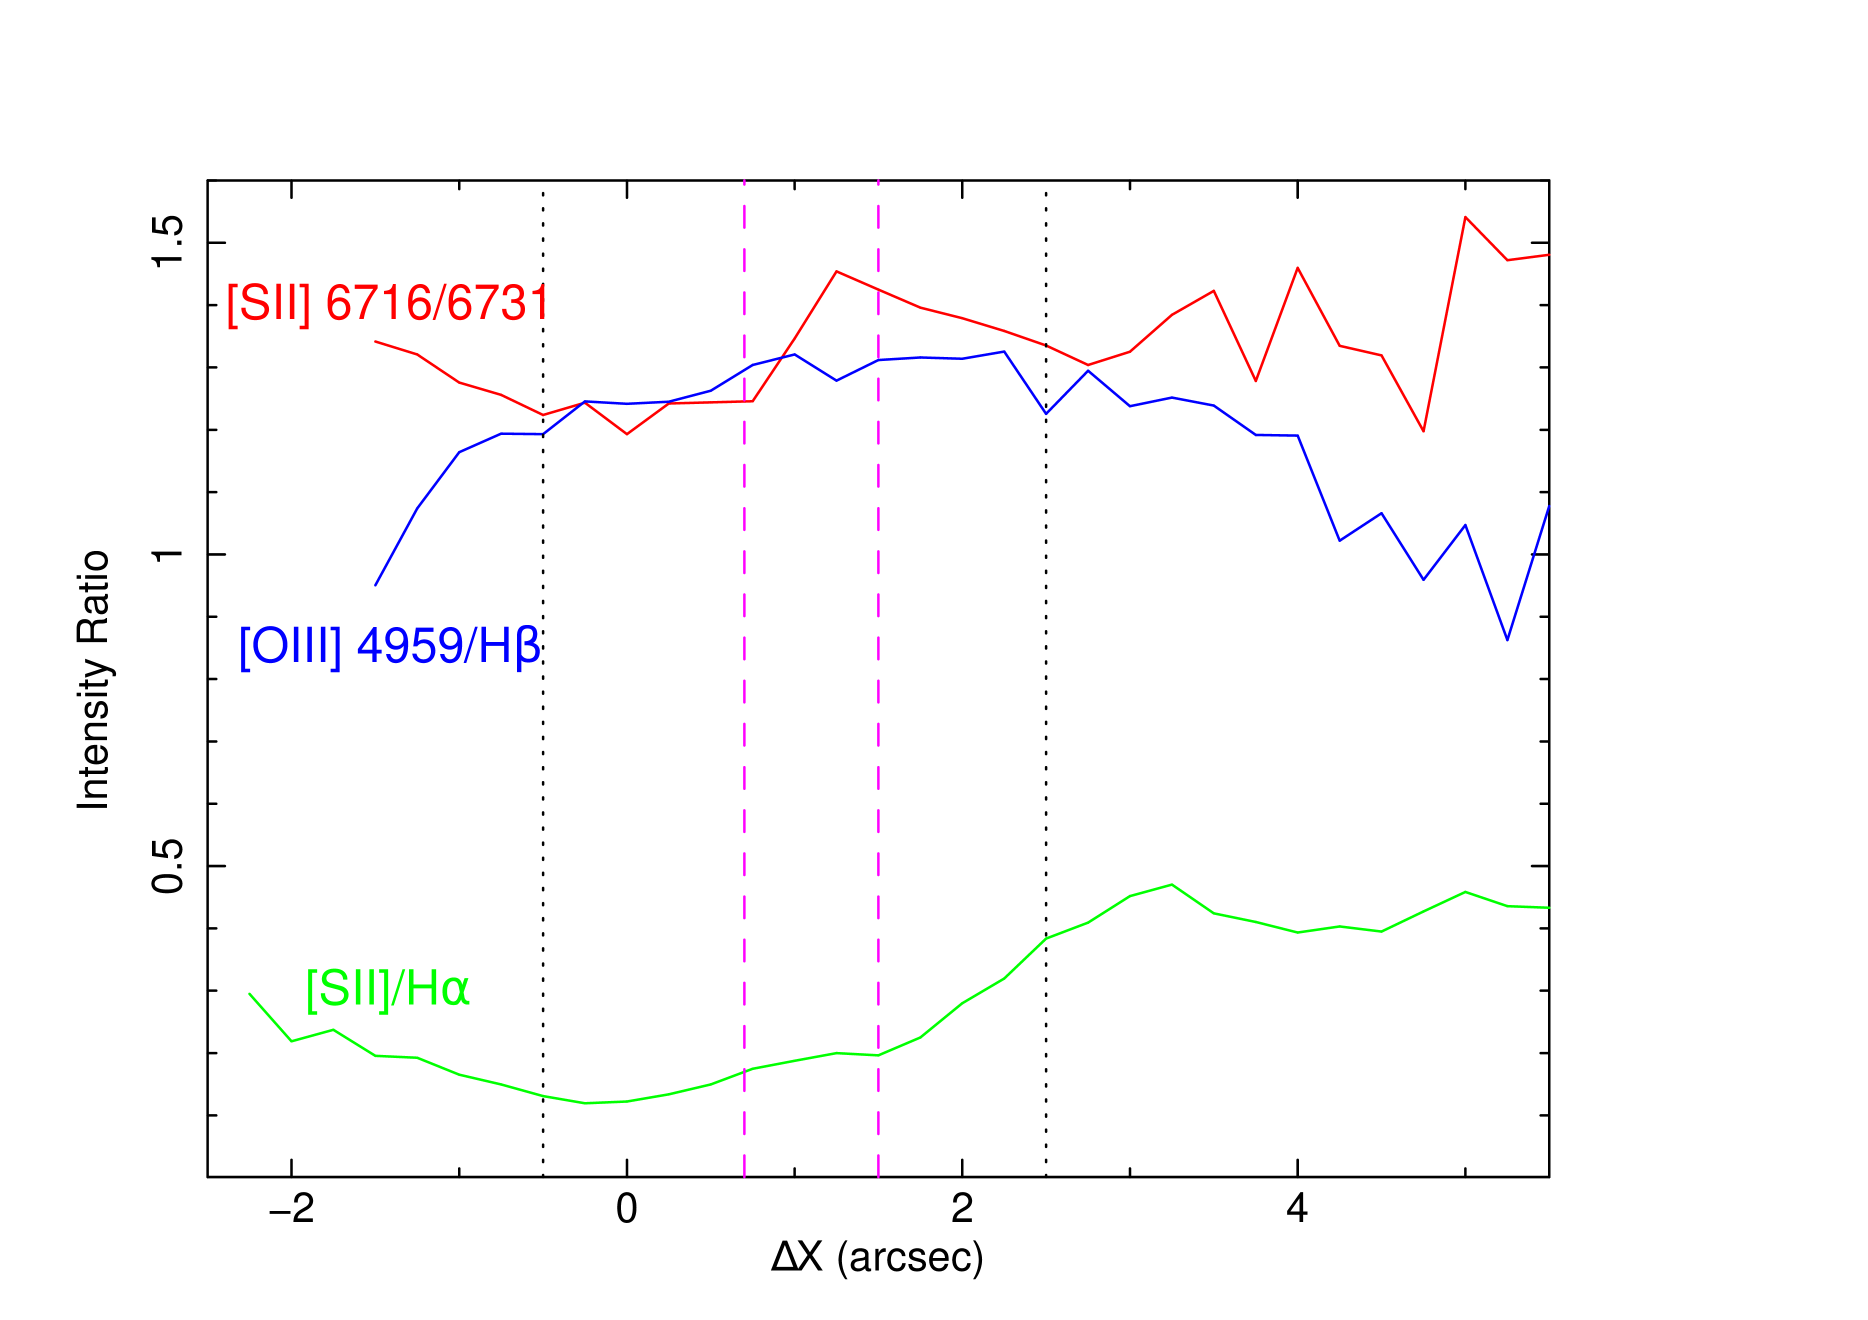
Apart from the He lines, other emission lines do not show any dramatic difference at the ULX location compared with the southern cluster (Figures 10,11). Low-ionization line ratios [S II] 6716+6731/H and [O I] 6300/H are low (Figure 9), consistent with a normal H II region, across all the nebula. Both ratios have a minimum at the position of the southern star cluster and increase away from the main source of ionization. We suggest that this is due to a larger fraction of O and S being more ionized at the denser, brighter southern end of the star-forming clump. An inverse correlation of [S II] 6716+6731/H with H intensity and electron density is seen also in the Galactic disk (e.g., Hill et al. 2014).
The density diagnostic ratio [S II] 6716/6731 near the position of the ULX (Figure 9, Table 5) is consistent with moderate or low density a few cm-3 (Osterbrock & Ferland, 2006). The lowest value (ratio 1.4) is exactly at the ULX position, a possible indication of a lower-density or higher ionization cavity around the X-ray source. A marginally significant density increase is found instead at the southern location, where [S II] 6716/6731 , consistent with cm-3. If the steep-spectrum radio source is a young SNR, the enhanced ISM density in that region may explain its high luminosity.
The temperature diagnostic ratio [O III] (4959+5007)/4363 is () in the southern part of the clump, and () around the ULX. This corresponds to an electron temperature range 10,000–13,000 K between the two regions. The low signal-to-noise ratio of the [O III] 4363 line prevents a more accurate spatially resolved study.
| Model Parameters | Values | ||
|---|---|---|---|
| 2002 May 21 | 2002 June 11 | 2020 December 02 | |
| tbabs tbabs powerlaw | |||
| ( cm-2) | |||
| C-stat/dof | (0.93) | (0.84) | (0.74) |
| ( erg cm-2 s-1)b | |||
| ( erg s-1)c | |||
a: units of photons keV-1 cm-2 s-1 at 1 keV.
b: observed fluxes in the 0.3–10 keV band
c: isotropic unabsorbed luminosities in the 0.3–10 keV band, defined as times the de-absorbed fluxes.
3.7 Dereddened luminosity of the He++ nebula
By analogy with the H emission discussed in Section 3.5, we estimate now the extinction-corrected luminosity of the He II 4686 emission, to place it in the context of other He++ ULX nebulae in the literature. The integrated flux along the slit is erg cm-2 s-1. We then need to estimate the fraction of emission lost outside the slit. As discussed before, for a point-like emission source centred in the middle of the slit, we would lose 35% of the flux. This gives us a total flux erg cm-2 s-1. However, this is a lower limit, because we know that the He++ region extends 3′′ in the north-south direction along the slit (Figure 8); thus, it is plausible that a tail of emission extends also a similar amount in the east-west direction. Using analogous arguments to those applied to H (i.e., 40 per cent loss), we find a more plausible estimate of the total He II 4686 emission as erg cm-2 s-1. As a further check, we analyzed a spectrum of a well-calibrated Wolf-Rayet star (WR9 in the Small Magellanic Cloud: Crowther & Hadfield 2006; Massey et al. 2003) taken with the FORS2 300V grism at the end of the same night (2001 September 01), and used it as a flux calibrator for the He II 4686 emission. From that, we confirm an observed flux erg cm-2 s-1.
Then, we need to correct for extinction. The H/H Balmer ratio around the ULX position is 3.54 (Table 4): this implies mag, mag, and . Hence, we obtain a dereddened He II 4686 flux erg cm-2 s-1 and a best-estimate luminosity erg s-1.
The luminosity of the He++ nebula is consistent with those seen in other ULXs with roughly similar X-ray luminosities, with a few (Table 4). In fact, it is a factor of 3 more luminous and more extended than the prototypical He++ nebula around the ULX in the Holmberg II galaxy, and several times more luminous that the X-ray photo-ionized nebula around NGC 5408 X-1.
3.8 Multiband properties of the X-1 ULX
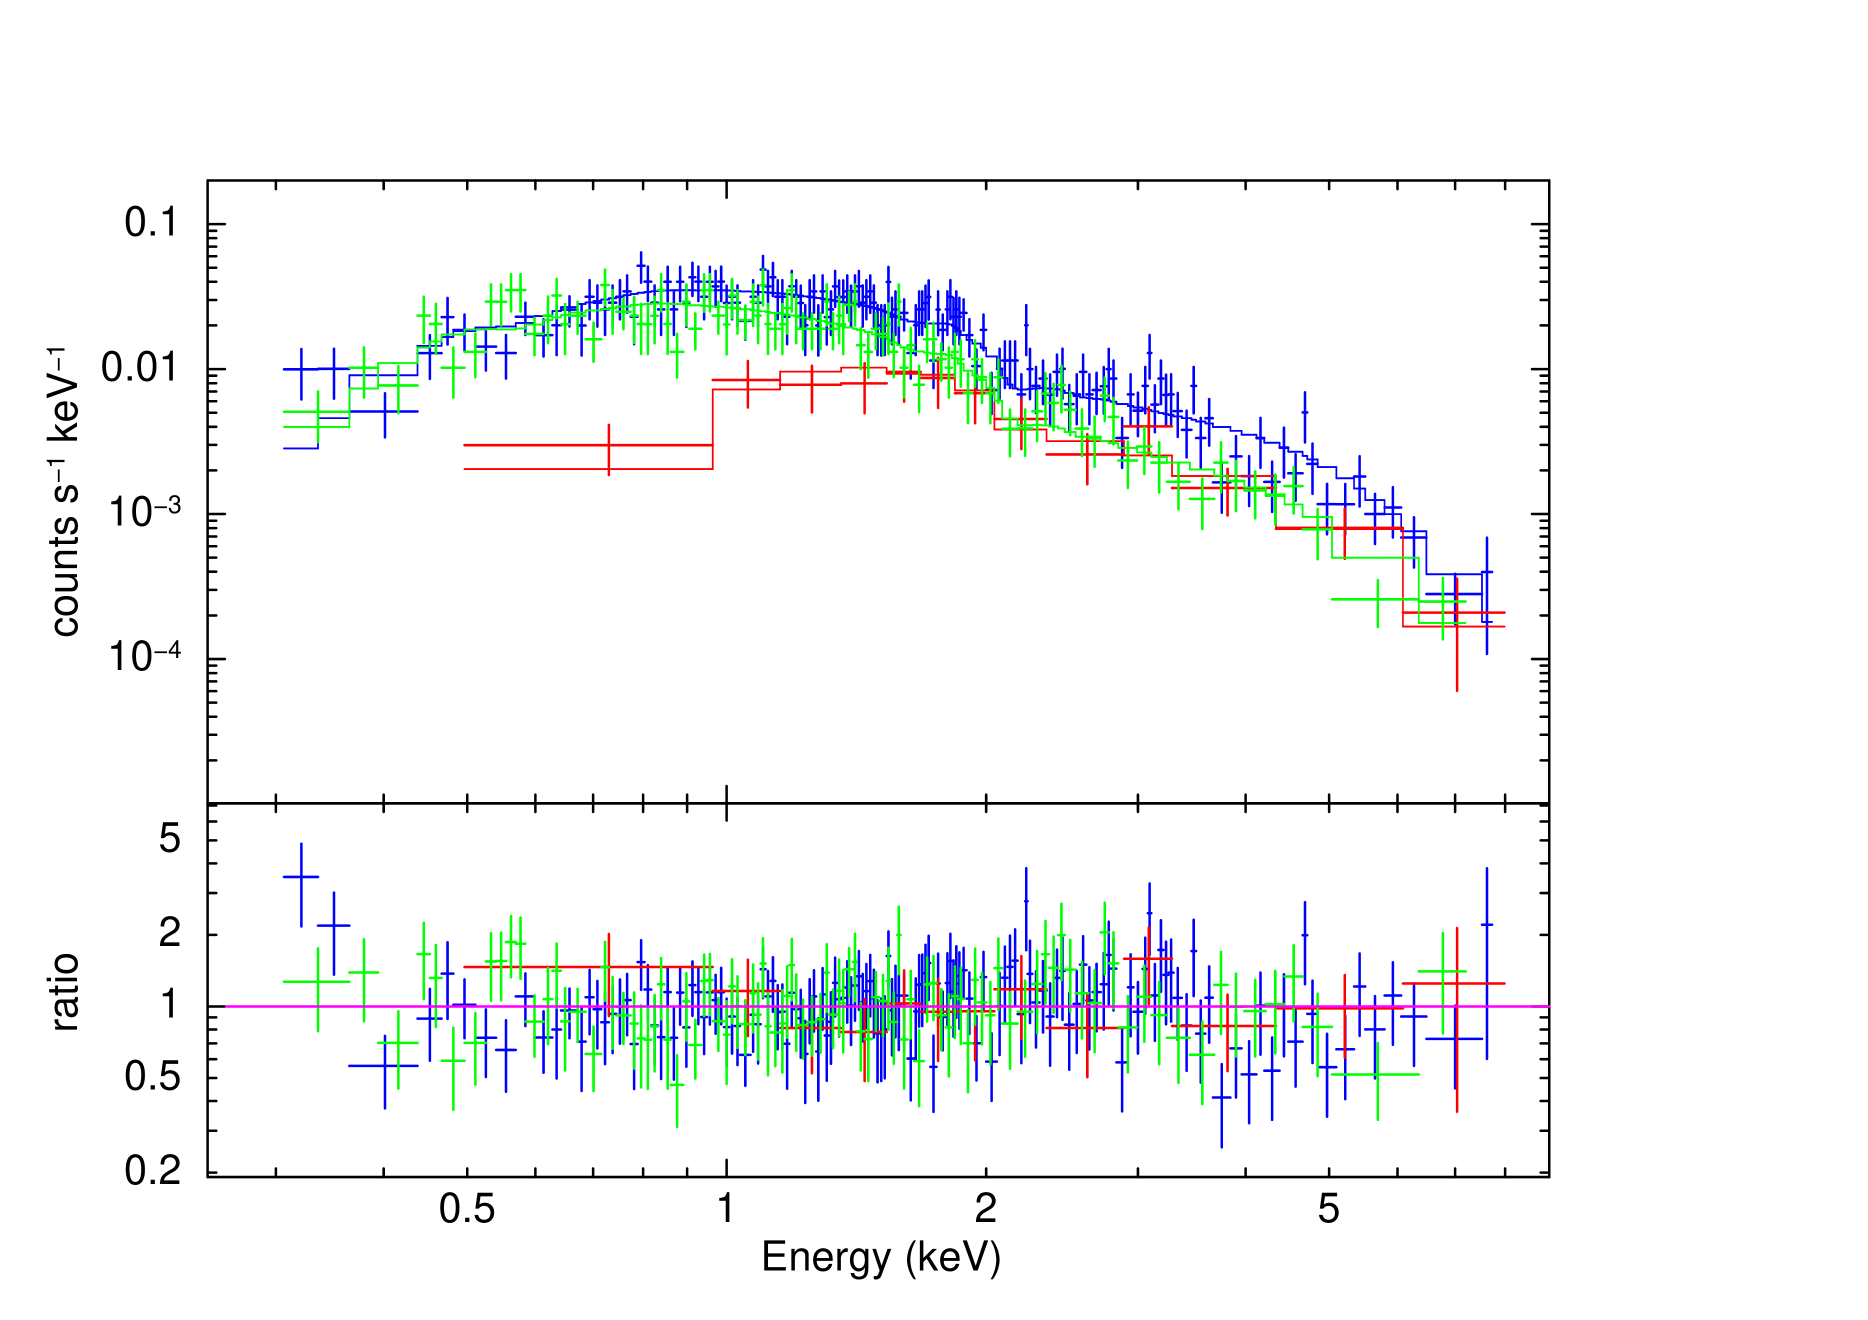
Although the main focus of our study was the X-2 ULX and its environment, we also provide an update on two other ULXs in this galaxy. X-1 (Soria et al., 2006) remained in an ultraluminous regime in the 2020 Chandra observation, at erg s-1 (Table 5), similar to the value measured in 2002 May but a a factor of two lower than in 2002 June. No significant deviation from a simple power law (Figure 12) was recorded in any of the three spectra.
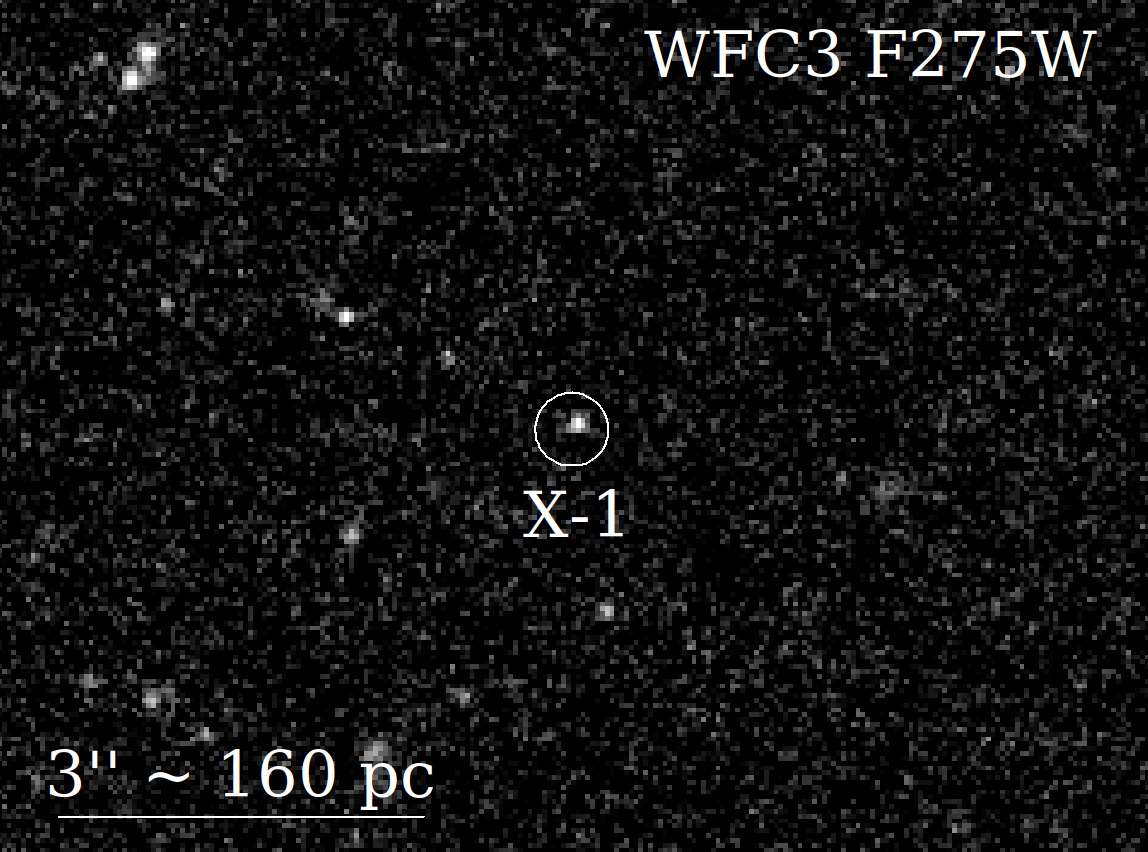
The field around X-1 is included in two deep HST/WFC3-UVIS observations from 2016 (Table 1), but not in the earlier WFPC2 observations. There is only one point-like optical source inside the Chandra error circle of the ULX position (Figure 13). We measured apparent brightness mag and mag (both values are in the Vegamag system). We then corrected the observed values for a line-of-sight Galactic extinction (taken from NED) of mag and mag, and applied a distance modulus of 30.17 mag (Section 1). We obtained absolute magnitudes mag and mag.
We used the Padova isochrones (Bressan et al., 2012) to estimate the properties of a single solar-metallicity star with such colours. It is consistent (approximately 90 per cent confidence level) with a blue supergiant of age Myr, a mass of , a temperature of about K and a radius of about . However, there is an ongoing debate (e.g., Tao et al., 2011; Gladstone et al., 2013) on whether blue optical counterparts of ULXs are their donor stars, or the emission from the irradiated outer disk (which for plausible orbital parameters has similar size and temperature as a B supergiant), or a mix of the two components. From only two near-UV bands, we cannot discriminate between the two possibilities. We cannot also definitively rule out the possibility that the point source is a background quasar. However, considering the rarity of background sources at the observed X-ray flux (1 degree-2: Luo et al. 2017; Cappelluti et al. 2009) and the high X-ray/optical flux ratio of 500–1000, we consider this scenario very unlikely. Finally, we inspected the ATCA data but found no radio emission from X-1 or its surroundings, to a 4- upper limit of 50 Jy at 5.5 GHz.
3.9 Another transient ULX found with Swift
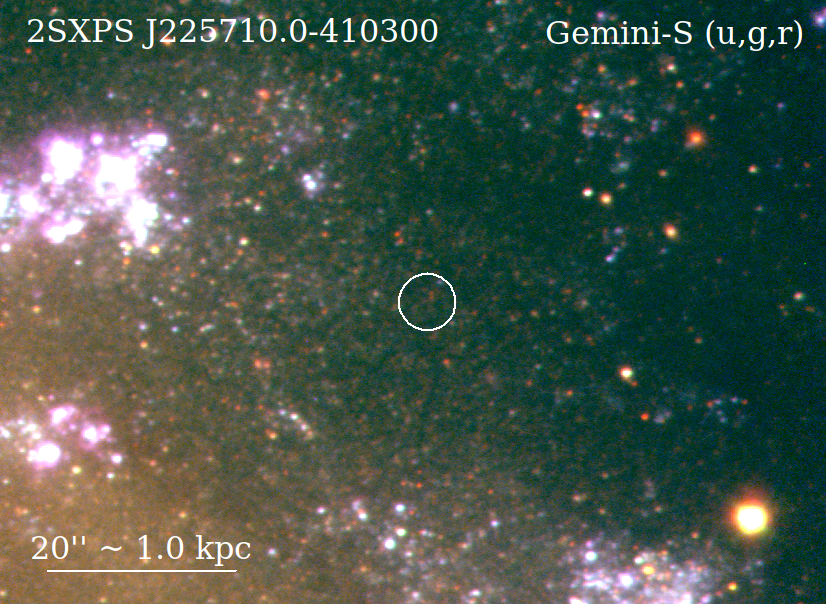
The Niels Gehrels Swift Observatory observed NGC 7424 twice, with snapshot observations: on 2008 July 23 (698-s exposure time for the X-Ray Telescope, XRT) and on 2008 November 25 (2093 s). We retrieved the data from NASA’s Heasarc public archive, and estimated count rates and fluxes of the detected sources using standard data analysis tools for Swift/XRT available online121212https://www.swift.ac.uk/user_objects/. We also compared the results of our re-analysis with those reported in the 2SXPS Catalogue of Swift X-ray Telescope Point Sources (Evans et al., 2020) and found them consistent. The most important result of the Swift/XRT data is the discovery of a transient ULX 2′ north-west of the nucleus, at R.A.(J2000) , Dec.(J2000) (90% confidence radius 3′′). The X-ray source (2SXPS J225710.0410300, Evans et al. 2020) was seen in the 2008 November 25 observation with 19 net counts in the 0.3–10 keV band, but was not detected on 2008 July 23. Given the small number of counts, it is impossible to do any spectral analysis; however, with simple assumptions of a power-law spectrum, and column density 1021 cm-2, we estimate a luminosity erg s-1 on 2008 November 25, and erg s-1 on 2008 July 23 (using the 90% confidence limits of Kraft et al. 1991). 2SXPS J225710.0410300 was not detected in any of the three Chandra observations; we estimate an upper limit to its luminosity in 2002 of erg s-1, from a stack of the ObsID 3495 and 3496 datasets. X-1 and X-2 are visible in both Swift/XRT observations, with unabsorbed luminosities (averaged over the two XRT datasets) of erg s-1 and erg s-1, respectively.
2SXPS J225710.0410300 is outside the field of view of all HST observations of NGC 7424. However, it is in the field of view of the Gemini GMOS images. There are two faint, red stars near the centre of the XRT error circle, both of them with apparent brightness mag (Figure 14). The two stars are detected as a single star (DES J225709.98410259.7) in the Dark Energy Survey Data Reslease 2 catalogue (Abbott et al., 2021). There is no radio detection in the ATCA data, down to a 4- upper limit of 30 Jy at 5.5 GHz.
3.10 eROSITA detection of X-1 but not X-2
The field of NGC 7424 was observed by the eROSITA telescope array on the Spektrum Roentgen Gamma (SRG) satellite (Predehl et al., 2021), on 2020 May 15 (MJD 58984), for a net (vignetted-corrected) exposure time of 101 s. The recently released eRASS1 catalogue (Merloni et al., 2024) and associated sky maps show only one detected source in the galaxy, catalogued as 1eRASS J225728.6410215. This source is clearly identifiable as X-1, within the position uncertainty (1 error of 25 in R.A. and 30 in Dec.). It has 154 net counts (detection likelihood of 41), corresponding to an absorbed 0.2–2.3 keV flux of erg cm-2 s-1. This is the same flux observed in the Chandra observations of 2002 May and 2020 December, in the same band. Assuming a similar power-law model as in Table 5, we conclude that X-1 was at a 0.3–10 keV luminosity of 5 erg s-1 during the eROSITA observation. By contrast, X-2 was not detected by eROSITA. From an inspection of the sky map, we estimate that its 0.2–2.3 keV flux in 2020 May must have been at least 4 times lower than observed in 2020 December, and we place a rough upper limit of 2 erg s-1 to its 0.3–10 keV luminosity.
| Regiona | W1 | W2 | W3 | W4 | Brightest X-ray source | Brightest radio source | SFRc | |||
|---|---|---|---|---|---|---|---|---|---|---|
| (mag) | (mag) | (mag) | (mag) | (J2000) | (J2000) | (Jy) | (Jy) | |||
| R-1 | 14.33 | 13.95 | 8.73 | 5.23 | – | 22:57:16.19, 41:05:17.7 | 26715 | 1458 | 0.040.01 | |
| X-2 | 15.06 | 14.85 | 9.78 | 6.75 | 22:57:24.71, 41:03:44.1 | 22:57:24.70, 41:03:45.2 | 13512 | 7011 | 0.0160.005 | |
| C | 14.74 | 14.22 | 9.27 | 6.39 | 22:57:14.14, 41:02:49.2 | 22:57:12.87, 41:02:46.9 | 788 | 648 | 0.0220.006 |
a: see Figure 15 for the identification of the three off-nuclear star-forming regions;
b: peak unabsorbed 0.5–7 keV luminosity during the two longer Chandra observations of 2002;
c: average of the SFRs derived from W3 and W4, using the relations of Cluver et al. (2017).
4 A multiband look at star formation in NGC 7424
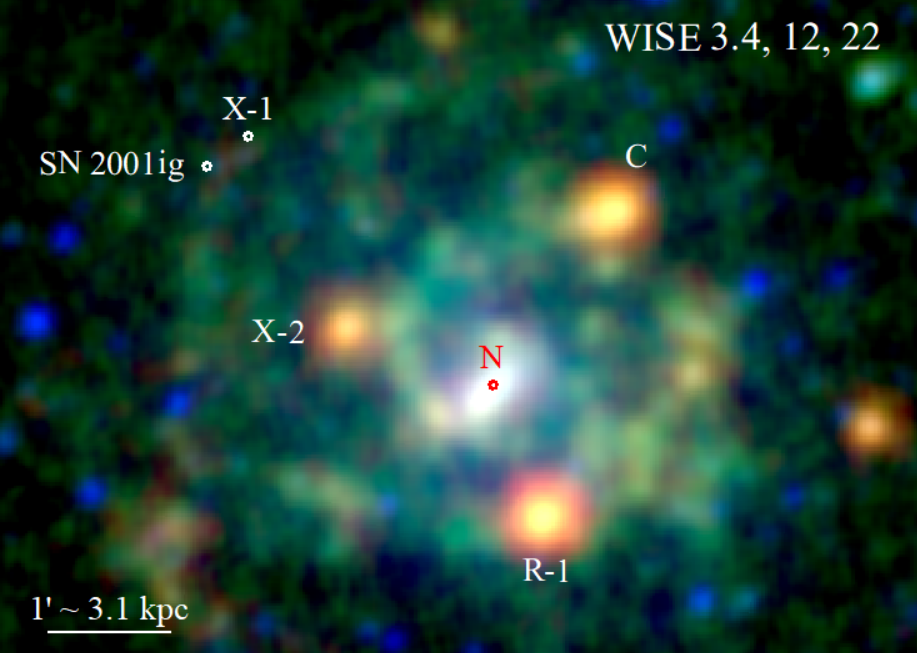
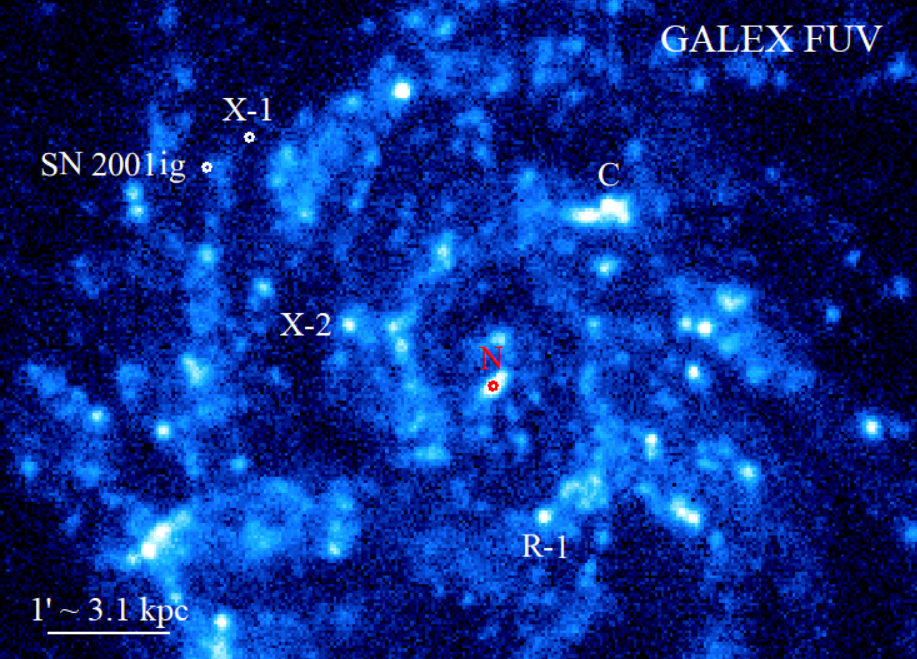
For a better understanding of the different star-forming properties of the environment around the X-1 and X-2 ULXs, we used archival data from three different bands: i) the Wide-field Infrared Survey Explorer (WISE; Wright et al. 2010) for the mid-IR; ii) a continuum-subtracted H image from the 1.5-m telescope at the Cerro Tololo Inter-American Observatory (CTIO); iii) GALEX near-UV and far-UV images.
WISE has four channels: W1 (3.4 m), W2 (4.6 m), W3 (12 m) and W4 (22 m). Three-color images of {W1,W3,W4} show three outstanding red clumps along the spiral arms (Figure 15). The data suggest that star formation is mostly concentrated in those three clumps. (Recall that in mid-IR images, redder colours indicate dusty star-forming regions, while bluer colours map the old stellar population). One of the three clumps corresponds to the star-forming complex around X-2 that we have analyzed in details in this work. Another clump corresponds to the brightest star cluster in NGC 7424 (Larsen, 2002) and the brightest radio source (R-1) identified by Soria et al. (2006). The third clump, symmetrically located about 2′ north-west of the nucleus, is resolved into a group of several young clusters and OB associations at the end of a spiral arm; it includes a fairly bright radio source, and a sub-Eddington X-ray binary, but no ULXs. For short-hand notation, we have arbitrarily labelled the clumps “X-2”, “R-1” and “C” in the three panels of Figure 15. The main properties of the three clumps are summarized in Table 6. Disk fragmentation into star-forming clumps is typically observed in high-redshift spirals (e.g., Elmegreen et al., 2007; Dekel et al., 2009; Cava et al., 2018) but is also sometimes seen in nearby galactic disks (e.g., Fisher et al., 2017; Inoue & Yoshida, 2018; Larson et al., 2020; Dickinson et al., 2022).
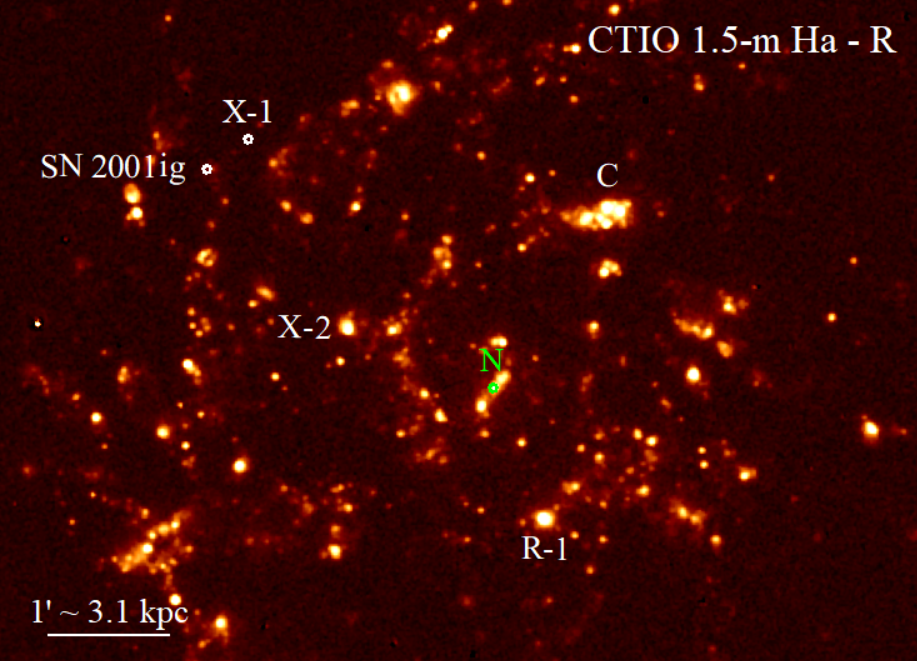
The luminosity in the WISE W3 and W4 bands is a proxy for the total IR luminosity, and, hence, for the SFR. Using the observed brightness of the three clumps from the AllWISE catalog (Cutri et al., 2021), and the scaling of Cluver et al. (2017), we find typical SFRs of a few yr-1 for each of the three clumps (Table 6). The most active one is R-1, as also suggested by the optical brightness of the associated young star cluster (Larsen, 2002). All three clumps have W2W3 colours 5 mag, which is typical of starburst galaxies (or starburst regions inside galaxies) and luminous infrared galaxies (e.g., the classic diagram of Wright et al. 2010). None of the three clumps stands out in the H and (especially) UV images, for the same reason why they do stand out in the WISE images: because dust removes photons from optical/UV bands and re-emits them in the mid-IR and far-IR. A more detailed analysis of the star-formation properties of NGC 7424 will be presented in a follow-up work currently in preparation, together with a comprehensive study of the radio sources (SNRs and H II regions) detected in our ATCA observations. Here, we only use the multiband data as an independent check for some of the luminosity estimates presented in Section 3.5.
The H image131313Downloaded from NED. was taken from the 1.5-m CTIO telescope on 2000 September 16, with an exposure time of 1800 s; the 6568/28 filter was used for the narrow-band image, and an R-band image was used for continuum subtraction. The filter has a pivot wavelength Å, a Gaussian-equivalent FWHM of 36.1 Å, and a rectangular equivalent bandpass of 31.2 Å. Given the narrow width of the filter and the flux ratios measured in our VLT spectra, we estimate that the contamination of the [N II] lines is only around 5% of the total flux in the band. We extracted the apparent flux from the region around the X-2 ULX, not including the nebular-only region to the north. We estimate an observed flux erg cm-2 s-1, which compares well with our previous estimate of erg cm-2 s-1 based on the long-slit VLT spectra.
Next, we converted the WISE W4 magnitude into a flux density for the X-2 clump, following the prescriptions of Wright et al. (2010)141414See also https://wise2.ipac.caltech.edu/docs/release/allsky/expsup/sec4_4h.html. We obtained a flux density Jy, a corresponding monochromatic flux erg cm-2 s-1, and a luminosity erg s-1. We then used the recipe of Kennicutt et al. (2009) to derive extinction-corrected H luminosities: . We approximated the Spitzer/MIPS 24-m luminosity (used to calibrate the Kennicutt relation) with the WISE 22-m luminosity, which introduces only errors of a few per cent, negligible for the purpose of this simple exercise. The result is a erg s-1 . This is in good agreement with the independent estimate of Section 3.5 based on the Balmer decrement. It converts to a reddening mag.
5 Summary and Conclusions
We took a second look at the two persistent ULXs in the face-on spiral NGC 7424, two decades after their discovery. We showed that X-1 is located in a low density region, along a spiral arm but away from currently star-forming regions. We identified a blue, point-like optical counterpart. If this optical source is the donor star (rather than the irradiated accretion disk), it is consistent with a blue supergiant with an age 28 Myr. In this case, this ULX belongs to the same ULX class as, for example, NGC 7793 P13 (Motch et al., 2014).
X-1 has been found in a bright state in all X-ray observations (three Chandra, two Swift and one SRG/eROSITA observations) over a span of 20 years, at – erg s-1, with no obvious spectral state transitions. By contrast, X-2 has more unusual properties. It is located in one of the three most active star-forming clumps in the whole galactic disk, a region with a size of 100 pc 150 pc, populated by young star clusters. Our VLT spectroscopic study shows strong line emission from a UV-photoionized H II region, as expected, but also strong nebular He II 4686 emission from the location around the X-ray source—not from the brightest and youngest part of the star-forming clump, which is located 50 pc south of the ULX.
Nebular He II 4686 emission (i.e., not from Wolf-Rayet winds) is a hallmark of photo-ionization by soft X-ray photons, and has been found around several ULXs. For this He++ region, we estimated a luminosity erg s-1. This makes the NGC 7424 X-2 nebula about 3 times more luminous than the well-known He++ nebula around Holmberg II X-1. For gas at a temperature of K, ionized by soft X-ray photons, an approximate conversion between the long-term-average (over the recombination timescale of a few 1000 yr) ionizing photon rate (in the 54–300 eV band) and the He II 4686 luminosity is erg s-1 (cloudy code: Ferland et al. 1998; see also Osterbrock & Ferland 2006; Kaaret et al. 2004; Pakull & Motch 1989; Pakull & Angebault 1986). For X-2 in the high state (2002 June and 2020 December), different X-ray fitting models predict a range of ionizing photon fluxes, between 4–20 s-1, corresponding to –20 erg s-1. The luminosity inferred from the VLT spectra (with various assumptions on slit losses, spatial extent of the nebula, dust extinction) is erg s-1, in the middle of the predicted range.
A second point of interest of NGC 7424 X-2 is that the system has a younger age than most other ULXs. From the Balmer emission lines, we estimate an age of Myr for the stellar population around the ULX. The stellar progenitor of the ULX must have collapsed after less than this age. This implies a progenitor mass (from the Padova isochrones at solar metallicity, Bressan et al. 2012). It does not, however, imply that the compact object is a black hole. The example of a neutron star found in the young Galactic cluster Westerlund 1 (age 5 Myr) suggests that binary evolution can lead to a supernova and neutron star formation even from progenitors above 40 (Schneider et al., 2021; Belczynski & Taam, 2008). With such a young age, the donor star of X-2 cannot be a blue supergiant (unlike the X-1 donor), and is instead either a main-sequence O star or a Wolf-Rayet.
A third interesting feature of X-2 is that it was seen once in a lower-luminosity state ( erg s-1), with a hard power-law-like spectrum in Chandra’s 0.5–7 keV band. A simple assumption that this property corresponds to the bright end of the hard state of an accreting black hole () would imply a black hole mass 50 . On the other hand, super-critical accretion onto strongly magnetized (young) neutron stars also produces a hard spectrum, from fan-beam emission in the accretion column. The softening of the source with brightness in the subsequent two Chandra observations may be explained by a higher contribution from the inner disk and a denser disk outflow along our line of sight, as the accretion rate increased (Gúrpide et al., 2021b, a).
A fourth interesting property of X-2, or at least of the environment around X-2, is the presence of a strong (2.5 times the luminosity of Cas A at 5.5 GHz), unresolved radio source at the southern end of the star-forming clump. Based on the observed Balmer emission, we argued that free-free emission from gas in the main star cluster is expected to contribute a non-negligible component, but cannot be the dominant process. The steep spectrum suggests a dominant optically-thin synchrotron component. It could be a young (age 1000 yr) SNR, completely unrelated to the ULX; however, the massive star cluster is too young (age 3 Myr) to have a substantial SN rate. Or it could be the radio hot spot/radio lobe of a jet powered by the ULX. This would be analogous to the jets in NGC 7793 S26 (Soria et al., 2010) and in NGC 6946 X-1 (T. Beuchert et al., in prep.), where the peak radio synchrotron emission is displaced from the compact object. The non-detection of a symmetrically placed radio lobe north of NGC 7424 X-2 could be explained by the much lower ISM density in that region.
If the non-thermal radio source is caused by shocks from a ULX jet, we expect the presence of broad optical emission lines from shocked-ionized gas. The H luminosity expected from the shocked gas, for typical ULX bubble parameters, is – (Allen et al., 2008). If we assume erg s-1, the shock-ionized component of the Balmer emission is only 10% of the Balmer luminosity from the star cluster (Section 3.5). This weaker component is consistent with the broader wings marginally detected in the strongest lines (Section 3.4). An objection to the ULX jet scenario is that two strong radio sources are also associated with the other two main starburst clumps in NGC 7424, although they do not contain currently active ULXs. In summary, we do not have enough information to rule out any of those scenarios for the origin of this intriguing radio source near X-2. We are planning deeper ATCA observations in 2024 to put a stronger constraint to the spatial extent and spectral index, and to look for possible northern radio lobe.
Acknowledgements
RS acknowledges grant number 12073029 from the National Natural Science Foundation of China (NSFC). RS also acknowledges support and hospitality from the Observatoire de Strasbourg during part of this work. TDR is supported by a IAF-INAF Research Fellowship. This research benefitted from discussions at the International Space Science Institute in Bern, through the team led by L. Oskinova: Multiwavelength View on Massive Stars in the Era of Multimessanger Astronomy. We thank the anonymous referee for their suggestions, which have improved the original manuscript. We thank Stuart Ryder, who provided us with the calibrated set of stacked, flat-fielded Gemini images from his program GS-2004B-Q-6. We thank Tobias Beuchert, Hua Feng, Andrés Gurpide, Matt Middleton, Lida Oskinova, Ciro Pinto, Sabela Reyero Serantes, Beverly Smith, Alexandr Vinokurov and Dom Walton for discussions about SNRs and ionized bubbles, and Alister W. Graham for discussions on the use of WISE data and of spiral galaxy properties.
This research has made use of data obtained from the Chandra Data Archive and the Chandra Source Catalog, and software provided by the Chandra X-ray Center (CXC) in the ciao application package. Furthermore, we used data from eROSITA, the soft X-ray instrument aboard SRG, a joint Russian-German science mission supported by the Russian Space Agency (Roskosmos), in the interests of the Russian Academy of Sciences represented by its Space Research Institute (IKI), and the Deutsches Zentrum für Luft- und Raumfahrt (DLR). The SRG spacecraft was built by Lavochkin Association (NPOL) and its subcontractors, and is operated by NPOL with support from the Max Planck Institute for Extraterrestrial Physics (MPE). The development and construction of the eROSITA X-ray instrument was led by MPE, with contributions from the Dr. Karl Remeis Observatory Bamberg & ECAP (FAU Erlangen-Nuernberg), the University of Hamburg Observatory, the Leibniz Institute for Astrophysics Potsdam (AIP), and the Institute for Astronomy and Astrophysics of the University of Tübingen, with the support of DLR and the Max Planck Society. The Argelander Institute for Astronomy of the University of Bonn and the Ludwig Maximilians Universität Munich also participated in the science preparation for eROSITA. Moreover, we used observations made with the NASA/ESA Hubble Space Telescope, and obtained from the Hubble Legacy Archive, which is a collaboration between the Space Telescope Science Institute (STScI/NASA), the Space Telescope European Coordinating Facility (ST-ECF/ESA) and the Canadian Astronomy Data Centre (CADC/NRC/CSA). This work is also based on observations obtained at the international Gemini Observatory, a program of NSF’s NOIRLab, which is managed by the Association of Universities for Research in Astronomy (AURA) under a cooperative agreement with the National Science Foundation on behalf of the Gemini Observatory partnership: the National Science Foundation (United States), National Research Council (Canada), Agencia Nacional de Investigación y Desarrollo (Chile), Ministerio de Ciencia, Tecnología e Innovación (Argentina), Ministério da Ciência, Tecnologia, Inovações e Comunicações (Brazil), and Korea Astronomy and Space Science Institute (Republic of Korea). The Australia Telescope Compact Array is part of the Australia Telescope National Facility (https://ror.org/05qajvd42) which is funded by the Australian Government for operation as a National Facility managed by CSIRO. We acknowledge the Gomeroi people as the Traditional Owners of the ATCA observatory site, the Taurini as the Traditional Owners of the INAF-OATo site, and the Triboces as the Traditional Owners of the Observatoire de Strasbourg (Argentorate) site. Moreover, we used data products from the Wide-field Infrared Survey Explorer, which is a joint project of the University of California, Los Angeles, and the Jet Propulsion Laboratory/California Institute of Technology, funded by the National Aeronautics and Space Administration. We used iraf software for part of the optical analysis: iraf is distributed by the National Optical Astronomy Observatory, which is operated by the Association of Universities for Research in Astronomy (AURA) under a cooperative agreement with the National Science Foundation.
Data Availability
The Chandra, Swift, HST, Gemini, WISE, VLT and ATCA datasets used for this work are all available for download from their respective public archives.
References
- Abbott et al. (2021) Abbott T. M. C., et al., 2021, ApJS, 255, 20
- Abolmasov et al. (2008) Abolmasov P., Fabrika S., Sholukhova O., Kotani T., 2008, arXiv e-prints, p. arXiv:0809.0409
- Allen et al. (2008) Allen M. G., Groves B. A., Dopita M. A., Sutherland R. S., Kewley L. J., 2008, ApJS, 178, 20
- Arnaud (1996) Arnaud K. A., 1996, in Jacoby G. H., Barnes J., eds, Astronomical Society of the Pacific Conference Series Vol. 101, Astronomical Data Analysis Software and Systems V. p. 17
- Barra et al. (2023) Barra F., Pinto C., Middleton M., Di Salvo T., Walton D. J., Gúrpide A., Roberts T. P., 2023, arXiv e-prints, p. arXiv:2311.16243
- Belczynski & Taam (2008) Belczynski K., Taam R. E., 2008, ApJ, 685, 400
- Berezhko & Völk (2004) Berezhko E. G., Völk H. J., 2004, A&A, 427, 525
- Bernadich et al. (2022) Bernadich M. C. i., Schwope A. D., Kovlakas K., Zezas A., Traulsen I., 2022, A&A, 659, A188
- Blackburn (1995) Blackburn J. K., 1995, in Shaw R. A., Payne H. E., Hayes J. J. E., eds, Astronomical Society of the Pacific Conference Series Vol. 77, Astronomical Data Analysis Software and Systems IV. p. 367
- Bressan et al. (2012) Bressan A., Marigo P., Girardi L., Salasnich B., Dal Cero C., Rubele S., Nanni A., 2012, MNRAS, 427, 127
- Briggs (1995) Briggs D. S., 1995, PhD thesis, New Mexico Institute of Mining and Technology
- CASA Team et al. (2022) CASA Team et al., 2022, PASP, 134, 114501
- Caballero-García et al. (2013) Caballero-García M. D., Belloni T. M., Wolter A., 2013, MNRAS, 435, 2665
- Caplan & Deharveng (1986) Caplan J., Deharveng L., 1986, A&A, 155, 297
- Cappelluti et al. (2009) Cappelluti N., et al., 2009, A&A, 497, 635
- Cash (1979) Cash W., 1979, ApJ, 228, 939
- Cava et al. (2018) Cava A., Schaerer D., Richard J., Pérez-González P. G., Dessauges-Zavadsky M., Mayer L., Tamburello V., 2018, Nature Astronomy, 2, 76
- Chomiuk & Wilcots (2009) Chomiuk L., Wilcots E. M., 2009, ApJ, 703, 370
- Cluver et al. (2017) Cluver M. E., Jarrett T. H., Dale D. A., Smith J. D. T., August T., Brown M. J. I., 2017, ApJ, 850, 68
- Crowther & Hadfield (2006) Crowther P. A., Hadfield L. J., 2006, A&A, 449, 711
- Cseh et al. (2012) Cseh D., et al., 2012, ApJ, 749, 17
- Cutri et al. (2021) Cutri R. M., et al., 2021, VizieR Online Data Catalog, p. II/328
- Dekel et al. (2009) Dekel A., Sari R., Ceverino D., 2009, ApJ, 703, 785
- Dickinson et al. (2022) Dickinson H., et al., 2022, MNRAS, 517, 5882
- Dotan & Shaviv (2011) Dotan C., Shaviv N. J., 2011, MNRAS, 413, 1623
- Douna et al. (2018) Douna V. M., Pellizza L. J., Laurent P., Mirabel I. F., 2018, MNRAS, 474, 3488
- Earnshaw et al. (2019) Earnshaw H. P., et al., 2019, ApJ, 881, 38
- Elmegreen et al. (2007) Elmegreen D. M., Elmegreen B. G., Ravindranath S., Coe D. A., 2007, ApJ, 658, 763
- Evans et al. (2020) Evans P. A., et al., 2020, ApJS, 247, 54
- Feng & Soria (2011) Feng H., Soria R., 2011, New Astron. Rev., 55, 166
- Ferland et al. (1998) Ferland G. J., Korista K. T., Verner D. A., Ferguson J. W., Kingdon J. B., Verner E. M., 1998, PASP, 110, 761
- Fisher et al. (2017) Fisher D. B., et al., 2017, MNRAS, 464, 491
- Foight et al. (2016) Foight D. R., Güver T., Özel F., Slane P. O., 2016, ApJ, 826, 66
- Fragos et al. (2013) Fragos T., Lehmer B. D., Naoz S., Zezas A., Basu-Zych A., 2013, ApJ, 776, L31
- Franeck et al. (2022) Franeck A., Wünsch R., Martínez-González S., Orlitová I., Boorman P., Svoboda J., Szécsi D., Douna V., 2022, ApJ, 927, 212
- Freudling et al. (2013) Freudling W., Romaniello M., Bramich D. M., Ballester P., Forchi V., García-Dabló C. E., Moehler S., Neeser M. J., 2013, A&A, 559, A96
- Fruscione et al. (2006) Fruscione A., et al., 2006, in Silva D. R., Doxsey R. E., eds, Society of Photo-Optical Instrumentation Engineers (SPIE) Conference Series Vol. 6270, Society of Photo-Optical Instrumentation Engineers (SPIE) Conference Series. p. 62701V, doi:10.1117/12.671760
- Gaia Collaboration et al. (2023) Gaia Collaboration et al., 2023, A&A, 674, A1
- Gladstone et al. (2013) Gladstone J. C., Copperwheat C., Heinke C. O., Roberts T. P., Cartwright T. F., Levan A. J., Goad M. R., 2013, ApJS, 206, 14
- Grisé et al. (2010) Grisé F., Kaaret P., Feng H., Kajava J. J. E., Farrell S. A., 2010, ApJ, 724, L148
- Grisé et al. (2013) Grisé F., Kaaret P., Corbel S., Cseh D., Feng H., 2013, MNRAS, 433, 1023
- Gúrpide et al. (2021a) Gúrpide A., Godet O., Koliopanos F., Webb N., Olive J. F., 2021a, A&A, 649, A104
- Gúrpide et al. (2021b) Gúrpide A., Godet O., Vasilopoulos G., Webb N. A., Olive J. F., 2021b, A&A, 654, A10
- Gúrpide et al. (2022) Gúrpide A., Parra M., Godet O., Contini T., Olive J. F., 2022, A&A, 666, A100
- Güver & Özel (2009) Güver T., Özel F., 2009, MNRAS, 400, 2050
- Hill et al. (2014) Hill A. S., Benjamin R. A., Haffner L. M., Gostisha M. C., Barger K. A., 2014, ApJ, 787, 106
- Holtzman et al. (1995) Holtzman J. A., Burrows C. J., Casertano S., Hester J. J., Trauger J. T., Watson A. M., Worthey G., 1995, PASP, 107, 1065
- Iglesias-Páramo et al. (2006) Iglesias-Páramo J., et al., 2006, ApJS, 164, 38
- Inoue & Yoshida (2018) Inoue S., Yoshida N., 2018, MNRAS, 474, 3466
- Jeon et al. (2014) Jeon M., Pawlik A. H., Bromm V., Milosavljević M., 2014, MNRAS, 440, 3778
- Jiang et al. (2014) Jiang Y.-F., Stone J. M., Davis S. W., 2014, ApJ, 796, 106
- Kaaret & Corbel (2009) Kaaret P., Corbel S., 2009, ApJ, 697, 950
- Kaaret et al. (2004) Kaaret P., Ward M. J., Zezas A., 2004, MNRAS, 351, L83
- Kaaret et al. (2010) Kaaret P., Feng H., Wong D. S., Tao L., 2010, ApJ, 714, L167
- Kaaret et al. (2017) Kaaret P., Feng H., Roberts T. P., 2017, ARA&A, 55, 303
- Kawashima et al. (2012) Kawashima T., Ohsuga K., Mineshige S., Yoshida T., Heinzeller D., Matsumoto R., 2012, ApJ, 752, 18
- Kehrig et al. (2015) Kehrig C., Vílchez J. M., Pérez-Montero E., Iglesias-Páramo J., Brinchmann J., Kunth D., Durret F., Bayo F. M., 2015, ApJ, 801, L28
- Kehrig et al. (2021) Kehrig C., Guerrero M. A., Vílchez J. M., Ramos-Larios G., 2021, ApJ, 908, L54
- Kennicutt et al. (2009) Kennicutt Robert C. J., et al., 2009, ApJ, 703, 1672
- King & Pounds (2003) King A. R., Pounds K. A., 2003, MNRAS, 345, 657
- King & Pounds (2015) King A., Pounds K., 2015, ARA&A, 53, 115
- King et al. (2023) King A., Lasota J.-P., Middleton M., 2023, New Astron. Rev., 96, 101672
- Kitaki et al. (2021) Kitaki T., Mineshige S., Ohsuga K., Kawashima T., 2021, PASJ, 73, 450
- Knevitt et al. (2014) Knevitt G., Wynn G. A., Power C., Bolton J. S., 2014, MNRAS, 445, 2034
- Kosec et al. (2018) Kosec P., Pinto C., Fabian A. C., Walton D. J., 2018, MNRAS, 473, 5680
- Kraft et al. (1991) Kraft R. P., Burrows D. N., Nousek J. A., 1991, ApJ, 374, 344
- Kubota et al. (1998) Kubota A., Tanaka Y., Makishima K., Ueda Y., Dotani T., Inoue H., Yamaoka K., 1998, PASJ, 50, 667
- Kuntz et al. (2016) Kuntz K. D., Long K. S., Kilgard R. E., 2016, ApJ, 827, 46
- Larsen (2002) Larsen S. S., 2002, AJ, 124, 1393
- Larson et al. (2020) Larson K. L., et al., 2020, ApJ, 888, 92
- Leahy et al. (2022) Leahy D. A., Merrick F., Filipović M., 2022, Universe, 8, 653
- Lehmann et al. (2005) Lehmann I., et al., 2005, A&A, 431, 847
- Leitherer et al. (1999) Leitherer C., et al., 1999, ApJS, 123, 3
- Leitherer et al. (2014) Leitherer C., Ekström S., Meynet G., Schaerer D., Agienko K. B., Levesque E. M., 2014, ApJS, 212, 14
- Lemons et al. (2015) Lemons S. M., Reines A. E., Plotkin R. M., Gallo E., Greene J. E., 2015, ApJ, 805, 12
- Luo et al. (2017) Luo B., et al., 2017, ApJS, 228, 2
- Madau & Fragos (2017) Madau P., Fragos T., 2017, ApJ, 840, 39
- Massey et al. (2003) Massey P., Olsen K. A. G., Parker J. W., 2003, PASP, 115, 1265
- Merloni et al. (2024) Merloni A., et al., 2024, A&A, 682, A34
- Middleton et al. (2015a) Middleton M. J., Heil L., Pintore F., Walton D. J., Roberts T. P., 2015a, MNRAS, 447, 3243
- Middleton et al. (2015b) Middleton M. J., Walton D. J., Fabian A., Roberts T. P., Heil L., Pinto C., Anderson G., Sutton A., 2015b, MNRAS, 454, 3134
- Mirabel et al. (2011) Mirabel I. F., Dijkstra M., Laurent P., Loeb A., Pritchard J. R., 2011, A&A, 528, A149
- Moon et al. (2011) Moon D.-S., Harrison F. A., Cenko S. B., Shariff J. A., 2011, ApJ, 731, L32
- Motch et al. (2014) Motch C., Pakull M. W., Soria R., Grisé F., Pietrzyński G., 2014, Nature, 514, 198
- Narayan et al. (2017) Narayan R., Sa̧dowski A., Soria R., 2017, MNRAS, 469, 2997
- Nasa High Energy Astrophysics Science Archive Research Center (Heasarc) (2014) Nasa High Energy Astrophysics Science Archive Research Center (Heasarc) 2014, HEAsoft: Unified Release of FTOOLS and XANADU, Astrophysics Source Code Library, record ascl:1408.004 (ascl:1408.004)
- Ogawa et al. (2017) Ogawa T., Mineshige S., Kawashima T., Ohsuga K., Hashizume K., 2017, PASJ, 69, 33
- Ohsuga & Mineshige (2011) Ohsuga K., Mineshige S., 2011, ApJ, 736, 2
- Oskinova & Schaerer (2022) Oskinova L. M., Schaerer D., 2022, A&A, 661, A67
- Osterbrock & Ferland (2006) Osterbrock D. E., Ferland G. J., 2006, Astrophysics of gaseous nebulae and active galactic nuclei
- Pakull & Angebault (1986) Pakull M. W., Angebault L. P., 1986, Nature, 322, 511
- Pakull & Mirioni (2002) Pakull M. W., Mirioni L., 2002, arXiv e-prints, pp astro–ph/0202488
- Pakull & Motch (1989) Pakull M. W., Motch C., 1989, Nature, 337, 337
- Pakull et al. (2010) Pakull M. W., Soria R., Motch C., 2010, Nature, 466, 209
- Parker et al. (2017) Parker M. L., et al., 2017, Nature, 543, 83
- Pinto & Kosec (2023) Pinto C., Kosec P., 2023, Astronomische Nachrichten, 344, e20220134
- Pinto & Walton (2023) Pinto C., Walton D. J., 2023, arXiv e-prints, p. arXiv:2302.00006
- Pinto et al. (2016) Pinto C., Middleton M. J., Fabian A. C., 2016, Nature, 533, 64
- Poutanen et al. (2007) Poutanen J., Lipunova G., Fabrika S., Butkevich A. G., Abolmasov P., 2007, MNRAS, 377, 1187
- Predehl et al. (2021) Predehl P., et al., 2021, A&A, 647, A1
- Rickards Vaught et al. (2021) Rickards Vaught R. J., Sandstrom K. M., Hunt L. K., 2021, ApJ, 911, L17
- Roberts & Colbert (2003) Roberts T. P., Colbert E. J. M., 2003, MNRAS, 341, L49
- Ryder et al. (2006) Ryder S. D., Murrowood C. E., Stathakis R. A., 2006, MNRAS, 369, L32
- Ryder et al. (2018) Ryder S. D., et al., 2018, ApJ, 856, 83
- Sarbadhicary et al. (2017) Sarbadhicary S. K., Badenes C., Chomiuk L., Caprioli D., Huizenga D., 2017, MNRAS, 464, 2326
- Sarbadhicary et al. (2019) Sarbadhicary S. K., Badenes C., Chomiuk L., Caprioli D., Huizenga D., 2019, MNRAS, 487, 5813
- Sardone et al. (2021) Sardone A., Pisano D. J., Pingel N. M., Sorgho A., Carignan C., de Blok W. J. G., 2021, ApJ, 910, 69
- Schneider et al. (2021) Schneider F. R. N., Podsiadlowski P., Müller B., 2021, A&A, 645, A5
- Sorgho et al. (2019) Sorgho A., et al., 2019, MNRAS, 482, 1248
- Soria et al. (2006) Soria R., Kuncic Z., Broderick J. W., Ryder S. D., 2006, MNRAS, 370, 1666
- Soria et al. (2010) Soria R., Pakull M. W., Broderick J. W., Corbel S., Motch C., 2010, MNRAS, 409, 541
- Soria et al. (2021) Soria R., Pakull M. W., Motch C., Miller-Jones J. C. A., Schwope A. D., Urquhart R. T., Ryan M. S., 2021, MNRAS, 501, 1644
- Steiner et al. (2009) Steiner J. F., Narayan R., McClintock J. E., Ebisawa K., 2009, PASP, 121, 1279
- Sutton et al. (2013) Sutton A. D., Roberts T. P., Middleton M. J., 2013, MNRAS, 435, 1758
- Swartz et al. (2003) Swartz D. A., Ghosh K. K., McCollough M. L., Pannuti T. G., Tennant A. F., Wu K., 2003, ApJS, 144, 213
- Tao et al. (2011) Tao L., Feng H., Grisé F., Kaaret P., 2011, ApJ, 737, 81
- Thompson et al. (2009) Thompson T. A., Quataert E., Murray N., 2009, MNRAS, 397, 1410
- Thuan et al. (2004) Thuan T. X., Bauer F. E., Papaderos P., Izotov Y. I., 2004, ApJ, 606, 213
- Thygesen et al. (2023) Thygesen E., et al., 2023, MNRAS, 519, 5848
- Tombesi et al. (2015) Tombesi F., Meléndez M., Veilleux S., Reeves J. N., González-Alfonso E., Reynolds C. S., 2015, Nature, 519, 436
- Urquhart & Soria (2016) Urquhart R., Soria R., 2016, ApJ, 831, 56
- Urquhart et al. (2018) Urquhart R., Soria R., Johnston H. M., Pakull M. W., Motch C., Schwope A., Miller-Jones J. C. A., Anderson G. E., 2018, MNRAS, 475, 3561
- Volonteri et al. (2015) Volonteri M., Silk J., Dubus G., 2015, ApJ, 804, 148
- Walton et al. (2015) Walton D. J., et al., 2015, ApJ, 806, 65
- Warmels (1992) Warmels R. H., 1992, in Worrall D. M., Biemesderfer C., Barnes J., eds, Astronomical Society of the Pacific Conference Series Vol. 25, Astronomical Data Analysis Software and Systems I. p. 115
- Watson (2011) Watson D., 2011, A&A, 533, A16
- Webb et al. (2020) Webb N. A., et al., 2020, A&A, 641, A136
- Willingale et al. (2013) Willingale R., Starling R. L. C., Beardmore A. P., Tanvir N. R., O’Brien P. T., 2013, MNRAS, 431, 394
- Wright et al. (2010) Wright E. L., et al., 2010, AJ, 140, 1868
- Xu et al. (2014) Xu H., Ahn K., Wise J. H., Norman M. L., O’Shea B. W., 2014, ApJ, 791, 110
- Yoshioka et al. (2022) Yoshioka S., Mineshige S., Ohsuga K., Kawashima T., Kitaki T., 2022, PASJ, 74, 1378
- Zhou et al. (2023) Zhou C., Feng H., Bian F., 2023, ApJ, 955, 61