A Multiple Ejecta-Circumstellar Meduim Interaction Model and Its Implications for the Superluminous Supernova iPTF15esb
Abstract
Recently, a hydrogen-poor superluminous supernova (SLSN) iPTF15esb at redshift was reported, whose light curve (LC) and spectrum show several unusual characteristics. Its late-time spectrum shows a strong, broad H emission line and the bolometric LC exhibits two peaks and a post-peak plateau. Here we propose an ejecta-circumstellar medium (CSM) interaction model involving multiple shells and winds to explain this double-peak SN. We find that the theoretical LC reproduced by this model can well match the observations of iPTF15esb. Based on this result, we infer that the progenitor has undergone at least three violent mass-loss processes before the SN explosion. Furthermore, we find that the masses of the CSM wind and shells from the outermost shell (the first eruption) to the innermost wind (the final eruption) decrease sequentially but their densities increase. The variation trend of the inferred densities of the shells and wind is consistent with the stellar structure before an SN explosion. Further investigations for similar SLSNe would provide a probe for the mass-loss history of their progenitors.
Subject headings:
circumstellar matter – supernovae: general – supernovae: individual (iPTF15esb)1. INTRODUCTION
In the past decade, fast-developing non-targeted supernova (SN) survey programs have discovered a new class of unusual SNe whose peak absolute magnitudes at all bands are brighter than mag. These very luminous SNe are called “superluminous supernovae (SLSNe)” (Quimby et al., 2011; Gal-Yam, 2012).
It appears that SLSNe can be simply divided into two categories, SLSNe I and II. SLSNe I have spectra around the peaks that are lack of hydrogen absorption lines and their light curves (LCs) might be explained by the pair instability SNe (PISNe; Rakavy & Shaviv, 1967; Heger & Woosley, 2002; Heger et al., 2003) model (i.e., 56Ni model), the magnetar model (Kasen & Bildsten, 2010; Woosley, 2010; Inserra et al., 2013; Wang et al., 2015a, b; Dai et al., 2016; Wang et al., 2016a; Liu et al., 2017; Yu et al., 2017) or the ejecta-circumstellar (CSM) interaction model (Chevalier & Irwin, 2011; Ginzburg & Balberg, 2012; Chatzopoulos et al., 2012, 2013; Nicholl et al., 2014; Chen et al., 2015).
On the other hand, the spectra around the peaks of SLSNe II show strong hydrogen emission features and almost all of them show narrow and intermediate width Balmer emission lines, similar to normal SNe IIn. Previous studies (Smith & McCray, 2007; Moriya et al., 2011; Chatzopoulos et al., 2012, 2013; Moriya et al., 2013) suggested that the LCs of SLSNe IIn might be powered by the interactions between the SN ejecta and the dense, hydrogen-rich, and optically thick CSM.
However, some SLSNe I (e.g., iPTF13ehe, iPTF15esb and iPTF16bad) whose late-time spectra exhibit H emission lines (Yan et al., 2015, 2017) complicated the classification scheme. Yan et al. (2015) estimated that of SLSNe I might have these spectral features. Among these SLSNe I that have late-time H emission lines, iPTF15esb, exploded at redshift , is the most striking one. Its late-time spectra show strong, broad H emission lines, indicative of the interaction between the SN ejecta and the hydrogen-rich CSM shell surrounding the SN progenitor. Moreover, its LC has two peaks whose luminosities are approximately equal to each other ( erg s-1) and a plateau lasting about 40 days. Its late-time LC decays as .111As pointed out by Yan et al. (2017), undulation features that clearly deviate from the smooth rise and fall are also seen in the LCs of other SLSNe I such as SN2015bn (Nicholl et al., 2016) and iPTF13dcc (Vreeswijk et al., 2017).
The decline rate of the late-time LC powered by 56Ni cascade decay with full trapping of -rays is 0.0098 mag per day and the late-time LCs powered by a magnetar (with full trapping of -rays) can be described by . The magnetar model together with 56Ni cascade decay with leakage of -rays (Clocchiatti & Wheeler, 1997; Wang et al., 2015a; Chen et al., 2015) is able to explain the late-time LC of iPTF15esb. However, neither 56Ni cascade decay model nor magnetar model can produce the LC showing two bright peaks and a plateau.
It seems that an energy-source model involving multiple energy injections is needed to account for the exotic LC of iPTF15esb. Wang et al. (2016b) propose a triple-energy-source model (i.e., 56Ni plus magnetar plus interaction) for iPTF13ehe. However, this model involve only one collision between the ejecta and the CSM shell and also cannot produce an LC having two peaks and a long-lasting plateau.
Therefore, the LC of iPTF15esb cannot be explained by the models mentioned above. As noted by Yan et al. (2017), however, the spectrum and the LC might seem to favor the interactions between the SN ejecta and multiple CSM shells or CSM clumps at different radii. Here we propose an ejecta-CSM interaction scenario involving interactions between the SN ejecta and multiple shells and stellar winds and adopt this scenario to model the whole LC of iPTF15esb. The paper is structured as follows. In Section 2, we give a detailed description of the model, and apply it to fit the LC and temperature evolution of iPTF15esb in Section 3. Finally, we discuss our results and conclude in Section 4.
2. Multiple Ejecta-CSM Interaction Model
In this section, we generalize the normal ejecta-CSM interaction model to a model involving multiple CSM shells and winds. The basic physical picture of this model will be described below.
The interaction of the ejecta with the pre-existing CSM results in the formation of two shock waves: a forward shock (FS) propagating through the CSM and a reverse shock (RS) sweeping up the SN ejecta (Chevalier, 1982; Chevalier & Fransson, 1994). The interaction provides a strong energy source by the conversion of kinetic energy into radiation.
Based on the numerical simulations for SN explosions, a double power-law distribution for the density of the SN ejecta can be adopted (Matzner & McKee, 1999). The density profile of the outer ejecta is
| (1) |
where is the slope of the outer ejecta, depending on the SNe progenitor stars, and is the density profile scaling parameter, which is given by (Chevalier & Fransson, 1994; Chatzopoulos et al., 2012)
| (2) |
where is the inner density profile slope. Here is the total SN energy, and is the total mass of the SN ejecta. The relation between and could be written as (Chatzopoulos et al., 2012)
| (3) |
where denotes the dimensionless radius of break in the supernova ejecta density profile from the inner component to the outer component.
Before the SN explosion, the mass loss of massive stars could erupt several gas shells. We assume that the circumstellar density follows
| (4) |
where is a scaling constant, and is the power-law index for CSM density profile and therefore indicates stellar winds while indicates uniform density shells. The subscript “i” denotes the th collision between the ejecta and the CSM shell. For a steady wind () with a constant pre-explosion mass loss rate and wind velocity , we have .
The shocked CSM and shocked ejecta are separated by a contact discontinuity. The radius of contact discontinuity can be described by a self-similar solution (Chevalier, 1982)
| (5) |
where is a constant. The radii of the FS and the RS are given by
| (6) |
and
| (7) |
where is the interaction radius (equal to the inner radius of CSM density profile), and are constants representing the ratio of the shock radii to the contact-discontinuity radius . The values of and are determined by the values of and . They are given in Table 1 of Chevalier (1982). For and , we can obtain , , and ; for and , we have , , and .
The interaction radii of the second and third collisions are given by
| (8) |
and
| (9) |
where is the trigger time of interaction relative to time zero point. Here, we set the first peak of the LC as time zero point. The kinetic energies of the second and third interactions are
| (10) |
where is the energy loss due to radiation.
The interaction between the ejecta and the CSM would convert the kinetic energy to radiation. Using energy conservation, Chatzopoulos et al. (2012) found that the luminosity input functions from the FS and RS are
| (11) | |||||
and
| (12) | |||||
where and represent the Heaviside step function that controls the end times of FS and RS, respectively. is the time when the ejecta-CSM interaction begins. The temporal index is . Here we fix . Consequently, we have for the shells (), and for the steady winds ().
Once the RS sweeps up all available ejecta, the RS termination timescale can be obtained (Chatzopoulos et al., 2012, 2013)
| (13) |
The masses of ejecta of the second and third interactions are
| (14) |
Under the same assumption, the FS terminates when the optically thick part of the CSM is swept up. The termination timescale of the FS, being approximately equal to the time of FS breakout , is given by (Chatzopoulos et al., 2012, 2013)
| (15) | |||||
where is the mass of optically thick CSM
| (16) |
Here denotes the photospheric radius of the th CSM shell, located at the optical depth under Eddington’s approximation. is given by
| (17) |
where is the optical opacity of the CSM and is the radius of outer boundary of CSM. can be determined by the following expression:
| (18) |
Both the FS and the RS heat the interacting material. The total luminosity input from the FS and RS can be written as
| (19) |
where is the conversion efficiency from the kinetic energy. Chatzopoulos et al. (2012) assumed that 100, which is unrealistic in the actual situation, especially in the case. Due to the poor knowledge of the process of converting the kinetic energy to radiation, for simplicity, we set as a free parameter.
Because the expansion velocity of the CSM is much lower than the typical velocity of SN ejecta, Chatzopoulos et al. (2012) assumed a fixed photosphere inside the CSM. Under this assumption, the output bolometric LC can be written as
| (20) |
where is the diffusion timescale in the optically thick CSM. The diffusion timescales of three interactions can be written as
| (21) | |||||
where is a constant (Arnett, 1982), and is the speed of light. It is worth noting that there is only one photospheric radius in our model, i.e., .
Based on this multiple ejecta-CSM interaction model, we can obtain the theoretical bolometric LC
| (22) |
We assume that the bolometric luminosity come from the blackbody emission from the photosphere whose radius is , and therefore the temperature in our model can be estimated by
| (23) |
where is the Stefan-Boltzmann constant. By assuming a stationary photosphere, we have .
| th interaction | bbfootnotemark: | ccfootnotemark: | ||||||
|---|---|---|---|---|---|---|---|---|
| 1 | 0.2 | 6.1 | 0.42 | 22 | 0.29 | 0.2 | ||
| 2 | 0 | 0.2 | 6.32 aafootnotemark: | 1.32 | 4.5 | 0.13 | 5.2 | 2.1 ddfootnotemark: |
| 3 | 0 | 0.33 | 7.64 aafootnotemark: | 1.81 | 0.21 | 0.11 | 24.2 | 4.8 ddfootnotemark: |
a. and are not fitting parameters, but calculated by Equation (14).
b. the density of the CSM at the radius .
c. is the conversion efficiency from the kinetic energy to radiation.
3. Implications for iPTF15esb
In this section, we use the model described above to fit the bolometric LC and temperature evolution of iPTF15esb. It is reasonable to suggest at least three collisions between the SN ejecta and CSM shells since the LC of iPTF15esb shows two prominent peaks and a plateau. In order to reduce the number of free parameters in our calculations, we fix several parameters.
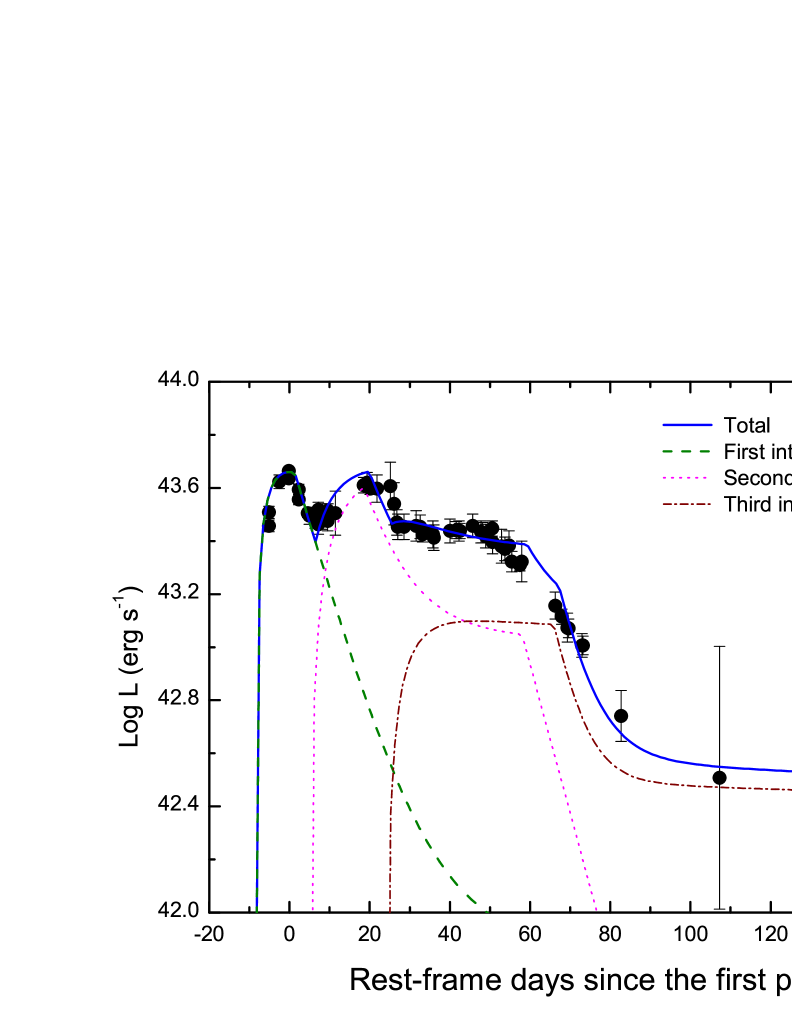
In our model, we assume that the interaction between the SN ejecta and the stellar wind (i.e., ) power the first peak of the LC of iPTF15esb. The second peak and the plateau are powered by the interactions between the SN ejecta and CSM shells at different radii, in which is adopted.
By analyzing Fe II 5169 Å line, Yan et al. (2017) found that the photospheric velocity around the first peak of iPTF15esb is km s-1. Here we use as the characteristic velocity of the ejecta. In addition, we adopt the power-law index of the inner density profile as an approximation for Type I SNe (Chevalier, 1982), the inner density slope , and the dimensionless radius .
The opacities of the CSM shells and winds are related to their composition and temperatures. For hydrogen-poor matter, and when the dominant source of opacity is electron scattering, cm2 g-1 (see the references listed in Wang et al. 2015b). For hydrogen-rich matter, cm2 g-1, which is the Thomson electron scattering opacity for fully ionized material with solar metallicity (Moriya et al., 2011; Chatzopoulos et al., 2012). Since no hydrogen emission lines in the early-time spectra of iPTF15esb have been detected, we have no idea about the composition of the first and second CSM shells (from the spectra we may expect them to be hydrogen-poor) and suggest that cm2 g-1 or 0.33 cm2 g-1. There is a strong, broad H emission at days from the first light peak. We interpret the H emission as the result of ejecta interaction with hydrogen-rich shell. Therefore, we adopt the opacity of third CSM shell cm2 g-1.
Thus, there are six free parameters in our model: the mass of the SN ejecta , the total mass of CSM , the density of the CSM at the interaction radius , the interaction radius (the inner radius of CSM) , the conversion efficiency from the kinetic energy to radiation , the time of the collision between the SN ejecta and the CSM shells . Most of the model parameters for the second and third interactions are fixed by the fitting parameters of the first interaction.
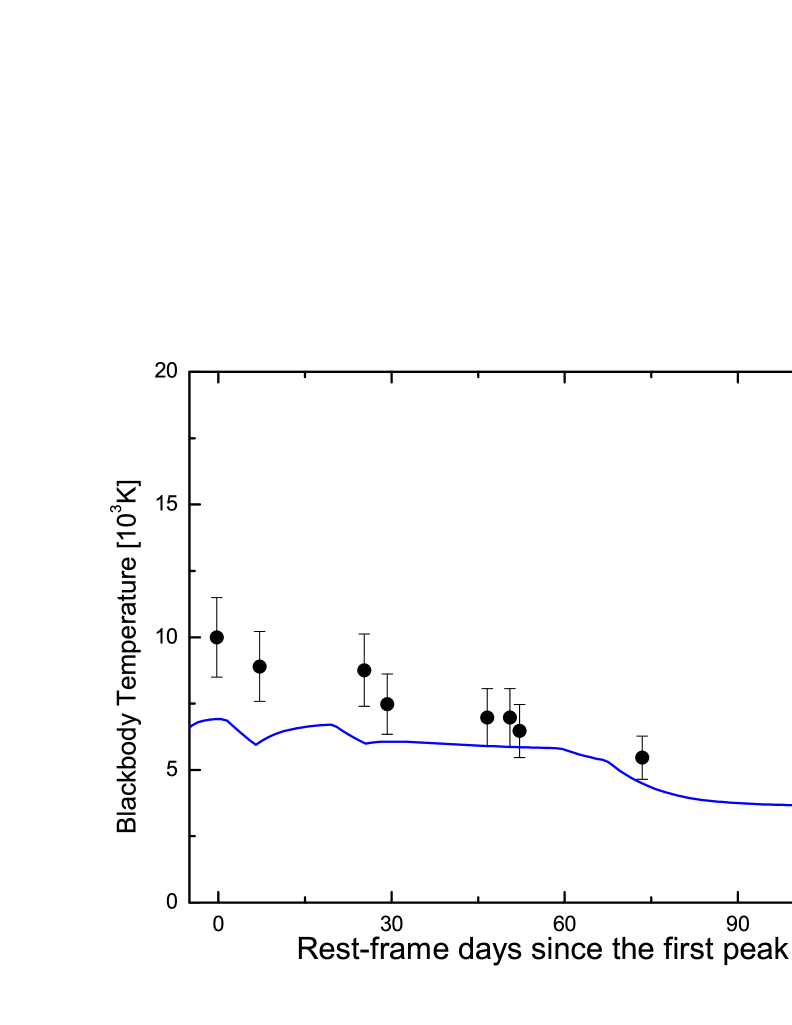
The theoretical LC and temperature evolution are shown in Figures 1 and 2, respectively. The corresponding parameters are listed in Table 1. We find that the multiple interaction model can explain the special LC of iPTF15esb well and the parameters are reasonable. In our model the blackbody radiation emanates from a fixed photosphere. The assumption of several stationary CSM shells results in a difference between the theoretical velocity evolution and observational data at early times, as shown in Figure 2, indicating that this assumption ought to be modified in the case of a wind.
The physical parameters of the CSM shells and the wind are listed in Table 2. The mass of the optically thick part of the CSM shell , which is close to their total mass, can be determined. The termination timescales of the FS and the RS can also be determined. The optical depth of CSM , indicating that these shells are opaque.
Provided that the velocity of the stellar wind and the expansion velocities of the shells are 1000 km s-1 and 100 km s-1, respectively, we can obtain the time when the progenitor expelled the CSM shells before explosion by using . We infer that the progenitor has undergone at least three violent mass-loss processes at 0.03, 6.9, and 15.5 years before the supernova explosion, respectively.
| th interaction | aafootnotemark: | bbfootnotemark: | ccfootnotemark: | ||||
|---|---|---|---|---|---|---|---|
| 1 | 0.40 | 7.1 | 278.6 | 8.5 | 69.6 | 0.96 | 0.06 |
| 2 | 1.21 | 13.3 | 53.7 | 7.7 | 8.5 | 2.3 | 6.9 |
| 3 | 1.45 | 41.7 | 165.5 | 5.2 | 4.1 | 5.3 | 15.5 |
a. is the mass of optically thick CSM.
b. is the optical depth of CSM.
c. is the time of the progenitor star erupting the CSM shells before explosion. Here we assume the velocity of the progenitor wind km s-1 and the shells expansion velocities km s-1.
4. Discussion and Conclusions
The LC of iPTF15esb has two peaks and a post-peak plateau. All previous energy-source models (the 56Ni model, the magnetar model, the ejecta-CSM model, etc.) cannot account for these exotic features. We suggest that the LC undulations in iPTF15esb arose from SN ejecta interacting with dense CSM shells, which may be produced by the eruptions of the progenitor. Therefore, we generalize the model involving the ejecta and single CSM shell or wind model to the multiple interaction model. We employ this new model to fit the LC as well as temperature evolution of iPTF15esb and find it can well explain the LC. These results indicate that our model is valid.
Based on the modeling, we infer that there are at least three collisions between the SN ejecta and CSM winds and/or shells and that the progenitor of iPTF15esb may undergo three discrete mass ejections (two shells and a wind) before the SN explosion. The pulsational PISN (PPISN) models (Woosley et al., 2007; Woosley, 2017) can account for these eruptions. In these three successive collisions, the masses of the CSM decrease from the outermost shell (the first eruption) to innermost wind (the final eruption) but their density increases. The variation trend of the inferred densities of the shells and wind is consistent with the stellar structure since the density of the interior of the star is larger than that of the exterior.
The interaction model for the LC of iPTF15esb is also favored by the broad H emission lines in the late-time spectra which might be produced by the interaction of SN ejecta with hydrogen-rich CSM shell located at a large distance from the progenitor star and was ejected by the progenitor star about 15.5 years before explosion. In our modeling, the first peak of the LC is powered by the interaction between the SN ejecta and stellar wind while both the second peak and the plateau are powered by the two CSM shells at different radii.
The properties of the stellar wind have some implications for the progenitor. Red supergiants have slow wind velocities of km s-1, with the typical mass loss rate yr-1, while compact progenitors (e.g., Wolf-Rayet stars) have high wind velocities km s-1, with yr-1 (Smith, 2014). By assuming that the wind velocity , we can obtain mass loss rate yr-1. If , then yr-1. These results indicate the progenitor wind of iPTF15esb with an extremely large mass loss rate.
Massive stars are unstable and can lose a lot of matter in the form of eruptions in the final stage of their lives. Mass loss of the progenitor of an SN is an important process of stellar evolution. However, our understanding of the driving mechanism of mass loss is still incomplete. Further investigations for SLSNe like iPTF15esb should shed light on the nature of mass-loss history of their progenitors.
References
- Arnett (1982) Arnett, W. D. 1982, ApJ, 253, 785
- Chatzopoulos et al. (2012) Chatzopoulos, E., Wheeler, J. C., & Vinko, J. 2012, ApJ, 746, 121
- Chatzopoulos et al. (2013) Chatzopoulos, E., Wheeler, J. C., Vinko, J., Horvath, Z. L., & Nagy, A. 2013, ApJ, 773, 76
- Chen et al. (2015) Chen, T.-W., Smartt, S. J., Jerkstrand, A., et al. 2015, MNRAS, 452, 1567
- Chevalier (1982) Chevalier, R. A. 1982, ApJ, 258, 790
- Chevalier & Fransson (1994) Chevalier, R. A., & Fransson, C. 1994, ApJ, 420, 268
- Chevalier & Irwin (2011) Chevalier, R. A., & Irwin, C. M. 2011, ApJ, 729, L6
- Clocchiatti & Wheeler (1997) Clocchiatti, A., & Wheeler, J. C. 1997, ApJ, 491, 375
- Dai et al. (2016) Dai, Z. G., Wang, S. Q., Wang, J. S., Wang, L. J., & Yu, Y. W. 2016, ApJ, 817, 132
- Gal-Yam (2012) Gal-Yam, A. 2012, Science, 337, 927
- Ginzburg & Balberg (2012) Ginzburg, S., & Balberg, S. 2012, ApJ, 757, 178
- Heger et al. (2003) Heger, A., Fryer, C. L., Woosley, S. E., Langer, N., & Hartmann, D. H. 2003, ApJ, 591, 288
- Heger & Woosley (2002) Heger, A., & Woosley, S. E. 2002, ApJ, 567, 532
- Inserra et al. (2013) Inserra, C., Smartt, S. J., Jerkstrand, A., et al. 2013, ApJ, 770, 128
- Kasen & Bildsten (2010) Kasen, D., & Bildsten, L. 2010, ApJ, 717, 245
- Liu et al. (2017) Liu, L. D., Wang, S. Q., Wang, L. J., Dai, Z. G., Yu, H., & Peng, Z. K. 2017, ApJ, in press (arXiv:1705.06047)
- Matzner & McKee (1999) Matzner, C. D., & McKee, C. F. 1999, ApJ, 510, 379
- Moriya et al. (2013) Moriya, T. J., Blinnikov, S. I., Tominaga, N., et al. 2013, MNRAS, 428, 1020
- Moriya et al. (2011) Moriya, T., Tominaga, N., Blinnikov, S. I., Baklanov, P. V., & Sorokina, E. I. 2011, MNRAS, 415, 199
- Nicholl et al. (2016) Nicholl, M., Berger, E., Smartt, S. J., et al. 2016, ApJ, 826, 39
- Nicholl et al. (2014) Nicholl, M., Smartt, S. J., Jerkstrand, A., et al. 2014, MNRAS, 444, 2096
- Quimby et al. (2011) Quimby, R. M., Kulkarni, S. R., Kasliwal, M. M., et al. 2011, Nature, 474, 487
- Rakavy & Shaviv (1967) Rakavy, G., & Shaviv, G. 1967, ApJ, 148, 803
- Smith (2014) Smith, N. 2014, ARA&A, 52, 487
- Smith & McCray (2007) Smith, N., & McCray, R. 2007, ApJ, 671, L17
- Vreeswijk et al. (2017) Vreeswijk, P. M., Leloudas, G., Gal-Yam, A., et al. 2017, ApJ, 835, 58
- Wang et al. (2016a) Wang, L. J., Wang, S. Q., Dai, Z. G., et al. 2016a, ApJ, 821, 22
- Wang et al. (2016b) Wang, S. Q., Liu, L. D., Dai, Z. G., Wang, L. J., & Wu, X. F. 2016b, ApJ, 828, 87
- Wang et al. (2015a) Wang, S. Q., Wang, L. J., Dai, Z. G., & Wu, X. F. 2015a, ApJ, 807, 147
- Wang et al. (2015b) Wang, S. Q., Wang, L. J., Dai, Z. G., & Wu, X. F. 2015b, ApJ, 799, 107
- Woosley (2010) Woosley, S. E. 2010, ApJL, 719, L204
- Woosley (2017) Woosley, S. E. 2017, ApJ, 836, 244
- Woosley et al. (2007) Woosley, S. E., Blinnikov, S., & Heger, A. 2007, Nature, 450, 390
- Yan et al. (2017) Yan, L., Lunnan, R., Perley, D., et al. 2017, arXiv:1704.05061
- Yan et al. (2015) Yan, L., Quimby, R., Ofek, E., et al. 2015, ApJ, 814, 108
- Yu et al. (2017) Yu, Y.-W., Zhu, J.-P., Li, S.-Z., Lü, H.-J., & Zou, Y.-C. 2017, ApJ, 840, 12