11email: mortega@iafe.uba.ar 22institutetext: Departamento de Astronomía, Universidad de Chile, Casilla 36-D, Santiago, Chile
A multiwavelength study of the star forming region IRAS 18544+0112
Abstract
Aims. This work aims at investigating the molecular and infrared components in the massive young stellar object (MYSO) candidate IRAS 18544+0112. The purpose is to determine the nature and the origin of this infrared source.
Methods. To analyze the molecular gas towards IRAS 18544+0112, we have carried out observations in a 90′′ 90′′ region around 3469, –065, using the Atacama Submillimeter Telescope Experiment (ASTE) in the 12CO J=3–2, 13CO J=3–2, HCO+J=4–3 and CS J=7–6 lines with an angular resolution of 22′′. The infrared emission in the area has been analyzed using 2MASS and Spitzer public data.
Results. From the molecular analysis, we find self-absorbed 12CO J=3–2 profiles, which are typical in star forming regions, but we do not find any evidence of outflow activity. Moreover, we do not detect either HCO+J=4–3 or CS J=7–6 in the region, which are species normally enhanced in molecular outflows and high density envelopes. The 12CO J=3–2 emission profile suggests the presence of expanding gas in the region. The Spitzer images reveal that the infrared source has a conspicuous extended emission bright at 8 m with an evident shell-like morphology of 15 in size ( 1.4 pc at the proposed distance of 3 kpc) that encircles the 24 m emission. The non-detection of ionized gas related to IRAS 18544+0112 together with the fact that it is still embedded in a molecular clump suggest that IRAS 18544+0112 has not reached the UCHII region stage yet. Based on near infrared photometry we search for YSO candidates in the region and propos that 2MASS 18565878+0116233 is the infrared point source associated with IRAS 18544+0112. Finally, we suggest that the expansion of a larger nearby HII region, G034.80.7, might be related to the formation of IRAS 18544+0112.
Key Words.:
ISM: molecules - HII regions - Stars: formation1 Introduction
Star formation processes start when a pressure-bounded, self-gravitating molecular clump becomes gravitationally unstable. As summarized by Whitworth et al. (1994a, b), the action of an expanding nebula can produce gravitationally unstable shocked layers of interstellar gas. For example, the expansion of an HII region can sweep up the surrounding molecular gas into a dense shell, which then fragments and forms new massive stars (“collect and collapse” model; see Elmegreen & Lada 1977). Several recent works support this model (e.g. Deharveng et al. 2005; Comerón et al. 2005; Zavagno et al. 2006; Pomarès et al. 2009). On the other hand, shockwaves from expanding wind- and/or supernova- driven superbubbles can also trigger cloud collapse and star formation, but at larger scales. Numerical studies (Vanhala & Cameron, 1998; Melioli et al., 2006) demonstrated that the effect caused by a passing shockwave mainly depends on the shock-type: close to the supernova remnant (SNR) the shockwave disrupts the ambient molecular clouds and thus terminates the star formation process; however, a little further away from the SNR the shock velocity decreases, and cloud collapse is possible if the right circumstances were given.
This work is part of a systematic study towards IR sources embedded in molecular condensations with evidence of being affected by SNRs shock fronts or expanding HII regions. In a previous work, Paron et al. (2009) studied the infrared (IR) source IRAS 18542+0114 located near the border of the SNR W44. They discovered that this source is probably a massive young stellar object (MYSO) located at the border of the HII region G034.80.7 which is evolving within a molecular cloud. In this work, we present a study of the neighboring source IRAS 18544+0112, another IR source embedded in the same molecular cloud. It is important to remark that the molecular cloud, the HII region G034.80.7 and the SNR W44 are not only located in the same region in the plane of the sky but also at the same distance from the Sun, at about 3 kpc (corresponding to the kinematic velocity of km s-1, Paron et al. 2009 and references therein).
The source investigated in this Paper, IRAS 18544+0112, was cataloged as a MYSO and a high mass protostellar object (HMPO) by Molinari et al. (1996) and Kumar & Grave (2007), respectively. On the basis of the analysis of new molecular data and near- and mid-IR data, we present a multiwavelength study of the IR source aiming to discern its origin and evolutionary stage.

2 IRAS 18544+0112 and its environment
Figure 1 shows a two-color IR image of the HII region G034.80.7. We show in green the Spitzer-IRAC 8 m emission and in red the Spitzer-MIPSGAL 24 m emission. Yellow corresponds to regions where both emissions overlap. The white contours represent the 13CO J=1–0 line emission distribution (as extracted from the Galactic Ring Survey (GRS; Jackson et al. 2006) averaged over the velocity interval from 36 to 45 km s-1.
The 8 m emission, which arises mainly from the polycyclic aromatic hydrocarbons molecules (PAHs; Leger & Puget 1984) and an underlying continuum attributed to very small grains, is observed enclosing the 24 m emission that is originated in the heated dust of the HII region G034.80.7. These molecules cannot survive inside HII regions and are located over the photodissociation regions (PDRs) that encircle the ionized gas (Cesarsky et al., 1996). The PDRs are the interphase zone between the ionized and molecular gas, and its presence evidences the interaction between them. A well defined 8 m arc-like structure is observed bordering the HII region G034.80.7 towards lower Galactic latitudes. It is important to note that the ionized region is partially bordered by two molecular clouds which are part of the giant molecular complex (GMC) G34.80.6. The morphology of the molecular clouds, as seen in the 13CO J=1–0 line, suggests that they are shaped by the action of the HII region.
On the other hand, IRAS 18544+0112, located at () = (3469, –065), appears as a bright yellow knot. From Fig. 1 it can be noticed that this IR source is located in a bulge shaped molecular gas condensation which is observed in the velocity interval from 36 to 45 km s-1.
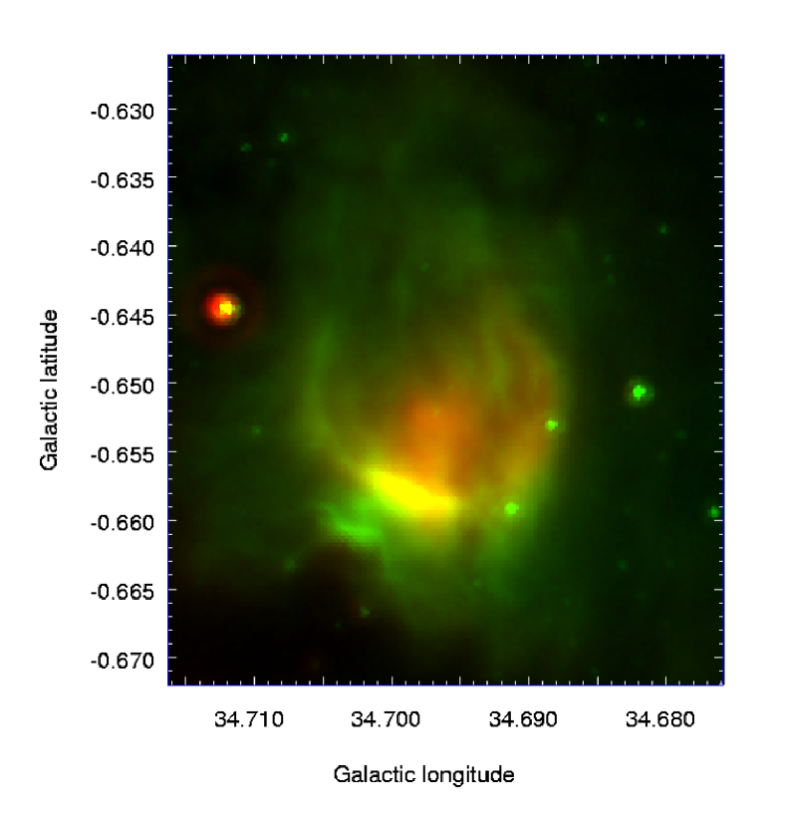
Figure 2 shows a two-color image of IRAS 18544+0112 , where green and red are the 8 m and 24 m emission, respectively. The observed 8 m emission distribution shows a shell-like structure of about 15 in size ( 1.4 pc at a distance of 3 kpc), bright filaments and diffuse emission. The emission at 24 m is observed mainly inside the shell-like structure.
Since most HMPOs present molecular outflows, we now analyze whether this phenomenon is taking place in the region.
The IRAC 4.5 m band contains lines that may be excited by high velocity shocks, such as those expected when protostellar outflows crash into the ambient ISM (Cyganowski et al., 2008) or when a SNR interacts with a molecular cloud. We thus inspected the IRAC 4.5 m emission distribution in the area.
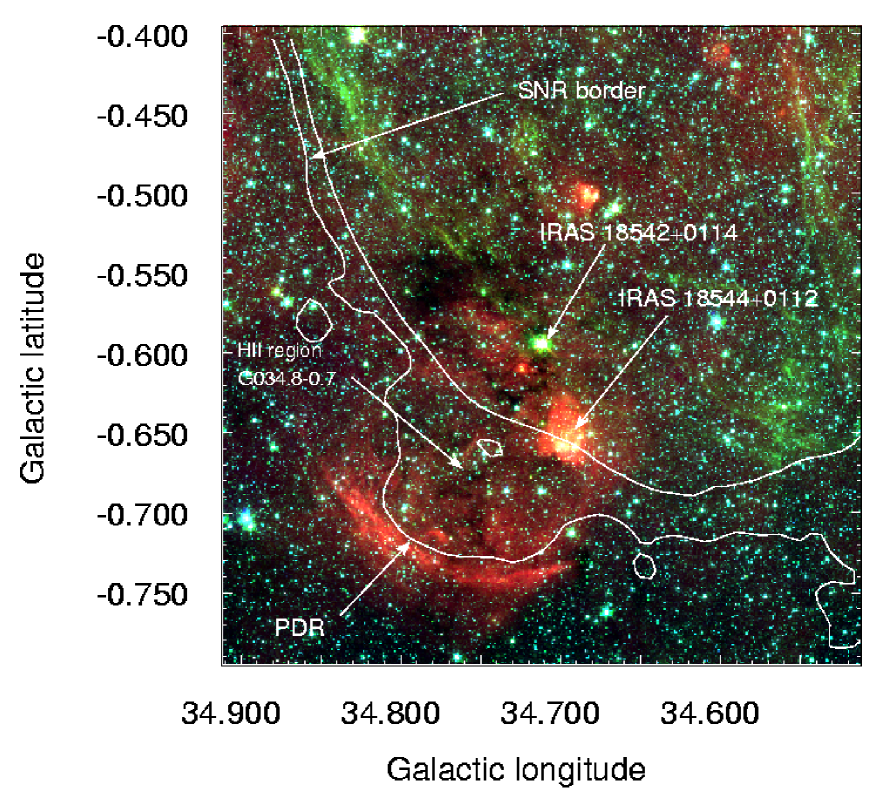
Figure 3 shows a Spitzer-IRAC three-color image of a square region of 22′ in size. The three IR bands presented are: 3.6 m (in blue), 4.5 m (in green) and 8 m (in red). The white contours represent the radio continuum emission at 1.4 GHz as extracted from the VGPS (VLA Galactic Plane Survey; Stil et al. 2006), which depict the SE border of the SNR W44 and the border of the radio continuum emission associated with the HII region G034.80.7 encompassing the PDR.
An inspection of Fig. 3 shows that the source IRAS 18542+0114 studied by Paron et al. (2009), appears slightly extended in the 4.5 m emission (green). Such a characteristic is suggestive of a YSO origin for the emission, a condition that was confirmed by Paron et al. (2009) after discovering associated molecular outflows. Figure 3 also shows some extended diffuse filaments in this IRAC band, which are probably illuminating molecular gas shocked by the SNR. In the case of the source studied in this work, IRAS 18544+0112, it does not present significant emission in the 4.5 m band. Indeed, this source is clearly brighter at 8 m than at 4.5 m, suggesting that there is no outflow activity in the region.
With the purpose to analyze the small scale distribution and dynamic of the molecular gas associated with IRAS 18544+0112 , we carried out observations of the 12CO, 13CO J=3-2, HCO+J=4-3, and CS J=7-6 lines towards a region of 90′′90′′ around this IR source using the Atacama Submillimeter Telescope Experiment (ASTE; Ezawa et al. 2004).
3 New molecular observations
The molecular observations were performed on June 25, 2008 with the 10 m ASTE Telescope. We used the CATS345 GHz band receiver, which is a two-single band SIS receiver remotely tunable in the LO frequency range of 324-372 GHz. We simultaneously observed 12CO J=3–2 at 345.796 GHz and HCO+ J=4–3 at 356.734 GHz, mapping a region of 90′′ 90′′ centered at the position of IRAS 18544+0112, () = (3469, –065). The mapping grid spacing was 10′′ and the integration time was 72 sec. per pointing. Additionally, we observed 13CO J=3–2 at 330.588 GHz and CS J=7–6 at 342.883 GHz towards the center of the region. All the observations were performed in position-switching mode. The off-position was () = (3487, –014), which was checked to be free of emission.
We used the XF digital spectrometer with a bandwidth and spectral resolution set to 128 MHz and 125 kHz, respectively. The velocity resolution was 0.11 km s-1 and the half-power beamwidth (HPBW) was 22′′ at 345 GHz. The system temperature varied from T to 700 K. The typical rms noise (in units of Tmb) ranged between 0.1 and 0.4 K, and the main beam efficiency was .
The spectra were Hanning-smoothed to improve the signal-to-noise ratio, and only linear or/and some third order polinomia were used for baseline fitting. The spectra were processed using the XSpec software package developed at the Onsala Space Observatory.
4 Molecular analysis
As it was shown in Fig. 1, IRAS 18544+0112 appears embedded in a molecular clump, which is part of the GMC G34.80.6.
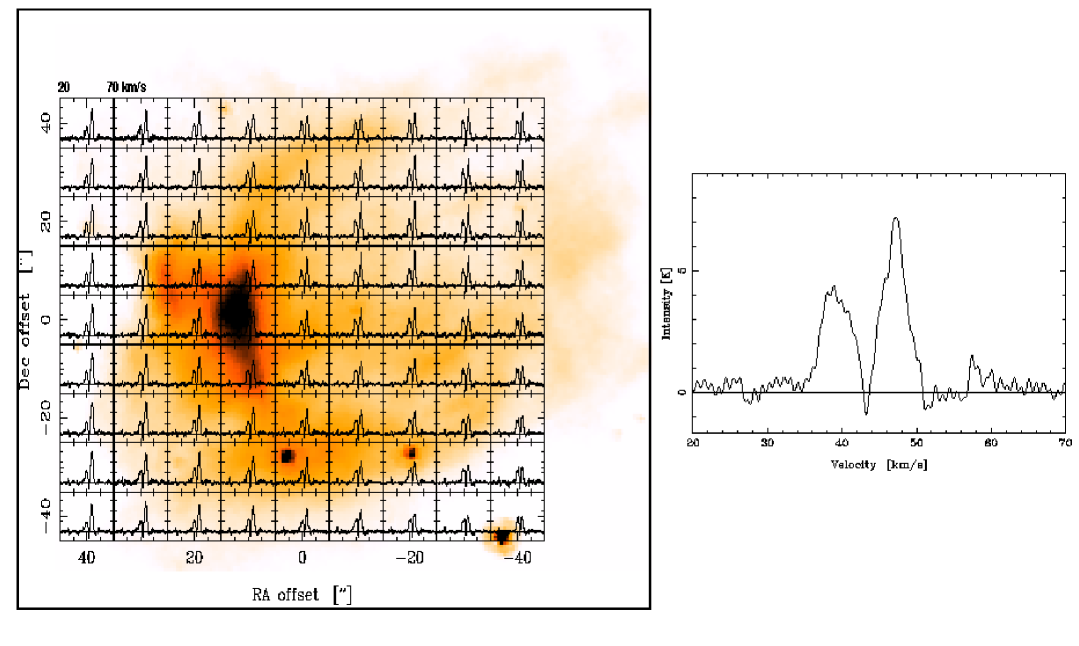
Figure 4 (left) shows the 12CO J=3–2 spectra obtained from a region of 90′′ 90′′ centered at the position of IRAS 18544+0112 and Fig.4 (right) presents a spectrum obtained towards the center of the region. Figure 5 displays an average spectrum of 13CO J=3–2 obtained towards the center of the clump at () = (3469, –065). All the 12CO profiles in this region present a dip at km s-1. Such a narrow dip points to a self-absorption origin instead of two 12CO emission components with very close kinematical velocities. We notice that the km s-1 dip is very close to the peak velocity of the 13CO J=3–2 line, which is an optically thinner line. Such correspondence strongly suggests that the dip in the 12CO profiles is in fact caused by self-absorption by less excited gas (see for example Zhou et al. 1993).
Since we are searching for indicators of active star formation in this IR source, the presence of this dip is interesting because it is known that the 12CO J=3–2 line has almost always been observed self-absorbed in star-forming regions (Johnstone et al., 2003).
Additionally, we note that the 12CO J=3–2 emission does not show any evidence of outflow activity in the region, which agrees with the faint 4.5 m emission mentioned in Sect. 2. The non-detection of the HCO+J=4–3 and CS J=7–6, molecular species that are enhanced in the interphase layer between the outflows and the surrounding molecular core where a YSO is forming (Hogerheijde et al., 1998; Rawlings et al., 2004) points in the same direction.
On the other hand, Fig. 4 clearly shows that most of the 12CO profiles in the region present a redshifted component brighter than the blueshifted one, suggesting that the molecular gas is expanding. This is because in an expanding cloud a line emission is composed by red and blueshifted photons. In the case of an optically thick line, such as the 12CO J=3–2, the redshifted photons will encounter fewer absorbing material (which is expanding outward) than would blueshifted photons and hence have greater probabilities of escape (e.g. Leung 1978; Zhou 1992; Lehtinen 1997).

To estimate the physical parameters of the molecular clump where IRAS 18544+0112 is embedded, we determine the line parameters of the 13CO J=3–2 line from a Gaussian fitting. We obtain: T ()K, V ()km s-1, () km s-1 and () K km s-1, where Tmb represents the peak brightness temperature, VLSR the central velocity referring to the local standard of rest, the line width and the integrated line intensity. Errors are a formal 1 value for the model of the Gaussian line shape.
Using the 13CO J=3–2 and J=1–0 lines we calculated the ratio of the integrated line intensities (13R3-2/1-0). The 13CO J=1–0 line was extracted from the GRS and the J=3–2 line was convolved to the J=1–0 beam. We obtained 13R.
Assuming LTE conditions and a beam filling factor of 1, which of course may not be completely true but allows us to make an initial guess, we use the 12CO J=3–2 emission towards the center of the analyzed region to estimate an excitation temperature, Tex. As noticed above, this emission appears self-absorbed, showing a dip between the blue and red emission components. Thus, we use an average between the Tmb of both components to obtain Tex 15 K. Using this factor and the parameters obtained for the 13CO J=3–2, we derive an optical depth for this line of 0.2 and a 13CO column density of N(13CO) 2.2 1015 cm-2. Adopting the 12CO and 13CO relationships of N(H2)/N(12CO)= 105 and N(12CO)/N(13CO)= 89 (Guan et al., 2008) and taking into account that 13R3-2/1-0 = 1 as estimated above, we obtain an H2 column density of N(H2) 2.0 1021 cm-2. Finally, assuming a spherical geometry for the clump as seen in the 13CO J=1–0 line (Fig. 1-left) with a radius of 0.7 pc, we estimate a mass and a volume density of 1.7 102 M⊙, and 3.2 103 cm-3, respectively.
5 Is IRAS 18544+0112 an ultracompact HII region?
In view of the lack of outflow activity in the area, a possible explanation is that IRAS 18544+0112 is an evolved high-massive protostellar object that has finished its accretion phase. Since the next step in the life of these objects is to develop an ultracompact HII (UCHII) region we looked for the presence of ionized gas. The fact that this source lies in the same region of the sky than the SNR W44 and the HII region G 34.7–0.8, makes it difficult to discern whether there is radio emission related to IRAS 18544+0112. An inspection of the 1420 MHz image obtained from the VGPS does shows the presence of emission at the position of IRAS 18544+0112 , but its extended morphology suggests that it is most probably related to G 34.7–0.8. To avoid the contamination of extended radio sources, we have inspected the 1420 MHz radio continuum image obtained from the NRAO VLA Sky Survey (NVSS; Condon et al. 1998). No radio continuum emission is detected at the position of IRAS 18544+0112. This agrees with the null detection reported by Hughes & MacLeod (1994) in the direction of this source.
From the cataloged IRAS fluxes of IRAS 18544+0112 and assuming a distance of 3 kpc, we estimated the corresponding IR luminosity LIR and dust temperature Td. The IR luminosity was estimated on the basis of the four-bands IRAS measurements (12, 25, 60 and 100 m) following Chan & Fich (1995) as LIR(L⊙)= 1.58 SIR (Jy) D2 (kpc), where SIR is the integrated flux given by SIR = 1.3(S12+S25)+0.7(S25+S60)+0.2(S60+S100) and is the flux density in the IRAS band expressed in Jy. We obtained LIR (7.9 1.6) 103 L⊙.
Adopting standard parameters for dust grains (Draine & Lee, 1984), the dust temperature can be derived from the relation Td(K) = (95.94/ln Bn), where Bn = 1.6673+n S100/S60 is the modified Planck function, and n is a parameter related to the absorption efficiency of the dust (). We obtained Td (29.0 5.0) K for the adopted value n=1. The estimated dust temperature of about 29 K for IRAS 18544+0112 is quite low for a UCHII region, which typically has temperatures of about 200 K (Ball et al., 1996), while it agrees with the ones derived for high mass protostellar candidates by Sridharan et al. (2002).
In summary, from the observed characteristics we suggest that IRAS 18544+0112 is not yet a UCHII region.
6 A search of MYSO candidates in IRAS 18544+0112
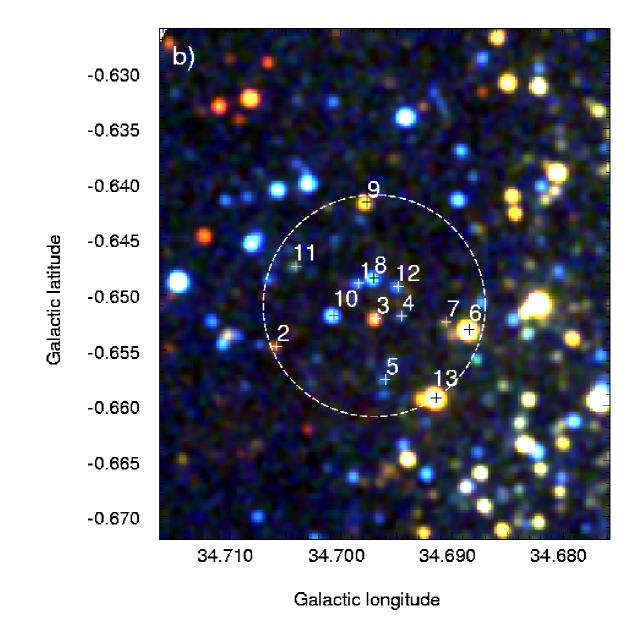
To search for MYSO candidates associated with IRAS 18544+0112 we performed a near-infrared photometric analysis of all the sources that are enclosed within the borders of the IR source as seen in the 8 m band (see e.g. Figure 2). We used the 2MASS All-Sky Point Source Catalogue (Skrutskie et al., 2006) in bands J (1.25 m), H (1.65 m) and KS (2.17 m), selecting only the sources detected in at least two bands. We found 13 sources in this region which are listed in Table 1 and shown in Fig. 6 (a) - (c). In Table 1 we present the source numbers (same as in the following figures), the Galactic coordinates in degrees, the Two Micron All Sky Survey (2MASS) designation and the J, H and KS magnitudes in cols. 1 to 7, respectively. Figure 6 (a) - (c) displays the spatial location of these sources superimposed over: the 8 m emission (a), the near infrared JHK three-color image extracted from the 2MASS (b), and the optical emission as extracted from the 2nd Digitized Sky Survey Blue (DSS2-B) (c). The dashed circle represents the area in which we searched for the mentioned sources.
| No. | 2MASS | |||||
|---|---|---|---|---|---|---|
| 1 | 34.69 | -0.64 | 18565828+0116334 | 15.73 | 15.18 | 14.37 |
| 2 | 34.70 | -0.65 | 18570030+0116478 | 18.59 | 15.65 | 13.35 |
| 3 | 34.69 | -0.65 | 18565878+0116233 | 17.76 | 14.59 | 12.37 |
| 4 | 34.69 | -0.65 | 18565848+0116162 | 17.04 | 15.89 | 15.13 |
| 5 | 34.69 | -0.65 | 18565987+0116116 | 16.71 | 15.71 | 15.66 |
| 6 | 34.68 | -0.65 | 18565808+0115548 | 15.27 | 11.58 | 9.76 |
| 7 | 34.69 | -0.65 | 18565816+0116025 | 18.04 | 15.69 | 13.97 |
| 8 | 34.69 | -0.64 | 18565802+0116298 | 14.44 | 13.86 | 13.70 |
| 9 | 34.69 | -0.64 | 18565665+0116434 | 17.46 | 13.94 | 12.10 |
| 10 | 34.70 | -0.65 | 18565913+0116360 | 14.25 | 13.78 | 13.55 |
| 11 | 34.70 | -0.64 | 18565855+0116541 | 17.14 | 15.31 | 14.50 |
| 12 | 34.69 | -0.64 | 18565794+0116215 | 16.10 | 15.19 | 14.21 |
| 13 | 34.69 | -0.65 | 18565971+0115541 | 15.11 | 11.38 | 9.49 |


Figures 7 and 8 display the (H-Ks) versus (J-H) color-color (CC) diagram and the (H-Ks) versus Ks color-magnitude (CM) diagram, respectively, of the 13 selected 2MASS sources.
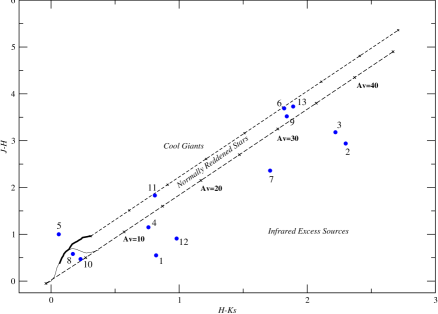
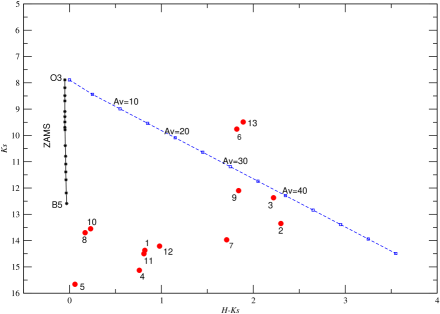
Figure 7 shows that sources one to four, seven and twelve lie in the region of sources with infrared excess. In particular sources two and three appear as the most reddened ones. Sources six, nine, eleven and thirteen correspond to normally reddened main sequence stars and sources eight and ten, the most conspicuos ones in the optical image (Fig. 6c), are probably no reddened foreground stars.
According to the CM diagram (Fig. 8), sources two, three, and nine are the earliest spectral type stars in the region. Sources six and, thirteen lie in the region of the giant stars, and sources one, four, five, seven, eight, ten, eleven, and twelve correspond to spectral-type stars later than B3. Moreover, as Figure 6 (c) shows, sources one, five, eight, and ten are detected in the DSS2-B optical band which, given the high obscuration of the region, suggests that they are probably foreground stars.
Thus, based on both diagrams, we conclude that the most likely high mass protostars related to IRAS 18544+0112 would be sources two and three. The fact that source three lies towards the geometrical center of the IR nebula and that it is placed on a maximun of the 24 m emission while source two is located onto the nebulas’s border, suggests that source three is the main one responsible for the observed infrared nebula.
7 Possible scenario
In this Section we discuss a possible formation scenario for IRAS 18544+0112.
As mentioned in Sect. 2, the presence of a PDR bordering the HII region G034.80.7 together with the observed morphology of its associated molecular cloud, are clear evidence of the fact that the HII region perturbs its enviroment.
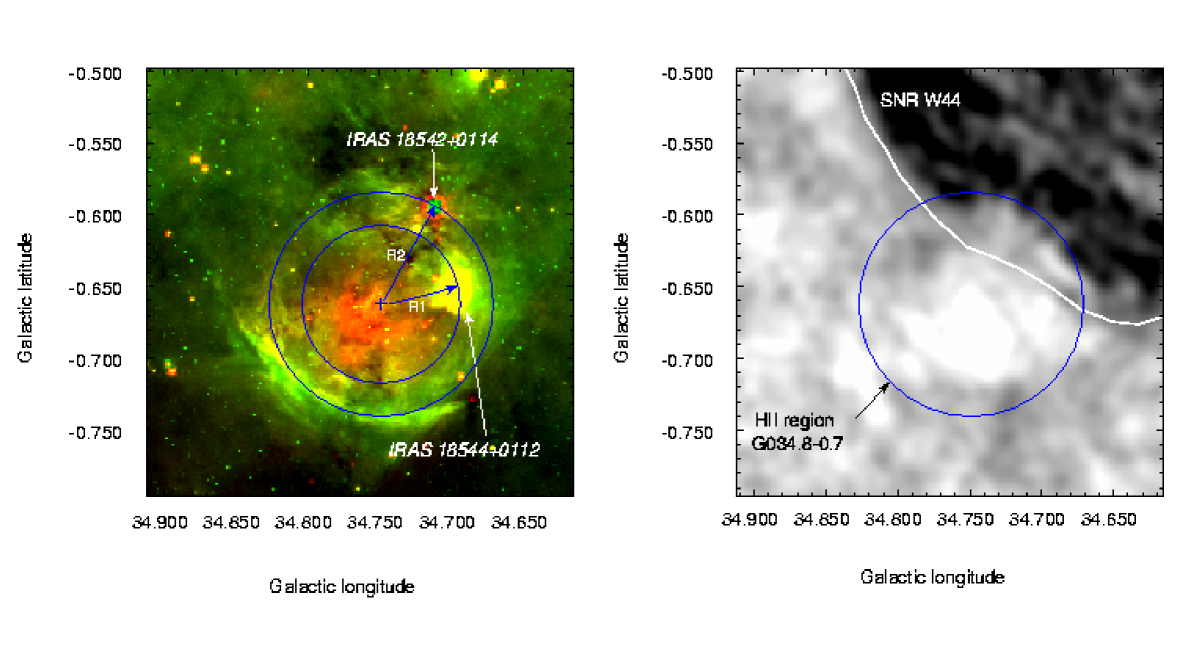
The IR source IRAS 18544+0112 is seen in projection inside the HII region G034.80.7, while IRAS 18542+0114 (Paron et al., 2009) is located upon its border (see Fig. 9). Based on an infrared and molecular study, Paron et al. (2009) found that IRAS 18542+0114 is a MYSO with molecular outflow activity and whose formation was probably triggered by the expansion of G034.80.7 onto the molecular cloud. In this context, we suggest that the HII region G034.80.7 has also triggered the formation of IRAS 18544+0112.
The observational differences found between both IRAS sources as well as their relative location with respect to the center of the HII region G034.80.7, suggest that the associated shockfront reached first the molecular gas where IRAS 18544+0112 was formed, thus explaining their different evolutionary stages. Kobayashi et al. (2008) proposed a similar scenario for the star forming region in Digel’s Cloud 2 , where an expanding shell has perturbed different parts of a molecular cloud during its evolution, producing different star generations.
To test the proposed scenario we estimate the age of the HII region at the moment it reached the location of each IRAS source. Using a simple model described by Dyson & Williams (1980) we calculated the age of the HII region at a given radius as
where is the sound velocity in the ionized gas (=10 km s-1) and is the radius of the Strömgren sphere, given by , where =2.6 cm3 s-1 is the hydrogen recombination coefficient to all levels above the ground level. is the total number of ionizing photons per unit of time emitted by the stars, and is the original ambient density.
The number of UV ionizing photons needed to keep an HII region ionized is given by (see, e.g. Chaisson, 1976) , where is the electron temperature in units of K, the distance in kpc, the frequency in GHz, and the measured total flux density in Jy. To calculate the radio flux density and in order to overcome the problem of superposition of the thermal radiation of the HII region and the non-thermal flux of the SNR that occurs in the western half of the HII region, we assumed the HII region to consist of two identical halves; we therefore integrated the flux density over the “free” eastern half of the ionized sphere and assumed that for the complete region it is just twice this value. Using the 1.4 GHz VLA image we estimated 3 Jy, which agrees with previous estimations, = 2.6 Jy (Kuchar & Clark, 1997), and = 2.8 Jy (Paladini et al., 2003) for a spectral index = 0.1 () typical for the optically thin regime of HII regions. For an HII region with T= 104 K placed at a distance of 3 kpc, the total amount of ionizing photons needed to keep the source ionized turns out to be about . Based on the ionizing fluxes for massive stars given by Schaerer & de Koter (1997), we infer that the ionizing star cannot be later than O9.5 V. However, this is only a coarse limit. The exciting star is probably earlier than O9.5 since if the observed infrared emission originates in dust heated by stellar radiation, part of the UV radiation is dissipated in this way.
To estimate the dynamical age of the HII region it is important to determine the center from which the ionized gas is expanding. Based on the infrared and radio continuum emission distribution we identify an almost circular morphology for the HII region G034.80.7. Figure 9 (left) shows that infrared emission at 8 m (green) clearly delineates the southeastern border of the HII region, while the border where IRAS 18542+0114 is located is diffuse and fainter. To better delineate this border we inspected a tomographic map traced between 74 and 324 MHz towards W44 (see Fig. 9º,(right)). In a radio study of SNR W44, Castelletti et al. (2007) found a curious spectral index inversion on the southeastern limb of W44 that appears as an indentation in the SNR boundary. There, the spectrum changes from a negative value corresponding to the SNR synchrotron radiation (spectral index ) to . In Fig. 9 (right) darker regions correspond to a negative spectral index. We propose that the spectral inversion must be the result of free-free absorption produced by thermal ionized gas naturally explained by the presence of the HII region G034.80.7 located between us and the SNR. In this way, we can delineate the northwestern border of the HII region where IRAS 18542+0114 is located, thus determining the probable center of the expanding HII region.
By adopting the radii R1=3pc and R2=4pc for IRAS 18544+0112 and IRAS 18542+0114, respectively, an ambient density in the region of less than 103 cm-3 and as the exciting agent for the HII region an O9.5 star, we derived dynamical ages of about 0.6 and 1.2 yr for the HII region at the position of IRAS 18544+0112 and IRAS 18542+0114, respectively. An age difference of 6 yr is compatible with the observed different evolutive stages of both IR sources.
The remaining question is whether the expansion of the SNR W44 had some influence in the processes observed in this molecular complex. Based on the age of the associated pulsar, Wolszczan et al. (1991) estimated an age of about yr for the SNR W44. Thus, the possibility that the SNR W44 has triggered the star formation in this region seems unlikely.
8 Summary
We present a molecular and infrared analysis of the IR source IRAS 18544+0112. The main results can be summarized as follows:
(a) We find 12CO J=3–2 self-absorbed profiles, which are typical of star forming regions. However, we do not detect any evidence of an outflow activity in IRAS 18544+0112 either in the molecular lines or in the infrared emission distribution.
(b) The analysis of the 12CO J=3–2 line suggests the presence of expanding molecular gas in the region.
(c) Based on its morphology, infrared and molecular parameters, and the non detection of ionized gas, we suggest that IRAS 18544+0112 is an evolved high mass protostellar object which has not yet reached the ultracompact HII region stage.
(d) From a near-infrared photometric analysis of the point sources observed towards IRAS 18544+0112 we propose that 2MASS 18565878+0116233 source (source three in the text) is the MYSO candidate most likely associated with IRAS 18544+0112.
(e) Based on the observational evidence that the HII region G034.80.7 is perturbing the neighboring molecular clouds we suggest that it has triggered at least two star forming regions, IRAS 18542+0114 and IRAS 18544+0112 , during its expansion.
Acknowledgements.
S.P. is grateful to the staff of ASTE for the support received during the observations, especially to Juan Cortés. S.P. acknowledges the support of Viviana Guzmán during the observations. M.O. is a doctoral fellow of CONICET, Argentina. S.P., S.C., G.C., and G.D. are members of the Carrera del Investigador Científico of CONICET, Argentina. This work was partially supported by Argentina grants awarded by CONICET, UBA and ANPCYT. M.R. is supported by the Chilean Center for Astrophysics FONDAP No. 15010003. M.R. and S.P. acknowledge support from FONDECYT N∘ 1080335. This work has made use of GLIMPSE and MIPSGAL data obtained with the Spitzer Space Telescope, which is operated by the Jet Propulsion Laboratory, California Institute of Technology, under NASA contract 1407. We also used data products from the Two Micron All Sky Survey, the NASA/IPAC Infrared Science Archive, which is operated by the Jet Propulsion Laboratory, California Institute of Technology, under contract with NASA. We are grateful to the anonymous referee, whose comments and suggestions led to the improvement of this Paper.References
- Ball et al. (1996) Ball, R., Meixner, M. M., Keto, E., Arens, J. F., & Jernigan, J. G. 1996, AJ, 112, 1645
- Bessell & Brett (1988) Bessell, M. S. & Brett, J. M. 1988, PASP, 100, 1134
- Castelletti et al. (2007) Castelletti, G., Dubner, G., Brogan, C., & Kassim, N. E. 2007, A&A, 471, 537
- Cesarsky et al. (1996) Cesarsky, D., Lequeux, J., Abergel, A., et al. 1996, A&A, 315, L309
- Chaisson (1976) Chaisson, E. J. 1976, in Frontiers of Astrophysics, 259–351
- Chan & Fich (1995) Chan, G. & Fich, M. 1995, AJ, 109, 2611
- Comerón et al. (2005) Comerón, F., Schneider, N., & Russeil, D. 2005, A&A, 433, 955
- Condon et al. (1998) Condon, J. J., Cotton, W. D., Greisen, E. W., et al. 1998, AJ, 115, 1693
- Cyganowski et al. (2008) Cyganowski, C. J., Whitney, B. A., Holden, E., et al. 2008, AJ, 136, 2391
- Deharveng et al. (2005) Deharveng, L., Zavagno, A., & Caplan, J. 2005, A&A, 433, 565
- Draine & Lee (1984) Draine, B. T. & Lee, H. M. 1984, ApJ, 285, 89
- Dyson & Williams (1980) Dyson, J. E. & Williams, D. A. 1980, Physics of the interstellar medium (New York, Halsted Press, 1980. 204 p.)
- Elmegreen & Lada (1977) Elmegreen, B. G. & Lada, C. J. 1977, ApJ, 214, 725
- Ezawa et al. (2004) Ezawa, H., Kawabe, R., Kohno, K., & Yamamoto, S. 2004, in Presented at the Society of Photo-Optical Instrumentation Engineers (SPIE) Conference, Vol. 5489, Society of Photo-Optical Instrumentation Engineers (SPIE) Conference Series, ed. J. M. Oschmann, Jr., 763–772
- Guan et al. (2008) Guan, X., Wu, Y., & Ju, B. 2008, MNRAS, 391, 869
- Hogerheijde et al. (1998) Hogerheijde, M. R., van Dishoeck, E. F., Blake, G. A., & van Langevelde, H. J. 1998, ApJ, 502, 315
- Hughes & MacLeod (1994) Hughes, V. A. & MacLeod, G. C. 1994, ApJ, 427, 857
- Jackson et al. (2006) Jackson, J. M., Rathborne, J. M., Shah, R. Y., et al. 2006, ApJS, 163, 145
- Johnstone et al. (2003) Johnstone, D., Boonman, A. M. S., & van Dishoeck, E. F. 2003, A&A, 412, 157
- Kobayashi et al. (2008) Kobayashi, N., Yasui, C., Tokunaga, A. T., & Saito, M. 2008, ApJ, 683, 178
- Kuchar & Clark (1997) Kuchar, T. A. & Clark, F. O. 1997, ApJ, 488, 224
- Kumar & Grave (2007) Kumar, M. S. N. & Grave, J. M. C. 2007, A&A, 472, 155
- Leger & Puget (1984) Leger, A. & Puget, J. L. 1984, A&A, 137, L5
- Lehtinen (1997) Lehtinen, K. 1997, A&A, 317, L5
- Leung (1978) Leung, C. M. 1978, ApJ, 225, 427
- Melioli et al. (2006) Melioli, C., de Gouveia Dal Pino, E. M., de La Reza, R., & Raga, A. 2006, MNRAS, 373, 811
- Molinari et al. (1996) Molinari, S., Brand, J., Cesaroni, R., & Palla, F. 1996, A&A, 308, 573
- Paladini et al. (2003) Paladini, R., Burigana, C., Davies, R. D., et al. 2003, A&A, 397, 213
- Paron et al. (2009) Paron, S., Ortega, M. E., Rubio, M., & Dubner, G. 2009, A&A, 498, 445
- Pomarès et al. (2009) Pomarès, M., Zavagno, A., Deharveng, L., et al. 2009, A&A, 494, 987
- Rawlings et al. (2004) Rawlings, J. M. C., Redman, M. P., Keto, E., & Williams, D. A. 2004, MNRAS, 351, 1054
- Rieke & Lebofsky (1985) Rieke, G. H. & Lebofsky, M. J. 1985, ApJ, 288, 618
- Schaerer & de Koter (1997) Schaerer, D. & de Koter, A. 1997, A&A, 322, 598
- Skrutskie et al. (2006) Skrutskie, M. F., Cutri, R. M., Stiening, R., et al. 2006, AJ, 131, 1163
- Sridharan et al. (2002) Sridharan, T. K., Beuther, H., Schilke, P., Menten, K. M., & Wyrowski, F. 2002, ApJ, 566, 931
- Stil et al. (2006) Stil, J. M., Taylor, A. R., Dickey, J. M., et al. 2006, AJ, 132, 1158
- Vanhala & Cameron (1998) Vanhala, H. A. T. & Cameron, A. G. W. 1998, ApJ, 508, 291
- Whitworth et al. (1994a) Whitworth, A. P., Bhattal, A. S., Chapman, S. J., Disney, M. J., & Turner, J. A. 1994a, A&A, 290, 421
- Whitworth et al. (1994b) Whitworth, A. P., Bhattal, A. S., Chapman, S. J., Disney, M. J., & Turner, J. A. 1994b, MNRAS, 268, 291
- Wolszczan et al. (1991) Wolszczan, A., Cordes, J. M., & Dewey, R. J. 1991, ApJ, 372, L99
- Zavagno et al. (2006) Zavagno, A., Deharveng, L., Comerón, F., et al. 2006, A&A, 446, 171
- Zhou (1992) Zhou, S. 1992, ApJ, 394, 204
- Zhou et al. (1993) Zhou, S., Evans, II, N. J., Koempe, C., & Walmsley, C. M. 1993, ApJ, 404, 232