A Possible -ray Quasi-periodic Oscillation of 314 days in the Blazar OJ 287
Abstract
We report the detection of a probable -ray quasi-periodic oscillation (QPO) of around 314 days in the monthly binned 0.1 – 300 GeV -ray Fermi-LAT light curve of the well known BL Lac blazar OJ 287. To identify and quantify the QPO nature of the -ray light curve of OJ 287, we used the Lomb-Scargle periodogram (LSP), REDFIT, and weighted wavelet z-transform (WWZ) analyses. We briefly discuss possible emission models for radio-loud active galactic nuclei (AGN) that can explain a -ray QPO of such a period in a blazar. Reports of changes in the position of quasi-stationary radio knots over a yearly timescale as well as a strong correlation between gamma-ray and mm-radio emission in previous studies indicate that the signal is probably associated with these knots.
keywords:
BL Lac objects: individual: OJ 287 – galaxies: active – galaxies: jets – radiation mechanisms: non-thermal – gamma-rays: galaxies1 Introduction
Blazars are extremely variable active galactic nuclei (AGNs) with overall emission dominated by a relativistic jet that is aligned at close angles to our line of sight. They have been found to exhibit large amplitude flux variability spanning the entire accessible electromagnetic spectrum on all time scales feasible by the current observing facilities and available data (e.g. Goyal, et al., 2018; Hudec et al., 2013; Sillanpää et al., 1988; Visvanathan & Elliot, 1973). The observed flux variability is generally stochastic and broadly shares the scale-free statistical properties exhibited by accretion-powered sources (Kushwaha et al., 2016, 2017). So, regardless of the underlying emission mechanisms and detailed physical attributes this implies that accretion physics is the main driver.
Flux variability on diverse timescales is one of the hallmark properties of accretion-powered sources. In fact, based on statistical similarities of flux variations, AGNs have been claimed to be a scaled-up version of Galactic black hole X-ray binaries (BHXBs) (e.g. Scaringi, et al., 2015, and references therein). Yet detection of quasi-periodic oscillations (QPOs) is rare in blazars, while it is a relatively common phenomena in BHXBs. Further, almost all the detected QPOs in BHXBs are transient, and widely believed to be related to their accretion (disc) (Lyubarskii, 1997; Arévalo & Uttley, 2006; Scaringi, et al., 2015). On the contrary, in AGNs, QPOs have been observed to be both transient (e.g. Carrasco, Dultzin-Hacyan, & Cruz-Gonzalez, 1985; Visvanathan & Elliot, 1973; Valtaoja et al., 1985; Pihajoki, Valtonen & Ciprini, 2013; Gupta, Srivastava & Wiita, 2009; Lachowicz, et al., 2009), which constitute the majority of the reported claims, as well as persistent (e.g. Sillanpää et al., 1988; Hudec et al., 2013; Tavani et al., 2018). AGN, being accretion powered, transient putative QPOs are expected naturally based on the similarity with BHXBs, while the apparently permanent ones can be due to jet precession and/or be a prime signal of the host being a supermassive BH (SMBH) binary (e.g. Sillanpää et al., 1988; Tavani et al., 2018), as expected in the hierarchical model of cosmological evolution. Thus, exploration of such signals in blazar time series is a key approach to investigate the still not fully understood accretion physics and the connection between central engine, accretion, and jet, in addition to searching for SMBH binaries.
Searches for periodicity in blazars and AGNs generally have been very challenging, mainly due to limitations associated with operation of observing facilities leading to gaps in the data and the huge range of energy dependent temporal variability shown by these sources (e.g. Pihajoki, Valtonen & Ciprini, 2013). To date, QPOs have been reported in only a handful of blazars and these span a huge range of timescales: from a few tens of minutes (e.g. Visvanathan & Elliot, 1973; Valtaoja et al., 1985), through a few hours (e.g. Gupta, Srivastava & Wiita, 2009), and months (e.g. Pihajoki, Valtonen & Ciprini, 2013; Sandrinelli et al., 2016; Gupta et al., 2019) to decades (Sillanpää et al., 1988) and in different energy bands. The majority of these detection claims are marginal as of now (e.g Gupta et al., 2019, and references therein). With AGN variability being stochastic and dominated by red/flicker-noise, searches for QPO signals are fraught with risks and demand high quality data and thus is still an evolving research field.
OJ 287 (; Sitko & Junkkarinen, 1985) is a BL Lacartae (BL Lac) object – a subclass of blazar characterized by very weak or complete absence of emission lines in their optical spectra. The source is famously known for its double-peaked outbursts in optical bands which repeat every 12-yr (Sillanpää et al., 1988). Ever since the discovery of OJ 287 (VRO 20.08.01; Dickel et al., 1967) and the identification of an optical counterpart in 1970 (Blake, 1970), it has been a prime target of observations, owing to a variety of observationally favorable properties, including high and correlated multi-wavelength activities (Blake, 1970; Sitko & Junkkarinen, 1985, and references therein). In fact, a 39.2 minute QPO signal was reported by Visvanathan & Elliot (1973) in one of the earliest targeted optical observations of the source (see also Frohlich, Goldsmith & Weistrop, 1974). They also successfully extracted its historic optical light curve from records dating back to 1894 and found four high activity periods, each lasting over several months.
A wide range of observational features in different energy bands have made OJ 287 an ideal astrophysical laboratory to probe a complete spectrum of problems pertaining to blazars, ranging from jet dynamics (Britzen, et al., 2018; Qian, 2019, and references therein), high energy emission mechanisms (Kushwaha, 2020; Kushwaha, et al., 2018b; Kushwaha et al., 2018a; Kushwaha, Sahayanathan, & Singh, 2013; Kushwaha, et al., 2018c, and references therein) to the general theory of relativity (Dey, et al., 2018, and references therein). Extensive and intensive temporal investigations on a wide range of timescales has led to claims of a diverse range of QPOs in OJ 287 ranging from a few tens of minutes (e.g. Visvanathan & Elliot, 1973; Valtaoja et al., 1985), to a few months (e.g. Pihajoki, Valtonen & Ciprini, 2013), to years (e.g. Donskykh, 2016; Sandrinelli et al., 2016; Britzen, et al., 2018) to decades (e.g. Sillanpää et al., 1988) in various bands of the EM spectrum. In many cases, studies have reported conflicting/different results for observations during similar periods. For example, Valtaoja et al. (1985) reported of a -min QPO in radio and optical for 1981 – 1983 while Carrasco, Dultzin-Hacyan, & Cruz-Gonzalez (1985) reported a roughly -min QPO in the optical in 1983 – 1984. The same was the case with the -min QPO in the optical reported by Visvanathan & Elliot (1973) during 1972 which was also found by Frohlich, Goldsmith & Weistrop (1974) but not by Kiplinger (1974). To the best of our knowledge, OJ 287 is the blazar (and AGN) for which the highest number of QPO claims have been made.
Here, we present our work on a search for possible QPOs in the 9.5-yr (August 5, 2008 – February 5, 2018) long Fermi-LAT -ray light curve of OJ 287 derived by binning it into 30-day intervals. One of our motivations has been the finding of a probable yearly timescale periodicity of the location of quasi-stationary radio knots (Britzen, et al., 2018) and the correlation between -ray emission and these knots (Agudo et al., 2011). In §2, we summarize the data and the reduction procedure used to extract the light curve. §3 presents the results from different methods of QPO analyses, followed by our discussion, inferences, and conclusions in §4.
2 Fermi -ray Data
The Large Area Telescope (LAT) onboard the space based Fermi observatory is currently the best sensitive facility in the MeV-GeV (20 MeV) energy range, continuously surveying the sky every 90 minutes since August 2008 (Atwood et al., 2009). Though it is capable of detecting photon events between 20 MeV to TeV energies, a large point spread function (PSF) at low energies (100 MeV) and uncertainty in photon-particle events separations make those low energy results unreliable,111There is confusion as to whether those detected photons are from the source of interest or due to many sources within the PSF or a particle event tagged as a photon event. while the low event statistics at GeV make short term studies infeasible in that range.
For extracting the light curve, we used the Fermitool (version 1.0.1) and followed the standard data reduction procedure. We used the LAT data processed with the PASS8 () instrument response function and selected the “SOURCE” class events from a circular region of 15∘ centered on the source with energies between 100 MeV to 300 GeV. At the same time, a zenith angle cut of 90∘ was employed to avoid -ray confusion from the Earth’s limb. We used the time filter expression “”, the standard prescription for generating the good time intervals. Following this, we calculated the exposure for the events on the adopted circular source region plus an additional 10∘ annulus around it.
The photon flux was extracted through unbinned likelihood analysis provided within the software using an input spectral model XML file. The input XML model file is comprised of the Galactic (gll_iem_v06) and isotropic extra-galactic (iso_P8R2_SOURCE_V6_v06) contributions though their respective templates and all the point sources within the angular extension covered by the exposure map. It was generated using the 3rd Fermi-LAT source catalog (3FGL; Acero et al., 2015) in which the source spectrum has been described as a log-parabola. The fit was performed iteratively by removing sources contributing insignificantly, measured by a Test Statistic (TS) value of 0 until the optimization converged (e.g. Kushwaha, Singh, & Sahayanathan, 2014). The 0.1-300 GeV photon flux light curve of the source, after applying a TS cut of 9.0 — equivalent to a 3 detection — is shown in Figure 1.

3 QPO Analysis and Estimation
We employed three different methods to search for periodicities: Lomb-Scargle periodogram (LSP); REDFIT analysis; and wavelet z-transform (WWZ), We used their basic underlying statistics to access the significance of features. The LSP and REDFIT are both global, in the sense that they treat the whole time series in a go, while the wavelet z-transform is local and looks for periodicities around each of the data points.
3.1 Lomb-Scargle Periodogram
The Lomb-Scargle (L-S) periodogram is one of the basic and most widely used methodologies in time series analyses to look for periodicities (Lomb, 1976; Scargle, 1982), primarily due to its ability to handle non-uniformly sampled data, which are the norm in astronomical observations (Ferraz-Mello, 1981). The method is basically a projection of the time series on sinusoidal functions and is equivalent to a fit statistic for uniformly sampled data and a weighted fit statistic for non-uniformly sampled data (Ferraz-Mello, 1981). The statistics then in turn allow assessment of the significance of features as signals of interest if any are present. For more details, see Gupta et al. (2019) and references therein.
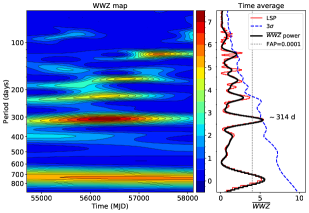
The right panel of Fig. 2 shows the normalized power of the Lomb-Scargle periodogram for the extracted Fermi-LAT data. The dotted line indicates the 99.99% significance level which corresponds to the false alarm probability (FAP) of 0.0001. However, this FAP significance estimate strictly holds only for Gaussian type random noise, while AGNs show red-noise variability. Thus, we estimated the significance against the red-noise spectrum of the observed light curve by simulating 1000 light curves (see §3.4), shown by the blue dashed curve in the right panel of Figure 2. The analysis revealed a signal centred at days with a significance of . This signal could be a QPO, but it requires support from other methods.
3.2 Wavelet Analysis
Wavelet analysis is a powerful technique which is used for searching the periodicities in the data by decomposing the signal into frequency-time space simultaneously. In other words, this technique measures the non-stationarity of the dataset and indicates the temporal extent of any possible periodic feature. For more details on our approach see Gupta, et al. (2018, and references therein). Here, we used the WWZ222https: //www.aavso.org/software-directory software which uses the wavelet z-transform method to search and assess the significance of any periodicities present in the data (e.g. King et al., 2013; Bhatta et al., 2016; Bhatta, 2019; Zhang et al., 2017, 2018, and references therein).
The left panel of Fig. 2 shows a color density plot of the WWZ power for the OJ 287 -ray data as a function of both time and frequency. The right panel shows the time averaged WWZ power as a function of frequency. The WWZ method also shows a highly significant signal at days, corroborating the LS result. Further, the signal is persistent for most of the time duration.
3.3 REDFIT Analysis
As already mentioned, the light curves of AGNs are generally dominated by red-noise which originates due to some stochastic processes in the accretion disc, or jet, in the case of blazars (e.g., Fan et al., 2014; Xiong et al., 2017; Hong et al., 2018, and references therein). Red-noise spectra are characteristic of auto-regressive (AR) processes where activity at an instant is related to past activities (e.g. Schulz & Mudelsee, 2002; Fan et al., 2014; Zhang et al., 2018; Xiong et al., 2017; Hong et al., 2018; Gupta, et al., 2018). AGN emissions are generally autoregressive and usually can be convincingly modeled using an AR1 process where the present emission depends on the emission that immediately precedes it, i.e.,
| (1) |
where is the flux at time and , is the average autocorrelation coefficient, is the timescale of the autoregressive process, and is a Gaussian distributed random variable with zero mean and unit variance. The theoretical power spectrum of an AR1 process is given by (Schulz & Mudelsee, 2002)
| (2) |
where is the average spectral amplitude, are the frequency points and is the Nyquist frequency. The code REDFIT (Schulz & Mudelsee, 2002) estimates the spectrum using LSP in combination with Welch-Overlapped-Segment-Averaging. The resulting spectrum is then modeled using Equation 2 and calculates the significance of the powers in the periodogram.
In the REDFIT method, where the additional factor is to avoid the noisy high frequency end of the spectrum affecting the fit given by equation 2. This factor can be found through the non-parametric test employed in REDFIT to check the consistency of the theoretical spectrum with that of the data spectrum. The value of , on the other hand, is determined by demanding that area under the theoretical spectrum is same as the variance of the data.
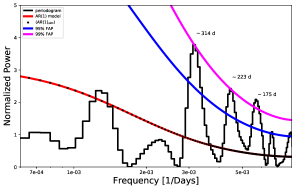
Both the LS and WWZ methods show a signal of days, with the WWZ result revealing that most of the power of this signal is seen during the central portion of the time series. Hence, we used a triangular window in the REDFIT method. Running REDFIT resulted in , while the statistical consistency of theoretical AR1 spectrum and data spectrum resulted in . The resulting bias-corrected power spectrum (black) is shown along with the AR1 spectrum (red) in Fig. 3. The blue and magenta curves correspond to significance levels of 95% and 99%, respectively, derived from the simulation of 2000 instances of the best-fit spectrum given by Equation 2. The bias corrected mean of these simulated spectra is also over-plotted above the AR1 spectrum (red) for comparison.
The method suggests three time scales with significance 99%. The lowest frequency peak corresponds to a period of about d, coinciding with the QPO revealed by LS and WWZ. The subsequent higher frequencies correspond to periods of d and d, respectively, but these are without any counterparts in the LSP and WWZ analyses. Given that Sandrinelli et al. (2016) have reported a d period in near-infrared (NIR) K-band data of OJ 287, the d feature could be a harmonic of that component while the d signal seems to be an alias of the d QPO identified by all the methods employed here. It should, however, be noted that a d period claimed by Sandrinelli et al. (2016) is not significant in the REDFIT output – neither in the Fermi-LAT -ray light curve nor in the optical R-band light curve. To further understand this discrepancy, we checked the coverage of the SMARTS K band data on OJ 287 and found that it has a very poor coverage, at of the considered duration. As both LAT and R band are sampled better than the NIR K-band, we believe the claimed signal to be an outcome related to data sampling. Further, Sandrinelli et al. (2016) have used a 2 threshold for considering LAT data points for time seeries analysis compared to the more commonly accepted 3 criterion.
3.4 Significance estimation
Two independent methods were used for the estimation of the significance of the dominant period. The first method, which is employed by REDFIT, is similar to that of Vaughan (2005) where the significance is estimated from the distribution of periodogram points about the model. However, contrary to Vaughan (2005), where the assumed model is a power-law, REDFIT uses Equation 2, thereby preventing underestimation of PSD peak significances, especially at low frequencies.
Along with the above analytical method for significance estimation, a Monte-Carlo method was also used to get the significance of the LSP as well as WWZ peaks. One thousand light curves, having the same PSD and flux distribution, were simulated using the approach of Emmanoupoulos et. al. (2013). From the distribution of PSD power at each frequency, the significance level was estimated.
To determine the PSD model for generating artificial time series used for significance estimation as mentioned above, we performed maximum-likelihood estimates of the data PSD. We modeled the data PSD both with a power-law and a bending power-law model given by
| (3) |
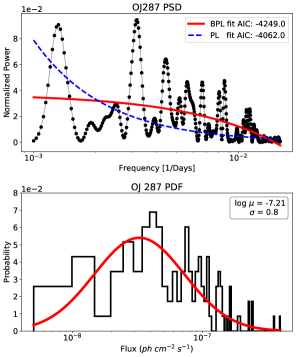
where and are the two spectral indices and is the bending frequency. The Akaike information criterion (AIC) was used to determine the best-fit model. The fitted models and the corresponding AIC values are shown in the top panel of Figure 4. As per the AIC value, a bending power-law, with parameter values of , and is favored over the power-law. For the flux distribution, a log-normal distribution, as shown in the bottom panel of Figure 4, was found to describe it well.
We further verified the detected QPO duration by extracting Fermi-LAT light curves with binnings of 21 d and 15 d. Analyses of both of these light curves using the above mentioned methods and procedures also show the d signal, though the significance is slightly lower in the 15 d bin light curve ().
4 Discussion and Conclusions
We found a highly probable QPO of about 314 days in the 9.5 yr long -ray light curve of OJ 287, extracted from 30-day binning of the Fermi-LAT survey mode data. The signal is consistently identified by all the three methods commonly used to explore time series of blazars/AGNs and in astronomy in general. Further, examination of the wavelet z-transform (Figure 2) shows that the signal is clearly present at least for about 8 cycles and seems to weakened/disappeared after MJD 57400, strongly indicating that it is not a manifestation of a stochastic feature associated with a flicker/red-noise time series. It should be noted that for broadband, photon statistics limited observing facilities/instruments such as Fermi-LAT here, the observed photon flux is highly dependent on the spectral state of the source and a change in spectral state can mask a real change in photon flux in case the increment is mainly at the high end of the instrument-energy-band (e.g. Kushwaha, et al., 2018b). In such a case, even if the signal is present, it will not be reflected in the observed photon flux (see Kushwaha, et al., 2018c) and thus will be missed by the analysis method. Further, even though Fermi-LAT survey data in principle allow for temporal variation studies on time-scales as short as 1.5 hours and even less, none of the currently known Fermi-LAT AGN sources are bright enough to allow a high quality, homogeneously sampled continuous light curve on those short timescales over the Fermi-LAT operation period. Given that blazar variability is essentially stochastic, a high quality, continuous, and homogeneously sampled data train is required to negate the artifacts associated with gaps in the data. So the challenges associated with finding QPO signals in these time series are major, despite substantial methodological progress in the field.
Since OJ 287 is a BL Lac type of blazar, where accretion provides the ultimate source of power but boosted jet radiation dominates the entire emission, such a QPO signal can be a manifestation of many aspects of interactions between the entities that constitute an AGN and affect jet emission. These include frequently suggested accretion disc scenarios (e.g. Pihajoki, Valtonen & Ciprini, 2013; Bhatta et al., 2016, and references therein), a precessing jet due to gravitational interaction with another massive object (Britzen, et al., 2018; Qian, 2019), binary SMBH dynamical interaction scenarios (e.g. Sillanpää et al., 1988; Dey, et al., 2018, and references therein), a jet scenario driven by plasma instabilities or turbulence (Marscher, 2014; Pollack, Pauls & Wiita, 2016), or a combination of these. Though BL Lacs in general are believed to have usually undetectable accretion disc contributions to their observed emission within our current level of observational capabilities, some of these have been inferred to have an active, dynamic accretion disc (e.g. OJ 287; Sillanpää et al., 1988; Kushwaha et al., 2018a). For OJ 287, it has been argued to be a dynamic system comprised of a pair of SMBHs (Dey, et al., 2018, and references therein).
QPOs of diverse timescales have been reported in OJ 287 in different energy bands. In optical bands, a 39.2-minute periodicity was suggested in 1972 observations (Visvanathan & Elliot, 1973) and a 23-minute periodicity was claimed in 1983 observations (Carrasco, Dultzin-Hacyan, & Cruz-Gonzalez, 1985). Some evidence of possible optical quasi-periods of a few hours and 50 days (Pihajoki, Valtonen & Ciprini, 2013), 400 days (Bhatta et al., 2016), and a persistent 12 yrs QPO (Sillanpää et al., 1996) have also been reported. The 12-yr QPO is most frequently attributed to the source being a binary SMBH system with the temporal signal resulting from the impact of the secondary SMBH on the accretion disc of the primary (Sillanpää et al., 1988; Valtonen et al., 2008, but see Britzen, et al. (2018); Qian (2019)). This model has been reasonably successful in predicting the timing of subsequent flares (Dey, et al., 2018). On the other hand, almost all optical QPOs on timescales of year and shorter have been argued to be associated, one way or another, with accretion disc fluctuations, either directly (e.g. Bhatta et al., 2016; Pihajoki, Valtonen & Ciprini, 2013) and/or through a disc modulation imprinted onto the jet with relativistic effects shortening the apparent period (e.g. Gupta et al., 2012). The accretion disc origin for optical QPOs is primarily motivated from observation of QPOs in accretion-powered sources and observational (big blue bump) support for SMBH/AGN disc emission being in optical-UV bands.
As is the case in optical bands, several possible QPOs have been reported in radio bands as well, e.g. a 15.7-minute periodicity by Valtaoja et al. (1985) in the observations taken 1981 at 37 GHz frequency, while indications of QPOs of periods from about a year up to 7.5 years have been reported by Hughes, Aller & Aller (1998) and Donskykh (2016) at 4.8 GHz, 8.0 GHz, and 14.5 GHz. Since emission at radio frequencies arises from the jet, the radio QPOs have been argued to be either due to dynamics in the jet such as shocks (e.g. Hughes, Aller & Aller, 1998) or precession (e.g Britzen, et al., 2018; Qian, 2019). In fact, nearly periodic variability is not limited to flux but also seems to be present in the positional location of quasi-stationary VLBA features (called knots) seen in radio images at 15 GHz (Britzen, et al., 2018). The quasi-stationary features seem to vary over roughly 1 yr periods while the moving VLBA features suggest 22 yr periodic variations. Based on these observations, Britzen, et al. (2018) have argued OJ 287 to be a system with a precessing and rotating jet (see also Qian, 2019).
For the QPO signal of 314 days reported here in the -ray band of OJ 287, both accretion disc based variations, through their imprint on the jet, as well as a purely jet based origin seem plausible. In the disc-imprint-on-the-jet based interpretation, a tempting possibility is that the roughly 12-yr optical QPO signal, attributed to the impact of the secondary SMBH on the accretion disc of the primary, could manifest on timescales of less than a year by temporal compression by the Doppler factor (14) inferred for the jet (Agudo et al., 2011). However, jet emission being broadband, this also implies expected QPO signals across many electromagnetic bands with similar temporal profiles unless there is strong spectral change, such as the observed MeV-GeV spectral changes during its first detected VHE activity (Kushwaha, et al., 2018b). Unfortunately, temporal coverage in other bands is rather too sparse to either pin-point or rule out this possibility. Given a totally jet-dominated emission in OJ 287, a sub-yearly modulation of the quasi-stationary jet features/knots (Britzen, et al., 2018) and the association of -rays with these knots (Agudo et al., 2011), a precessing jet seems to provide a probable mechanism for the observed -ray QPO.
Acknowledgements
The authors thank the referee for constructive comments and suggestions. PK acknowledges support from A-PDF grant (AO/A-PDF/770) and partial support from FAPESP grant no. 2015/13933-0. AS acknowledges support of the Department of Atomic Energy, Government of India, under project no. 12-R&D-TFR-5.02-0200.
The Fermi-LAT Collaboration acknowledges support for LAT development, operation and data analysis from NASAand DOE (United States), CEA/Irfu and IN2P3/CNRS(France), ASI and INFN (Italy), MEXT, KEK, and JAXA(Japan), and the KA Wallenberg Foundation, the SwedishResearch Council and the National Space Board (Sweden).Science analysis support in the operations phase from INAF (Italy) and CNES (France) is also gratefully acknowledged.
Data Availability
The datasets were derived from sources in the public domain: [Fermi-LAT, https://fermi.gsfc.nasa.gov/cgi-bin/ssc/LAT/LATDataQuery.cgi] The derived data generated in this research will be shared on reasonable request to the corresponding author.
References
- Acero et al. (2015) Acero F., et al., 2015, ApJS, 218, 23
- Agudo et al. (2011) Agudo I., et al., 2011, ApJ, 726, L13
- Arévalo & Uttley (2006) Arévalo P., Uttley P., 2006, MNRAS, 367, 801
- Atwood et al. (2009) Atwood W. B., et al., 2009, ApJ, 697, 1071
- Bhatta et al. (2016) Bhatta G., et al., 2016, ApJ, 832, 47
- Bhatta (2019) Bhatta G., 2019, MNRAS, 487, 3990
- Blake (1970) Blake G. M., 1970, ApL, 6, 201
- Britzen, et al. (2018) Britzen S., et al., 2018, MNRAS, 478, 3199
- Carrasco, Dultzin-Hacyan, & Cruz-Gonzalez (1985) Carrasco L., Dultzin-Hacyan D., Cruz-Gonzalez I., 1985, Natur, 314, 146
- Dey, et al. (2018) Dey L., et al., 2018, ApJ, 866, 11
- Dickel et al. (1967) Dickel J. R., Yang K. S., McVittie G. C., Swenson G. W., 1967, AJ, 72, 757
- Donskykh (2016) Donskykh G., 2016, BaltA, 25, 237
- Emmanoupoulos et. al. (2013) Emmanoulopoulos, D., McHardy, I. M. & Papadakis, I. E., 2013, MNRAS, 433, 907
- Fan et al. (2014) Fan, J. H., Kurtanidze, O., Liu, Y., et al. 2014, ApJS, 213, 26
- Ferraz-Mello (1981) Ferraz-Mello S., 1981, AJ, 86, 619
- Frohlich, Goldsmith & Weistrop (1974) Frohlich A., Goldsmith S., Weistrop D., 1974, MNRAS, 168, 417
- Goyal, et al. (2018) Goyal A., et al., 2018, ApJ, 863, 175
- Gupta, Srivastava & Wiita (2009) Gupta A. C., Srivastava A. K., Wiita P. J., 2009, ApJ, 690, 216
- Gupta et al. (2016) Gupta A. C., et al., 2016, MNRAS, 458, 1127
- Gupta, et al. (2018) Gupta A. C., Tripathi A., Wiita P. J., Gu M., Bambi C., Ho L. C., 2018, A&A, 616, L6
- Gupta et al. (2019) Gupta, A. C., Tripathi, A., Wiita, P. J., et al. 2019, MNRAS, 484, 5785
- Gupta et al. (2012) Gupta S. P., Pandey U. S., Singh K., Rani B., Pan J., Fan J. H., Gupta A. C., 2012, NewA, 17, 8
- Hong et al. (2018) Hong, S., Xiong, D., & Bai, J. 2018, AJ, 155, 31
- Hudec et al. (2013) Hudec R., Bašta M., Pihajoki P., Valtonen M., 2013, A&A, 559, A20
- Hughes, Aller & Aller (1998) Hughes P. A., Aller H. D., Aller M. F., 1998, ApJ, 503, 662
- King et al. (2013) King O. G., et al., 2013, MNRAS, 436, L114
- Kiplinger (1974) Kiplinger A. L., 1974, ApJL, 191, L109
- Kushwaha (2020) Kushwaha P., 2020, Galax, 8, 15
- Kushwaha, Sahayanathan, & Singh (2013) Kushwaha P., Sahayanathan S., Singh K. P., 2013, MNRAS, 433, 2380
- Kushwaha, Singh, & Sahayanathan (2014) Kushwaha P., Singh K. P., Sahayanathan S., 2014, ApJ, 796, 61
- Kushwaha et al. (2016) Kushwaha P., Chandra S., Misra R., Sahayanathan S., Singh K. P., Baliyan K. S., 2016, ApJ, 822, L13
- Kushwaha et al. (2017) Kushwaha, P., Sinha, A., Misra, R., Singh, K. P., & de Gouveia Dal Pino, E. M. 2017, ApJ, 849, 138
- Kushwaha et al. (2018a) Kushwaha P., et al., 2018a, MNRAS, 473, 1145
- Kushwaha, et al. (2018b) Kushwaha P., et al., 2018b, MNRAS, 479, 1672
- Kushwaha, et al. (2018c) Kushwaha P., de Gouveia Dal Pino E. M., Gupta A. C., Wiita P. J., 2018c, PoS (BHCB2018), 329, 022
- Lachowicz, et al. (2009) Lachowicz P., Gupta A. C., Gaur H., Wiita P. J., 2009, A&A, 506, L17
- Lomb (1976) Lomb N. R., 1976, Ap&SS, 39, 447
- Lyubarskii (1997) Lyubarskii Y. E., 1997, MNRAS, 292, 679
- Marscher (2014) Marscher A. P., 2014, ApJ, 780, 87
- Pihajoki, Valtonen & Ciprini (2013) Pihajoki P., Valtonen M., Ciprini S., 2013, MNRAS, 434, 3122
- Pollack, Pauls & Wiita (2016) Pollack M., Pauls D., Wiita P. J., 2016, ApJ, 820, 12
- Qian (2019) Qian S., 2019, arXiv:1904.03357
- Sandrinelli et al. (2016) Sandrinelli A., Covino S., Dotti M., Treves A., 2016, AJ, 151, 54
- Scargle (1982) Scargle J. D., 1982, ApJ, 263, 835
- Scaringi, et al. (2015) Scaringi S., et al., 2015, Science Advances, 1, e1500686
- Schulz & Stattegger (1997) Schulz, M., & Stattegger, K. 1997, Computers and Geosciences, 23, 929
- Schulz & Mudelsee (2002) Schulz, M., & Mudelsee, M. 2002, Computers and Geosciences, 28, 421
- Sillanpää et al. (1988) Sillanpää A., Haarala S., Valtonen M. J., Sundelius B., Byrd G. G., 1988, ApJ, 325, 628
- Sillanpää et al. (1996) Sillanpää A., et al., 1996, A&A, 305, L17
- Sitko & Junkkarinen (1985) Sitko M. L., Junkkarinen V. T., 1985, PASP, 97, 1158
- Tavani et al. (2018) Tavani M., Cavaliere A., Munar-Adrover P., Argan A., 2018, ApJ, 854, 11
- Valtaoja et al. (1985) Valtaoja E., et al., 1985, Natur, 314, 148
- Valtonen et al. (2008) Valtonen M. J., et al., 2008, Natur, 452, 851
- Vaughan (2005) Vaughan, S. 2005, A&A, 431, 391–403
- Visvanathan & Elliot (1973) Visvanathan N., Elliot J. L., 1973, ApJ, 179, 721
- Xiong et al. (2017) Xiong D., Bai J., Zhang H., Fan J., Gu M., Yi T., Zhang X., 2017, ApJS, 229, 21
- Zhang et al. (2017) Zhang P.-f., Yan D.-h., Liao N.-h., Wang J.-c., 2017, ApJ, 835, 260
- Zhang et al. (2018) Zhang P.-f., Zhang P., Liao N.-h., Yan J.-z., Fan Y.-z., Liu Q.-z., 2018, ApJ, 853, 193