A Rapid Ionization Change in the Nebular-Phase Spectra of the Type Ia SN 2011fe
Abstract
We present three new spectra of the nearby Type Ia supernova (SN Ia) 2011fe covering days after maximum light and show that the ejecta undergoes a rapid ionization shift at days after explosion. The prominent [Fe III] emission lines at Å are replaced with Fe I+Fe II blends at Å and Å. The Å feature, which is produced by [Fe II] +[Ni II] at days after explosion, is replaced by broad ( km s-1) symmetric [Ca II] emission. Models predict this ionization transition occurring days later than what is observed, which we attribute to clumping in the ejecta. Finally, we use the nebular-phase spectra to test several proposed progenitor scenarios for SN 2011fe. Non-detections of H and He exclude nearby non-degenerate companions, [O I] non-detections disfavor the violent merger of two white dwarfs, and the symmetric emission-line profiles favor a symmetric explosion.
1 Introduction
Type Ia supernovae (SNe Ia) are the thermonuclear explosions of carbon/oxygen (C/O) white dwarfs (WDs; Hoyle & Fowler, 1960) and produce the majority of iron-group elements in the Universe (e.g., Iwamoto et al., 1999). These stellar explosions attracted much attention due their use as standardizable candles (Phillips, 1993) but we still lack a genuine understanding of how and why some WDs explode as SNe Ia.
SN 2011fe was discovered hours after explosion by the Palomar Transient Facility (PTF; Law et al., 2009) in M101 at a mere (e.g., Shappee & Stanek, 2011) and became the brightest SN Ia in several decades. Additionally, SN 2011fe is the quintessential SN Ia (Pereira et al., 2013), making it an ideal object for testing SN Ia progenitor and explosion models (e.g., Röpke et al., 2012). This is especially important for nebular-phase observations when the ejecta becomes optically-thin to optical and NIR photons to provide a direct view to the inner ejecta.
Several studies have already analyzed spectra of SN 2011fe as it transitioned into the nebular phase. Shappee et al. (2013) and Lundqvist et al. (2015) searched for H emission indicative of a nearby donor star at the time of explosion and found none. McClelland et al. (2013) showed that the nebular-phase mid-infrared (MIR) decay is correlated with the nucleosynthetic yield. Mazzali et al. (2015) modeled a suite of photospheric- and nebular-phase spectra and claimed the existence of a stable iron core, although this remains debated (e.g., Botyánszki & Kasen, 2017). Finally, Taubenberger et al. (2015) and Graham et al. (2015a) analyzed spectra acquired days after maximum light, the latest spectra of a SN Ia to-date. They found that the emission characteristics were drastically different from the previous spectra at days. Models by Fransson & Jerkstrand (2015) show that the 1000-day spectrum is dominated by Fe I emission lines with minor contributions from Fe II and Ca. However, the spectroscopic evolution between days after explosion remains poorly understood. Friesen et al. (2017) briefly attempted to model the +576-day spectrum from Graham et al. (2015a) obtained by the Berkeley SuperNova Identification Program (BSNIP; Silverman et al., 2012) but the results were unsatisfactory and they focused on modeling earlier-phase spectra.
In this Letter we analyze new nebular-phase spectra of SN 2011fe acquired days after peak-light. Details about the data reduction and calibration are provided in §2. §3 presents the temporal evolution including a distinct change in the iron blends at Å and the appearance of [Ca II]. Constraints on the progenitor system and explosion mechanism are described in §4. Finally, we discuss the rapid ionization change in the context of SN Ia models and the use of [Ca II] as an ejecta diagnostic in §5. For our analysis we adopt the time of maximum-light in the -band of from Zhang et al. (2016). This is interchangeable with the time of explosion using the -day rise-time of SN 2011fe from Pereira et al. (2013). We use the distance to M101 of (Shappee & Stanek, 2011) as in previous studies and all phases are given relative to in the SN rest-frame.
2 New and Archival Spectra
| UT Date | PhaseaaRelative to . | Exp. Time |
|---|---|---|
| [days] | [s] | |
| 2013-01-05 | 482.6 | 14650 |
| 2013-05-01 | 598.4 | 10800 |
| 2014-01-06 | 848.2 | 10800 |
We obtained new spectroscopic observations of SN 2011fe days after maximum light with the Multi-Object Double Spectrograph (MODS; Pogge et al., 2010) on the Large Binocular Telescope (LBT). Details about the spectroscopic data reduction are described in Shappee et al. (2013). In brief, each frame is bias-subtracted and flat-fielded before detecting and removing cosmic rays with lacosmic (van Dokkum, 2001). Then, we extract the 1D spectrum with iraf and derive the wavelength calibration with arc-lamp frames. Finally, each spectrum is corrected for instrumental response and placed on a relative flux scale with standard star observations. Table 1 summarizes the observations.
Archival spectra from Shappee et al. (2013); Graham et al. (2015b, a); Taubenberger et al. (2015); Mazzali et al. (2015) and Zhang et al. (2016) are included in our analysis to increase the temporal coverage. We also use photometric observations from Munari et al. (2013), Tsvetkov et al. (2013), Zhang et al. (2016), and Shappee et al. (2017) to place the spectra on an absolute flux scale. We restrict the photometry to the filters because 1) our spectral analysis is focused on the wavelength range covered by these filters, and 2) data from these filters are available for the spectral epochs used in our analysis (e.g., Fig. 1 from Tucker et al., 2021a). We fit the light curves with low-order splines over the range of days. We added Gaussian deviates of the estimated noise and refit the data multiple times to estimate the uncertainties in the spline model. To account for minor differences in the filter throughputs between the photometric setups we include a conservative mag () systematic uncertainty in the final spline fit.
To flux-calibrate each spectrum, we interpolate the magnitudes and uncertainties using the spline fits. The synthetic filter magnitude is calculated from the spectrum using Eq. 7 from Fukugita et al. (1996) and the spectrum is linearly scaled to match the observed magnitudes. Nebular-phase photometry in other optical filters (, Firth et al., 2015; Kerzendorf et al., 2014, 2017) is used to check that the spectroscopic flux calibration is correct given the measurement measurement uncertainties.
3 Temporal Evolution
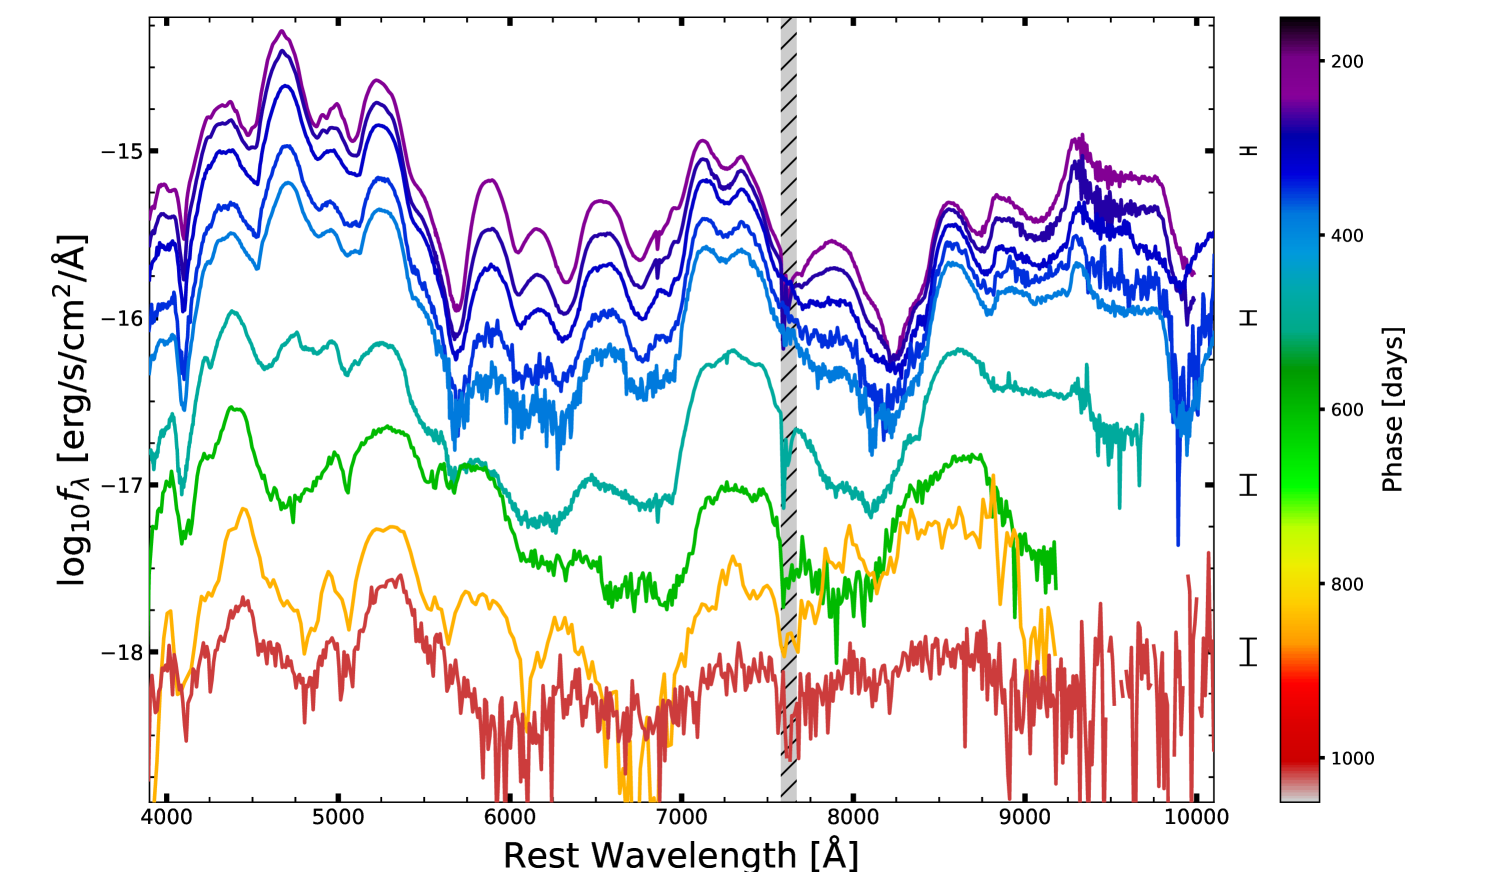
Line identification at days after maximum light is well-established due to the increasing number of nebular spectra obtained in recent years (e.g., Graham et al., 2017; Maguire et al., 2018; Sand et al., 2018; Tucker et al., 2020) and improvements in modeling these phases (e.g., Mazzali et al., 2015; Flörs et al., 2018; Wilk et al., 2018; Flörs et al., 2020; Wilk et al., 2020; Shingles et al., 2020; Polin et al., 2021). Optical spectra days after are dominated by [Fe III] with contributions from [Fe II], [Ni II], and [Co III]. Fig. 1 shows the flux-calibrated spectral evolution at days after and Fig. 2 shows the normalized spectra at various epochs. We discuss the evolution of the Å and Å regions in §3.1 and §3.2, respectively.
3.1 The Fe-dominated Å Region
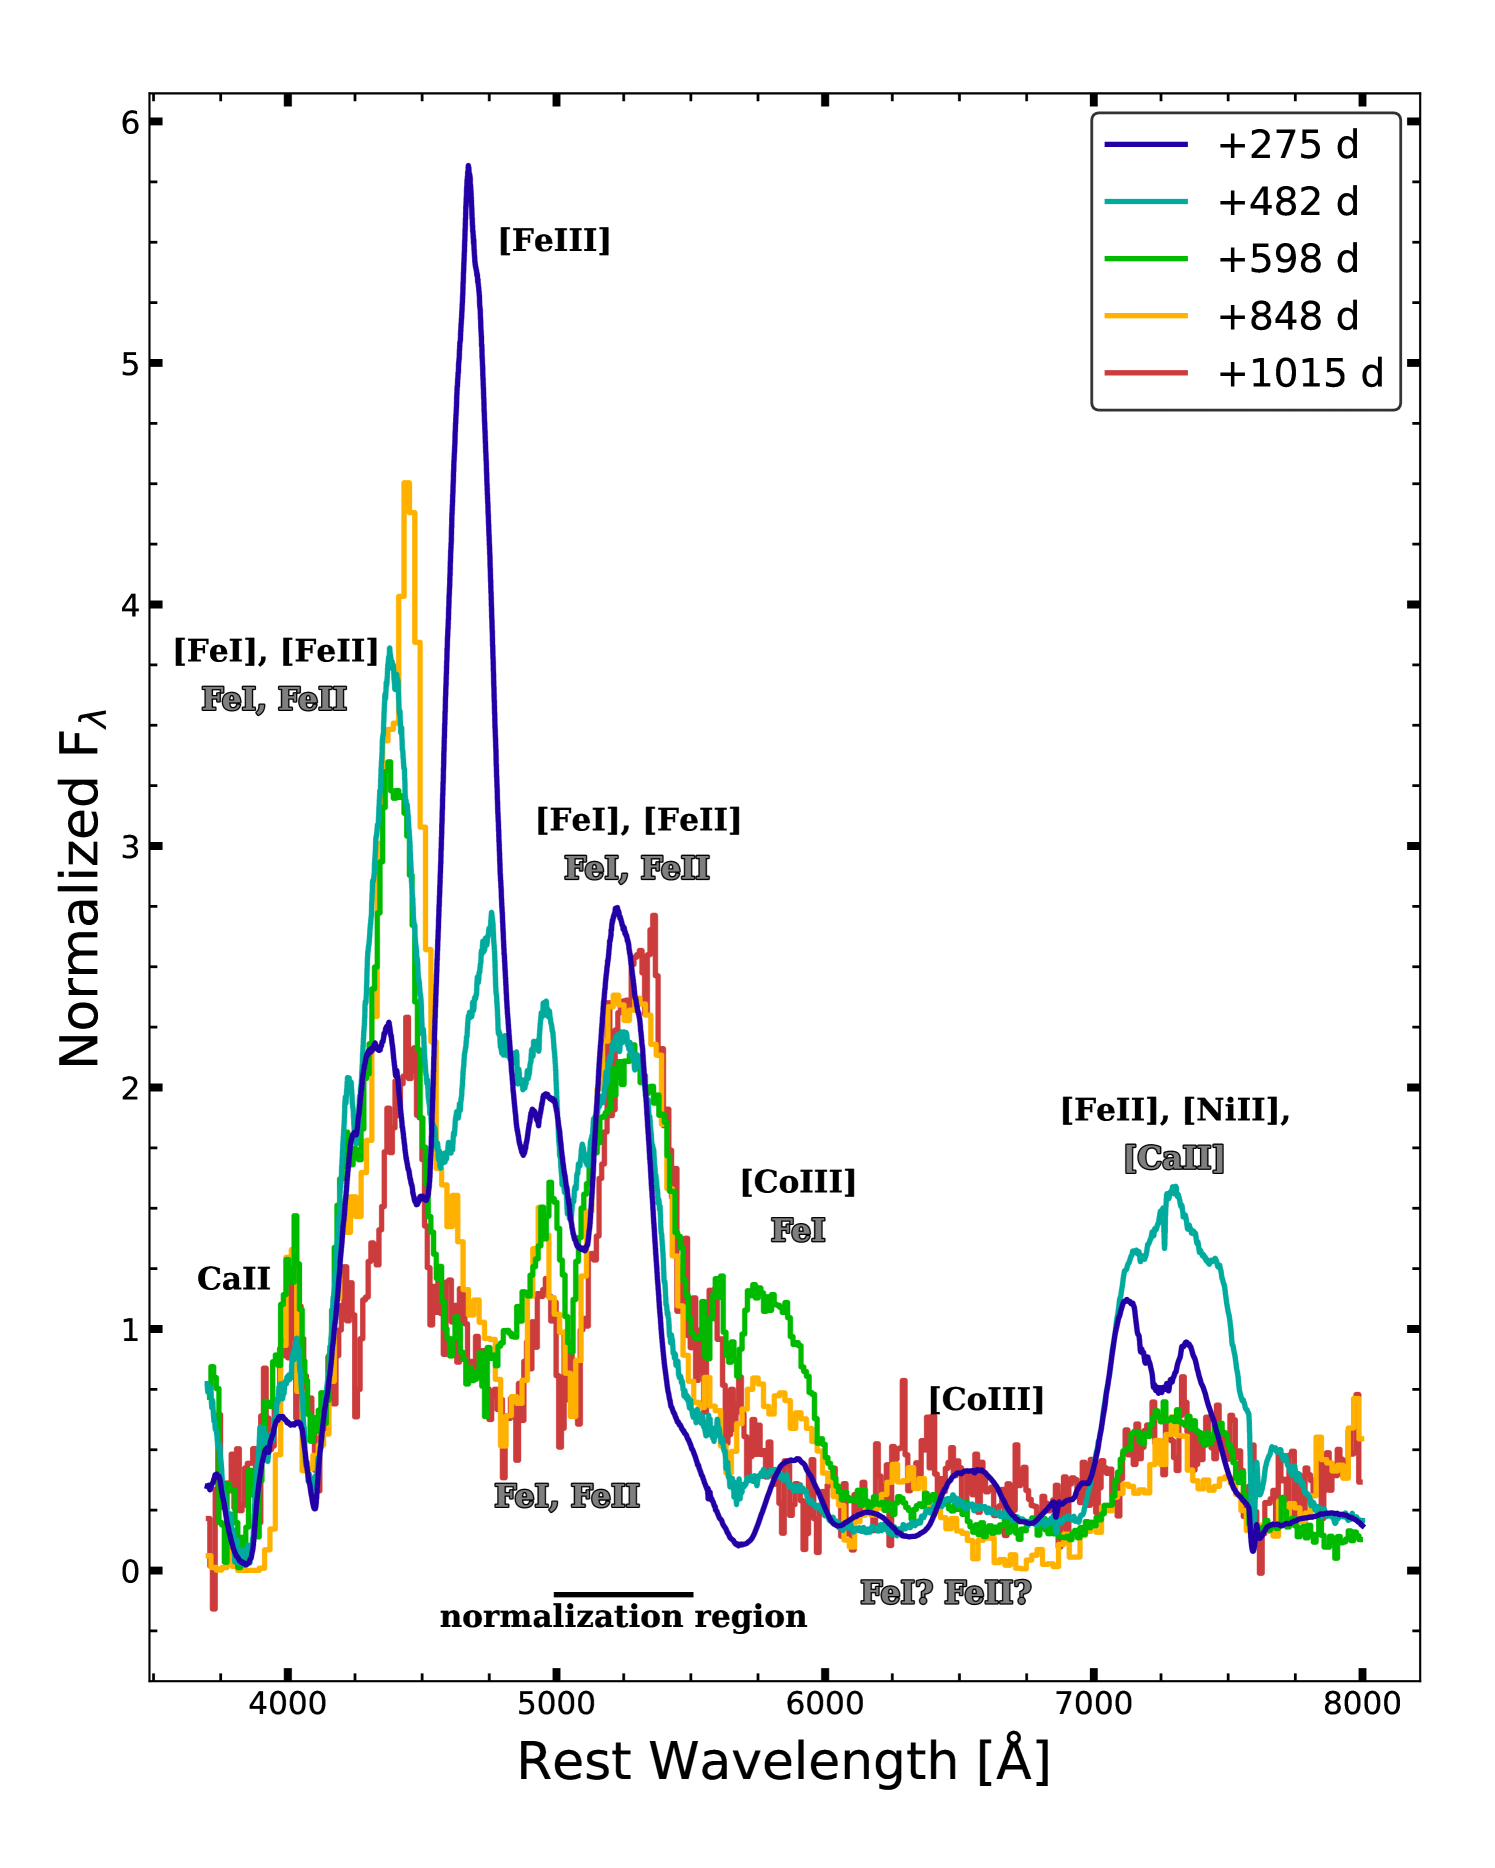
The wavelength range is mainly comprised of forbidden iron emission lines (e.g., Mazzali et al., 2015; Wilk et al., 2020). The strongest feature in nebular spectra is typically the peak at Å observed in almost all nebular SNe Ia spectra and attributed to a blend of [Fe III] transitions (e.g., Graham et al., 2017; Maguire et al., 2018; Tucker et al., 2020). Figs. 1 and 2 show that this feature dominates the spectrum until days after . It then disappears over the subsequent 200 days leaving two adjacent peaks at and Å. Fransson & Jerkstrand (2015) show that these features are dominated Fe I with minor contributions from Fe II.
Our new spectra provide the first evidence for a sharp transition in the ejecta of SNe Ia at nebular phases. The +480-day spectrum shows a steep drop in the [Fe III] blend at Å and the feature has disappeared by the +600-day spectrum. The adjacent spectral features at Å and Å remain strong in all of the spectra. However, these features shift and change compared to the -day spectra. This is likely due to the transition from Fe II to Fe I emission.
3.2 The Å Feature
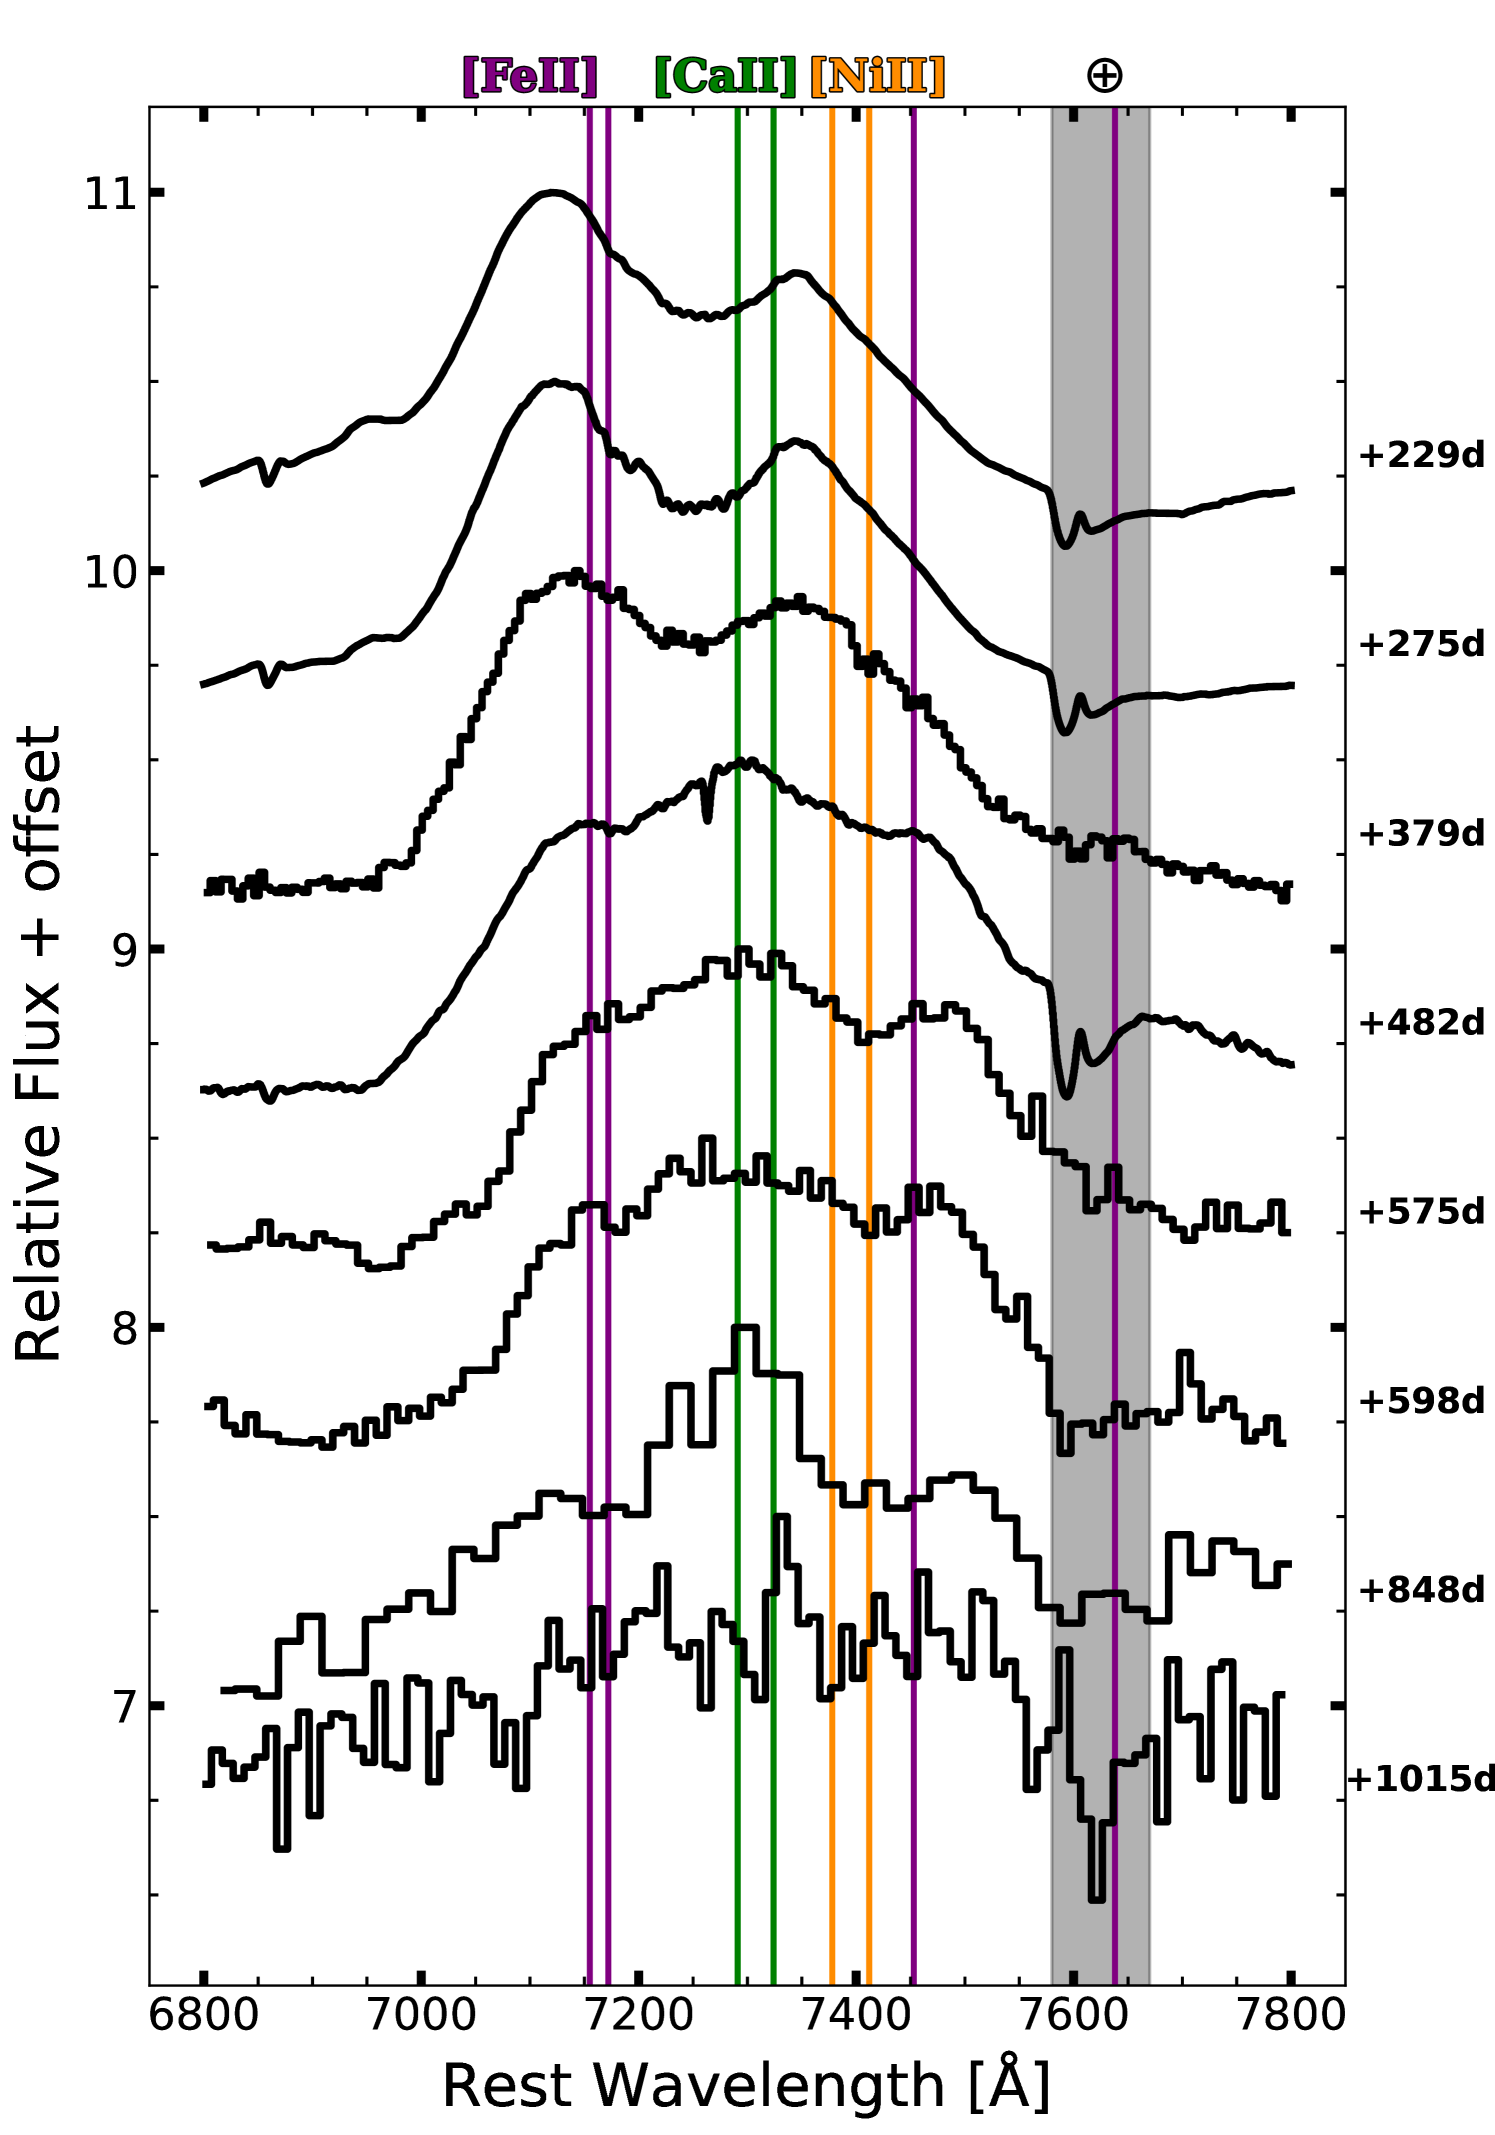
The feature at Å is dominated by a blend of [Fe II] and [Ni II] in the nebular spectra of normal SNe Ia (e.g., Mazzali et al., 2015; Maguire et al., 2018; Flörs et al., 2018; Wilk et al., 2020). However, Figs. 1, 2, and 3 show a distinct change in this feature at days as well, with the emission profile transitioning from double- to triple-peaked. We consider 4 possible interpretations:
-
1.
[Fe II] and [Ni II] produce the entire profile with no contribution from [Ca II];
-
2.
[Ca II] is narrow ( km s-1) and only contributes to the central peak, whereas moderate-width ( km s-1) [Fe II] and [Ni II] produce the wings;
-
3.
Broad [Ca II] ( km s-1) dominates the feature, with minor contributions from narrow ( km s-1) [Fe II] and [Ni II] to the wings; or
-
4.
The entire profile is produced by [Ca II] with no significant contribution from [Fe II] +[Ni II].
Case 1, where the central emission peak is attributed to [Fe II] and/or [Ni II], requires a highly-asymmetric ejecta distribution which conflicts with the symmetric emission-line profiles of Co, Ni, and Fe (e.g., McClelland et al., 2013; Graham et al., 2015b). Additionally, the spherically-symmetric, one-dimensional models of Fransson & Jerkstrand (2015) do not require any ejecta asymmetry to reproduce the observations. Thus, we conclude the central peak is rest-velocity [Ca II].
Case 2, where [Fe II] and [Ni II] dominate the profile with only a minor contribution from [Ca II], is plausible but we find it unlikely for several reasons. First, it requires [Ca II] to be present in the ejecta but only at low velocities ( km s-1) that are typically dominated by iron-group elements (IGEs; e.g., Ruiz-Lapuente & Lucy, 1992; Liu et al., 1997). Second, high-density burning can produce 48Ca (Meyer et al., 1996; Dom´ınguez & Höflich, 2000) but it is likely confined to the lowest velocities ( km s-1; e.g, Galbany et al., 2019), which disagrees with the observed km s-1 profile. Finally, 40Ca is readily produced by incomplete Si burning (e.g., Thielemann et al., 1986) and Ca is observed in spectra of SN 2011fe near maximum light at km s-1 (e.g., Parrent et al., 2012; Pereira et al., 2013; Zhang et al., 2016). Thus, attributing only the central component to [Ca II] would require two distinct, non-overlapping zones within the ejecta: an outer, high-velocity zone () responsible for the Ca near maximum light and an inner, low-velocity zone () responsible for the nebular-phase Ca emission. This scenario is unlikely as it disagrees with the chemical stratification resulting from nuclear burning (e.g., Nomoto et al., 1984; Thielemann et al., 1986).
Case 3, where the profile is dominated by high-velocity [Ca II] with minor contributions from [Fe II] and [Ni II], is more likely considering our knowledge of chemical distribution and stratification in the ejecta (e.g., Wilk et al., 2020). This interpretation satisfies the requirement for high-velocity Ca without requiring the [Fe II] and [Ni II] contributions to disappear completely. However, attempting to model this feature with a high-velocity Ca component and Fe+Ni contributing to the wings does not provide a satisfactory fit. The residual peaks after removing a broad ( km s-1) [Ca II] component do not have a self-consistent velocity shift for the [Fe II] and [Ni II] line profiles. The blue-shifted peak can be attributed to slightly blue-shifted () [Fe II], similar to day spectra (e.g., McClelland et al., 2013), but it then requires red-shifted [Fe II] () or [Ni II] () to explain the peak at Å. These mismatching velocity shifts suggest this is also an unsatisfactory explanation for the Å feature.
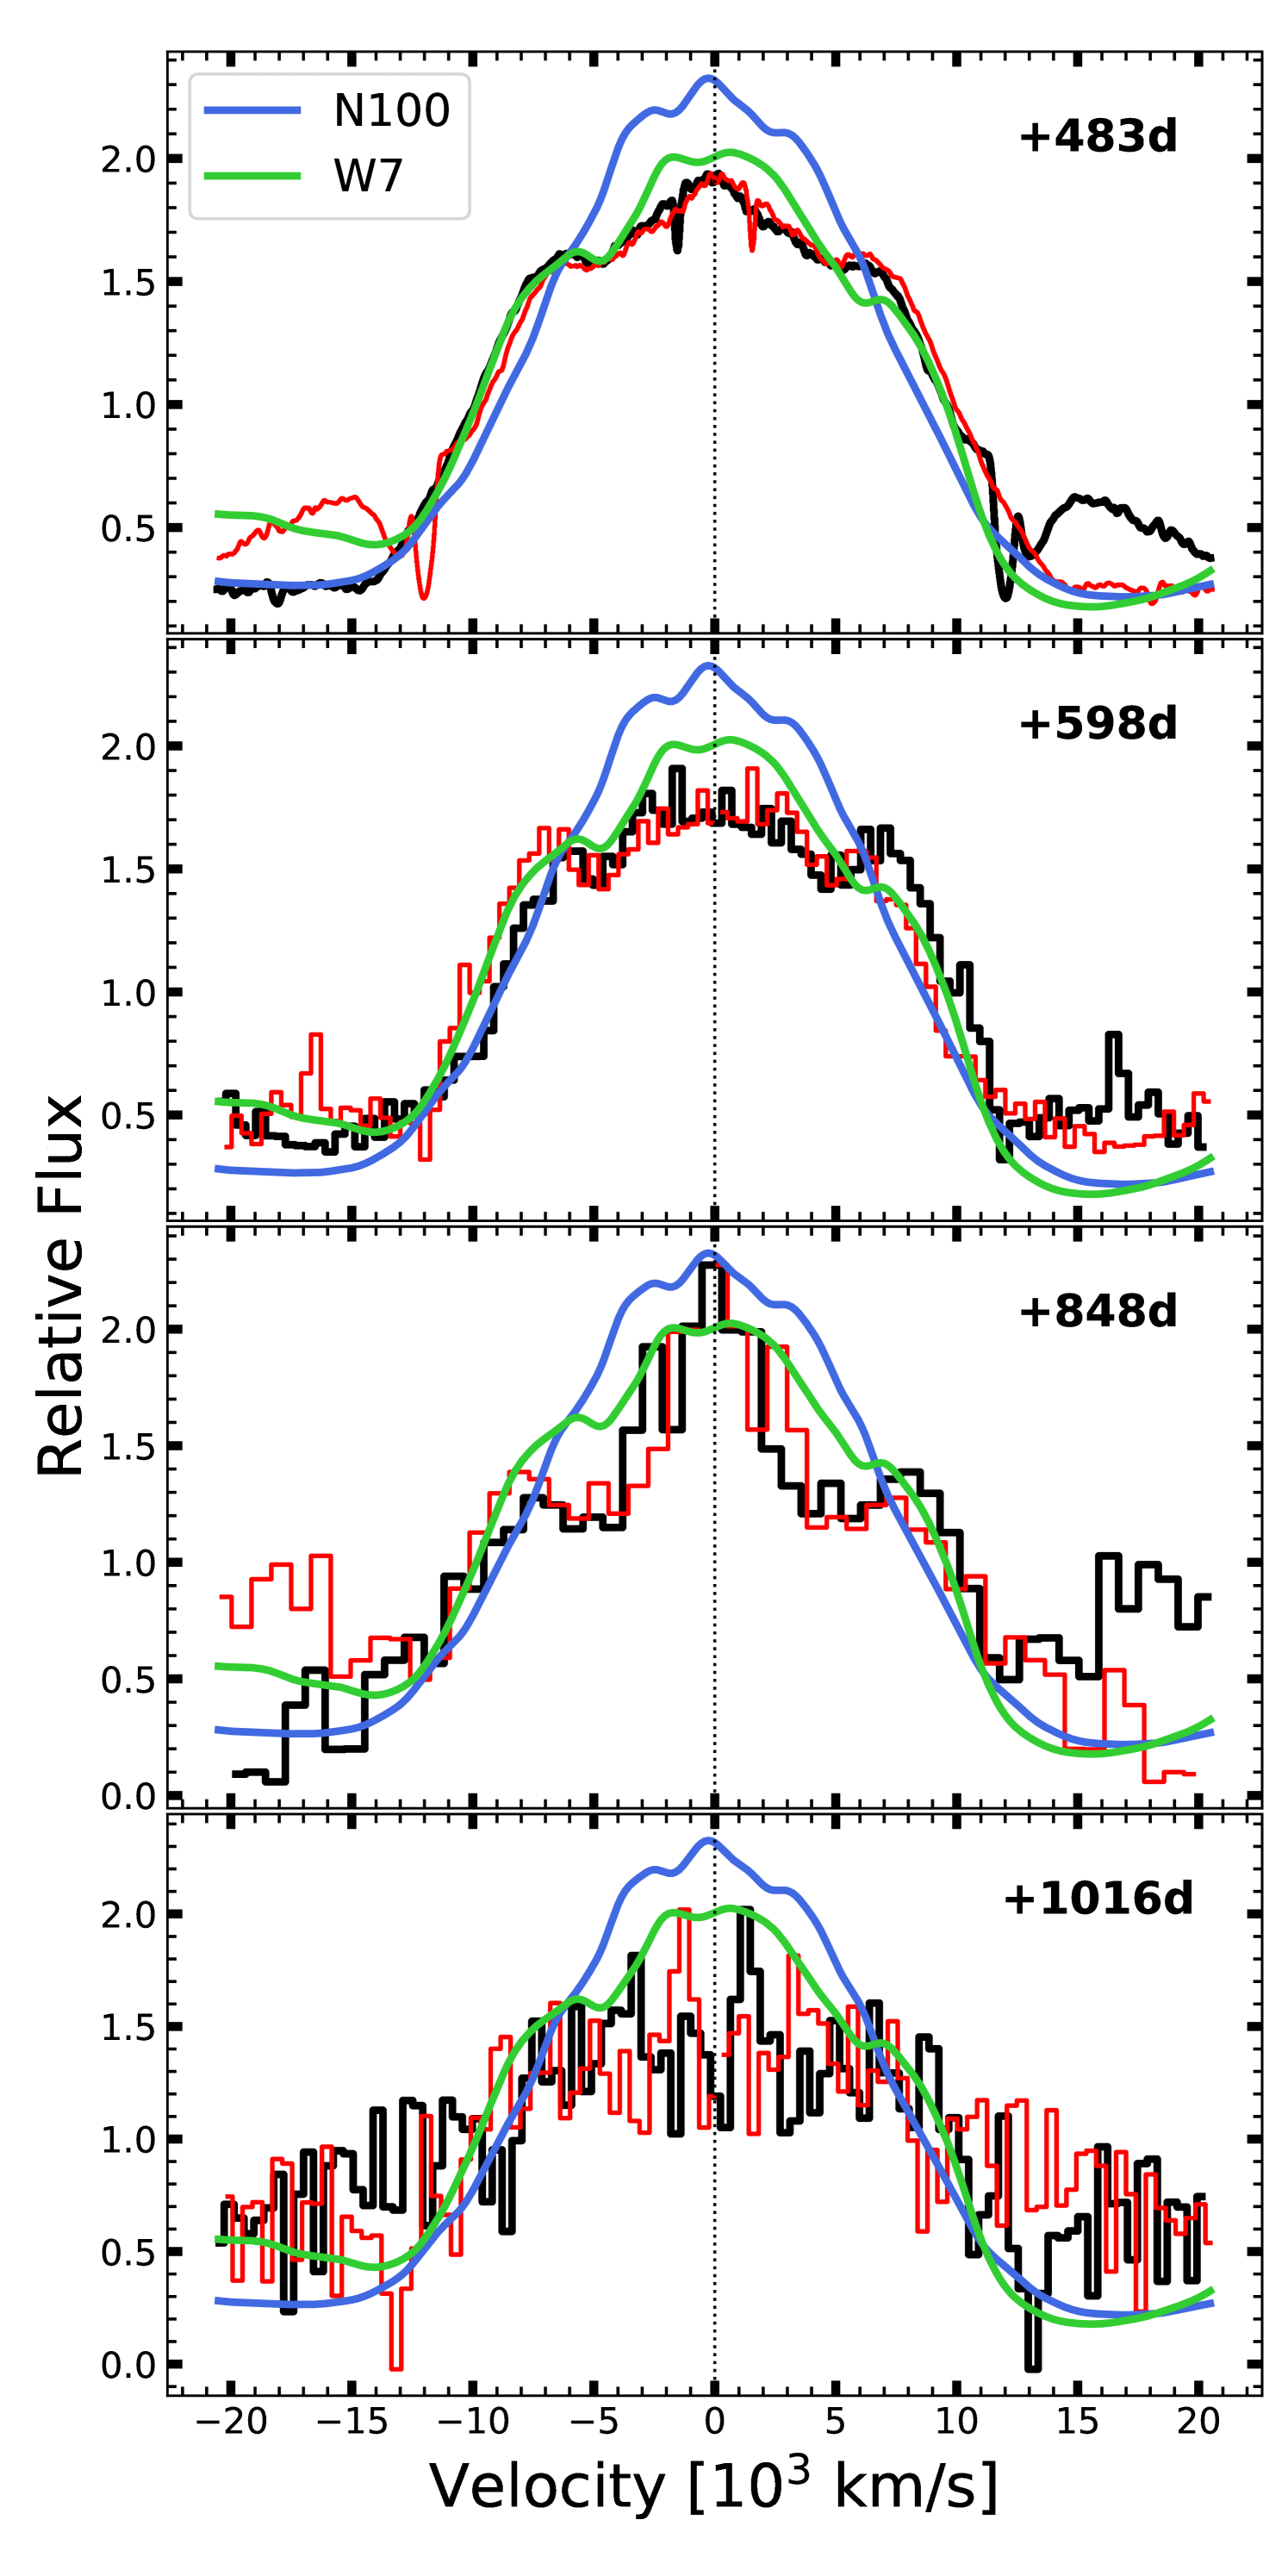
This leaves Case 4, where both the central peak and wing components are all created by [Ca II]. To test this idea, we show the line profile reflected about the central wavelength in Fig. 4. Allowing for some ambiguities in the central wavelength because it is a blended doublet, the profiles are remarkably symmetric. More evidence for the [Ca II] interpretation comes from the lack of significant evolution between the -day spectrum and the -day spectrum. The Å region shows noticeable evolution in both line profiles and line strengths over these epochs, likely due to the dominant line emission shifting from Fe III to Fe II +Fe I (§3.1). We would expect some evolution at days in the Å profile if [Fe II] and [Ni II] contributed significantly to the emission profile.
Thus, we attribute the feature at Å to [Ca II] at days after . However, this requires a rapid ( days) shift in the ionization state of the ejecta from days after explosion and has interesting implications for the temperature and density evolution of the ejecta, as [Fe III] disappears at roughly the same epoch that [Ca II] appears (§3.1).
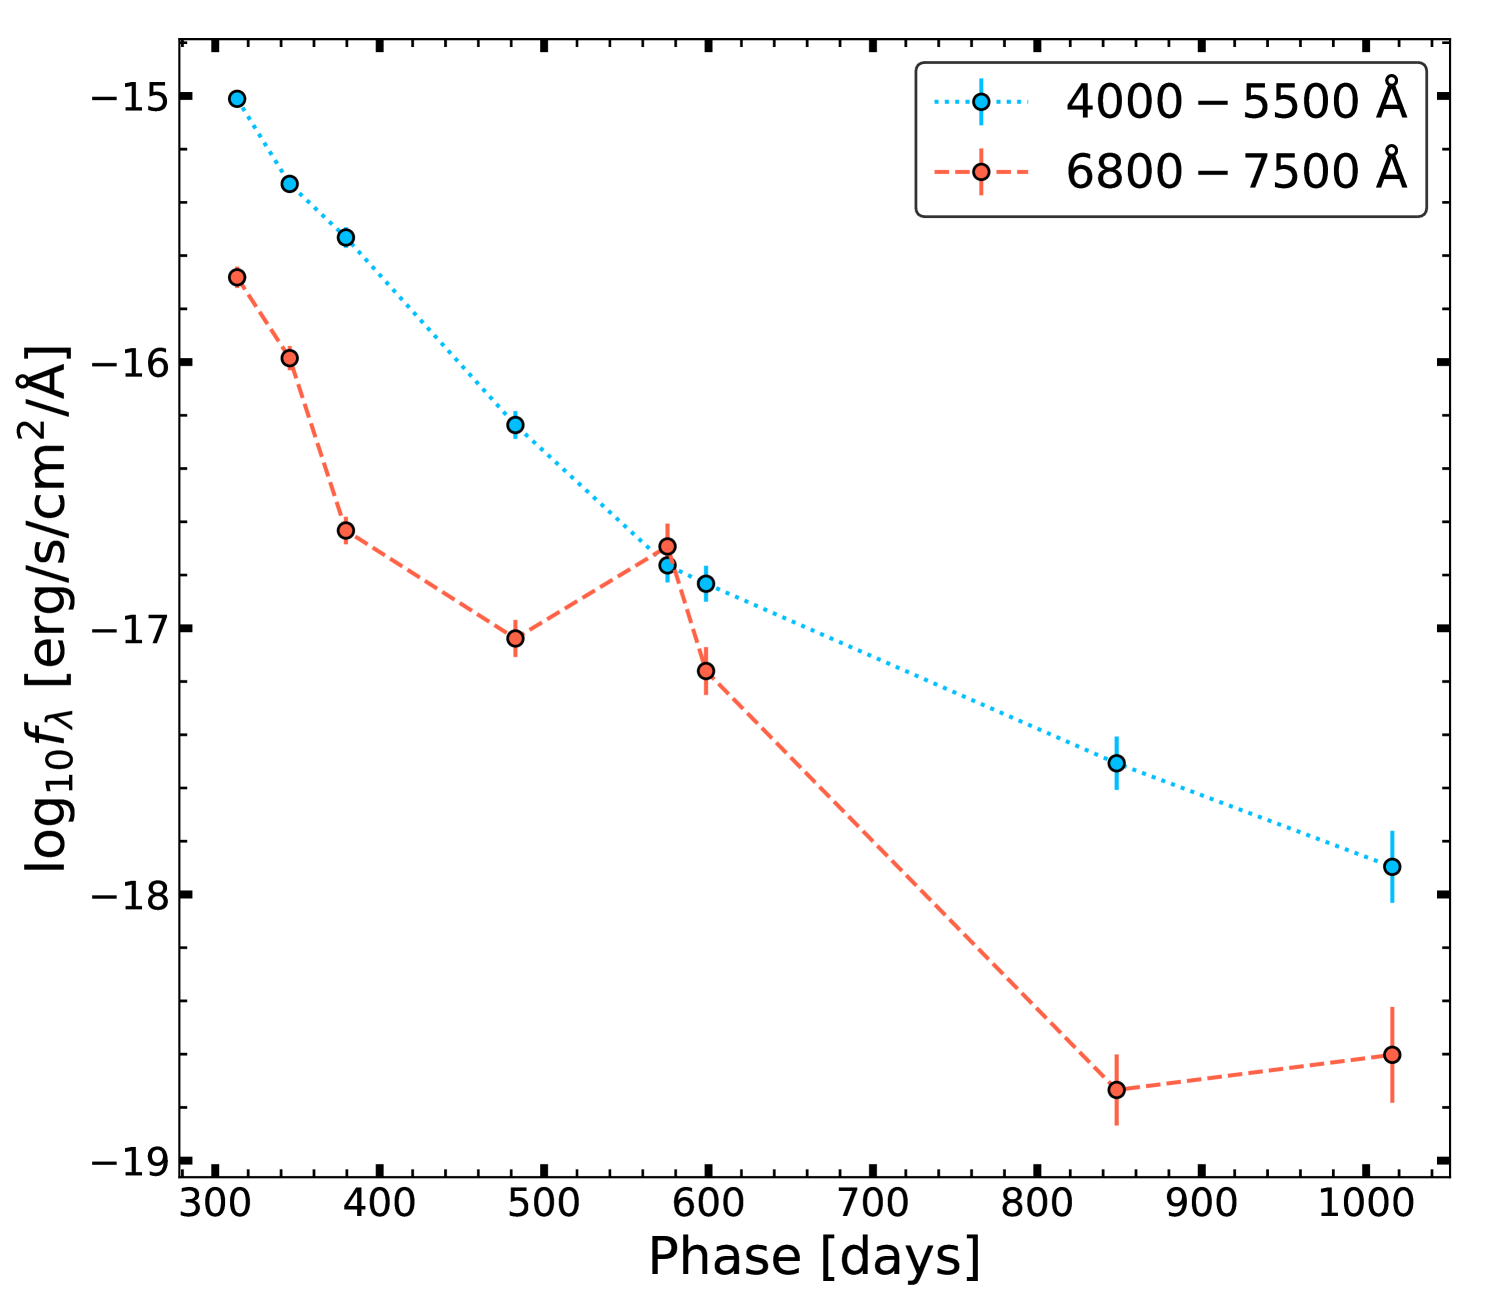
This spectral evolution cannot be attributed to weak features becoming visible as other features fade. Fig. 5 compares the average flux of the Fe-dominated Å region and the Å feature,111The average flux for the Å region is cut off at 7500 Å to prevent the O2 telluric band from affecting the results (e.g., Fig. 3). showing that the Fe blends evolve smoothly with time albeit with a distinct change in the decay rate at days after . The [Ca II] feature generally exhibits a similar decline in flux but shows strong variations, especially at days after when the Fe-region changes its decline rate. This general time period agrees with the end of the nebular-phase NIR plateau discovered by Graur et al. (2020) and coincides with a change in the optical-to-NIR flux ratio (Maguire et al., 2016; Dimitriadis et al., 2017; Graur et al., 2020), all of which suggest a distinct shift in emission properties.
Interestingly, the -day theoretical nebular spectra computed by Fransson & Jerkstrand (2015) using delayed-detonation (N100; Seitenzahl et al., 2013b) and pure deflagration (W7; Iwamoto et al., 1999) explosion models both predict symmetric, triple-peaked [Ca II] profiles which qualitatively match those shown in Fig. 4. However, the 1000-day model spectra are most similar to the -day observed spectra, highlighting the need for additional modeling at these epochs.
4 Progenitor System and Explosion Mechanism Constraints
Flux limits for H, He I, and [O I] are included as supplementary material.
The nebular spectra also provide constraints on the progenitor system of SN 2011fe. We discuss scenarios involving mass-transfer from non-degenerate companions (i.e., the “single-degenerate” scenario) in §4.1 and discuss double WD systems (i.e., the “double-degenerate” scenario) in 4.2.
4.1 Single-Degenerate Scenarios
If a non-degenerate star was undergoing Roche Lobe overflow (RLOF) and depositing mass onto the WD at time of explosion, numerical simulations predict of mass will be unbound from the stellar envelope (e.g., Marietta et al., 2000; Pan et al., 2012; Boehner et al., 2017), depending on the type of donor star (i.e, main-sequence versus red-giant stars). Additionally, the surrounding environment may contain H-rich material from the companion star wind or from nova-like eruptions on the WD surface during the accretion phase (e.g, Hamuy et al., 2003; Walder et al., 2008; Moore & Bildsten, 2012). Signatures for such material have been searched for previously in SN 2011fe (Shappee et al., 2013; Lundqvist et al., 2015; Graham et al., 2015a), without success.
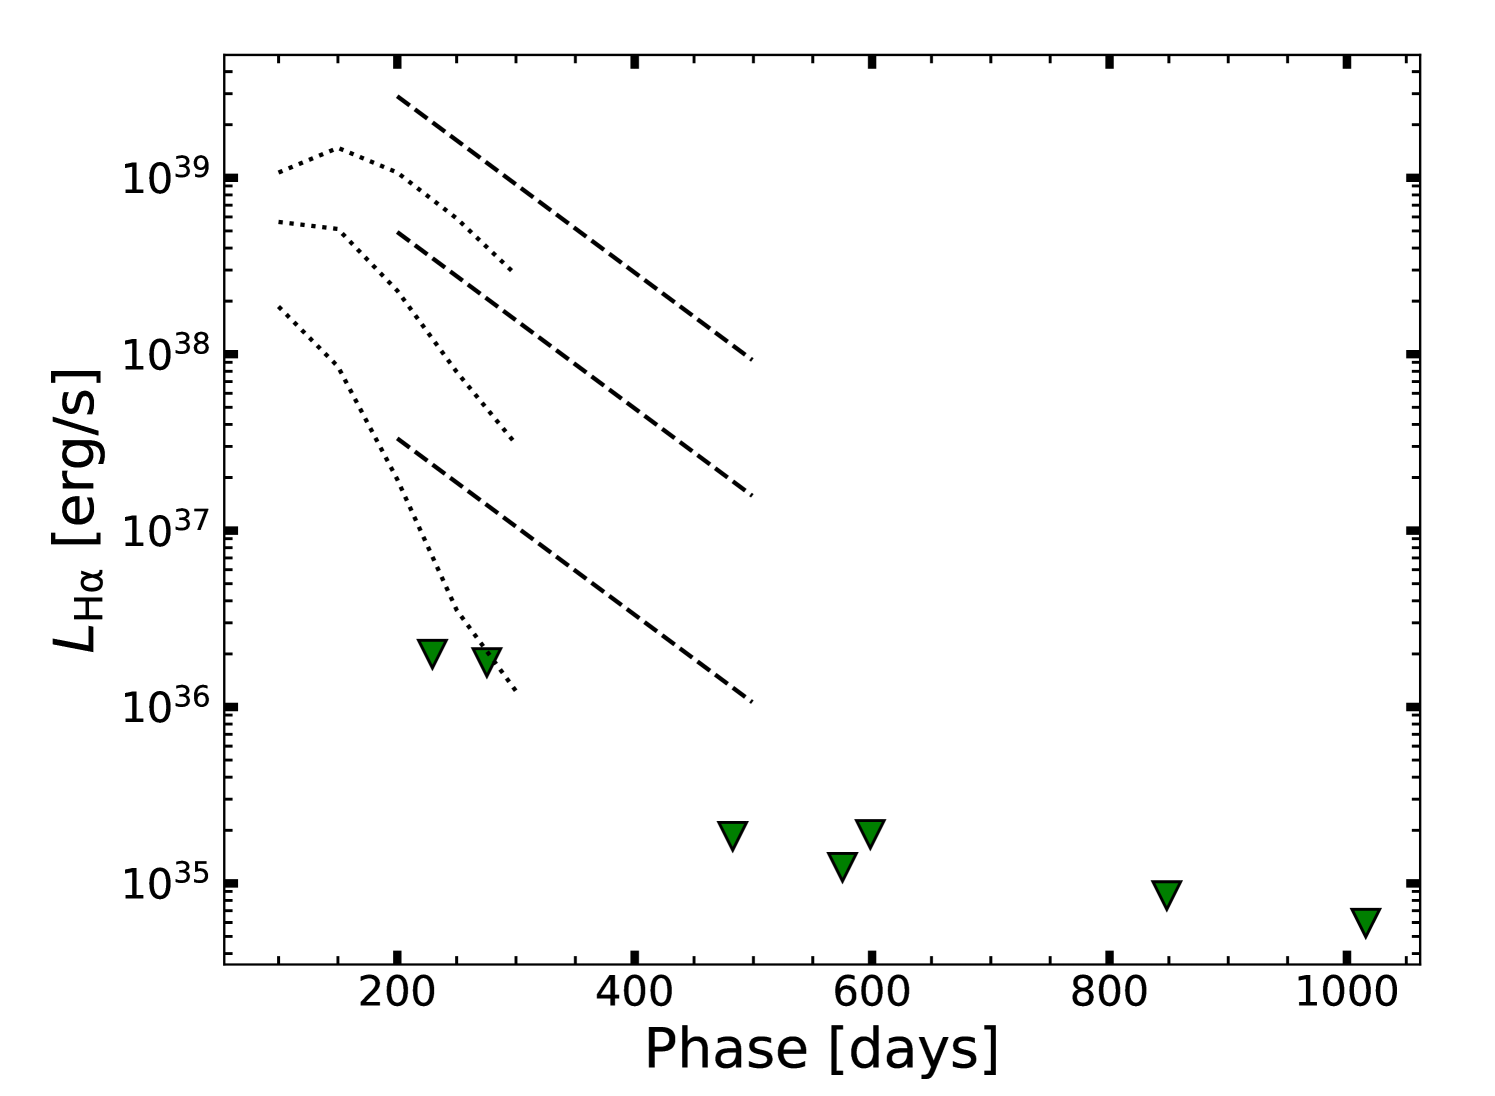
Neither H nor He are observed at any point in the spectra of SN 2011fe and we place non-detection limits on emission lines from H and He I in the flux-calibrated spectra using Eq. 3 from Tucker et al. (2020). We assume a line width of which is predicted for stripped companion material (e.g., Boehner et al., 2017) and in rough agreement with emission-line widths seen in SNe Ia interacting with nearby dense CSM (; Silverman et al., 2013a, b; Graham et al., 2019). The flux non-detections scale with the assumed velocity as . Our adopted 10 flux limit is conservative but corresponds to a line profile that would be visibly obvious.
Fig. 6 compares the H non-detections, including the flux calibration uncertainties, to the most recent models (Botyánszki et al., 2018; Dessart et al., 2020). Botyánszki et al. (2018) do not provide time-dependent line luminosities so we adopt the time-dependence derived by Tucker et al. (2020). The limit on any potential stripped/ablated companion material is for both models, essentially excluding all non-degenerate H-rich donor stars. The H non-detections also disfavor the presence of an H-rich CSM. Assuming a wind velocity of 10 (100) km s-1, this precludes any significant CSM production by the progenitor system in the past 7000 (700) years. The lack of CSM is also difficult to reconcile with the core-degenerate scenario (Soker et al., 2014), although this interpretation necessarily depends on the time between merger with the stellar core and explosion.
Interpreting the lack of He is more complicated. Botyánszki et al. (2018) provide a simplified He-star model which replaces the H-rich material unbound from a main-sequence (MS) star with He-rich material. This simple model provides a direct estimate of He line luminosities but fails to capture the physical conditions of a He-star envelope. The differing density profiles and surface gravities between MS and He-star envelopes will affect both the amount of unbound mass and its velocity. Additionally, the models of Dessart et al. (2020) include time-dependent opacities and predict that only the NIR He I is produced at detectable levels. Thus, while we can confidently exclude any He emission at similar flux limits to those on H shown in Fig. 6, it is not clear how to interpret this as a limit on ablated mass from a companion.
4.2 Double-Degenerate Scenarios
Observational signatures of double-degenerate progenitor systems are subtle due the compact nature of both stars, but some constraints can be obtained from the nebular-phase spectra. First, we checked for [O I] emission lines as this may indicate the violent merger of two WDs (Kromer et al., 2013) as seen in the subluminous SN Ia 2010lp (Taubenberger et al., 2013). However, both the archival and new spectra have no evidence for any O emission. This argues against a violent merger producing SN 2011fe, but the nebular-phase model parameter space for violent mergers is also largely unexplored.
Another potential double-degenerate scenario is a direct (head-on) collision, usually induced by orbital perturbations from external bodies (e.g., Thompson, 2011; Antognini et al., 2014), which then produces highly-asymmetric ejecta (e.g., Rosswog et al., 2009; van Rossum et al., 2016). Observationally, bimodal and asymmetric emission-line profiles of iron-group elements (IGEs) have been seen in nebular-phase SNe Ia spectra and used to infer explosion asymmetry (e.g., Dong et al., 2015; Mazzali et al., 2018; Vallely et al., 2020; Hoeflich et al., 2021). However, the Co, Fe, and [Ca II] line profiles are symmetric (see §3) and the one-dimensional models of Fransson & Jerkstrand (2015) do not require any asymmetry to reproduce the observations (Fig. 4). Thus, we find no evidence for explosion asymmetry which is tentative evidence against the direct-collision interpretation, in agreement with the inferred nucleosynthetic yield (Tucker et al., 2021a).
5 Discussion
Our new spectra reveal a hitherto unseen transition in the ejecta days after explosion. This epoch also corresponds to the decades-old prediction of Axelrod (1980) who proposed that an infrared catastrophe occurs when the ejecta temperature and density are too low to populate the [Fe III] transitions. However, Axelrod (1980) predicted that all emission will be shifted into the mid-IR (MIR) regime as the only remaining cooling mechanism would be by exciting fine-structure transitions.
High-energy () 56Co positrons dominate the energy input at days explosion (e.g., Tucker et al., 2021a). Some of these positrons heat the ejecta directly but the majority of the positrons produce non-thermal excitations and ionizations (e.g., Kozma & Fransson, 1992; Jerkstrand et al., 2011; Li et al., 2012; Shingles et al., 2020), either directly or via downgraded electrons. UV photons are produced upon recombination which are transferred to optical and NIR wavelengths though multiple scatterings and fluorescence due to the optically-thick forest of Fe transitions in the UV (e.g., Pinto & Eastman, 2000; Jerkstrand et al., 2011; Fransson & Jerkstrand, 2015). This scenario is consistent with the failure to detect SN 2011fe at Å during the nebular phase (Kerzendorf et al., 2017).
Non-local radiative transfer effects explain the continued presence of optical emission at these epochs (Fransson & Jerkstrand, 2015), but it does not account for the observed change in emission properties at days after explosion. The shift from Fe II+Fe III to Fe I+Fe II suggests a “recombination wave” propagating through the 56Ni region (Graur et al., 2020). However, we observe the transition at days after explosion rather than days predicted by the models of Fransson & Jerkstrand (2015, see their Fig. 1). This discrepancy may seem minor but for spherically-symmetric expansion, this changes the density at the transition by a factor of which has important ramifications for energy deposition (c.f., Axelrod, 1980).
We propose that clumping may explain this discrepancy. Clumping in the ejecta of SNe Ia has been suggested by both observational (e.g., Black et al., 2016; Mazzali et al., 2020) and theoretical (e.g., Wilk et al., 2020) studies, but confirmation is difficult. Clumping determines where energy deposition occurs as clumps will retain energy input from radioactive decays more efficiently than the lower-density regions between them. However, the higher electron density in the clumps also increases the recombination rate and lowers the average ionization state (e.g., Mazzali et al., 2020). Wilk et al. (2020) show that varying the level of clumping, parameterized as a “filling factor”, has a profound impact on the observed spectra. Increased clumping diminishes the strong [Fe III] blend at Å while increasing the strength of the [Ca II] lines. Both signatures qualitatively match the spectral transition we observe days after explosion.
However, it is unclear if these simple comparisons match the true physical evolution of the ejecta, as the interpretation of [Ca II] is also dependent on the adopted explosion model. The and sub- explosions models from Wilk et al. (2020) differ in Ca production by a factor of . The sub- double-detonation explosion models of Polin et al. (2021) also predict nebular-phase [Ca II]. The off-center delayed-detonation models of Hoeflich et al. (2021), designed to replicate a low-luminosity SN Ia, predict strong and asymmetric nebular-phase [Ca II] emission. Thus, it remains unclear which model(s) accurately predict [Ca II] emission after the nebular-phase ionization change without introducing new discrepancies with other observations of SN 2011fe.
Observationally, [Ca II] is absent in spectra of SNe Ia obtained days after explosion (e.g., Graham et al., 2017; Maguire et al., 2018; Flörs et al., 2018, 2020). However, [Ca II] is observed in the underluminous 91bg-like (e.g., SNe 1991bg, Turatto et al., 1996; 1999by, Blondin et al., 2018; 2006mr, Stritzinger et al., 2010) and 02es-like (e.g., SNe 2010lp, Taubenberger et al., 2013; 2019yvq, Siebert et al., 2020; Tucker et al., 2021b; Burke et al., 2021) subclasses of SNe Ia at days after explosion. Considering that [Ca II] is an effective coolant and a resonant transition, it is perhaps unsurprising that the time-dependence of [Ca II] emission is related to the temperature and density in the ejecta. However, the [Ca II] lines in the underluminous SNe Ia are also flat-topped and symmetric, similar to SN 2011fe (Fig. 4). If [Ca II] is indeed a reliable probe of the ejecta geometry, it is interesting that the [Ca II] line profiles are so similar. However, interpreting symmetric [Ca II] emission as evidence for symmetric ejecta introduces new tensions with the complex elemental distributions seen in some SN Ia remnants (e.g., Stone et al., 2021).
SN 2011fe presented a rare opportunity to study SNe Ia physics in unprecedented detail and it remains one of the best-studied astronomical objects to-date (e.g., Tucker et al., 2021a). If the sharp ionization change is related to the infrared catastrophe predicted by Axelrod (1980), this transition should produce a distinct increase in the MIR flux due to fine-structure cooling. Nebular-phase Spitzer and Herschel observations of SN 2011fe (Johansson et al., 2013, 2017) did not cover the wavelength range (; e.g., Fransson & Jerkstrand, 2015) expected for fine-structure emission lines but the upcoming James Webb Space Telescope should provide a direct test of this theory (e.g., Ashall et al., 2021).
Acknowledgements
We thank Peter Hoeflich, Zach Claytor, Connor Auge, and Michelle Togami for useful discussions.
M.A.T. acknowledges support from the DOE CSGF through grant DE-SC0019323. CSK and KZS are supported by NSF grants AST-1814440 and AST-1907570.
The LBT is an international collaboration among institutions in the United States, Italy and Germany. LBT Corporation partners are: The University of Arizona on behalf of the Arizona Board of Regents; Istituto Nazionale di Astrofisica, Italy; LBT Beteiligungsgesellschaft, Germany, representing the Max-Planck Society, The Leibniz Institute for Astrophysics Potsdam, and Heidelberg University; The Ohio State University, representing OSU, University of Notre Dame, University of Minnesota and University of Virginia.
References
- Antognini et al. (2014) Antognini, J. M., Shappee, B. J., Thompson, T. A., & Amaro-Seoane, P. 2014, MNRAS, 439, 1079, doi: 10.1093/mnras/stu039
- Ashall et al. (2021) Ashall, C., Baron, E., Hoeflich, P. A., et al. 2021, MIR Spectroscopy of Type Ia Supernovae: The Key to Unlocking their Explosions and Element Production, JWST Proposal. Cycle 1
- Axelrod (1980) Axelrod, T. S. 1980, PhD thesis, California Univ., Santa Cruz.
- Black et al. (2016) Black, C. S., Fesen, R. A., & Parrent, J. T. 2016, MNRAS, 462, 649, doi: 10.1093/mnras/stw1680
- Blondin et al. (2018) Blondin, S., Dessart, L., & Hillier, D. J. 2018, MNRAS, 474, 3931, doi: 10.1093/mnras/stx3058
- Boehner et al. (2017) Boehner, P., Plewa, T., & Langer, N. 2017, MNRAS, 465, 2060, doi: 10.1093/mnras/stw2737
- Botyánszki & Kasen (2017) Botyánszki, J., & Kasen, D. 2017, ApJ, 845, 176, doi: 10.3847/1538-4357/aa81d8
- Botyánszki et al. (2018) Botyánszki, J., Kasen, D., & Plewa, T. 2018, ApJ, 852, L6, doi: 10.3847/2041-8213/aaa07b
- Burke et al. (2021) Burke, J., Howell, D. A., Sarbadhicary, S. K., et al. 2021, arXiv e-prints, arXiv:2101.06345. https://arxiv.org/abs/2101.06345
- Dessart et al. (2020) Dessart, L., Leonard, D. C., & Prieto, J. L. 2020, A&A, 638, A80, doi: 10.1051/0004-6361/202037854
- Dimitriadis et al. (2017) Dimitriadis, G., Sullivan, M., Kerzendorf, W., et al. 2017, MNRAS, 468, 3798, doi: 10.1093/mnras/stx683
- Dom´ınguez & Höflich (2000) Domínguez, I., & Höflich, P. 2000, ApJ, 528, 854, doi: 10.1086/308223
- Dong et al. (2015) Dong, S., Katz, B., Kushnir, D., & Prieto, J. L. 2015, MNRAS, 454, L61, doi: 10.1093/mnrasl/slv129
- Firth et al. (2015) Firth, R. E., Sullivan, M., Gal-Yam, A., et al. 2015, MNRAS, 446, 3895, doi: 10.1093/mnras/stu2314
- Flörs et al. (2018) Flörs, A., Spyromilio, J., Maguire, K., et al. 2018, A&A, 620, A200, doi: 10.1051/0004-6361/201833512
- Flörs et al. (2020) Flörs, A., Spyromilio, J., Taubenberger, S., et al. 2020, MNRAS, 491, 2902, doi: 10.1093/mnras/stz3013
- Fransson & Jerkstrand (2015) Fransson, C., & Jerkstrand, A. 2015, ApJ, 814, L2, doi: 10.1088/2041-8205/814/1/L2
- Friesen et al. (2017) Friesen, B., Baron, E., Parrent, J. T., et al. 2017, MNRAS, 467, 2392, doi: 10.1093/mnras/stx241
- Fukugita et al. (1996) Fukugita, M., Ichikawa, T., Gunn, J. E., et al. 1996, AJ, 111, 1748, doi: 10.1086/117915
- Galbany et al. (2019) Galbany, L., Ashall, C., Höflich, P., et al. 2019, A&A, 630, A76, doi: 10.1051/0004-6361/201935537
- Graham et al. (2015a) Graham, M. L., Nugent, P. E., Sullivan, M., et al. 2015a, MNRAS, 454, 1948, doi: 10.1093/mnras/stv1888
- Graham et al. (2015b) Graham, M. L., Foley, R. J., Zheng, W., et al. 2015b, MNRAS, 446, 2073, doi: 10.1093/mnras/stu2221
- Graham et al. (2017) Graham, M. L., Kumar, S., Hosseinzadeh, G., et al. 2017, MNRAS, 472, 3437, doi: 10.1093/mnras/stx2224
- Graham et al. (2019) Graham, M. L., Harris, C. E., Nugent, P. E., et al. 2019, ApJ, 871, 62, doi: 10.3847/1538-4357/aaf41e
- Graur et al. (2020) Graur, O., Maguire, K., Ryan, R., et al. 2020, Nature Astronomy, 4, 188, doi: 10.1038/s41550-019-0901-1
- Hamuy et al. (2003) Hamuy, M., Phillips, M. M., Suntzeff, N. B., et al. 2003, Nature, 424, 651, doi: 10.1038/nature01854
- Hoeflich et al. (2021) Hoeflich, P., Ashall, C., Bose, S., et al. 2021, arXiv e-prints, arXiv:2109.03359. https://arxiv.org/abs/2109.03359
- Hoyle & Fowler (1960) Hoyle, F., & Fowler, W. A. 1960, ApJ, 132, 565, doi: 10.1086/146963
- Iwamoto et al. (1999) Iwamoto, K., Brachwitz, F., Nomoto, K., et al. 1999, ApJS, 125, 439, doi: 10.1086/313278
- Jerkstrand et al. (2011) Jerkstrand, A., Fransson, C., & Kozma, C. 2011, A&A, 530, A45, doi: 10.1051/0004-6361/201015937
- Johansson et al. (2013) Johansson, J., Amanullah, R., & Goobar, A. 2013, MNRAS, 431, L43, doi: 10.1093/mnrasl/slt005
- Johansson et al. (2017) Johansson, J., Goobar, A., Kasliwal, M. M., et al. 2017, MNRAS, 466, 3442, doi: 10.1093/mnras/stw3350
- Kerzendorf et al. (2014) Kerzendorf, W. E., Taubenberger, S., Seitenzahl, I. R., & Ruiter, A. J. 2014, ApJ, 796, L26, doi: 10.1088/2041-8205/796/2/L26
- Kerzendorf et al. (2017) Kerzendorf, W. E., McCully, C., Taubenberger, S., et al. 2017, MNRAS, 472, 2534, doi: 10.1093/mnras/stx1923
- Kozma & Fransson (1992) Kozma, C., & Fransson, C. 1992, ApJ, 390, 602, doi: 10.1086/171311
- Kromer et al. (2013) Kromer, M., Pakmor, R., Taubenberger, S., et al. 2013, ApJ, 778, L18, doi: 10.1088/2041-8205/778/1/L18
- Law et al. (2009) Law, N. M., Kulkarni, S. R., Dekany, R. G., et al. 2009, PASP, 121, 1395, doi: 10.1086/648598
- Li et al. (2012) Li, C., Hillier, D. J., & Dessart, L. 2012, MNRAS, 426, 1671, doi: 10.1111/j.1365-2966.2012.21198.x
- Liu et al. (1997) Liu, W., Jeffery, D. J., & Schultz, D. R. 1997, ApJ, 483, L107, doi: 10.1086/310752
- Lundqvist et al. (2015) Lundqvist, P., Nyholm, A., Taddia, F., et al. 2015, A&A, 577, A39, doi: 10.1051/0004-6361/201525719
- Maguire et al. (2016) Maguire, K., Taubenberger, S., Sullivan, M., & Mazzali, P. A. 2016, MNRAS, 457, 3254, doi: 10.1093/mnras/stv2991
- Maguire et al. (2018) Maguire, K., Sim, S. A., Shingles, L., et al. 2018, MNRAS, 477, 3567, doi: 10.1093/mnras/sty820
- Marietta et al. (2000) Marietta, E., Burrows, A., & Fryxell, B. 2000, ApJS, 128, 615, doi: 10.1086/313392
- Mazzali et al. (2018) Mazzali, P. A., Ashall, C., Pian, E., et al. 2018, MNRAS, 476, 2905, doi: 10.1093/mnras/sty434
- Mazzali et al. (2015) Mazzali, P. A., Sullivan, M., Filippenko, A. V., et al. 2015, MNRAS, 450, 2631, doi: 10.1093/mnras/stv761
- Mazzali et al. (2020) Mazzali, P. A., Bikmaev, I., Sunyaev, R., et al. 2020, MNRAS, 494, 2809, doi: 10.1093/mnras/staa839
- McClelland et al. (2013) McClelland, C. M., Garnavich, P. M., Milne, P. A., Shappee, B. J., & Pogge, R. W. 2013, ApJ, 767, 119, doi: 10.1088/0004-637X/767/2/119
- Meyer et al. (1996) Meyer, B. S., Krishnan, T. D., & Clayton, D. D. 1996, ApJ, 462, 825, doi: 10.1086/177197
- Moore & Bildsten (2012) Moore, K., & Bildsten, L. 2012, ApJ, 761, 182, doi: 10.1088/0004-637X/761/2/182
- Munari et al. (2013) Munari, U., Henden, A., Belligoli, R., et al. 2013, New A, 20, 30, doi: 10.1016/j.newast.2012.09.003
- Nomoto et al. (1984) Nomoto, K., Thielemann, F. K., & Yokoi, K. 1984, ApJ, 286, 644, doi: 10.1086/162639
- Pan et al. (2012) Pan, K.-C., Ricker, P. M., & Taam, R. E. 2012, ApJ, 750, 151, doi: 10.1088/0004-637X/750/2/151
- Parrent et al. (2012) Parrent, J. T., Howell, D. A., Friesen, B., et al. 2012, ApJ, 752, L26, doi: 10.1088/2041-8205/752/2/L26
- Pereira et al. (2013) Pereira, R., Thomas, R. C., Aldering, G., et al. 2013, A&A, 554, A27, doi: 10.1051/0004-6361/201221008
- Phillips (1993) Phillips, M. M. 1993, ApJ, 413, L105, doi: 10.1086/186970
- Pinto & Eastman (2000) Pinto, P. A., & Eastman, R. G. 2000, ApJ, 530, 757, doi: 10.1086/308380
- Pogge et al. (2010) Pogge, R. W., Atwood, B., Brewer, D. F., et al. 2010, in Society of Photo-Optical Instrumentation Engineers (SPIE) Conference Series, Vol. 7735, Ground-based and Airborne Instrumentation for Astronomy III, ed. I. S. McLean, S. K. Ramsay, & H. Takami, 77350A, doi: 10.1117/12.857215
- Polin et al. (2021) Polin, A., Nugent, P., & Kasen, D. 2021, ApJ, 906, 65, doi: 10.3847/1538-4357/abcccc
- Röpke et al. (2012) Röpke, F. K., Kromer, M., Seitenzahl, I. R., et al. 2012, ApJ, 750, L19, doi: 10.1088/2041-8205/750/1/L19
- Rosswog et al. (2009) Rosswog, S., Kasen, D., Guillochon, J., & Ramirez-Ruiz, E. 2009, ApJ, 705, L128, doi: 10.1088/0004-637X/705/2/L128
- Ruiz-Lapuente & Lucy (1992) Ruiz-Lapuente, P., & Lucy, L. B. 1992, ApJ, 400, 127, doi: 10.1086/171978
- Sand et al. (2018) Sand, D. J., Graham, M. L., Botyánszki, J., et al. 2018, ApJ, 863, 24, doi: 10.3847/1538-4357/aacde8
- Seitenzahl et al. (2013a) Seitenzahl, I. R., Cescutti, G., Röpke, F. K., Ruiter, A. J., & Pakmor, R. 2013a, A&A, 559, L5, doi: 10.1051/0004-6361/201322599
- Seitenzahl et al. (2013b) Seitenzahl, I. R., Ciaraldi-Schoolmann, F., Röpke, F. K., et al. 2013b, MNRAS, 429, 1156, doi: 10.1093/mnras/sts402
- Shappee & Stanek (2011) Shappee, B. J., & Stanek, K. Z. 2011, ApJ, 733, 124, doi: 10.1088/0004-637X/733/2/124
- Shappee et al. (2017) Shappee, B. J., Stanek, K. Z., Kochanek, C. S., & Garnavich, P. M. 2017, ApJ, 841, 48, doi: 10.3847/1538-4357/aa6eab
- Shappee et al. (2013) Shappee, B. J., Stanek, K. Z., Pogge, R. W., & Garnavich, P. M. 2013, ApJ, 762, L5, doi: 10.1088/2041-8205/762/1/L5
- Shingles et al. (2020) Shingles, L. J., Sim, S. A., Kromer, M., et al. 2020, MNRAS, 492, 2029, doi: 10.1093/mnras/stz3412
- Siebert et al. (2020) Siebert, M. R., Dimitriadis, G., Polin, A., & Foley, R. J. 2020, ApJ, 900, L27, doi: 10.3847/2041-8213/abae6e
- Silverman et al. (2012) Silverman, J. M., Foley, R. J., Filippenko, A. V., et al. 2012, MNRAS, 425, 1789, doi: 10.1111/j.1365-2966.2012.21270.x
- Silverman et al. (2013a) Silverman, J. M., Nugent, P. E., Gal-Yam, A., et al. 2013a, ApJS, 207, 3, doi: 10.1088/0067-0049/207/1/3
- Silverman et al. (2013b) —. 2013b, ApJ, 772, 125, doi: 10.1088/0004-637X/772/2/125
- Soker et al. (2014) Soker, N., García-Berro, E., & Althaus, L. G. 2014, MNRAS, 437, L66, doi: 10.1093/mnrasl/slt142
- Stone et al. (2021) Stone, A. G., Johnson, H. T., Blondin, J. M., et al. 2021, arXiv e-prints, arXiv:2110.08360. https://arxiv.org/abs/2110.08360
- Stritzinger et al. (2010) Stritzinger, M., Burns, C. R., Phillips, M. M., et al. 2010, AJ, 140, 2036, doi: 10.1088/0004-6256/140/6/2036
- Taubenberger et al. (2013) Taubenberger, S., Kromer, M., Pakmor, R., et al. 2013, ApJ, 775, L43, doi: 10.1088/2041-8205/775/2/L43
- Taubenberger et al. (2015) Taubenberger, S., Elias-Rosa, N., Kerzendorf, W. E., et al. 2015, MNRAS, 448, L48, doi: 10.1093/mnrasl/slu201
- Thielemann et al. (1986) Thielemann, F. K., Nomoto, K., & Yokoi, K. 1986, A&A, 158, 17
- Thompson (2011) Thompson, T. A. 2011, ApJ, 741, 82, doi: 10.1088/0004-637X/741/2/82
- Tsvetkov et al. (2013) Tsvetkov, D. Y., Shugarov, S. Y., Volkov, I. M., et al. 2013, Contributions of the Astronomical Observatory Skalnate Pleso, 43, 94. https://arxiv.org/abs/1311.3484
- Tucker et al. (2021a) Tucker, M. A., Shappee, B. J., Kochanek, C. S., et al. 2021a, arXiv e-prints, arXiv:2111.01144. https://arxiv.org/abs/2111.01144
- Tucker et al. (2020) Tucker, M. A., Shappee, B. J., Vallely, P. J., et al. 2020, MNRAS, 493, 1044, doi: 10.1093/mnras/stz3390
- Tucker et al. (2021b) Tucker, M. A., Ashall, C., Shappee, B. J., et al. 2021b, ApJ, 914, 50, doi: 10.3847/1538-4357/abf93b
- Turatto et al. (1996) Turatto, M., Benetti, S., Cappellaro, E., et al. 1996, MNRAS, 283, 1, doi: 10.1093/mnras/283.1.1
- Vallely et al. (2020) Vallely, P. J., Tucker, M. A., Shappee, B. J., et al. 2020, MNRAS, 492, 3553, doi: 10.1093/mnras/staa003
- van Dokkum (2001) van Dokkum, P. G. 2001, PASP, 113, 1420, doi: 10.1086/323894
- van Rossum et al. (2016) van Rossum, D. R., Kashyap, R., Fisher, R., et al. 2016, ApJ, 827, 128, doi: 10.3847/0004-637X/827/2/128
- Walder et al. (2008) Walder, R., Folini, D., & Shore, S. N. 2008, A&A, 484, L9, doi: 10.1051/0004-6361:200809703
- Wilk et al. (2018) Wilk, K. D., Hillier, D. J., & Dessart, L. 2018, MNRAS, 474, 3187, doi: 10.1093/mnras/stx2816
- Wilk et al. (2020) —. 2020, MNRAS, 494, 2221, doi: 10.1093/mnras/staa640
- Zhang et al. (2016) Zhang, K., Wang, X., Zhang, J., et al. 2016, ApJ, 820, 67, doi: 10.3847/0004-637X/820/1/67