A resource-efficient deep learning framework for low-dose brain PET image reconstruction and analysis
Abstract
18F-fluorodeoxyglucose (18F-FDG) Positron Emission Tomography (PET) imaging usually needs a full-dose radioactive tracer to obtain satisfactory diagnostic results, which raises concerns about the potential health risks of radiation exposure, especially for pediatric patients. Reconstructing the low-dose PET (L-PET) images to the high-quality full-dose PET (F-PET) ones is an effective way that both reduces the radiation exposure and remains diagnostic accuracy. In this paper, we propose a resource-efficient deep learning framework for L-PET reconstruction and analysis, referred to as transGAN-SDAM, to generate F-PET from corresponding L-PET, and quantify the standard uptake value ratios (SUVRs) of these generated F-PET at whole brain. The transGAN-SDAM consists of two modules: a transformer-encoded Generative Adversarial Network (transGAN) and a Spatial Deformable Aggregation Module (SDAM). The transGAN generates higher quality F-PET images, and then the SDAM integrates the spatial information of a sequence of generated F-PET slices to synthesize whole-brain F-PET images. Experimental results demonstrate the superiority and rationality of our approach.
Index Terms— Image reconstruction, Deep learning, Positron Emission Tomography
1 Introduction
Positron Emission Tomography (PET) is the main neuroimaging method in the diagnosis of pediatric epilepsy (PE) [1, 2]. A full-dose radioactive tracer may raise concerns about the potential health risks for PE subjects. Hence, researchers have tried to reduce the tracer dose as much as possible for the PET scans to mitigate this negative effect [3]. However, the quality of low-dose PET (L-PET) images, containing more noises and artifacts, is inevitably lower than that of full-dose PET (F-PET) images, which hardly meets the requirements for satisfactory diagnosis [4].
A potential solution to solve the above problem is to reconstruct full-dose-like PET images from the L-PET ones. Some recent studies [5, 6, 7, 8, 9] proposed deep learning methods to reconstruct L-PET images, achieving high visual quality for the physicians to conduct a diagnosis. However, to our knowledge, there are still two critical issues that have not been well addressed: (1) How to further strengthen the understanding of the semantic patterns between voxels during L-PET reconstruction? (2) How to trade off the accuracy, speed, and resource consumption during L-PET reconstruction?
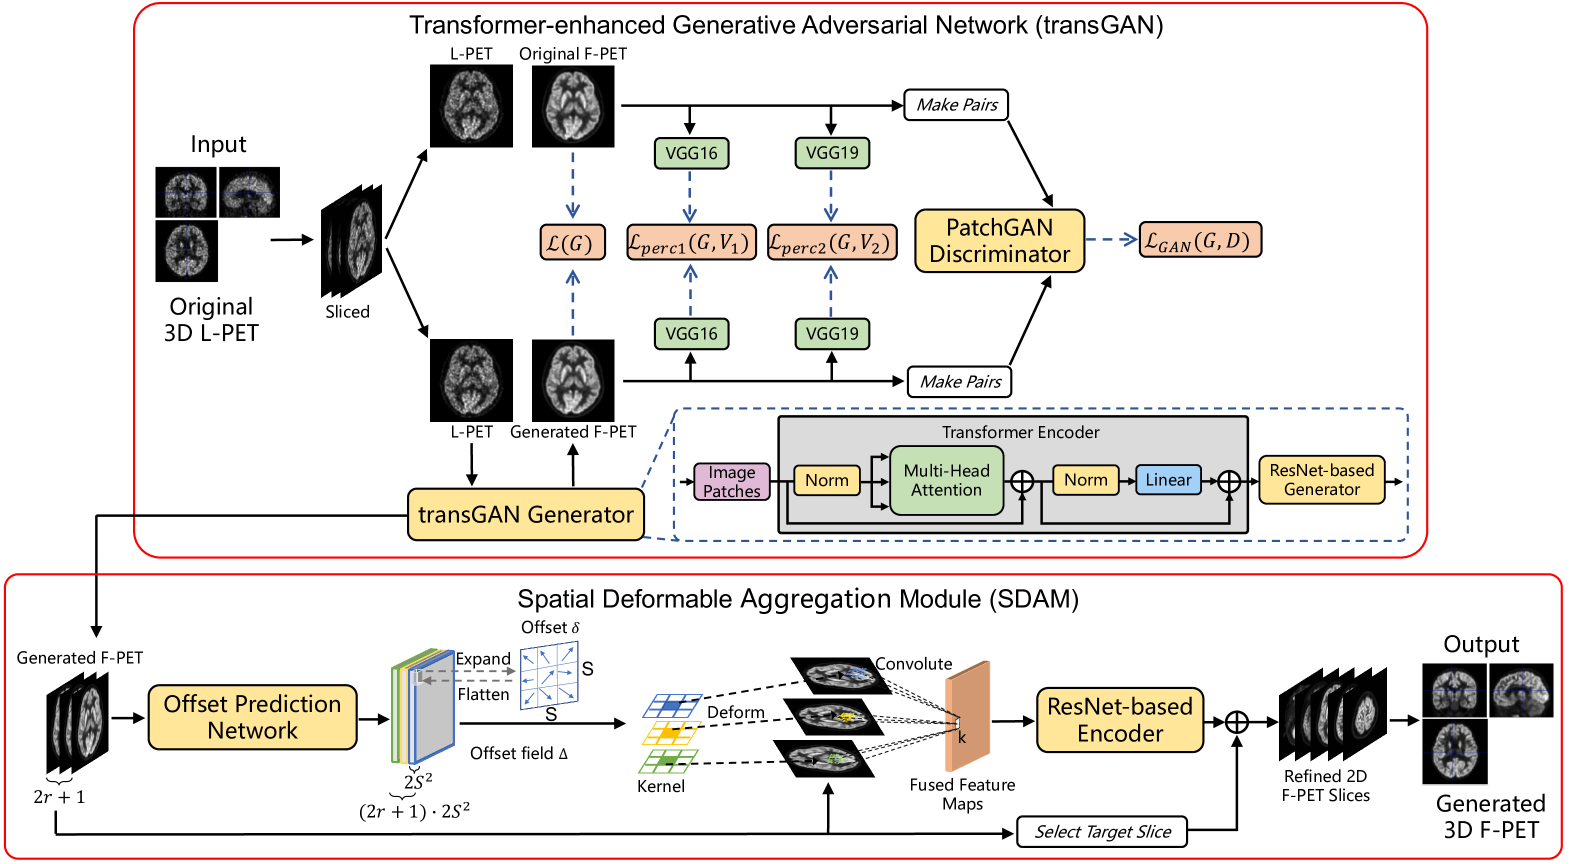
To address these issues, we propose a resource-efficient framework for L-PET reconstruction, referred to as transGAN-SDAM. The transGAN-SDAM generates F-PET images from L-PET images in a fast way, and utilizes the spatial information of generated F-PET image slices to refine the final 3D F-PET images for a more accurate standard uptake value ratio (SUVR) analysis of the whole brain. The transGAN-SDAM consists of two modules: a transformer-encoded Generative Adversarial Network (transGAN) and a Spatial Deformable Aggregation Module (SDAM). The transGAN optimizes the reconstruction process from L-PET to F-PET and generates high-quality F-PET image slices by introducing a transformer-encoded generator. The SDAM takes a sequence of generated F-PET slices as the inputs and extracts their spatial information by an offset prediction network. The spatial information is then further refined via a deformable convolution to optimize all generated F-PET images in a slice-by-slice manner. Finally, these refined F-PET image slices are combined to form the final 3D PET images for quantitative analysis.
2 Datasets
The experimental dataset consists of 45 pediatric subjects with epilepsy, which are scanned and collected in 2020 at Hangzhou Universal Medical Imaging Diagnostic Center 111http://www.uvclinic.cn/universal-hangzhou/. All subjects’ brain FDG-PET images are acquired on a whole-body hybrid PET/MR system (SIGNA PET/MR, GE Healthcare). Considering the clinical practice, we did not exclude those images with relatively lower quality.
3 Methology
3.1 Image preprocessing
L-PET images are reconstructed through 5 undersampling of list-mode F-PET data. Both L-PET images and F-PET images are preprocessed by Statistical Parametric Mapping (https://www.fil.ion.ucl.ac.uk/spm/) for realignment and normalization. After preprocessing, the voxel size of these PET images is mm, and each 3D PET image is split into several closely stacked 2D PET image slices with pixels.
3.2 transGAN
The proposed transGAN-SDAM consists of transGAN and SDAM, as illustrated in Fig. 1. Firstly, L-PET image slices are fed into transGAN, containing four sub-networks: transGAN Generator , PatchGAN Discriminator [5], high feature encoder VGG16-Net and VGG19-Net [10], to generate the corresponding F-PET slices in a 2.5D manner. Different from previous GAN-based studies that directly adopting a uNet generator [11] or a ResNet generator [12, 13] for image generation, we design a transformer-encoded ResNet generator that can encode and optimize all image patches in whole-slice scale through the multi-headed self-attention mechanism before every generation process. Since all generation processes are pre-encoded, the transGAN converges more quickly and ensure the semantic stability of generated F-PET images. During training the proposed transGAN, the adversarial loss function is defined as:
| (1) |
where denotes the L-PET slices, denotes the F-PET image generated by the generator, is the corresponding ground-truth F-PET image and represents the expectation. We also introduce the Charbonnier Loss [14] to punish the Euclidean difference between the synthesized F-PET images and the ground truth:
| (2) |
where denotes a small constant that is set to be . Considering the perceptual difference between the generated and the ground-truth F-PET images, inspired by [7, 12], we include both a VGG16-Net and a VGG19-Net that are pretrained on the ImageNet [15] to extract high feature representations of both and . The dual perceptual loss is defined as:
| (3) |
where and represent the feature maps extracted by VGG16-Net and VGG19-Net, respectively. Thus, the total loss of training transGAN is given as follows:
| (4) |
where and are the hyper-parameters that govern the trade off among , and . The hyper-parameters and are set to be 100 and 100, respectively.
3.3 SDAM
To generate 3D F-PET images, we propose SDAM to better extract additional informative structural contents and semantic details with a deformable convolution layer [16, 17]. Different from existing methods [18, 19] that explored spatial information by neighboring slices in a pairwise manner, we employ a U-Net based network as the offset prediction network which is fed into a sequence of generated F-PET images, to predict all the deformable offset field jointly for the target slice that needs be enhanced, as shown in Fig. 1. It demonstrates that the joint manner has a much lower computational cost than the pairwise scheme [18] since all the deformation offsets can be obtained in a single forward pass. Then, the offset fields are further adaptively fused into the sequence of generated F-PET images via a deformable convolutional layer to get fused feature maps:
| (5) |
where denotes the derived feature map, represents the size of convolution kernel and denotes the kernel for -th channel. is a spatial position and indicates the regular sampling offset. the deformation offsets are position-specific, i.e., an individual will be assigned to each convolution window centered at the spatial position . In particular, the preceding and succeeding slices are regarded as the reference, which together with the target slice input to SDAM. Thus, the offset field for all the spatial positions in the sequence of F-PET slices:
| (6) |
where denotes the concatenation of the generated F-PET slices, and is the offset prediction network. , is the height and width, respectively.
To fully explore the complementary information in the fused feature maps, we feed through a ResNet-based reconstruction network to predict a restoration residue . The refined target slice can finally be obtained by adding the residue back to the target slice as:
| (7) |
Thus, the loss function is set to the sum of squared error between the refined target frame and the ground-truth :
| (8) |
Finally, each subject’s all refined F-PET image slices are combined together to form the final 3D PET images for quantitative evaluations such as SUVR analysis.
| Method | uNet [20] | dNet [9] | CycleGAN [8] | fpGAN [7] | BiGAN [13] | transGAN | transGAN-SDAM |
|---|---|---|---|---|---|---|---|
| PSNR | 26.11.6 | 25.81.6 | 28.41.8 | 30.72.2 | 31.93.2 | 32.94.3 | 33.94.0 |
| SSIM | 0.8610.02 | 0.8760.02 | 0.8980.02 | 0.9290.02 | 0.9390.03 | 0.9460.04 | 0.9500.04 |
| VSMD | 0.1330.077 | 0.1480.069 | 0.0990.065 | 0.0570.036 | 0.0570.040 | 0.0450.037 | 0.0430.039 |
4 Experiments and Results
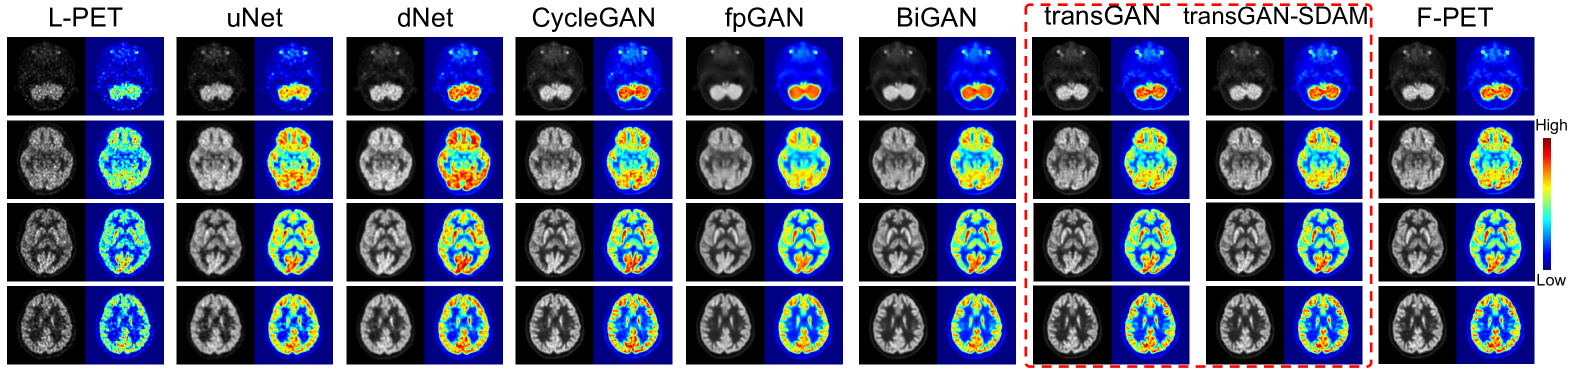
The average peak signal-to-noise ratio (PSNR), structural similarity index measurement (SSIM), and voxel-scale metabolic difference (VSMD) are adopted in this paper to quantitatively evaluate the generated F-PET slices and original F-PET slices. Besides, the SUVRs are calculated to describe the numerical stability of refined F-PET images by our framework relative to original 3D F-PET images. We compared the proposed transGAN-SDAM with 6 state-of-the-art models that are specially designed for L-PET reconstruction or medical image synthesis: uNet [20], dNet [9], CycleGAN [8], fpGAN [7], BiGAN [13] and 3D CycleGAN [21]. To avoid overfitting, we conducted the 10-fold cross-validation, where 8 folds are the training set, 1 fold is the validation set and remaining 1 fold as the test set. Due to the space limitation, the more implementation details, experimental setting, and some results of the comparison are shown in our supplementary materials.
4.1 Quantitative analysis
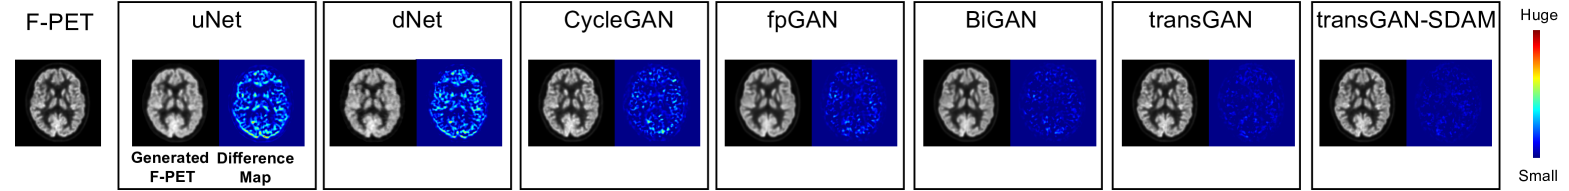
As shown in Table 1, we can observe that transGAN-SDAM significantly outperforms all of the competing models (p-values 0.05 for all paired comparisons) with the highest PSNR (33.94.0), SSIM (0.9500.04), and the lowest VSMD (0.0430.039), indicating that the quality of generated F-PET images by transGAN-SDAM is closest to the ground-truth. It is worth noting that the transGAN-SDAM module substantially improves PSNR by at least 2.0 dB, SSIM by at least , and decreases the VSMD by at least over these state-of-the-art approaches. We also find that SDAM can further refine the image quality to achieve higher PSNR, SSIM and lower VSMD when comparing transGAN and transGAN-SDAM. As shown in Fig. 2, we observe that transGAN and transGAN-SDAM can produce more accurate structural and metabolic details than compared approaches. The pseudo-color difference maps between the real and the generated F-PET images by different approaches are illustrated in Fig. 3, which shows that transGAN-SDAM achieves the smallest voxel-scale difference to the ground-truth F-PET images.
4.2 Efficiency and SUVR analysis
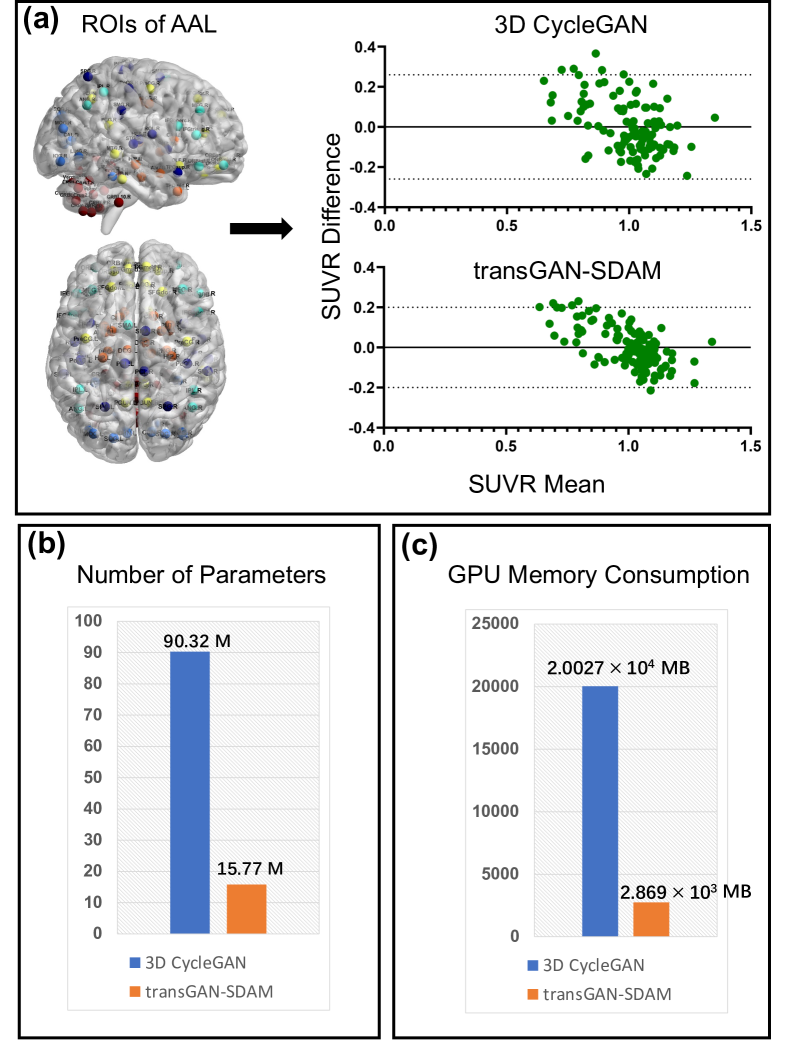
We further present the performance comparison between transGAN-SDAM and 3D CycleGAN [22] in Fig. 4. As show in Fig. 4 (a), we can observe that whole-brain SUVRs of transGAN-SDAM have smaller 95 limits of agreements (from -0.19 to 0.19), smaller 95 CI (from -0.018 to 0.018) and stronger correlation coefficient (0.831) than 3D CycleGAN (agreement from -0.26 to 0.26, CI from -0.024 to 0.024, correlation coefficient: 0.633). Meanwhile, 3D CycleGAN needs 90.32 M of parameters to train (Fig. 4 (b)) and MB of GPU memory to implement (Fig. 4 (c)), which means much higher resource consumption than our transGAN-SDAM (15.77 M of parameters to train and MB of GPU memory to implement). It indicates that compared with 3D-based models, our proposal can satisfy specific needs, e.g., high response speed and limited GPU resources.
5 Conclusion
In this paper, we propose the transGAN-SDAM as a resource-efficient framework for fast 2.5D-based L-PET reconstruction and accurate whole-brain quantitative analysis. Experimental results show that our proposal achieves the state-of-the-art performance on commonly used metrics, indicating the effectiveness and rationality of combining both transGAN and SDAM. This framework could facilitate the wider adoption of deep learning methods into clinical workflows.
6 Compliance with Ethical Standards
The study design and exemption from informed consent were approved by the Institutional Review Board of Hangzhou Universal Medical Imaging Diagnostic Center (Approval No. [2021] 001).
7 Acknowledgements
This work was supported in part by the grant from the National Science Foundation of China (No. 62034007), in part by the Zhejiang Provincial Innovation Team Project (No. 2020R01001), and in part by the Zhejiang Lab’s International Talent Fund for Young Professionals (ZJ2020JS013).
References
- [1] Tim J von Oertzen, “Pet and ictal spect can be helpful for localizing epileptic foci,” Current opinion in neurology, vol. 31, no. 2, pp. 184, 2018.
- [2] Csaba Juhász and Flóra John, “Utility of mri, pet, and ictal spect in presurgical evaluation of non-lesional pediatric epilepsy,” Seizure, vol. 77, pp. 15–28, 2020.
- [3] Hui Tan, Xiuli Sui, Hongyan Yin, Haojun Yu, Yusen Gu, Shuguang Chen, Pengcheng Hu, Wujian Mao, and Hongcheng Shi, “Total-body pet/ct using half-dose fdg and compared with conventional pet/ct using full-dose fdg in lung cancer,” European journal of nuclear medicine and molecular imaging, pp. 1–10, 2020.
- [4] Norah A Alotaibi, Derya Yakar, Andor WJM Glaudemans, and Thomas C Kwee, “Diagnostic errors in clinical fdg-pet/ct,” European Journal of Radiology, vol. 132, pp. 109296, 2020.
- [5] Sydney Kaplan and Yang-Ming Zhu, “Full-dose pet image estimation from low-dose pet image using deep learning: a pilot study,” Journal of digital imaging, vol. 32, no. 5, pp. 773–778, 2019.
- [6] Kevin T Chen, Enhao Gong, Fabiola Bezerra de Carvalho Macruz, Junshen Xu, Athanasia Boumis, Mehdi Khalighi, Kathleen L Poston, Sharon J Sha, Michael D Greicius, Elizabeth Mormino, et al., “Ultra–low-dose 18f-florbetaben amyloid pet imaging using deep learning with multi-contrast mri inputs,” Radiology, vol. 290, no. 3, pp. 649–656, 2019.
- [7] Jiahong Ouyang, Kevin T Chen, Enhao Gong, John Pauly, and Greg Zaharchuk, “Ultra-low-dose pet reconstruction using generative adversarial network with feature matching and task-specific perceptual loss,” Medical physics, vol. 46, no. 8, pp. 3555–3564, 2019.
- [8] Yang Lei, Xue Dong, Tonghe Wang, Kristin Higgins, Tian Liu, Walter J Curran, Hui Mao, Jonathon A Nye, and Xiaofeng Yang, “Whole-body pet estimation from low count statistics using cycle-consistent generative adversarial networks,” Physics in Medicine & Biology, vol. 64, no. 21, pp. 215017, 2019.
- [9] Karl Spuhler, Mario Serrano-Sosa, Renee Cattell, Christine DeLorenzo, and Chuan Huang, “Full-count pet recovery from low-count image using a dilated convolutional neural network,” Medical Physics, vol. 47, no. 10, pp. 4928–4938, 2020.
- [10] Karen Simonyan and Andrew Zisserman, “Very deep convolutional networks for large-scale image recognition,” arXiv preprint arXiv:1409.1556, 2014.
- [11] Phillip Isola, Jun-Yan Zhu, Tinghui Zhou, and Alexei A Efros, “Image-to-image translation with conditional adversarial networks,” in Proceedings of the IEEE conference on computer vision and pattern recognition, 2017, pp. 1125–1134.
- [12] Salman UH Dar, Mahmut Yurt, Levent Karacan, Aykut Erdem, Erkut Erdem, and Tolga Çukur, “Image synthesis in multi-contrast mri with conditional generative adversarial networks,” IEEE transactions on medical imaging, vol. 38, no. 10, pp. 2375–2388, 2019.
- [13] Shengye Hu, Yanyan Shen, Shuqiang Wang, and Baiying Lei, “Brain mr to pet synthesis via bidirectional generative adversarial network,” in International Conference on Medical Image Computing and Computer-Assisted Intervention. Springer, 2020, pp. 698–707.
- [14] Jonathan T Barron, “A general and adaptive robust loss function,” in Proceedings of the IEEE/CVF Conference on Computer Vision and Pattern Recognition, 2019, pp. 4331–4339.
- [15] Jia Deng, Wei Dong, Richard Socher, Li-Jia Li, Kai Li, and Li Fei-Fei, “Imagenet: A large-scale hierarchical image database,” in 2009 IEEE conference on computer vision and pattern recognition. Ieee, 2009, pp. 248–255.
- [16] Jifeng Dai, Haozhi Qi, Yuwen Xiong, Yi Li, Guodong Zhang, Han Hu, and Yichen Wei, “Deformable convolutional networks,” in Proceedings of the IEEE international conference on computer vision, 2017, pp. 764–773.
- [17] Shunjie Dong, Jinlong Zhao, Maojun Zhang, Zhengxue Shi, Jianing Deng, Yiyu Shi, Mei Tian, and Cheng Zhuo, “Deu-net: Deformable u-net for 3d cardiac mri video segmentation,” in International Conference on Medical Image Computing and Computer-Assisted Intervention. Springer, 2020, pp. 98–107.
- [18] Yapeng Tian, Yulun Zhang, Yun Fu, and Chenliang Xu, “Tdan: Temporally-deformable alignment network for video super-resolution,” in Proceedings of the IEEE/CVF Conference on Computer Vision and Pattern Recognition, 2020, pp. 3360–3369.
- [19] Shunjie Dong, Qianqian Yang, Yu Fu, Mei Tian, and Cheng Zhuo, “Rconet: Deformable mutual information maximization and high-order uncertainty-aware learning for robust covid-19 detection,” IEEE Transactions on Neural Networks and Learning Systems, 2021.
- [20] Kai Chen, Jiaqi Wang, Jiangmiao Pang, Yuhang Cao, Yu Xiong, Xiaoxiao Li, Shuyang Sun, Wansen Feng, Ziwei Liu, Jiarui Xu, et al., “Mmdetection: Open mmlab detection toolbox and benchmark,” arXiv preprint arXiv:1906.07155, 2019.
- [21] Kui Zhao, Long Zhou, Size Gao, Xiaozhuang Wang, Yaofa Wang, Xin Zhao, Huatao Wang, Kanfeng Liu, Yunqi Zhu, and Hongwei Ye, “Study of low-dose pet image recovery using supervised learning with cyclegan,” Plos one, vol. 15, no. 9, pp. e0238455, 2020.
- [22] Reda Oulbacha and Samuel Kadoury, “Mri to ct synthesis of the lumbar spine from a pseudo-3d cycle gan,” in 2020 IEEE 17th International Symposium on Biomedical Imaging (ISBI). IEEE, 2020, pp. 1784–1787.