Absolute dimensions of the G7+K7 eclipsing binary star IM Virginis: Discrepancies with stellar evolution models
Abstract
We report extensive spectroscopic and differential photometric observations of the active, detached, 1.309-day double-lined eclipsing binary IM Vir, composed of a G7-type primary and a K7 secondary. With these observations we derive accurate absolute masses and radii of , , , and for the primary and secondary, with relative errors under 2%. The effective temperatures are K and K. The significant difference in mass makes this a favorable case for comparison with stellar evolution theory. We find that both stars are larger than the models predict, by 3.7% for the primary and 7.5% for the secondary, as well as cooler than expected, by 100 K and 150 K, respectively. These discrepancies are in line with previously reported differences in low-mass stars, and are believed to be caused by chromospheric activity, which is not accounted for in current models. The effect is not confined to low-mass stars: the rapidly-rotating primary of IM Vir joins the growing list of objects of near-solar mass (but still with convective envelopes) that show similar anomalies. The comparison with the models suggests an age of 2.4 Gyr for the system, and a metallicity of [Fe/H] that is consistent with other indications, but requires confirmation.
Subject headings:
binaries: eclipsing - binaries: spectroscopic - stars: late-type - stars: fundamental parameters - stars: individual: IM Vir1. Introduction
Our knowledge of stellar structure and evolution rests heavily on the comparison between theory and observation. Double-lined eclipsing binaries (hereafter EBs) have long been at the center of this process, since they allow the mass – the most fundamental of all stellar properties – as well as the radius to be determined to very high precision (and accuracy), often as good as 1%, independently of the distance and independently of any calibrations. Such high precision enables stringent tests of theory, as described, e.g., by Andersen (1991). In the last decade or so it has become clear that stars in the lower main-sequence show significant discrepancies when compared to standard models. Studies of several key systems have shown unambiguously that the radii predicted by the models are systematically up to 10% too small, and the temperatures 5% too high (see Ribas et al., 2008, and references therein). The deviations are commonly attributed to the high level of chromospheric activity present in these systems. Orbital periods are typically short, and as a result tidal forces tend to synchronize the components’ rotation with the orbital motion. The rapid rotation, in turn, induces the activity, which can manifest itself in the form of copious X-ray emission, flaring, H and Ca II H and K emission, spottedness, and other effects.
According to the recent compilation by Torres et al. (2009), among the eclipsing binaries with at least one component below 0.8 M⊙ only five have reliable mass and radius determinations with relative errors that are smaller than 3%. These are, in order of decreasing mass, UV Psc (Popper, 1997), GU Boo (López-Morales & Ribas, 2005), YY Gem (Torres & Ribas, 2002), CU Cnc (Ribas, 2003), and CM Dra (Morales et al., 2009). A number of other similar systems are known, but are not yet at the same level of precision and accuracy. For further progress it is therefore important to either improve the determinations in the latter cases, or to find new ones where those conditions are met. The eclipsing system reported here is one of these, which in addition presents the largest difference in mass between the components, providing in principle extra leverage for the comparison with models.
IM Virginis (also HD 111487, 1E 1247.00548, , , J2000.0; G7 V, ) was detected as an X-ray source with the Einstein Observatory by Helfand & Caillault (1982). The radial-velocity variability was found by Silva et al. (1987), and subsequent spectroscopic and photometric studies carried out by Marschall et al. (1988, 1989) confirmed IM Vir to be both double-lined and eclipsing, and to be composed of a G7 star and a late-K or early-M star, thus piquing our interest. The orbital period was estimated as 1.3085 days.
Very little data on this binary have been published since, other than sparse photometry and occasional reports on the chromospheric activity and X-ray flaring (Strassmeier et al., 1993; Pandey & Singh, 2008). We present here extensive spectroscopic and differential photometric measurements that allow us to determine its fundamental properties with very high accuracy. The observations are presented in § 2 and § 3, followed by a detailed light-curve analysis in § 4 accounting for the presence of spots. The absolute dimensions are derived in § 5 with careful consideration of potential sources of systematic error, essential for the results to be useful. The comparison with models of stellar evolution is discussed in § 6, and we summarize our conclusions in § 7.
2. Spectroscopic observations and reductions
IM Vir was observed at the Harvard-Smithsonian Center for Astrophysics (CfA) with three nearly identical echelle spectrographs on the 1.5-m Tillinghast reflector at the F. L. Whipple Observatory (Mount Hopkins, Arizona), the 1.5-m Wyeth reflector at the Oak Ridge Observatory (Harvard, Massachusetts), and the 4.5-m equivalent Multiple Mirror Telescope (also on Mount Hopkins, Arizona) prior to its conversion to a 6.5-m monolithic telescope. Photon-counting intensified Reticon detectors (‘Digital Speedometers’; Latham, 1985, 1992) were used in each case to record a single 45 Å echelle order centered at a wavelength of 5188.5 Å, featuring the gravity-sensitive lines of the Mg I b triplet. The resolving power provided by this setup is . Nominal signal-to-noise (S/N) ratios for the 138 spectra we obtained range from 13 to 58 per resolution element of 8.5 km s-1. The first observation was taken in 1984 January 1, and monitoring continued until 2009 May 10. A handful of the early spectra are the same ones included in the work of Silva et al. (1987), who discovered the radial-velocity variability, but have been re-reduced and analyzed here with much improved methods, as we now describe.
All of our spectra are double-lined, but the secondary is comparatively quite faint, accounting for only 6% of the light of the primary (see below). Radial velocities for both stars were derived using TODCOR, a two-dimensional cross-correlation technique introduced by Zucker & Mazeh (1994). This method uses two templates, one for each component of the binary, which we selected from a large library of synthetic spectra based on model atmospheres by R. L. Kurucz (see Latham et al., 2002). These templates have been calculated for a wide range of effective temperatures (), surface gravities (), rotational velocities ( when seen in projection), and metallicities ([m/H]). Following Torres et al. (2002), the optimum templates were selected by running extensive grids of cross-correlations with TODCOR, seeking to maximize the average correlation weighted by the strength of each exposure. Because of the faintness of the secondary, only the parameters for the bright star can be determined reliably from our spectra. Initially we assumed , and determined and for a range of metallicities between [m/H] and [m/H] . The optimal values were found by interpolation in [m/H]. We then repeated the correlations for a lower value of in order to bracket the estimate from the analysis described later (). Interpolation in to this final value resulted in K and km s-1. The formal metallicity that maximizes the correlation is [m/H] = . While this suggests an overall abundance close to solar, the uncertainty is likely to be at least 0.25 dex, and we consider the estimate primarily as a free parameter included to optimize the match between the synthetic templates and the observed spectra. We note, furthermore, that because of our narrow spectral window, there is a strong correlation between temperature and metallicity. In this case, however, the value reported above is consistent with various photometric estimates described below in § 5, in turn lending more credence to the metallicity estimate. For the final velocity determinations we adopted the set of template parameters closest to the values above that maximizes the average correlation ( K, km s-1, , and solar composition). Small differences in these template parameters compared to the interpolated values do not affect the velocities significantly. For the secondary template we adopted the same metallicity, and parameters consistent with the results from § 5: K, km s-1, .
In addition to the velocities, we have determined the light ratio between the components at the mean wavelength of our observations, following Zucker & Mazeh (1994), accounting for the difference in line blocking between the primary and the much cooler secondary.111This is to correct the ratio of continuum heights for the fact that the lines of the secondary are intrinsically stronger, and subtract proportionately more flux from the spectral window. The value we obtain is .
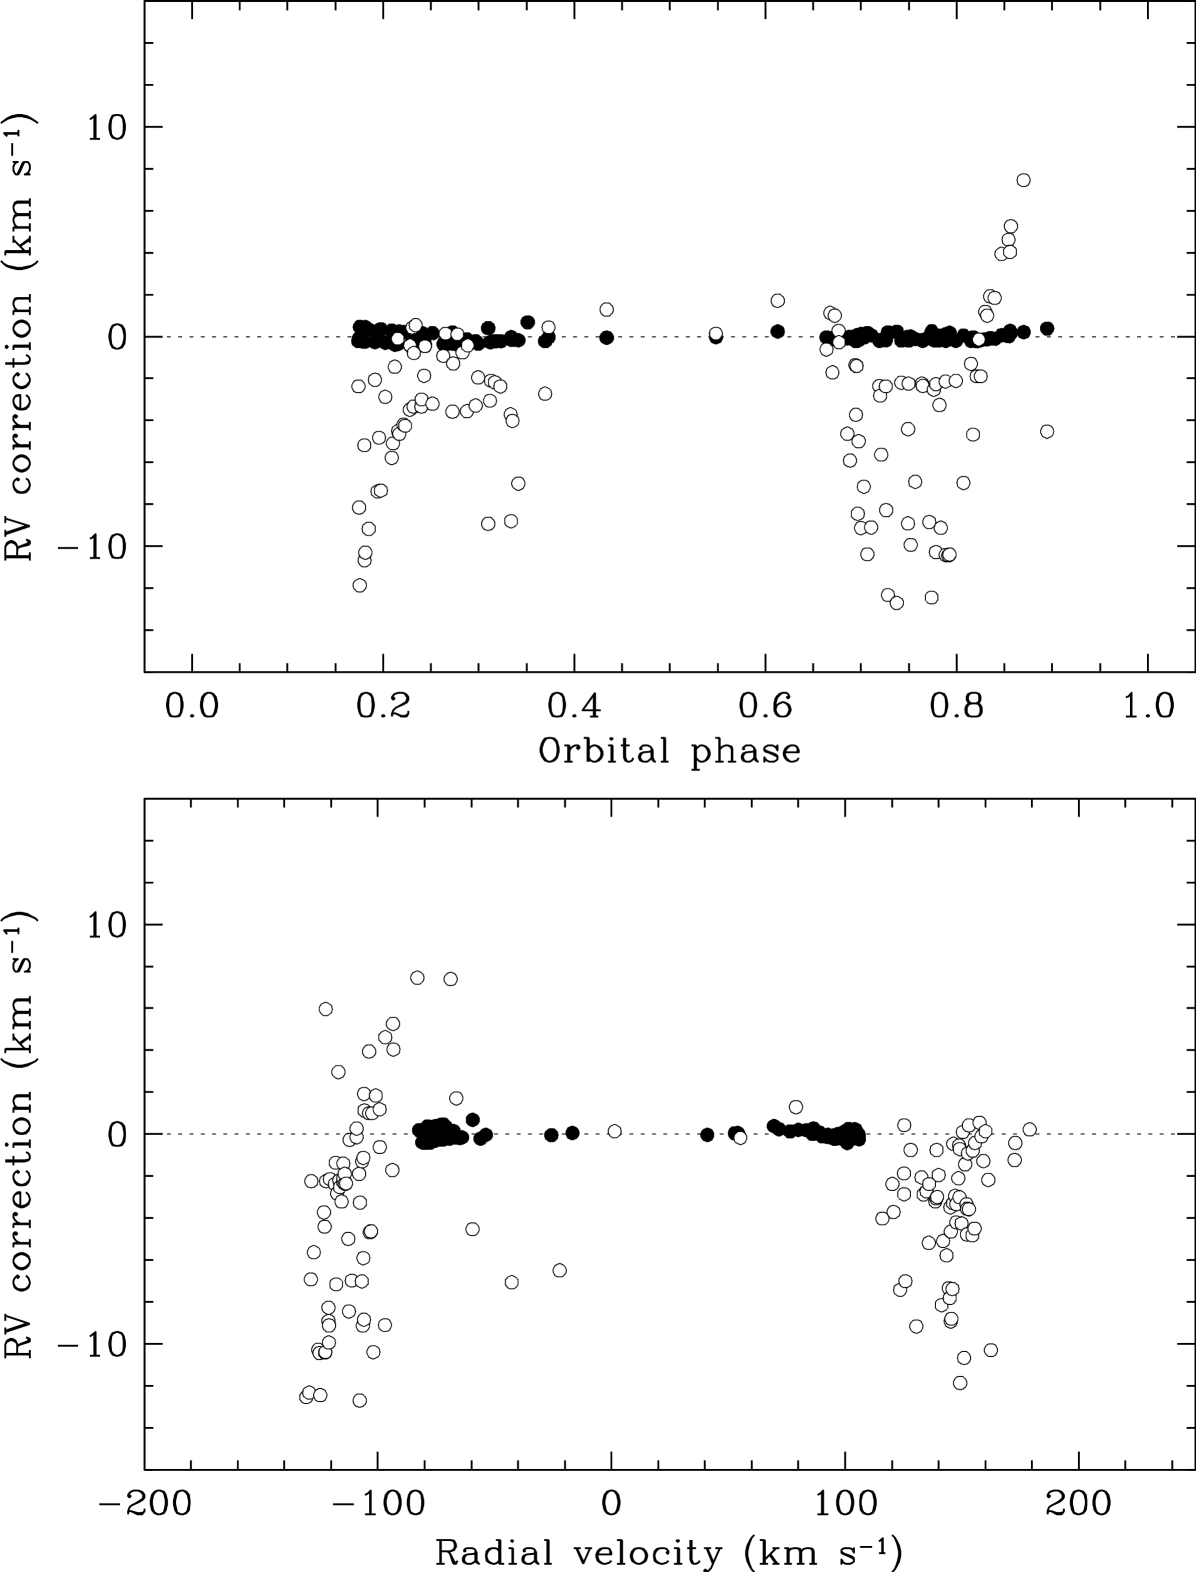
Although TODCOR significantly reduces systematic errors in the radial velocities caused by line blending, residual effects can remain as a result of shifts of the spectral lines in and out of our narrow spectral window as a function of orbital phase. Experience has shown that these effects must be examined on a case-by-case basis. We investigated them here by means of numerical simulations similar to those described by Latham et al. (1996) (see also Torres et al., 1997, 2000). We generated synthetic composite spectra matching our observations by combining copies of the primary and secondary templates used above, shifted to the appropriate velocities for each of the exposures as predicted by a preliminary orbital solution, and scaled to the observed light ratio. These synthetic observations were then processed with TODCOR in exactly the same way as the real spectra, and the resulting velocities were compared with the input shifts. The differences for IM Vir are shown in Figure 1, and are less than 0.5 km s-1 for the primary but reach values as large as 13 km s-1 for the secondary. Similarly large differences have been found occasionally for other systems using the same instrumentation (e.g., AD Boo, GX Gem, VZ Cep; Clausen et al., 2008; Lacy et al., 2008; Torres & Lacy, 2009). We have applied these differences as corrections to the raw velocities of IM Vir. The impact on the masses, however, is very small: only 0.26% for the primary and 0.14% for the secondary. The reason for this is that the large corrections for the secondary are similar and of the same sign at both quadratures, therefore amounting mostly to an overall systematic shift rather than a change in the velocity semi-amplitude. Similar adjustments based on the same simulations were made to the light ratio, and are already included in the value reported above.
| HJD | |||||||
|---|---|---|---|---|---|---|---|
| (2,400,000) | (km s-1) | (km s-1) | (km s-1) | (km s-1) | (km s-1) | (km s-1) | Phase |
| 45719.9949. | 67.58 | 144.06 | 1.54 | 13.01 | 0.30 | 9.61 | 0.1661 |
| 45743.0126. | 105.93 | 116.81 | 0.83 | 6.98 | 1.08 | 3.76 | 0.7555 |
| 45750.8945. | 100.91 | 122.28 | 1.58 | 13.30 | 2.51 | 3.82 | 0.7785 |
| 45754.0581. | 74.09 | 148.80 | 1.54 | 12.97 | 1.10 | 3.56 | 0.1961 |
| 45754.0603. | 71.28 | 149.09 | 1.90 | 16.05 | 4.23 | 3.38 | 0.1977 |
Note. — This table is available in its entirety in a machine-readable form in the online journal. A portion is shown here for guidance regarding its form and content.
The stability of the zero-point of the CfA velocity system was monitored by means of exposures of the dusk and dawn sky, and small run-to-run corrections were applied in the manner described by Latham (1992). The final velocities, including these offsets as well as the corrections for systematics, are listed in Table 1 along with their uncertainties. The median values for the velocity errors are 0.90 km s-1 for the primary and 7.6 km s-1 for the secondary.
Preliminary single-lined orbital solutions carried out separately for the primary and secondary indicated a significant zero-point difference (i.e., a difference in the systemic velocity ), which is often seen by many investigators in cases where there is a slight mismatch between the spectra of the real stars and the templates used for the cross-correlations (see, e.g., Popper, 2000; Griffin et al., 2000). Numerous experiments with other templates did not remove the offset, which is about 4 km s-1 (the secondary velocities being systematically larger). In IM Vir this most likely arises because of the cool temperature of the secondary, and the fact that synthetic templates for such stars become increasingly unrealistic due to missing opacity sources in the models. In order to prevent this offset from affecting the velocity semiamplitudes, we have therefore accounted for it by including it as an additional free parameter in our double-lined solution. Effectively this means we allow each component to have its own center-of-mass velocity, without significantly affecting the velocity semiamplitude of the component, and hence without affecting the individual mass determination. On the other hand, the offset implies additional uncertainty in the true center-of-mass velocity of the binary, beyond the formal errors listed below. We do not expect a significant template mismatch for the solar-type primary, so the systemic velocity is most likely to be closer to the value for that star.
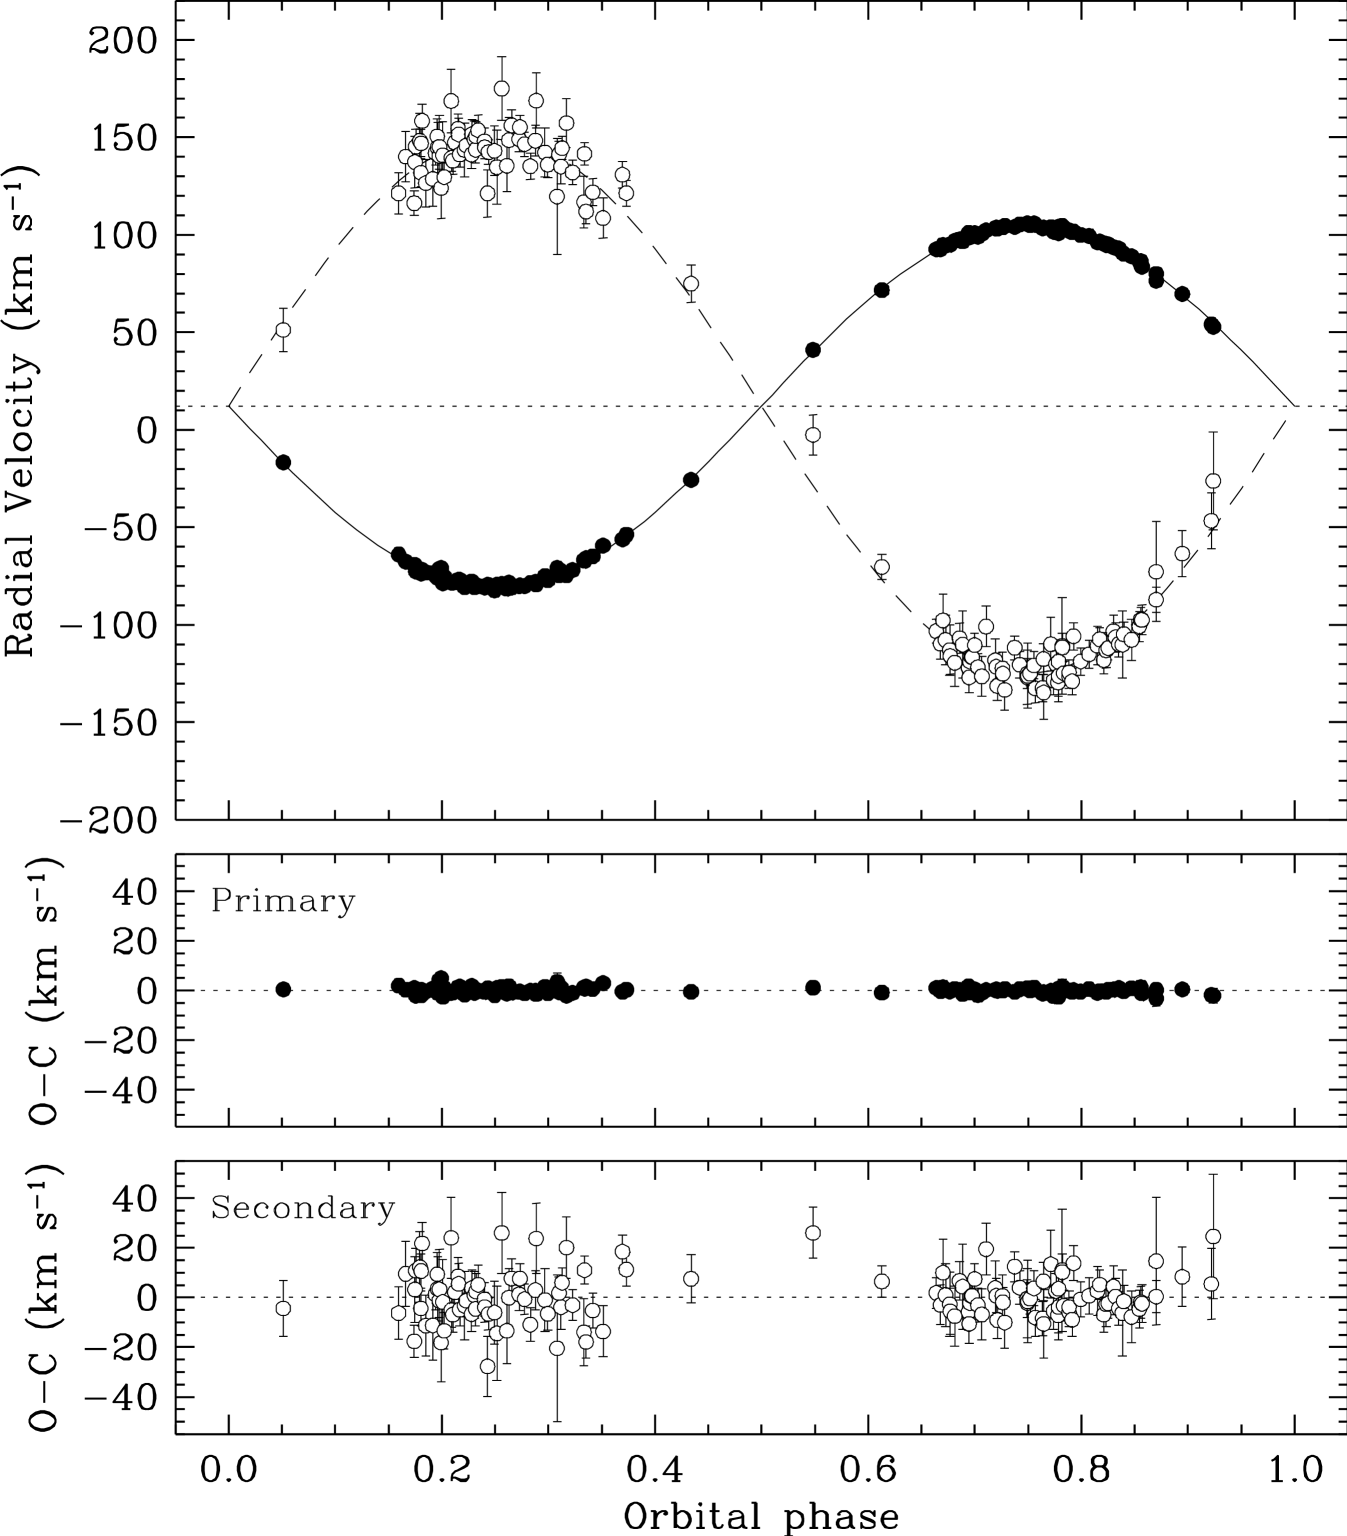
The results are presented in Table 2, in which the measurements have been weighted according to their uncertainties in the usual way, and the errors rescaled by iterations to achieve a reduced value near unity, separately for the primary and secondary. No indication of significant eccentricity was found, as expected for such a short orbital period, and the final orbit was therefore considered circular. The observations and computed curve are displayed graphically in Figure 2, along with the residuals, which are also listed in Table 1.
| Parameter | Value |
|---|---|
| Adjusted quantities | |
| (days). | 1.30861497 0.00000034 |
| (HJD)aaTime of primary eclipse.. | 52402.87420 0.00052 |
| (km s-1). | 92.684 0.088 |
| (km s-1). | 136.84 0.74 |
| bbFixed; see text.. | 0 |
| (km s-1)ccTrue uncertainty may be larger due to systematic effects; see text.. | +12.221 0.082 |
| (km s-1)ddZero-point difference between the primary and secondary velocities, in the sense primary minus secondary.. | 3.96 0.69 |
| Derived quantities | |
| (). | 0.978 0.012 |
| (). | 0.6621 0.0044 |
| . | 0.6773 0.0037 |
| (106 km). | 1.6678 0.0016 |
| (106 km). | 2.462 0.013 |
| (106 km). | 4.130 0.013 |
| Other quantities pertaining to the fit | |
| (km s-1). | 0.99 |
| (km s-1). | 8.39 |
| . | 138 |
| Time span (days). | 9241.7 |
3. Photometric observations
Differential photometric observations of IM Vir were conducted in 2006 April and May using the 0.4-m Ealing Cassegrain reflector of the Gettysburg College Observatory (GCO, Gettysburg, Pennsylvania). The camera was a Photometrics (Roper Scientific) CH-350 thermoelectrically-cooled unit equipped with a SITe 003B back-illuminated scientific grade CCD chip and Bessell filters. Exposure times were 120, 60, 25, and 20 seconds, respectively. We obtained 597, 672, 630, and 631 observations in , , , and , with a cadence of about 6 minutes. The field of view of the GCO camera is approximately 18 arcmin, and since IM Vir is a relatively bright target, this severely limited our choice of reference stars of comparable magnitude and color to two: BD05 3573 (‘comp’, , , J2000.0; , ) and HD 111427 (‘check’, , , J2000.0; , ). The colors of these two stars are in fact nearly identical to that of the variable, which is (see § 5).
Differential photometry was performed on IM Vir and the two reference stars in all our images by means of MIRA-AP software (http://www.mirametrics.com/). We employed standard aperture photometry techniques to derive instrumental magnitudes, setting the radius of the measuring apertures for each night using a standard value of 2.5 times the FWHM of the seeing disk, based on previous curve-of-growth calibrations using the same equipment. Typical errors as represented by the scatter of the compcheck differences are 0.0132 mag in , 0.0124 mag in , 0.0135 mag in , and 0.0150 mag in . The primary eclipse is 0.62 mag deep in , while the depth of the secondary is only 0.08 mag.
| HJD | Comp-Var | Comp-Check | |
|---|---|---|---|
| (2,400,000) | Phase | (mag) | (mag) |
| 53835.58358. | 0.8288 | 0.811 | 0.966 |
| 53835.58732. | 0.8317 | 0.849 | 0.995 |
| 53835.59108. | 0.8345 | 0.852 | 1.000 |
| 53835.59482. | 0.8374 | 0.853 | 1.007 |
| 53835.59857. | 0.8403 | 0.854 | 1.005 |
Note. — This table is available in its entirety in a machine-readable form in the online journal. A portion is shown here for guidance regarding its form and content.
| HJD | Comp-Var | Comp-Check | |
|---|---|---|---|
| (2,400,000) | Phase | (mag) | (mag) |
| 53835.58481. | 0.8298 | 0.848 | 0.994 |
| 53835.58855. | 0.8326 | 0.846 | 0.999 |
| 53835.59230. | 0.8355 | 0.839 | 0.989 |
| 53835.59605. | 0.8383 | 0.838 | 0.998 |
| 53835.60705. | 0.8468 | 0.826 | 0.985 |
Note. — This table is available in its entirety in a machine-readable form in the online journal. A portion is shown here for guidance regarding its form and content.
| HJD | Comp-Var | Comp-Check | |
|---|---|---|---|
| (2,400,000) | Phase | (mag) | (mag) |
| 53835.62654. | 0.8616 | 0.584 | 1.027 |
| 53835.63031. | 0.8645 | 0.660 | 1.011 |
| 53835.63406. | 0.8674 | 0.685 | 1.002 |
| 53835.63781. | 0.8703 | 0.704 | 1.003 |
| 53835.64157. | 0.8731 | 0.708 | 1.005 |
Note. — This table is available in its entirety in a machine-readable form in the online journal. A portion is shown here for guidance regarding its form and content.
| HJD | Comp-Var | Comp-Check | |
|---|---|---|---|
| (2,400,000) | Phase | (mag) | (mag) |
| 53835.58592. | 0.8306 | 0.933 | 1.013 |
| 53835.58967. | 0.8335 | 0.933 | 1.014 |
| 53835.59342. | 0.8363 | 0.939 | 1.034 |
| 53835.59717. | 0.8392 | 0.929 | 1.025 |
| 53835.60091. | 0.8421 | 0.946 | 1.032 |
Note. — This table is available in its entirety in a machine-readable form in the online journal. A portion is shown here for guidance regarding its form and content.
Examination of the raw photometry revealed slight trends in the compcheck differences that changed from night to night and are most likely of instrumental origin. Neither star is known to be variable, and we find no periodicities or other discernible patterns. Consequently, we de-trended the IM Vir measurements by removing the median value of the compcheck differences calculated over intervals of a few hours. Even after this correction, the sparser second half of the data presents a systematic 0.01 mag difference (fainter) in the out-of-eclipse light level compared to the first half, and other occasional changes possibly due to temporal evolution of surface inhomogeneities (spots) on the surface of one or both stars. This would indicate a timescale for evolution of these features of a few weeks. For these reasons we have chosen to restrict our analysis to the first half of the observations (spanning 22 days), which provide complete coverage of both eclipses and are cleaner overall. The complete data set is given for all filters in Tables 3–6 in its original form, i.e., without the nightly corrections, and we list also the compcheck differences.
Additional photometry of IM Vir has been reported by Manfroid et al. (1991) in the Strömgren system. These data were obtained some twenty years earlier than our own measurements, between 1983 May and 1986 July. Unfortunately the coverage of the eclipses is very incomplete, as shown later, so these data are not useful for determining the geometric parameters of the system. Nevertheless, it is possible to extract an average time of eclipse, which we present below, as well as brightness ratios in the different bands, which will be used in § 5 to deconvolve the light of the two stars in order to obtain photometric estimates of the temperatures and metallicity.
3.1. Ephemeris and times of minimum
The ephemeris adopted for the remainder of this paper is the one calculated from the spectroscopy,
| (1) |
which, by virtue of the 25-year radial-velocity coverage, is much more accurate than could ever be obtained from the 64-day interval of the photometric observations. The uncertainties are indicated above in parentheses.
Three times of eclipse from the photometry have been measured by fitting the light-curve model described below (including spot parameters) to each night with sufficient coverage of a primary or secondary minimum, simultaneously in all four passbands. The only adjustable parameter allowed in these fits was a time shift. A similar procedure was followed with the Manfroid et al. (1991) photometry, with the primary luminosity in each band added as a free parameter and no spots considered. The resulting eclipse timings for IM Vir are collected in Table 7, along with an average time of eclipse from the spectroscopy, and the few additional times found in the literature.
| HJD | OC | ||||
|---|---|---|---|---|---|
| (2,400,000) | (days) | TypeaaEclipses labeled as ‘I’ for primary, and ‘II’ for secondary. | Instr. | (days) | SourceccSource: 1. Mean epoch from the Manfroid et al. (1991) photometry; 2. B.R.N.O. database (http://var.astro.cz); 3. Ogloza et al. (2008); 4. This work. |
| 46042.99984 | 0.00097 | I | ccd | 0.00561 | 1 |
| 51274.8750 | I | ccd | +0.02690 | 2 | |
| 51885.9610 | I | vis | 0.01029 | 2 | |
| 52402.87420bbMean epoch from the radial velocities. | 0.00052 | I | spec | 0.0 | 4 |
| 53474.62948 | 0.00055 | I | ccd | 0.00038 | 3 |
| 53843.65995 | 0.00010 | I | ccd | +0.00067 | 4 |
| 53845.62427 | 0.00052 | II | ccd | +0.00207 | 4 |
| 53877.68325 | 0.00038 | I | ccd | 0.00002 | 4 |
4. Light curve analysis
The differential photometry described in § 3 was phase-folded with the adopted ephemeris, and analyzed with the 2003 version of the WD code (Wilson & Devinney, 1971; Wilson, 1979). For the reasons indicated earlier, only the first half of the data were used (22 nights worth). The main light curve parameters adjusted are the orbital inclination (), the pseudo-potentials ( and ), the secondary effective temperature (), the primary luminosity (), and a phase shift. The latter would normally be unnecessary given the accuracy of the spectroscopic ephemeris and the short interval of the photometric observations. However, as we describe below, the light curves of IM Vir present distortions we ascribe to spots, which can cause asymmetries in the eclipses that may appear as phase shifts. Since these distortions are modeled here only in a simplified way, it is prudent to include a phase shift as an additional parameter to supplement the spot model. The primary temperature was held fixed at the spectroscopic value of 5570 K, since the light curves do not provide a strong enough constraint on both temperatures, but only on their ratio. Emergent intensities used in the program were taken from model atmospheres described by van Hamme & Wilson (2003). Square-root limb-darkening coefficients for the Johnson-Cousins bands were interpolated from the tables by Claret (2000a), and adjusted dynamically according to the current temperatures and surface gravities of the stars at each iteration. The reflection albedos were fixed at the value 0.5, appropriate for stars with convective envelopes, and the gravity darkening exponents were set to 0.34 for the primary and 0.40 for the secondary, following Claret (2000b). The orbit was initially considered to be circular, and spin-orbit synchronization was assumed based on the evidence presented in § 5. The photometric measurements in the four passbands were fitted simultaneously. Outliers were rejected by 3- clipping based on preliminary solutions. Convergence in the final fit was considered to have been achieved when the corrections to the elements were smaller than the internal errors in three consecutive iterations.
As is common in eclipsing binaries with late-type components, the light curves of IM Vir show out-of-eclipse modulations that are attributable to spots. There is also a slight difference in the light level at the two quadratures. These variations can in principle be modeled with the WD code in the approximation of circular spots of uniform temperature. In practice, however, such modeling is fraught with difficulties and there is abundant literature discussing problems of indeterminacy and non-uniqueness, particularly when using data of limited quality (see, e.g., Eker, 1996, 1999, and references therein). Nevertheless, because we are interested in recovering the geometric parameters of the system as free as possible from systematic errors, we have made an effort to account for these modulations by considering up to two spots.
While the subset of the photometric observations used here spans only 22 days, our spectroscopic coverage extends for more than 25 years. Given the changes in the light curves mentioned in § 3, the photometry is modeled separately from the radial velocities as any spot model would not apply to both. In a detached system such as this the photometry does not constrain the mass ratio, so the value of was adopted from the spectroscopy.
The parameters representing the spots in the WD model are the latitude (), longitude (), angular radius () and temperature contrast relative to the photosphere (). Only cool spots have been considered. The latitude is essentially unconstrained by our data, and the spot size and temperature factor are strongly correlated with each other and cannot usually be adjusted simultaneously. Thus, only the longitude and the spot size were adjusted at the same time as the geometric parameters, while the latitude and contrast factor were held fixed and estimated through a grid search. We explored values over a wide range in from +80° to 80° in steps of 20°, a range in the primary from 0.85 to 0.95, and a range from 0.75 to 0.85 for the secondary , both with a step size of 0.05. As indicated above, it is virtually impossible to tell which star has the spot(s), so we have considered here only three possible scenarios: two spots on the primary, two on the secondary, or one spot on each star.
| Parameter | Primary | Secondary |
|---|---|---|
| Geometric properties | ||
| Phase shift. | 0.0006 0.0001 | |
| (deg). | 87.24 0.16 | |
| . | 6.298 0.023 | 7.081 0.038 |
| . | 0.1776 0.0007 | 0.1145 0.0007 |
| . | 0.1796 0.0008 | 0.1151 0.0008 |
| . | 0.1784 0.0007 | 0.1147 0.0007 |
| . | 0.1776 0.0008 | 0.1150 0.0007 |
| aaVolume radius derived from the fitted parameters.. | 0.1785 0.0008 | 0.1146 0.0010 |
| Radiative properties | ||
| (K). | 5570bbFixed according to the spectroscopic analysis. | 4246 16 |
| band. | 0.04805 0.00008 | |
| band. | 0.07499 0.00016 | |
| band. | 0.10960 0.00027 | |
| band. | 0.14267 0.00036 | |
| AlbedoccFixed; see text.. | 0.5 | |
| Gravity darkeningccFixed; see text.. | 0.34 | 0.40 |
| Limb darkening coefficients (square root law) | ||
| band. | 0.625 | 0.904 |
| band. | 0.240 | 0.057 |
| band. | 0.364 | 0.644 |
| band. | 0.450 | 0.190 |
| band. | 0.237 | 0.462 |
| band. | 0.517 | 0.354 |
| band. | 0.137 | 0.269 |
| band. | 0.539 | 0.475 |
| Spots properties | ||
| LatitudeccFixed; see text. (deg). | 60 | 60 |
| Longitude (deg). | 307.3 4.9 | 331.8 4.7 |
| Radius (deg). | 26.4 1.2 | 36.0 2.5 |
| factorccFixed; see text.. | 0.95 | 0.80 |
| Residuals and number of observations | ||
| / . | 0.01347 / 438 | |
| / . | 0.01295 / 495 | |
| / . | 0.01300 / 443 | |
| / . | 0.01399 / 455 | |
| Individual light-curve fits | Standard error estimates | Adopted fit | ||||||||||
|---|---|---|---|---|---|---|---|---|---|---|---|---|
| Parameter | Value | |||||||||||
| Phase shift. | 0.0007 | 0.0007 | 0.0006 | 0.0004 | 0.00014 | 0.00010 | 0.00010 | 0.0006 | 0.0002 | |||
| (deg). | 87.38 | 87.22 | 86.91 | 87.83 | 0.38 | 0.08 | 0.16 | 87.24 | 0.42 | |||
| . | 4272 | 4191 | 4231 | 4304 | 49 | 56 | 16 | 4246 | 83 | |||
| . | 6.257 | 6.289 | 6.304 | 6.431 | 0.077 | 0.018 | 0.023 | 6.298 | 0.082 | |||
| . | 7.091 | 7.080 | 7.003 | 7.220 | 0.090 | 0.044 | 0.038 | 7.08 | 0.11 | |||
| . | 0.1798 | 0.1788 | 0.1783 | 0.1743 | 0.0024 | 0.0006 | 0.0008 | 0.1785 | 0.0026 | |||
| . | 0.1144 | 0.1146 | 0.1161 | 0.1119 | 0.0017 | 0.0009 | 0.0010 | 0.1146 | 0.0022 | |||
| (). | 0.04999 | – | – | – | – | 0.0041 | 0.00021 | 0.0480 | 0.0041 | |||
| (). | – | 0.05366 | – | – | – | 0.0054 | 0.00030 | 0.0750 | 0.0054 | |||
| (). | – | – | 0.10928 | – | – | 0.0065 | 0.00042 | 0.1096 | 0.0065 | |||
| (). | – | – | – | 0.15179 | – | 0.0068 | 0.00050 | 0.1427 | 0.0068 | |||
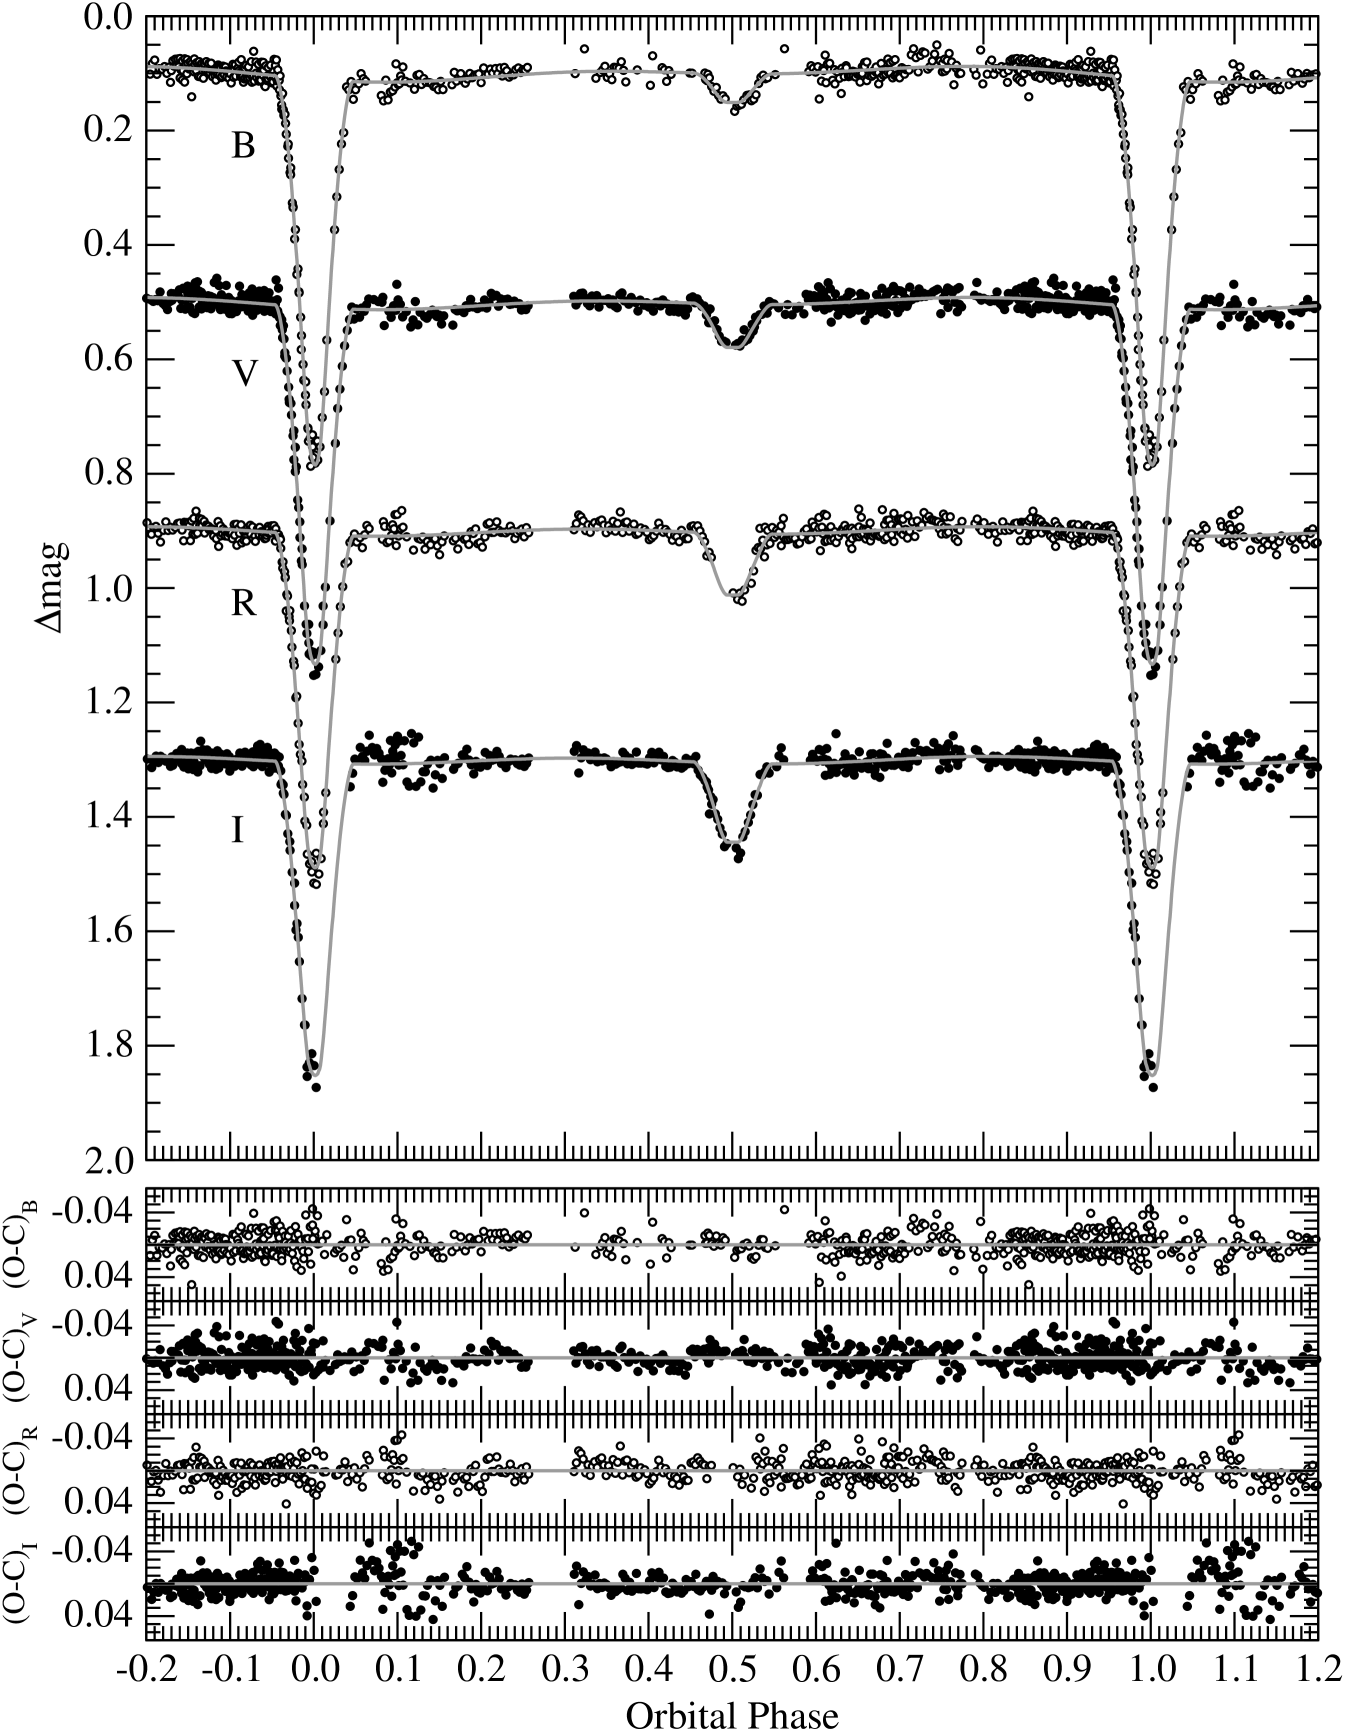
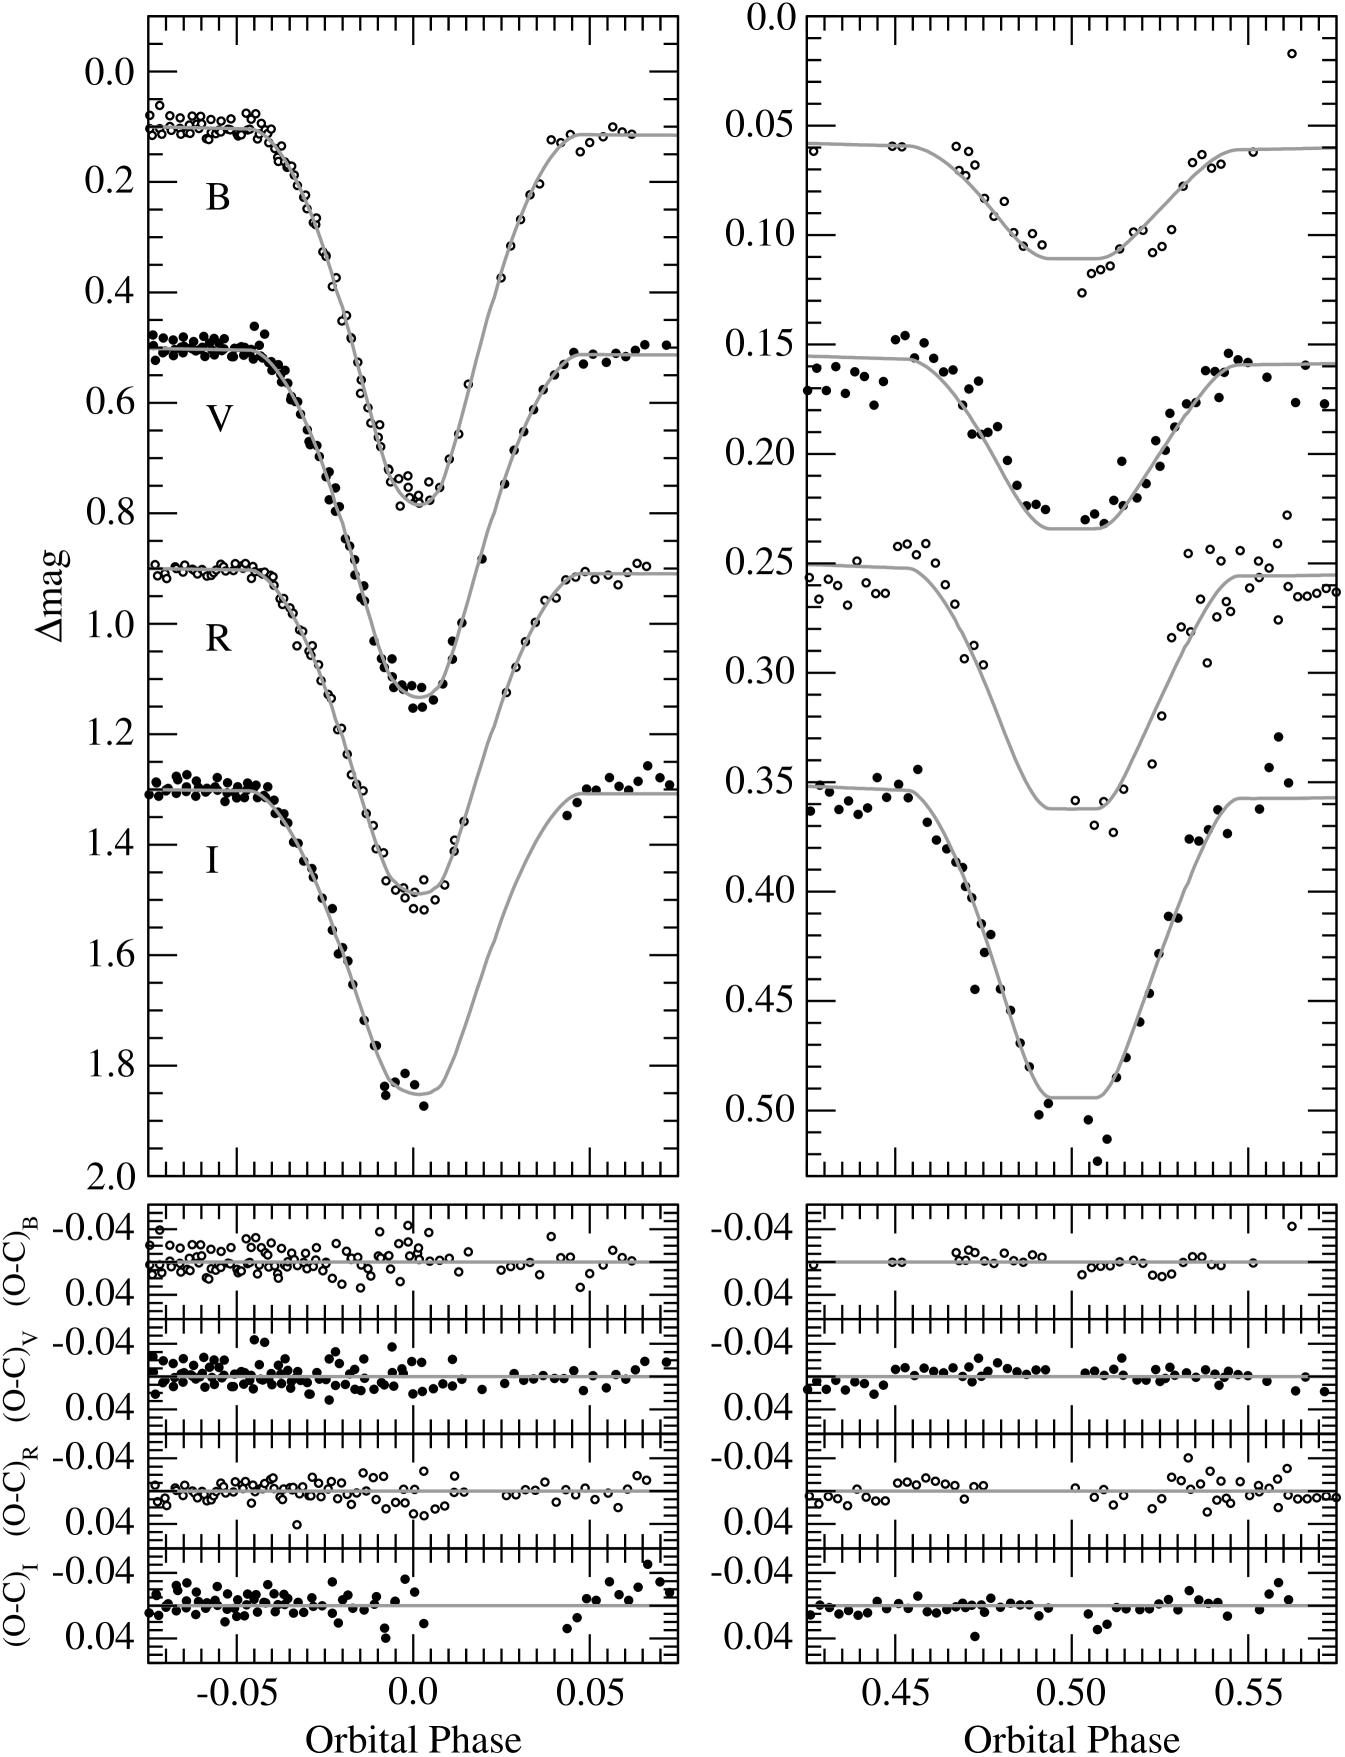
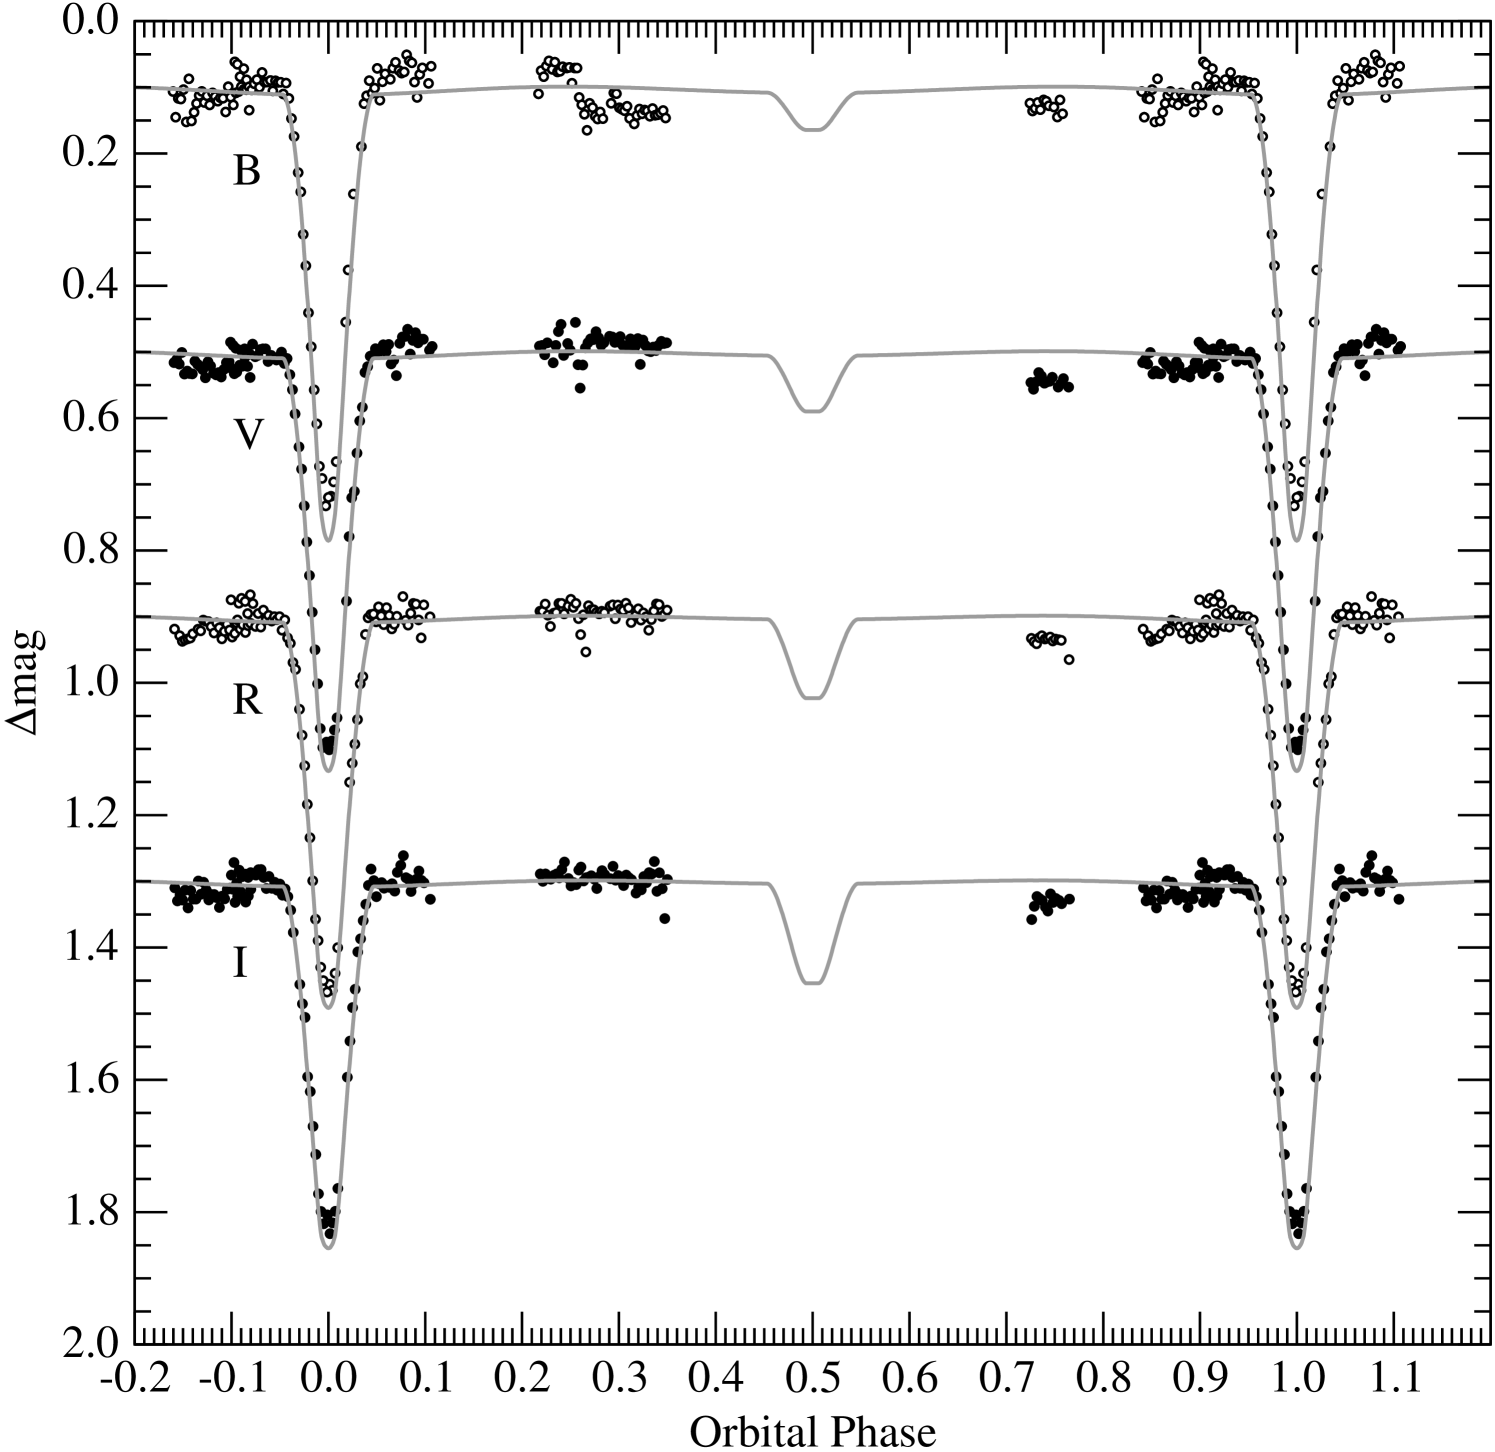
The best solutions were typically obtained with the spots located in the southern hemisphere, although we do not assign any particular physical significance to this as we only consider the spot modeling as a means of removing a perturbation from the underlying light curve. The overall best fit has one spot on each component, and a reduced square that is only marginally better than the other two scenarios (1.5% lower than the case with two spots on the primary, and 3.4% lower than the two-spot configuration on the secondary). The parameters of this best fit are listed in Table 8, and the synthetic curves are shown together with the observations in Figure 3 and Figure 4. Among the quantities derived from this fit, the light ratios allow for an important consistency check against the ratio obtained directly from our spectra. Interpolating between and to the mean wavelength of our spectroscopic observations, we obtain , which agrees well with the value of from § 2. The effect of the spots on the light curves is illustrated in Figure 5, and is seen to range from 0.025 mag in to 0.015 mag in (peak-to-peak). A depiction of the location of the spots on each star is shown in Figure 6. The spot on the primary covers 5.2% of its surface, while that of the secondary covers 9.5%.


In order to provide more realistic uncertainties for the geometric and radiative parameters than the internal errors reported in Table 8, we have considered additional sources of error as follows: (a) We ran WD solutions separately for each passband, with the spot parameters fixed at their final values, and examined the differences in the parameters. These fits are summarized in Table 9. The dispersion in each parameter about the average of the four bands () was taken as an additional contribution to the overall uncertainty. (b) We calculated the range in each parameter from the simultaneous fits in the three spot scenarios, and adopted half of this range as an additional contribution to account for the degeneracy in the spot modeling. (c) As a check on the internal errors from WD, we continued the iterations in our adopted fit beyond convergence for another 200 steps, and we examined the scatter of those 200 solutions. For the main parameters (, , , ) the scatter was only a small fraction of the internal errors, but for the light ratios it was typically a factor of two larger. We adopted the larger of the two estimates in each case.
These three sources of error (, , and in Table 9) were combined quadratically, and are the ones we assign to the final light-curve parameters. Changes in the adopted mass ratio within its error have no additional effect. The parameters and these errors, which we believe to be realistic, are listed in the last two columns of Table 9. Further solutions were carried out allowing the eccentricity to vary, but in all cases we found the result to be insignificant compared to its error, consistent with the indications from spectroscopy. Third light was also tested for at various stages of the analysis, but was always found to either converge toward negative (unphysical) values, or to be consistent with zero. Different limb-darkening laws were tested as well (linear, logarithmic), but the differences with the results in Table 9 were minimal (well within the errors).
The final solution indicates the two stars are nearly spherical, the difference between and being only 1.1% for the primary and 0.5% for the secondary. The primary eclipse is annular (48% of the light of that star blocked), while the secondary is total (see Figure 4), with the totality phase lasting 28 minutes.
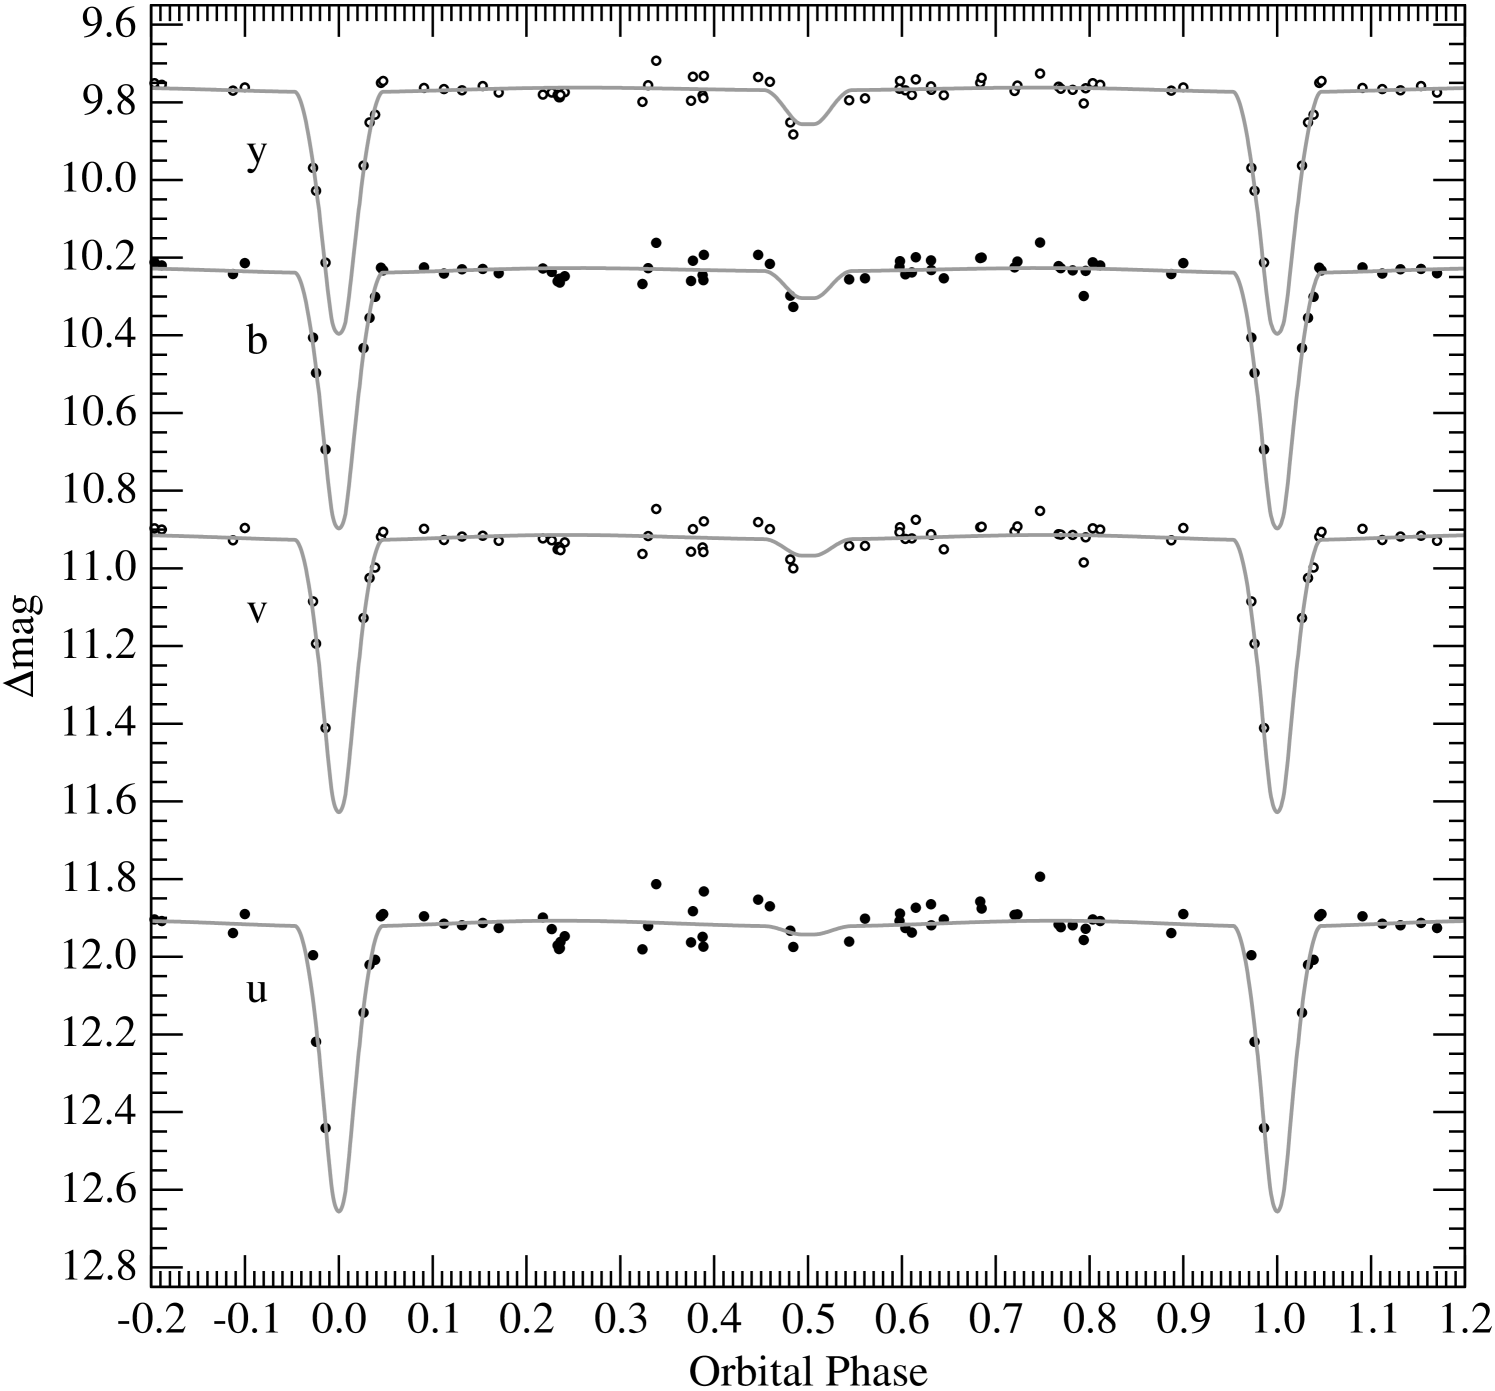
The second half of our photometry, not used here because of likely changes in the spots and more incomplete phase coverage, is compared with our final model for the geometry in Figure 7, excluding the spot terms. The larger scatter is obvious, but the fit is still quite reasonable. Figure 8 displays our fits to the sparser Strömgren photometry by Manfroid et al. (1991). Brightness ratios from these solutions (0.0167, 0.0353, 0.0599, and 0.0775 in , respectively) are used below to separate the light of the two components and derive a photometric estimate of their effective temperatures and metallicity.
5. Absolute dimensions
The absolute masses and radii for the components of IM Vir follow from our spectroscopic and light curve solutions described in the preceding sections. The effect that spots may have on the relative radii has been considered explicitly in our light-curve modeling, and included in our error estimates. Similar effects may influence the masses, although we do not expect them to be significant since they would tend to average out over the extended coverage of our spectroscopy. Nevertheless, the spot models in § 4 allow us to quantify the importance of these effects. Figure 9 shows the distortions in the radial velocities expected from each of the three spot scenarios considered earlier. As a test, we perturbed the radial velocities using these curves and repeated the spectroscopic orbital solutions. Compared to our adopted fit (Table 2), the differences were less than 0.6% in the minimum masses. The differences in , which affects the absolute radii, were less than 0.2%. To be conservative, for the calculation of the final mass and radius uncertainties we have augmented the errors in Table 2 by adding in quadrature half of the range in and obtained from the three spot configurations. With this, the absolute masses of IM Vir are determined to 1.2% and 0.7% for the primary and secondary, and the absolute radii to 1.5% and 1.9%.

Next in importance to the masses and radii are the effective temperatures of the stars. The temperature difference (or ratio) is accurately determined from the light curves, but the absolute scale is set by the primary value, which is fixed in our analysis. As a check on the spectroscopic value of 5570 K adopted here, we made use of absolute photometry available for IM Vir from a variety of sources, along with color/temperature calibrations. Brightness measurements were compiled from the 2MASS catalog (Cutri et al., 2003), the Tycho-2 catalog (Høg et al., 2000), Strömgren photometry from Manfroid et al. (1991) and Morale et al. (1996), and our own measurements outside of eclipse, transformed to the standard system using the comparison and check stars. For the Manfroid et al. (1991) photometry we considered only the data out of eclipse. The Tycho-2 and Morale et al. (1996) measurements are quite numerous and can be considered to be little affected by the minima. The date of the 2MASS measurements indicates they were taken during the egress of a secondary eclipse; corrections of order 0.03 mag (slightly different in each band) were applied to based on our light curve solutions, extended to the near-infrared. The adopted magnitudes for the combined light in all passbands are listed in Table 10. With these we formed 8 different color indices, also listed in the table, and then deconvolved the light to obtain the individual indices for the two stars. The light ratios in and for the deconvolution were adopted from Table 9, and those for the Strömgren passbands from our fits in the previous section. For the other passbands we used model isochrones (Girardi et al. 2000 for the Tycho-2 bands, and Baraffe et al. 1998 for the bands, after conversion to the 2MASS system). Two different isochrone ages were tried (1 Gyr and 5 Gyr), although the differences were well within the errors. Color/temperature calibrations from Ramírez & Meléndez (2005), Casagrande et al. (2006), and González Hernández & Bonifacio (2009) were then applied to the primary indices, assuming solar metallicity. Although the color indices are not independent of each other, they do serve to test the internal consistency between the various photometric systems and the three different calibrations. The interagreement is very good (typically within 150 K). The weighted average is K when using the 1 Gyr isochrones for the light ratios, and 40 K less when adopting 5 Gyr. We regard these to be in very good agreement with the spectroscopic value, considering the uncertainties. Changing the metallicity for the calibrations to the rough estimate from § 2 ([m/H] ) reduces the photometric temperatures by less than 10 K. A similar exercise using the indices for the secondary and an additional calibration for cool stars by Casagrande et al. (2008) gives a more uncertain result of K (as expected from the faintness of the star), but still consistent with the much more accurate value based on the light curve analysis, which is K. These tests suggest that the adopted temperatures for IM Vir are accurate. They correspond to spectral types of G7 V for the primary and K7 V for the secondary.
| Passband | Value |
|---|---|
| Magnitudes | |
| . | 10.234 0.030 |
| . | 9.574 0.030 |
| . | 10.209 0.021 |
| . | 9.748 0.017 |
| . | 10.483 0.039 |
| . | 9.768 0.030 |
| . | 8.176 0.020aaCorrections of 0.026, 0.030, and 0.035 mag have been applied to the measured values to account for the fact that the 2MASS observation was made during the egress of a secondary eclipse (see text). |
| . | 7.712 0.025aaCorrections of 0.026, 0.030, and 0.035 mag have been applied to the measured values to account for the fact that the 2MASS observation was made during the egress of a secondary eclipse (see text). |
| . | 7.634 0.024aaCorrections of 0.026, 0.030, and 0.035 mag have been applied to the measured values to account for the fact that the 2MASS observation was made during the egress of a secondary eclipse (see text). |
| Color indices | |
| . | 0.661 0.028 |
| . | 0.465 0.032 |
| . | 1.372 0.028 |
| . | 1.832 0.030 |
| . | 1.905 0.031 |
| . | 0.715 0.057 |
| . | 2.099 0.038 |
| . | 0.533 0.031 |
An additional quantity of great importance for the interpretation of the masses, radii, and temperatures is the chemical composition. Beyond our estimate in § 2 of [m/H] , a spectroscopic estimate from a composite spectrum of IM Vir was reported by Dall et al. (2007) as [Fe/H] = , based on an effective temperature some 200 K cooler and a higher surface gravity than we derive for the primary, which dominates the light. It is unclear how accurate this determination is, in view of those differences. A photometric estimate for the primary may be derived from the out-of-eclipse Strömgren measurements of IM Vir by Manfroid et al. (1991) and Morale et al. (1996), after removing the light contribution of the secondary using the light ratios obtained in § 4. The metallicity relation by Holmberg et al. (2007) gives a rather poorly determined value of [Fe/H] , in which the uncertainty includes photometric errors as well as the scatter of the calibration. The secondary is too cool for this calibration and other similar ones based on Strömgren indices, but is within range of the near-infrared formula by Bonfils et al. (2005), which yields [Fe/H] . This again includes all photometric errors and the scatter of the calibration. It has been noted by Johnson & Apps (2009) that this latter color/temperature relation appears to underestimate the metallicity of late-type stars of solar composition or greater, by approximately 0.3 dex; for sub-solar compositions it is not clear that a correction is necessary. The above estimates suggest a composition of IM Vir somewhat below solar, perhaps [Fe/H] , but the uncertainties are large and this conclusion requires confirmation.
| Parameter | Primary | Secondary |
|---|---|---|
| (). | 0.981 0.012 | 0.6644 0.0048 |
| (). | 1.061 0.016 | 0.681 0.013 |
| (K). | 5570 100 | 4250 130 |
| (cgs). | 4.379 0.014 | 4.594 0.017 |
| . | 0.012 0.034 | 0.867 0.056 |
| (mag)aaThe error in these bolometric corrections from Flower (1996) account for the temperature uncertainties and include an additional 0.10 mag added in quadrature.. | 0.12 0.10 | 0.82 0.17 |
| (mag)bbThe bolometric magnitude adopted for the Sun is , for consistency with the bolometric corrections.. | 4.88 0.15 | 7.71 0.29 |
| (km s-1). | 43 2 | |
| (km s-1)ccProjected rotational velocity if synchronized with the orbital motion.. | 41.0 0.6 | 26.3 0.5 |
| (). | 5.944 0.020 | |
| Distance (pc). | 89.8 5.8 | |
The absolute dimensions for the system are summarized in Table 11, along with derived properties including the luminosities and absolute visual magnitudes. To calculate we have adopted the bolometric corrections from Flower (1996), with uncertainties that account for the temperature errors as well as a contribution of 0.10 mag added in quadrature, to be conservative. IM Vir does not have an entry in the Hipparcos Catalog (Perryman et al., 1997). Here we estimate the distance to the system to be pc, ignoring extinction for such a close object. This is 50% larger than first estimated by Strassmeier et al. (1993) on the basis of the spectral type. Separate distance estimates for each component agree nearly perfectly, showing the internal consistency of the fundamental data on which they are based. The distance, proper motions from Tycho-2, and systemic velocity from our spectroscopic orbital solution (Table 2) lead to space velocities of km s-1, km s-1, and km s-1 in the solar frame (with positive toward the Galactic center). These do not appear to associate IM Vir with any known moving group in the solar neighborhood.
With our accurate radii we compute projected synchronous rotational velocities of km s-1 and km s-1 for the primary and secondary, respectively. The value for the primary is consistent with our direct measurement of km s-1, suggesting that synchronization with the orbital motion has been achieved (if the spin axis is parallel to the orbital axis). This is expected from the short period. Estimates of 43 km s-1 for the primary and 23 km s-1 for the secondary were reported by Strassmeier et al. (1993), but without errors. At our request, those spectra were kindly remeasured by F. Fekel (priv. comm.), giving km s-1 and km s-1, based on the calibration by Fekel (1997). Once again the primary agrees well with the synchronous value, and the secondary is probably also consistent, considering the difficulty of the measurement. An independent value for the primary was reported by Strassmeier et al. (2000) as 36.2 km s-1 with an uncertainty of 2–4 km s-1, roughly in agreement with ours.
6. Discussion
With its solar-type primary and low-mass secondary, IM Vir is a particularly interesting system for testing models of stellar evolution. The accurate masses, radii, and temperatures for both components offer an opportunity to further investigate the discrepancies for low-mass stars mentioned in the Introduction. The leverage afforded by the very different masses is unique among systems with at least one component under 0.8 .
We begin by comparing the measured properties against models from the widely used Yonsei-Yale series (Yi et al., 2001; Demarque et al., 2004), which treat convection in the standard mixing-length approximation with a mixing length parameter (in units of the pressure scale height), calibrated against the Sun. Evolutionary tracks for solar composition and for the exact masses we measure for each star are shown in the – diagram of Figure 10, as dashed lines. These models are seen to be too hot compared to the estimated temperatures. Adjusting the metallicity to higher values brings the tracks closer to the observations, but it is not possible to match both stars at the same time, especially considering that the temperature difference is much better known than the absolute temperatures. Part of the problem has to do with the fact that these models are not intended for low-mass stars such as IM Vir B, which require a more sophisticated equation of state, and particularly, non-gray boundary conditions between the interior and the photosphere (see, e.g., Chabrier & Baraffe, 1997). If we therefore focus for the moment only on the solar-type primary, we find an excellent match to an evolutionary track for (corresponding to [Fe/H] in these models), at the rather old age of about 8 Gyr. The corresponding mass tracks for both stars are drawn with solid lines in Figure 10, and the shaded area indicates the uncertainty in their location that comes from our 1% mass errors. An isochrone for this age is indicated with the dotted line.
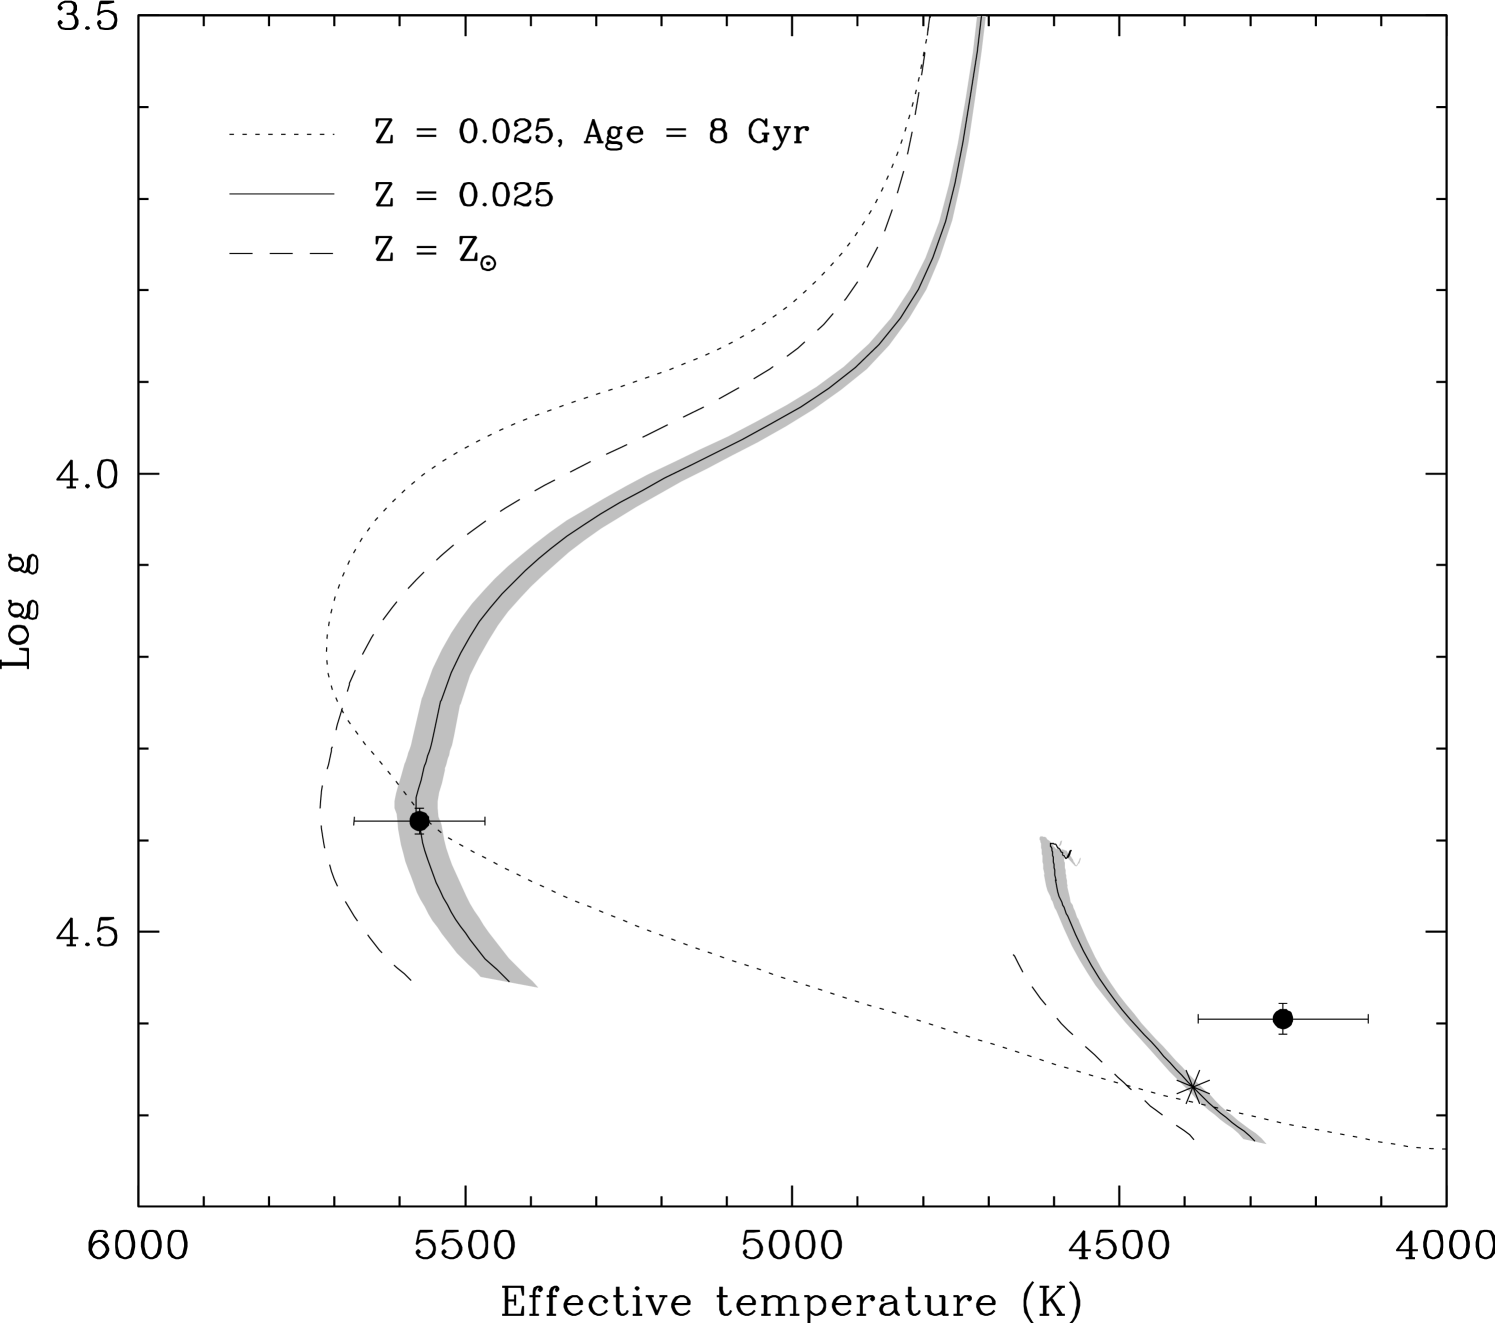
Not surprisingly, the secondary does not fit the evolutionary track at this metallicity, and appears implausibly old. This is a consequence of it being both too large and too cool compared to the models, which is in the same sense as deviations found for many other late-type dwarfs, and is believed to be due to the effects of chromospheric activity. Previous studies have indicated that better agreement for this class of stars is possible with models such as those of Baraffe et al. (1998), which have the required non-gray boundary conditions and use a lower mixing-length parameter of . The latter tends to diminish (but does not completely eliminate) the discrepancies noted with other models in and . The one property of low-mass stars that appears to be reasonably well reproduced by theory is the luminosity (see, e.g., Delfosse et al., 2000; Torres et al., 2002). This provides a means of testing the predictions from the Yonsei-Yale models for the primary, which point to an unexpected combination of super-solar metallicity and old age, and a composition that is somewhat inconsistent with the indications from § 5. In the left panels of Figure 11 we compare the secondary luminosity, radius, and temperature against isochrones from Baraffe et al. (1998) corresponding to the age of 8 Gyr found above, for different compositions including the value [Fe/H] that best fits the primary (according to the Yonsei-Yale models).222For this last isochrone we have extrapolated slightly in metallicity from the publicly available tables by Baraffe et al. (1998) for [Fe/H] = 0.0 and . All three of , , and for the secondary are seen to be too large compared to the model favored by the primary, which is represented by the solid lines. The measured luminosity of the secondary, as well as its effective temperature, suggest a significantly lower abundance, and the measured radius is too large no matter what the metallicity. Changes in age at a fixed metallicity of [Fe/H] = +0.15 do not improve the fit, as seen clearly in the right panels of Figure 11.

There is little doubt that the radius of the secondary is too large compared to models. Furthermore, the age/metallicity inconsistency between the primary and secondary is perhaps an indication that the good match for IM Vir A in Figure 10 is illusory, and that it too may have anomalies similar to those of the secondary, possibly related also to activity. The primary is, after all, a rapid rotator ( km s-1). Standard models such as those of Baraffe et al. (1998) do not account for the effects of chromospheric activity, although the artificially low value of the mixing length parameter () seems to be a step in the right direction (see also Torres et al., 2006; Chabrier et al., 2007; Clausen et al., 2009).
As a way of parameterizing the missing physical effects from activity and their impact on the structure of low-mass stars, Torres (2007) explored the use of a correction factor to the theoretical radii, and showed that good fits to empirical data could be achieved by simultaneously correcting the theoretical temperatures by , so as to preserve the bolometric luminosity. We apply the same procedure here. To account for a possible difference in the activity level, we have considered separate values of for each star, and examined a wide range of metallicities and ages using the Baraffe et al. (1998) models to obtain the best simultaneous match to the properties of both components, at a single age and composition. In Figure 12 we display the results of our grid search. A near-perfect fit is achieved for [Fe/H] , as measured by the represented in the top panel. Interestingly, this value is much more consistent with the rough estimates from photometry and spectroscopy described in § 5 than with the metal-rich composition suggested by the Yonsei-Yale models for the primary. The radius correction factors are and , and the best-fit age is 2.4 Gyr (see middle and bottom panels). The age and metallicity depend almost entirely on the measured stellar luminosities. The values of , , and are shown in Figure 13 with the adjusted isochrones from Baraffe et al. (1998). Standard models without the corrections to the radii and temperatures are shown as dashed lines in the lower panels, for reference.


The implication of the above fit is that the radius of the primary star is 3.7% larger than predicted by theory, and its temperature is just under 2% (100 K) too cool. For the secondary the models underpredict the radii by 7.5%, and overpredict the temperature by about 3.5%, or 150 K. It appears, therefore, that both stars are affected by chromospheric activity. While this is not unexpected for the secondary, the fact that the primary also seems to show the same anomalies supports other recent evidence that the phenomenon is not confined to low-mass stars, but reaches stars of solar mass (0.981 for IM Vir A). Other examples of solar-type stars where this has been documented include VZ Cep B (1.108 ; Torres & Lacy, 2009), CV Boo B (0.968 ; Torres et al., 2008), FL Lyr B (0.958 ; Popper et al., 1986), and V1061 Cyg B (0.932 ; Torres et al., 2006).
There is ample evidence of activity in IM Vir, which was in fact discovered through its X-ray emission, as described in § 1. Activity is manifested in our light curves in the form of spottedness, and in retrospect, our finding that the best fit to the photometry is achieved with one spot on each star as opposed to spots on any single component is consistent with the results of the stellar evolution modeling in the preceding paragraph, which indicates that both stars are affected. This is not surprising, given that both have convective envelopes and are rapid rotators. Additional manifestations of activity in this case include a filled-in H line (Strassmeier et al., 1993; Liu et al., 1996) or the possible detection of H emission from the secondary (Popper, 1997), Ca II H and K emission (Dall et al., 2007), and flaring in X rays (Pandey & Singh, 2008). With the X-ray count rates and hardness ratio from ROSAT, the energy conversion factor prescribed by Schmitt et al. (1995), and our bolometric luminosities and derived distance, we have estimated the ratio of the X-ray to bolometric luminosity for the two components. We obtain and , respectively, where we have assumed equal X-ray emission from each star since the ROSAT observation does not resolve the binary. These values are consistent with the secondary being completely saturated, and the primary being near saturation. They are similar to the X-ray luminosities seen in other active binary systems, and are in fact in good agreement with the trend between the radius anomalies and found by López-Morales (2007) (see, e.g., her Figure 2).
The differences in radius and temperature between the models and the observations for IM Vir are of similar magnitude as those found for other active stars with convective envelopes, but do rely quite strongly on our adopted effective temperatures for the stars because of the way the correction factors have been determined. Given the greater difficulty of determining absolute temperatures than other properties such as masses and radii, one may wonder to what extent systematic errors in might affect the result, and also the derived age and metallicity. We focus here on systematic errors in the primary temperature, since the secondary value is tied to the primary through the light-curve solution. We explored this question by perturbing the temperatures by 100 K, with corresponding adjustments to the luminosities, and repeating the grid search for . The results are illustrated in the top panel of Figure 12, where the dashed lines show that the best-fit metallicity changes by 0.10 dex (marked by the short dotted lines). The changes in the factors are 0.010 for and 0.003 for , and the change in the best-fit age is 0.50 Gyr, or 20%.
7. Concluding remarks
Our extensive spectroscopic and photometric observations of IM Vir have enabled us to determine highly accurate values for the absolute masses and radii of both stars to better than 2%, as well as accurate temperatures (Table 11). This eclipsing system now joins the ranks of those with the best determined properties (see Torres et al., 2009). The primary is of solar type, and the secondary is a late K dwarf. The very different masses provide increased discriminating power for testing models of stellar evolution. We find evidence that both components, which have convective envelopes and are rapidly rotating, show discrepancies in their radii and temperatures compared to calculations by Baraffe et al. (1998), similar to those reported for other low-mass stars. The predicted radii are too small by 3.7% and 7.5% for the primary and secondary, and the theoretical temperatures are too high by 100 K and 150 K, respectively. These effects are ascribed to chromospheric activity, for which there is abundant evidence in this system in the form of X-ray, Ca II H and K, and H emission, X-ray flaring, and spottedness seen directly in the light curves. The larger effect observed for the secondary is consistent with the larger fraction of that star being covered by spots (a factor of two difference). The fact that the near-solar mass primary is also affected supports recent findings for other binaries indicating that the impact of activity on the structure of stars is not limited to the M dwarfs, as previously thought, but most likely extends to all stars with convective envelopes, reaching up to masses near or larger than that of the Sun. Current stellar evolution models do not account for these effects. Some progress in this area has been made to incorporate magnetic activity in the theoretical calculations (e.g., D’Antona et al., 2000; Mullan & MacDonald, 2001; Chabrier et al., 2007), and initial results are very encouraging.
A crucial ingredient for the comparison with models is the chemical composition. The best-fit models for IM Vir indicate an age of Gyr and a metallicity of [Fe/H] . The uncertainties here represent the sensitivity to systematic errors of 100 K in the effective temperatures, but exclude unquantified systematics in the Baraffe et al. (1998) models themselves, which are difficult to evaluate. While the metallicity prediction seems to be in good agreement with our rough spectroscopic abundance estimate in § 2 and that of Dall et al. (2007), as well as photometric estimates for both stars, a proper detailed spectroscopic analysis of both components is still lacking, and is essential to validate the comparison. Such determinations are notoriously difficult in double-lined binaries, which is why relatively few have them. In IM Vir this task would be challenging for two reasons: the secondary is very faint compared to the primary, and it is of late spectral type. Abundance determinations for late-type stars are still problematic due to shortcomings in the model atmospheres. However, IM Vir offers a unique opportunity because the secondary eclipse is total. High S/N ratio spectra taken with a sufficiently large telescope during the 28-minute totality phase would be of the primary only, and can be analyzed with standard techniques. The uncertainty in this observing window is estimated to be approximately 5 minutes, based on the uncertainties in the geometric light-curve parameters.
References
- Andersen (1991) Andersen, J. 1991, A&A Rev., 3, 91
- Baraffe et al. (1998) Baraffe, I., Chabrier, G., Allard, F., & Hauschildt, P. H. 1998, A&A, 337, 403
- Bonfils et al. (2005) Bonfils, X., Delfosse, X., Udry, S., Santos, N. C., Forveille, T., & Ségransan, D. 2005, A&A, 442, 635
- Casagrande et al. (2006) Casagrande, L., Portinari, L., & Flynn, C. 2006, MNRAS, 373, 13
- Casagrande et al. (2008) Casagrande, L., Flynn, C., & Bessell, M. 2008, MNRAS, 389, 585
- Chabrier et al. (2007) Chabrier, G., Gallardo, J., & Baraffe, I. 2007, A&A, 472, L17
- Chabrier & Baraffe (1997) Chabrier, G., & Baraffe, I. 1997, A&A, 327, 1039
- Claret (2000a) Claret, A. 2000a, A&A, 363, 1081
- Claret (2000b) Claret, A. 2000b, A&A, 359, 289
- Clausen et al. (2008) Clausen, J. V., Torres, G., Bruntt, H., Andersen, J., Nordström, B., Stefanik R. P., Latham, D. W., & Southworth, J. 2008, A&A, 487, 1095
- Clausen et al. (2009) Clausen J. V., Bruntt H., Claret A., Larsen A., Andersen J., Nordström B., Giménez A. 2009, A&A, 502, 253
- Cutri et al. (2003) Cutri, R. M. et al. 2003, 2MASS All-Sky Catalog of Point Sources, Univ. of Massachusetts and Infrared Processing and Analysis Center (IPAC/California Institute of Technology)
- Dall et al. (2007) Dall, T. H. et al. 2007, A&A, 470, 1201
- D’Antona et al. (2000) D’Antona F., Ventura P., & Mazzitelli I. 2000, ApJ, 543, L77
- Delfosse et al. (2000) Delfosse, X., Forveille, T., Ségransan, D., Beuzit, J.-L., Udry,S., Perrier, C., & Mayor, M. 2000, A&A, 364, 217
- Demarque et al. (2004) Demarque, P., Woo, J.-H., Kim, Y.-C., & Yi, S. K. 2004, ApJS, 155, 667
- Eker (1996) Eker, Z. 1996, ApJ, 473, 388
- Eker (1999) Eker, Z. 1999, ApJ, 512, 386
- Fekel (1997) Fekel, F. C. 1997, PASP, 109, 514
- Flower (1996) Flower, P. J. 1996, ApJ, 469, 355
- Girardi et al. (2000) Girardi, L., Bressan, A., Bertelli, G., & Chiosi, C. 2000, A&AS, 141, 371
- González Hernández & Bonifacio (2009) González Hernández, J. I., & Bonifacio, P. 2009, A&A, 497, 497
- Griffin et al. (2000) Griffin, R. E. M., David, M., & Verschueren, W. 2000, A&AS, 147, 299
- Helfand & Caillault (1982) Helfand, D. J., & Caillault, J.-P. 1982, ApJ, 253, 760
- Høg et al. (2000) Høg, E., Fabricius, C., Makarov, V. V., Urban, S., Corbin, T., Wycoff, G., Bastian, U., Schwekendiek, P., & Wicenec, A. 2000, A&A, 355, L27
- Holmberg et al. (2007) Holmberg, J., Nordström, B., & Andersen, J. 2007, A&A, 475, 519
- Johnson & Apps (2009) Johnson, J. A., & Apps, K. 2009, ApJ, 699, 933
- Lacy et al. (2008) Lacy, C. H. S., Torres, G., & Claret, A. 2008, AJ, 135, 1757
- Latham (1985) Latham, D. W. 1985, in IAU Coll. 88, Stellar Radial Velocities, eds. A. G. D. Philip & D. W. Latham (Schenectady: L. Davis), 21
- Latham (1992) Latham, D. W. 1992, in IAU Coll. 135, Complementary Approaches to Double and Multiple Star Research, ASP Conf. Ser. 32, eds. H. A. McAlister & W. I. Hartkopf (San Francisco: ASP), 110
- Latham et al. (1996) Latham, D. W., Nordström, B., Andersen, J., Torres, G., Stefanik, R. P., Thaller, M., & Bester, M. 1996, A&A, 314, 864
- Latham et al. (2002) Latham, D. W., Stefanik, R. P., Torres, G., Davis, R. J., Mazeh, T., Carney, B. W., Laird, J. B., & Morse, J. A. 2002, AJ, 124, 1144
- Liu et al. (1996) Liu, X., Huang, H., & Zhu, W. 1996, Ap&SS, 246, 39
- López-Morales (2007) López-Morales, M. 2007, ApJ, 660, 732
- López-Morales & Ribas (2005) López-Morales, M., & Ribas, I. 2005, ApJ, 631, 1120
- Manfroid et al. (1991) Manfroid, J. et al. 1991, A&AS, 87, 481
- Marschall et al. (1988) Marschall, L. A., Nations, H., & Witman, K. 1988, BAAS, 20, 994
- Marschall et al. (1989) Marschall, L. A., Stefanik, R., Nations, H., & Karshner, G. 1989, BAAS, 21, 1083
- Morale et al. (1996) Morale, F., Micela, G., Favata, F., & Sciortino, S. 1996, A&AS, 119, 403
- Morales et al. (2009) Morales, J. C., et al. 2009, ApJ, 691, 1400
- Mullan & MacDonald (2001) Mullan D. J., & MacDonald, J. 2001, ApJ, 559, 353
- Ogloza et al. (2008) Ogloza, W., Niewiadomski, W., Barnacka, A., Biskup, M., Malek, K., & Sokolowski, M. 2008, IBVS, 5843, 1
- Pandey & Singh (2008) Pandey, J. C., & Singh, K. P. 2008, MNRAS, 387, 1627
- Perryman et al. (1997) Perryman, M. A. C., et al. 1997, The Hipparcos and Tycho Catalogues (ESA SP-1200; Noordwjik: ESA)
- Popper (1997) Popper, D. M. 1996, ApJS, 106, 133
- Popper (1997) Popper, D. M. 1997, AJ, 114, 1195
- Popper (2000) Popper, D. M. 2000, AJ, 119, 2391
- Popper et al. (1986) Popper, D. M., Lacy, C. H., Frueh, M. L., & Turner, A. E. 1986, AJ, 91, 383
- Ramírez & Meléndez (2005) Ramírez, I., & Meléndez, J. 2005, ApJ, 626, 446
- Ribas (2003) Ribas, I. 2003, A&A, 398, 239
- Ribas et al. (2008) Ribas, I., Morales, J. C., Jordi, C., Baraffe, I., Chabrier, G., & Gallardo, J. 2008, Mem. Soc. Astron. Italiana, 79, 562
- Schmitt et al. (1995) Schmitt, J. H. M. M., Fleming, T. A., & Giampapa, M. S. 1995, ApJ, 450, 392
- Siess et al. (2000) Siess, L., Dufour, E., & Forestini, M. 2000, A&A, 358, 593
- Silva et al. (1987) Silva, D. R., Gioia, I. M., Maccacaro, T., Mereghetti, S., & Stocke, J. T. 1987, AJ, 93, 869
- Strassmeier et al. (1993) Strassmeier, K. G., Hall, D. S., Fekel, F. C., & Scheck, M. 1993, A&AS, 100, 173
- Strassmeier et al. (2000) Strassmeier, K. G., Washuettl, A., Granzer, Th., Scheck, M., & Weber, M. 2000, A&AS, 142, 275
- Torres (2007) Torres, G. 2007, ApJ, 671, L65
- Torres et al. (2009) Torres, G., Andersen, J., & Giménez, A. 2009, A&A Rev., in press (arXiv:0908.2624v1)
- Torres et al. (2000) Torres, G., Andersen, J., Nordström, B., & Latham, D. W. 2000, AJ, 119, 1942
- Torres & Lacy (2009) Torres, G., & Lacy, C. H. S. 2009, AJ, 137, 507
- Torres et al. (2006) Torres G., Lacy C. H. S., Marschall L. A., Sheets H. A., Mader J. A. 2006, ApJ, 640, 1018
- Torres et al. (2002) Torres, G., Neuhäuser, R., & Guenther, E. W. 2002, AJ, 123, 1701
- Torres & Ribas (2002) Torres, G., & Ribas, I. 2002, ApJ, 567, 1140
- Torres et al. (1997) Torres, G., Stefanik, R. P., Andersen, J., Nordström, B., Latham, D. W., & Clausen. J. V. 1997, AJ, 114, 2764
- Torres et al. (2008) Torres, G., Vaz, L. P. R., & Lacy, C. H. S. 2008, AJ, 136, 2158
- van Hamme & Wilson (2003) van Hamme, W., & Wilson, R. E. 2003, in GAIA Spectroscopy: Science and Technology, ASP Conf. Ser. 298, ed. U. Munari (San Francisco: ASP), p. 323
- Wilson (1979) Wilson, R. E. 1979, ApJ, 234, 1054
- Wilson & Devinney (1971) Wilson, R. E., & Devinney, E. J. 1971, ApJ, 166, 605
- Yi et al. (2001) Yi, S. K., Demarque, P., Kim, Y.-C., Lee, Y.-W., Ree, C. H., Lejeune, T., & Barnes, S. 2001, ApJS, 136, 417
- Zucker & Mazeh (1994) Zucker, S., & Mazeh, T. 1994, ApJ, 420, 806