Accretion disk signatures in Type I X-ray Bursts: prospects for future missions
Abstract
Type I X-ray bursts and superbursts from accreting neutron stars illuminate the accretion disk and produce a reflection signal that evolves as the burst fades. Examining the evolution of reflection features in the spectra will give insight into the burst-disk interaction, a potentially powerful probe of accretion disk physics. At present, reflection has been observed during only two bursts of exceptional duration. We investigate the detectability of reflection signatures with four of the latest well-studied X-ray observatory concepts: Hitomi, NICER, Athena, and LOFT. Burst spectra are modeled for different values for the flux, temperature, and the disk ionization parameter, which are representative for most known bursts and sources. The effective area and through-put of a Hitomi-like telescope are insufficient for characterizing burst reflection features. NICER and Athena will detect reflection signatures in Type I bursts with peak fluxes erg cm-2 s-1, and also effectively constrain the reflection parameters for bright bursts with fluxes of erg cm-2 s-1 in exposures of several seconds. Thus, these observatories will provide crucial new insight into the interaction of accretion flows and X-ray bursts. For sources with low line-of-sight absorption, the wide band-pass of these instruments allows for the detection of soft X-ray reflection features, which are sensitive to the disk metallicity and density. The large collecting area that is part of the LOFT design would revolutionize the field by tracing the evolution of the accretion geometry in detail throughout short bursts.
Subject headings:
accretion, accretion disks — stars: neutron — X-rays: binaries — X-rays: bursts1. Introduction
In low-mass X-ray binaries (LMXBs) that host a neutron star, the donor star may fill its Roche lobe, and transfer material via an accretion disk to the neutron star. Hydrogen and helium accumulated on the neutron star surface can undergo runaway thermonuclear burning, powering a brief () Type I X-ray burst (Grindlay et al., 1976; Belian et al., 1976; Woosley & Taam, 1976; Maraschi & Cavaliere, 1977; Lamb & Lamb, 1978). Recurring on typical timescales of hours to days, these bursts are the most frequent thermonuclear flashes in nature (e.g., Lewin et al., 1993; Strohmayer & Bildsten, 2006; Galloway et al., 2008). A bright X-ray burst briefly outshines all other X-ray emitting regions in the system.
The X-ray spectrum from the neutron star during the burst is close to a blackbody (Swank et al. 1977; van Paradijs & Lewin 1986; see also, e.g., Suleimanov et al. 2011b), and this spectrum may be reprocessed (or, reflected) by and scattered off the surrounding disk and the companion star. UV and optical reprocessing is thought to originate predominantly from the outer regions of the disk and the companion star (Hynes et al., 2006; Paul et al., 2012), whereas X-ray reflection occurs mostly off the inner disk (Ballantyne & Strohmayer 2004; Keek et al. 2014b; see also Day & Done 1991) which is struck by a particularly strong ionizing radiation field. As a result, an Fe K emission line may be visible in the spectrum near as well as an Fe absorption edge at slightly higher energies, the properties of which depend on the ionization state of the inner disk. Further spectral features produced by X-ray reflection include a multitude of lines and a bremsstrahlung continuum below (Ballantyne, 2004). When originating from the inner disk, the shape of these spectral features is modified by rotational Doppler broadening and gravitational redshifting (e.g., Fabian et al., 1989). The strength of these effects depends on the distance from the neutron star, and, therefore, the location of the reflection site can be measured. In addition, the magnitude of the reflection signal encodes information about the disk geometry (Ballantyne & Strohmayer, 2004; He & Keek, 2016). Therefore, the reflection features in a burst spectrum can potentially reveal a treasure of information on the properties of the accretion environment, similar to how reflection spectroscopy has been invaluable for the study of accretion onto black holes in Active Galactic Nuclei (AGN) and compact binaries (e.g., Fabian & Ross, 2010; Miller, 2007).
The short duration of X-ray bursts and the fast evolution of their spectral properties mean that spectra can only be collected in short time intervals. Around the peak of the burst this is at most a few seconds. The quality of the spectra is, therefore, rather limited. In normal bursts, reflection features have never been clearly detected, and burst reflection is not distinguished from the directly observed thermal emission from the neutron star (e.g., Lapidus & Sunyaev, 1985; Fujimoto, 1988). The highest quality burst spectra were obtained with the Proportional Counter Array (PCA; Jahoda et al., 2006) on the Rossi X-Ray Timing Explorer (RXTE; Bradt et al., 1993) for two so-called “superbursts” with durations of several hours (Strohmayer & Brown, 2002; Strohmayer & Markwardt, 2002). The long duration allowed for more detailed spectral analysis that revealed reflection features (Ballantyne & Strohmayer, 2004; Keek et al., 2014b, 2015), and in one case an evolving persistent component (Keek et al., 2014a). The reflection features showed that the inner disk is highly ionized by the burst, and may temporarily be disrupted. These two observations show that X-ray reflection during bursts is a powerful tool for investigating the behavior of accretion disks under sudden strong irradiation.
Ballantyne & Everett (2005) considered inflow, outflow, and thermodynamic processes during the interaction of an X-ray burst with the surrounding accretion disk, and found that nearly all processes may be relevant. The variety of possible physical effects means that further theoretical studies as well as improved observational constraints are needed to better understand the impact of an X-ray burst on its surroundings.
Aside from a reflection component, the X-ray spectrum additionally includes components for thermal emission from the accretion disk, Comptonized emission from the accretion disk corona, as well as thermal emission from a boundary or spreading layer where freshly accreted material reaches the neutron star surface (Inogamov & Sunyaev, 1999; Revnivtsev et al., 2013). These components are also present before the burst as “persistent” emission. Typically, their spectral properties are measured at that time, and one assumes them to remain unchanged during the burst. All of the burst spectrum in excess of the combined persistent parts is assumed to be blackbody emission from the neutron star (see also Kuulkers et al., 2002). However, there is now evidence that the persistent emission is being altered by the burst, as its normalization may increase (Worpel et al., 2013; in ’t Zand et al., 2013; Keek et al., 2014a; Worpel et al., 2015; Degenaar et al., 2016), possibly due to Poynting-Robertson drag (Walker, 1992), and its spectrum appears to soften (Maccarone & Coppi, 2003; Chen et al., 2012, 2013; Ji et al., 2014; Keek et al., 2014a). Therefore, when studying burst reflection, care must be taken to distinguish reflection from an evolving persistent spectral component.
In this paper we investigate the capabilities of different instrumentation for detecting burst reflection. We simulate a wide range of burst observations with four X-ray observatories: NICER, Hitomi, Athena, and LOFT (Section 2). Due to their large collecting areas, NICER, Athena, and LOFT will be able to detect reflection features in bright bursts, even if their duration is short (Section 3). We discuss how burst reflection can be applied to study the accretion environment of neutron stars in LMXBs, and how it impacts neutron star science such as constraints on the dense matter equation of state (Section 4). We conclude that X-ray burst reflection will become an important method to study the properties and behavior of accretion disks in LMXBs. (Section 5).
2. Method
2.1. Instrumentation
The detection of X-ray burst reflection is highly dependent on the properties of the instrumentation, such as the energy band, the effective area, and the spectral resolution. We study the detectability of reflection using the expected response of four X-ray observatories that are either recently launched, being constructed, or planned for a launch opportunity further in the future.
The Neutron Star Interior Composition Explorer (NICER, Gendreau et al., 2012) is planned for launch in 2016, and will be placed on the International Space Station. Its X-ray Timing Instrument (XTI) consists of 56 units, each with an X-ray concentrator optic and a silicon strip detector. It is not an imaging instrument, but it collects all photons from the field of view. Its detectors are sensitive in the energy band, and its effective area is approximately at . By using of a large number of detectors, NICER can handle high photon count rates.
Athena (Barcons et al., 2015) is a proposed large mission for the European Space Agency to be launched in the late 2020s. It will combine a collecting area larger than NICER with imaging capabilities and high spectral resolution. We consider the imaging CCD detector: the Wide Field Imager (WFI, Meidinger et al., 2014). It is sensitive in the band, and has a effective area around .
Beyond Athena, we may speculate about a future observatory with an even larger detector area. The Large Observatory For X-ray Timing (LOFT, Feroci et al., 2014) was a mission concept proposed to ESA. Although it was not selected, parts of its design may be incorporated in other missions. With an effective area of combined with high throughput, it promised unprecedented opportunities for studying short transient events such as Type I X-ray bursts (in ’t Zand et al., 2015). We use the M4 configuration of its Large Area Detector (LAD). Contrary to the other three instruments that we consider, the LAD is not sensitive below : its energy band is .
Hitomi (named ASTRO-H pre-launch, Takahashi et al., 2012) was launched in February 2016 and operated until the end of March. As it had significantly different capabilities than the other instruments considered here, it is valuable to include it in the present study. Hitomi hosted several instruments, and we consider the Soft X-ray Imager (SXI, Hayashida et al., 2014). SXI was a CCD imaging detector sensitive in the energy band, and at the effective area was . Compared to NICER’s detectors, the imaging capability allows for a lower background, but it reduces the maximum photon count rate that the instrument can process. In Section 3.6 we will discuss the impact of this on the ability to detect reflection.
| Mission | Instrument | Bandpass | keV Area | Background File | RMF | ARF | Reference |
|---|---|---|---|---|---|---|---|
| (keV) | (cm2) | ||||||
| NICER | XTI | – | 600 | 15174.bkg | nicer_xti.rmf | — | Gendreau et al. (2012) |
| Hitomi | SXI | – | 360 | astroh_bkgnd.pi | astroh.rmf | astroh_pointsource.arf | Takahashi et al. (2012) |
| Athena | WFI | – | 2500 | athena_wfi_1190_bkgd | athena_wfi_1190 | — | Barcons et al. (2015) |
| _sum_psf_onaxis_w | _onaxis_w_filter | ||||||
| _filter_20150327.pha | _v20150326.rsp | ||||||
| LOFT | LAD | – | 81700 | LAD_M4_v2.0.bkg | LAD_M4_v2.0.rmf | LAD_M4_v2.0.arf | Feroci et al. (2014) |
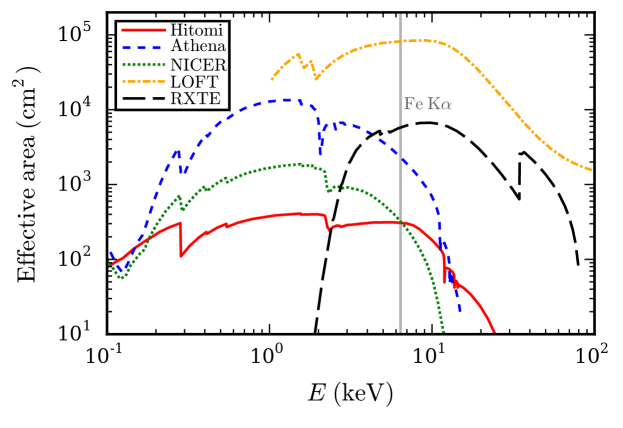
We simulate burst reflection spectra for all missions using the response matrix files (RMFs), ancillary response files (ARFs), and background files that have been made available by the instrument teams. Table 1 lists which exact files are employed, and Figure 1 compares the effective areas. The figure also includes the area of RXTE/PCA (assuming all 5 Proportional Counter Units [PCUs] are operating), the only instrument to have successfully detected burst reflection. A more detailed comparison to RXTE is made in Sect. 3.3.
2.2. Spectral Model
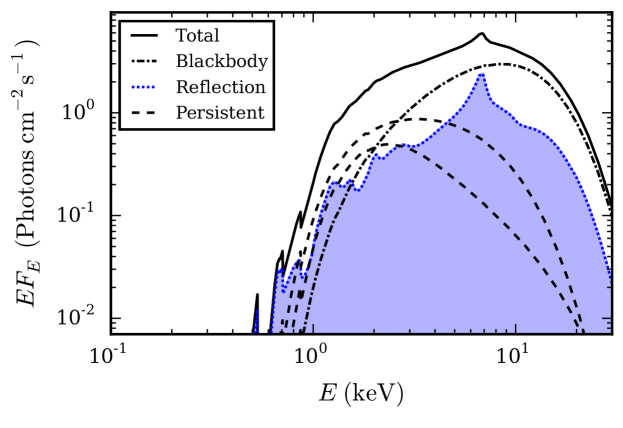
Three distinct emission components can contribute to the X-ray spectrum during a burst: the persistent emission from the underlying accretion disk, the thermal blackbody emission from the NS surface, and the reflection of that blackbody from the disk surface. Additionally, a thin boundary or spreading layer may be present, which during a burst may cover a substantial part of the neutron star (Inogamov & Sunyaev, 1999; Revnivtsev et al., 2013). We do not explicitly include a spreading layer, but our setup is equivalent to complete coverage by this layer. We aim for our spectral model to be representative of a wide range of bursts, covering the majority of the known bursting sources. We employ XSPEC version 12.8.2 (Arnaud, 1996) to create a spectral model that includes all three components, along with interstellar absorption (Figure 2). Using XSPEC terminology, the model reads as phabs*(constant*(diskbb + compTT) + rdblur*cflux*atable(bbrefl_1xsolar_0-5r.fits)) with the parameter values shown in Table 2. Below we describe the components in detail.
We employ a blackbody component with temperature as well as reflection of this blackbody off a photoionized accretion disk (Ballantyne, 2004). The reflection spectrum is sensitive to the ionization state of the illuminated layer and, as this is a constant density model, can be parameterized using the ionization parameter , where is the irradiating flux at the surface of the reflecting slab and is its density. Both and evolve during a burst (Ballantyne & Strohmayer, 2004; Keek et al., 2014b); therefore, we consider a range of values for these parameters in order to determine how they may affect the detectability of the reflection signal. The reflection fraction, , is defined as the flux ratio of the reflection and the blackbody parts. We use , which is approximately the value predicted for a flat accretion disk viewed under a small inclination (; e.g., He & Keek, 2016), and which is a typical value found in the superburst analyses (Ballantyne & Strohmayer, 2004; Keek et al., 2014b). The composition of the accretion disk is assumed to be solar, consistent with most bursters. A subset of bursters are so-called Ultra-Compact X-ray Binaries (UCXBs), where the accretion composition is thought to be hydrogen-deficient (e.g., in ’t Zand et al., 2007). However, because the metal content for UCXBs is likely similar to solar, and metals produce the prominent reflection features such as the Fe K line, our conclusions on the detectability of reflection will also be applicable to these sources. A cflux component operating on the combined blackbody and reflection model sets the unabsorbed bolometric flux of the burst, and allows for a range of burst fluxes to be simulated.
The reflection signal may arise from the inner regions of the accretion disk and will be sculpted by relativistic effects (e.g., Fabian et al., 1989; Ballantyne & Strohmayer, 2004). Thus, the reflection model is convolved with the rdblur relativistic blurring kernel that accounts for the effects of the emission being released in a Schwarzschild metric. As we are simply interested in the detectability of the reflection component, the rdblur parameters are kept fixed throughout the experiment at values indicative of reflection from the inner disk, as seen from 4U 1820-30 (Ballantyne & Strohmayer, 2004), assuming a typical inclination angle of the disk with respect to the line of sight of . Although the location of the reflection signal may evolve throughout a burst, these changes will likely be undetectable for most of the considered instruments unless they arise from a superburst.
The persistent emission of LMXBs depends on their spectral state (e.g., Hasinger & van der Klis, 1989). It is thought that in the soft state, the inner disk extends closest to the neutron star, which maximizes the reflection signal. Furthermore, the soft state is associated with higher persistent flux and a higher burst frequency. Therefore, we use a soft persistent spectrum in our model, but note that reflection will be even better detectable in the hard state when the persistent flux is lower (for equal reflection fraction). As a typical example of a soft spectrum, we employ the spectral shape measured in broad-band BeppoSAX observations of the transient source 4U 1608-522 during outburst (Keek et al., 2008). This includes thermal emission from the disk (diskbb) plus a Comptonized component (compTT). When in outburst, 4U 1608-522 exhibits frequent bright bursts with peak fluxes of erg cm-2 s-1, making it a prime candidate for detecting burst reflection. Our results will not be strongly dependent on the details of the persistent spectrum, because we test how well reflection can be distinguished from the persistent components by fitting for a multiplicative factor for the latter.
The multiplicative factor, denoted , in front of the persistent emission (constant in XSPEC) may also represent the possibility of a change in the persistent emission during the burst. Such behavior has been inferred for a variety of Type I bursts (Worpel et al., 2013, 2015) and measured in the 2001 superburst from 4U 1636-536 (Keek et al., 2014a). The exact interpretation of this increase in persistent emission is not understood, and it may be related to an increase of accretion onto to the neutron star or to changes in the disk corona due to the influence of the burst. This parameter is set to unity for a burst flux of erg cm-2 s-1 (typical peak flux of a bright burst), and is scaled appropriately as the flux is changed so that it remains the same fraction of the total flux.
Photoelectric interstellar absorption is taken into account using the phabs model with cross-sections from Balucinska-Church & McCammon (1992) and abundances from Anders & Grevesse (1989). Most X-ray bursting sources are near the Galactic Center, where absorption is relatively strong (). For consistency, we use the absorption column of measured for 4U 1608-522 during the same observation from which our persistent spectrum originates. Additionally, in Section 3.5 we investigate the case of a smaller absorption column.
| Model Component | Parameter | Units | Valuea |
|---|---|---|---|
| phabs | nH | cm-2 | 0.891 |
| constant | |||
| diskbb | keV | 2.38 | |
| norm | 18.3 | ||
| compTT | keV | 0.478 | |
| keV | 3.6 | ||
| 3.7 | |||
| approx. | 1 | ||
| Norm. | 0.4 | ||
| rdblur | Emissivity | -2 | |
| 20 | |||
| 1000 | |||
| Incl. Angle | degrees | 30 | |
| cflux | keV | 0.001 | |
| keV | 100.0 | ||
| erg cm-2 s-1 | – | ||
| Blackbody + | (erg cm s | – | |
| Reflection | keV | – | |
| 0.5 |
a Listed are either the fixed value of the parameter or the range over which it is varied.
b Value at , but scaled appropriately for other values of so that the relative strength of persistent emission is unchanged.
2.3. Spectral Simulations
Using the spectral model (Table 2) and the responses of the instruments considered here (Table 1) we create a set of simulated spectra. The instrumental background is included as well as statistical fluctuations following a Poisson distribution. Neighboring spectral bins with fewer than 20 counts are grouped to ensure statistics are applicable. In order to cover the wide variety of known bursts and sources, we investigate a broad range of values for the burst flux , the burst temperature , and the ionization parameter of the reflector . Therefore, for each instrument, the spectral model is simulated over a three-dimensional space defined by these three parameters.
The range of values for temperature, , is resolved in steps of 0.5, and covers the peak of the hottest bursts as well as the tails of weaker bursts (e.g., Galloway et al., 2008). The strength of the reflection features are a strong function of and (Ballantyne, 2004). Therefore, we study a range of values for the ionization parameter, , again resolved in steps of 0.5, which includes the values observed during superbursts (Ballantyne & Strohmayer, 2004; Keek et al., 2014b).
The statistical quality of the spectra depends on the observed number of counts, which is proportional to the product of the flux and the exposure time. For simplicity, the exposure time of each simulation is maintained at one second. This is approximately the time resolution required for time-resolved spectral analysis of the shortest bursts. For longer bursts, especially during the tail when the spectral parameters evolve more slowly, longer exposures can in principle be taken. Results for longer exposure times can be found by appropriately scaling the burst flux, such that the same number of counts is obtained. For the bolometric burst flux we use the values , with steps of . This range includes for the typical brightest known bursts (e.g., Galloway et al., 2008) as well as an order of magnitude lower fluxes. Furthermore, for the two mentioned superburst observations spectra were collected over s intervals (Ballantyne & Strohmayer, 2004; Kuulkers et al., 2004). This is equivalent to looking for 1 second at a burst that is times brighter, and for the brightest bursts this extends the flux range to . Spectra should not be accumulated over a longer duration because the spectrum changes as the temperature of the neutron star changes significantly, but to be inclusive, we take one extra step of 0.5, and include a flux of .
These choices of parameter values span the full relevant range of photospheric temperatures observed from all known bursting sources, as well as the full range of expected ionization states of the accretion disk. Moreover, not only represents the intrinsic burst flux, but can be scaled to match different exposure times and source distances.
3. Results
3.1. Detectability of Reflection
To quantify the detectability of burst reflection, we investigate whether the reflection parameters can be retrieved from the simulated data, or whether a blackbody alone adequately describes the data. Each simulated spectrum is fitted twice for each instrument: once with the same reflection model used to generate the simulation (with , , , and as fit parameters) and once with a standard blackbody model. The latter model replaces the reflection component with a simple blackbody, and now , , and the blackbody normalization are the fit parameters. All other parameters are kept fixed. The reduced , , of each fit is recorded along with the best-fit values of the parameters, including their uncertainties.
A quick overview of the results is shown in Table 3, where the values (averaged over all and values) are listed for each and for each instrument (a comparison to RXTE follows in Section 3.3). Unsurprisingly, the reflection model is able to provide a good description of the simulated spectra with little scatter in the values. However, the blackbody model — which is commonly used in burst analyses — may produce very poor fits to the simulated observations from NICER, Athena, and LOFT. The values also appear to become progressively worse as increases, as the peak of the blackbody spectrum moves to the edge of the bandpass. A Hitomi-like mission, on the other hand, will have difficulty to distinguish the reflection features in the burst spectra because of its smaller effective area.
| Hitomi | NICER | Athena | LOFT | |
| Reflection Model a | ||||
| 1.5 | 0.96 0.10 | 0.96 0.08 | 0.97 0.06 | 0.99 0.08 |
| 2.0 | 0.96 0.14 | 0.98 0.08 | 0.99 0.06 | 0.98 0.06 |
| 2.5 | 0.96 0.13 | 0.96 0.10 | 0.99 0.06 | 1.01 0.07 |
| 3.0 | 1.03 0.23 | 0.95 0.11 | 0.97 0.06 | 0.99 0.08 |
| Blackbody Model | ||||
| 1.5 | 1.03 0.18 | 1.76 1.76 | 5.39 9.48 | 59.21 133.24 |
| 2.0 | 1.03 0.22 | 1.85 1.88 | 5.54 9.78 | 80.35 191.43 |
| 2.5 | 1.04 0.23 | 2.00 2.25 | 5.82 10.48 | 80.28 193.25 |
| 3.0 | 1.09 0.25 | 2.18 2.70 | 6.39 11.84 | 71.06 173.71 |
a The average and its standard deviation at each for Hitomi, NICER, Athena, and LOFT. The average is taken across all and values. Results are presented both for fits with the same reflection model that was used to simulate the spectra (top) and for fits with a model that does not include a reflection spectrum (bottom).
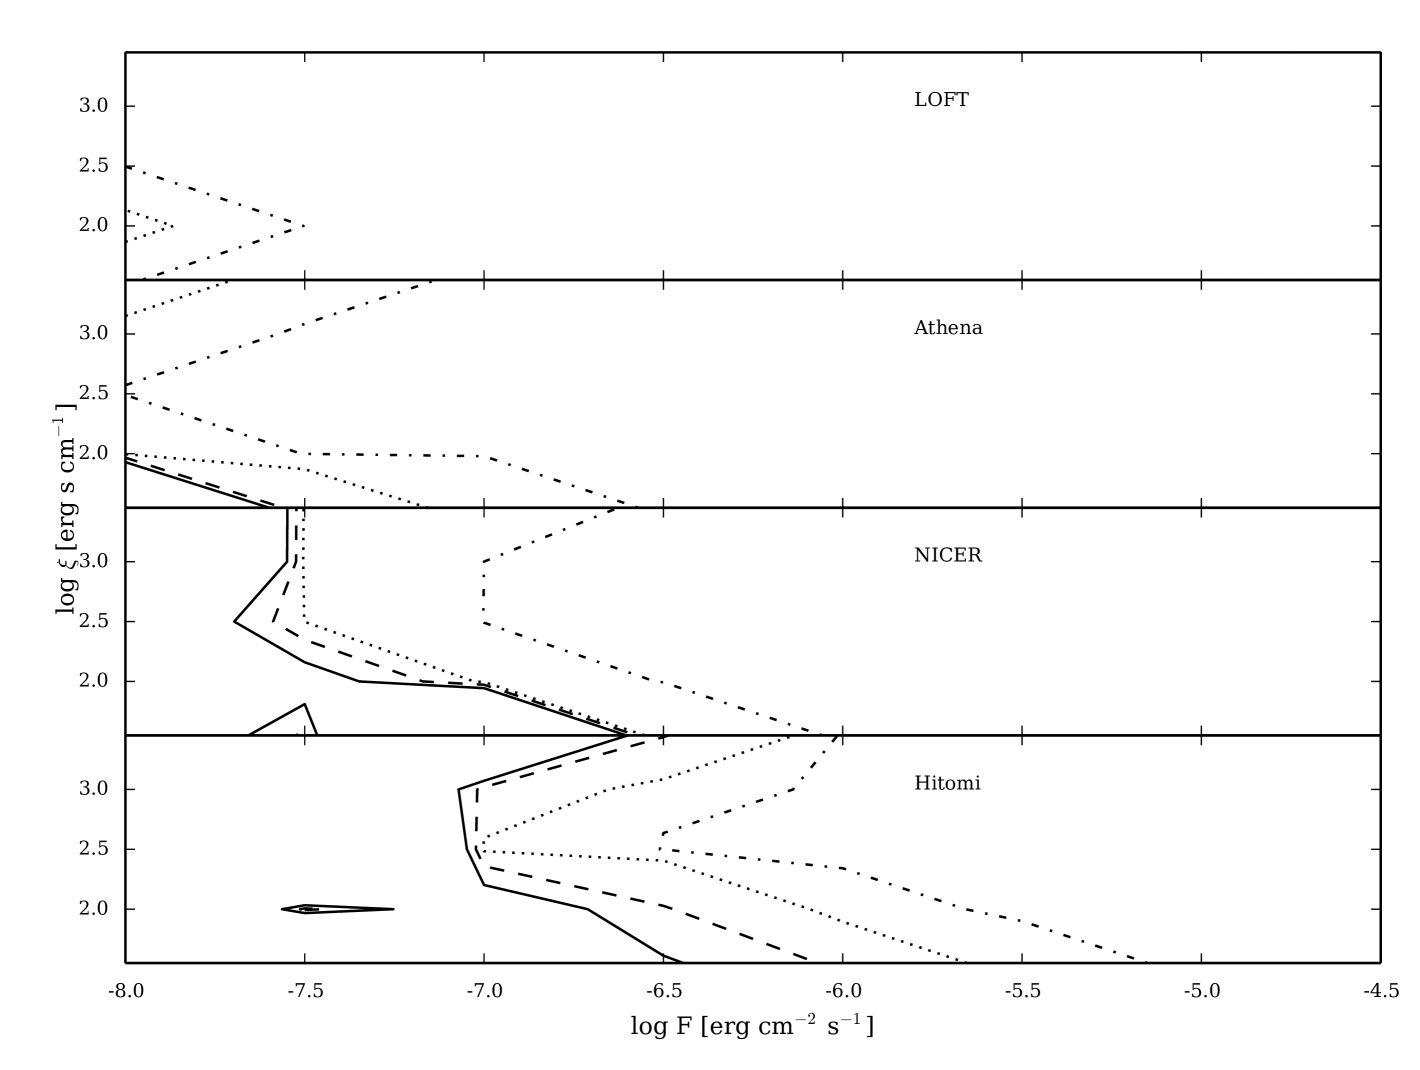
The standard deviations of the average shown in the lower half of Table 3 are similar in magnitude to the average values themselves and increase with . Therefore, there is clearly a wide range of fit results obtained within the parameter space defined by . A more detailed view of the variety of obtained when applying the blackbody model to the simulated data is presented in Figure 3, where contours of are shown as functions of and at keV for each instrument considered (the results are qualitatively similar at other blackbody temperatures).
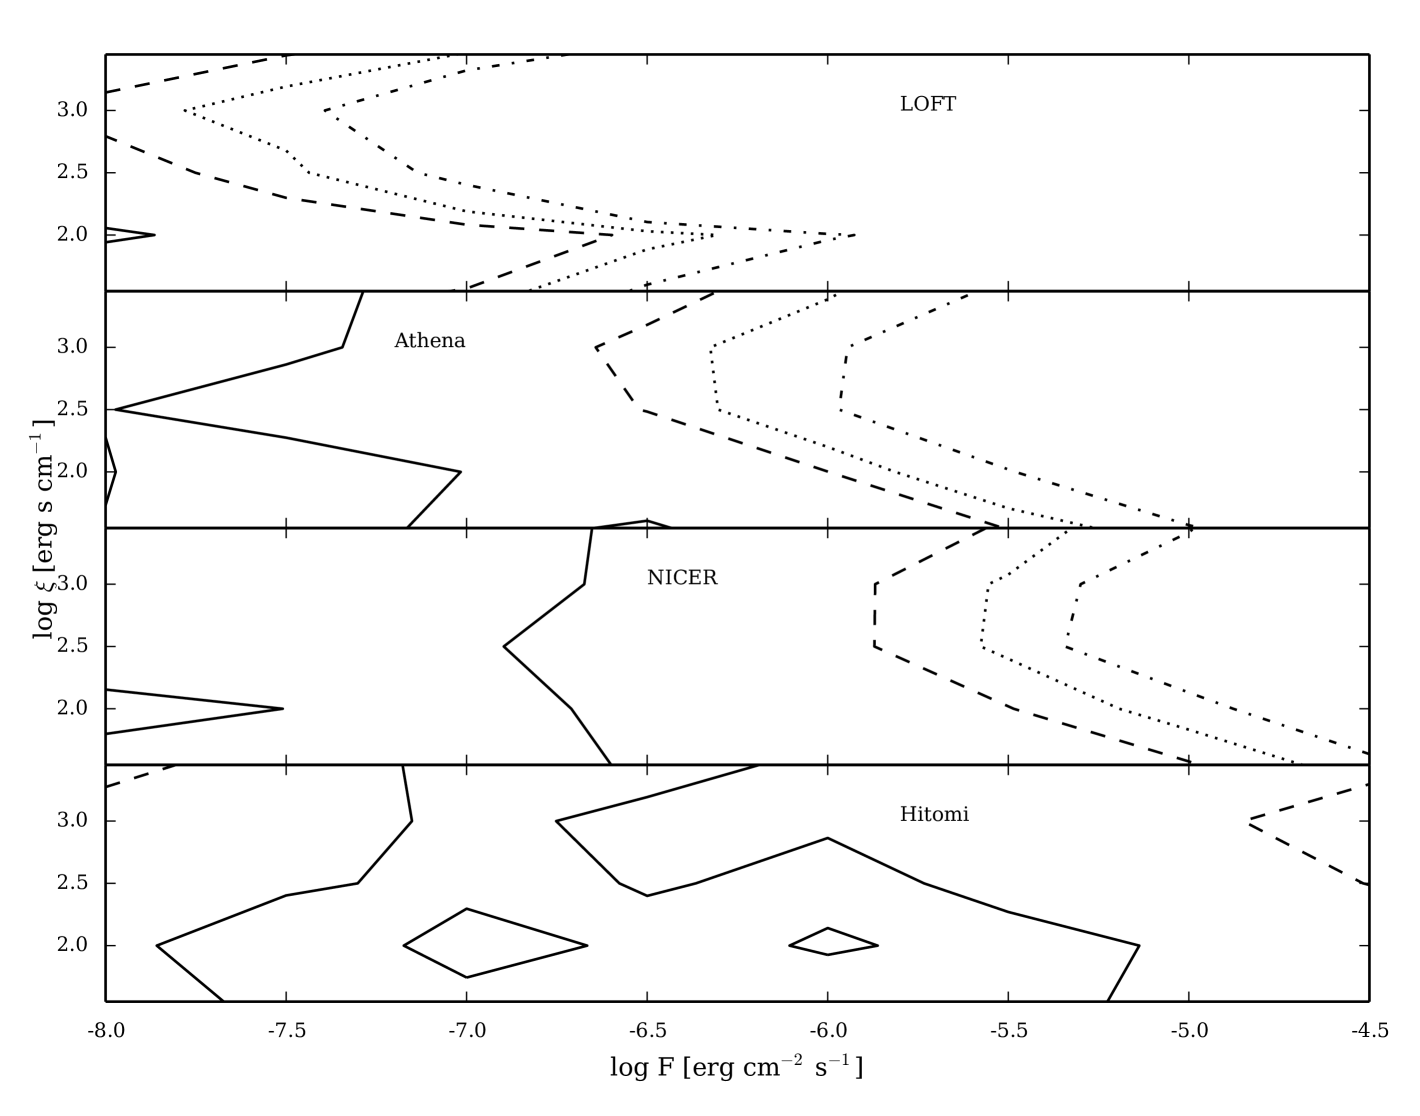
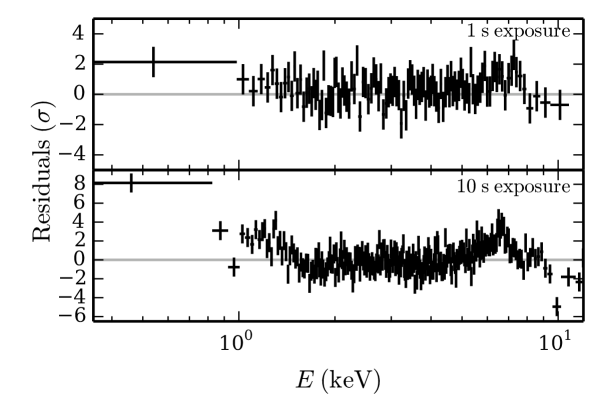
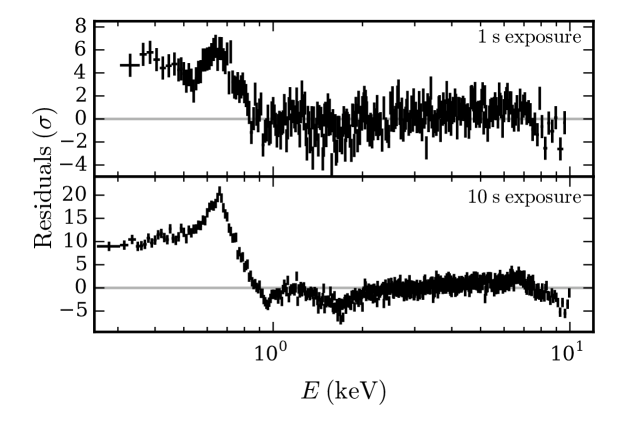
The effective area of a Hitomi-like telescope is relatively small, such that reflection signatures in Type I X-ray bursts are unlikely to be strongly detected by this mission unless it was a burst of historic brightness or duration (see also Section 3.6). In contrast, the NICER reflection spectra significantly deviate from a blackbody for . The large effective area of Athena could enable the detection of reflection signatures at even lower flux levels. However, it may not be able to handle the large photon counts that an X-ray burst provides (Section 3.6). The LOFT design includes an even larger collecting area, and the blackbody model is inadequate at all but the lowest considered flux values. NICER and LOFT will, therefore, be best suited to detect reflection. Figure 4 illustrates the deviations of a NICER reflection spectrum from a blackbody. Clearly visible are the Fe K line near keV as well as a soft excess below keV.
The contours of Figure 3 show for all instruments that reflection signatures are more easily detected for . This is the result of two features in the X-ray reflection spectrum (Ballantyne, 2004). First, the equivalent width of the Fe K line is strongest at this ionization parameter because it is dominated by recombination onto He-like Fe, and the other metals in the irradiated slab (e.g., C, N and O) are highly ionized, leading to less absorption at energies around 6 keV and a more prominent Fe line. In addition, the gas at these ionization parameters is full of hot electrons and ionized metals that together produce a significant bremsstrahlung-dominated soft excess at lower energies. As all the instruments considered here with the exception of LOFT have a band-pass that extends substantially below keV (Table 1, Figure 1), this soft excess provides a significant deviation from the blackbody shape and allows the reflection signal to be more easily detected. At larger values of , the Fe K line becomes weaker due to the increased ionization and the soft excess becomes stronger, but the overall detectability of the reflection signal is reduced. For , both the soft excess and the Fe K equivalent width are smaller, and it becomes significantly more challenging for the instruments to detect the reflection signal in the burst spectra.
Figure 3 indicates the region of parameter space where the reflection features are strong enough that a blackbody model cannot provide a good fit to the simulated spectrum. However, the reflection signal remains in the data even if a blackbody model is a good statistical fit to the spectrum. An example of this can be seen in the top panel of Figure 4, where we show the residuals of the blackbody fit to a 1 s NICER observation for a burst with . According to the contours of Figure 3, the blackbody model is an acceptable fit to these data, yet the residuals clearly show the effects of the reflection spectrum with excesses at keV and at lower energy. In this case, a fit with the reflection model would likely be a significant improvement over the blackbody model. Therefore, it is interesting to examine our fits results in a new way and determine the region of parameter space where the reflection model is a significant improvement over the blackbody model.
To this end, we compute the F-test probability for each spectrum to determine the significance of any improvement the reflection model makes over the blackbody model. Contours at different significance levels are shown in Figure 5 for the keV models. These contours indicate which bursts are better described by the reflection model, whereas Figure 3 shows where the blackbody model cannot adequately describe the spectra (a more stringent requirement). The reflection model is a significant improvement over the blackbody model for (LOFT, Athena), (NICER), (Hitomi). These fluxes are substantially smaller than the limits needed for the blackbody model to provide a poor description of the data (Figure 3), and therefore implies that reflection features will be detectable down to these flux limits, but constraints on the reflection parameters may be relatively poor.
3.2. Uncertainties in the Measured Parameters
Many spectral analyses of Type I X-ray bursts omit the possibility of a reflection component in the model. It is therefore interesting to consider if this omission has an effect on the uncertainty in the spectral parameters. We plot in Figure 6 the relative uncertainty in two crucial X-ray burst parameters ( and ) as a function of flux for simulated NICER bursts. The specific reflection model used for the figure has keV and , although the results are qualitatively similar for other parameters and other observatories. The relative error on the parameters is defined using the uncertainty from the spectral fit compared to the true value of the parameter. We compare the errors for fits with the reflection model and with the model that omits reflection.
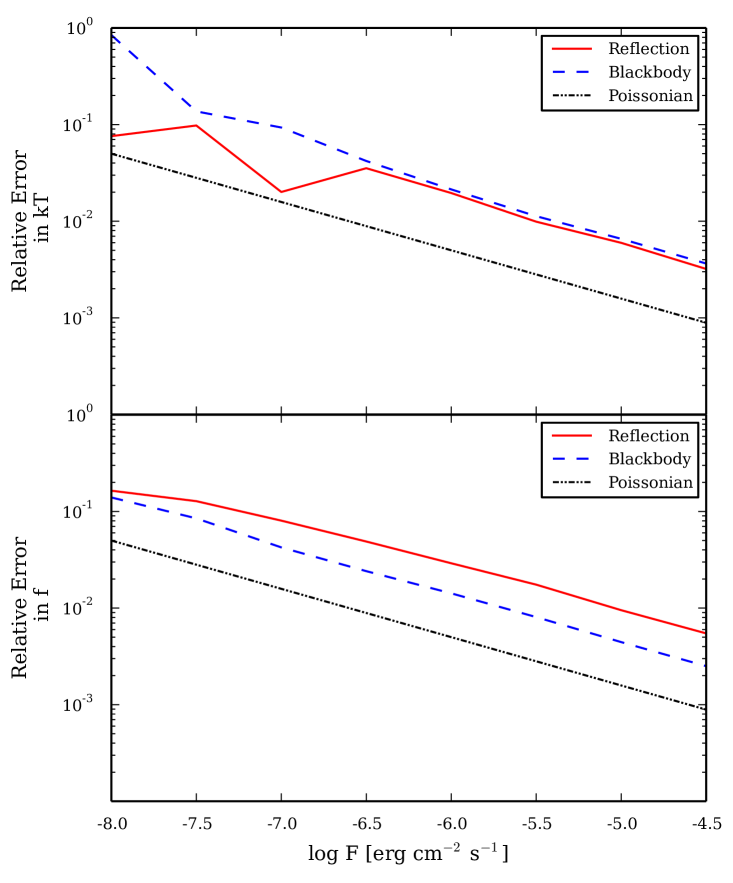
For both and the measured error decreases with flux as expected for a Poisson distribution. For the case of , it is independent of the spectral model used to fit the simulated data.111Deviations from the behavior expected for a Poisson distribution are seen in Figure 6, in particular at small . At these small fluxes, the statistically random noise added to the simulation is most significant. Thus, these deviations are simply due to the single realization of a spectrum with a significant contribution from Poisson noise. Thus, the measured relative error of appears to be robust to neglecting reflection in the spectral fitting. In contrast, the uncertainty in , which measures the relative strength of the persistent emission, is higher when fit with a model that includes reflection, even though this model was used to generate the simulated data. This is because the reflection model has three parameters that can be adjusted to set the overall normalization of the spectrum (, , and the reflection fraction ), whereas the blackbody model only has and . This extra degree of freedom in the reflection model leads to a larger uncertainty in the normalization of the relatively weak persistent emission.
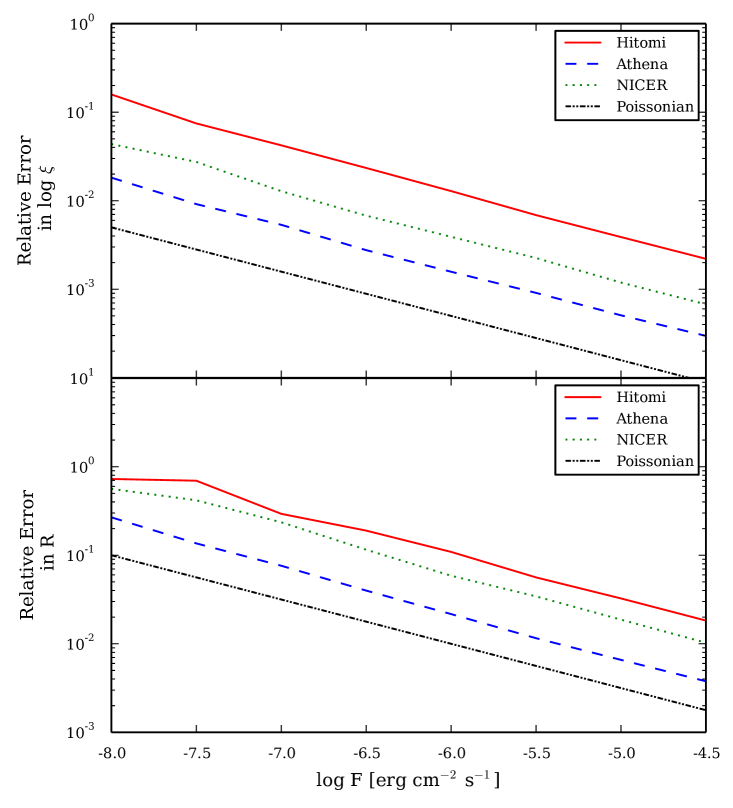
Next, we consider the relative uncertainties in the reflection parameters: the reflection fraction and the ionization parameter , as a function of flux for a burst with keV and as observed by all four observatories (Figure 7).
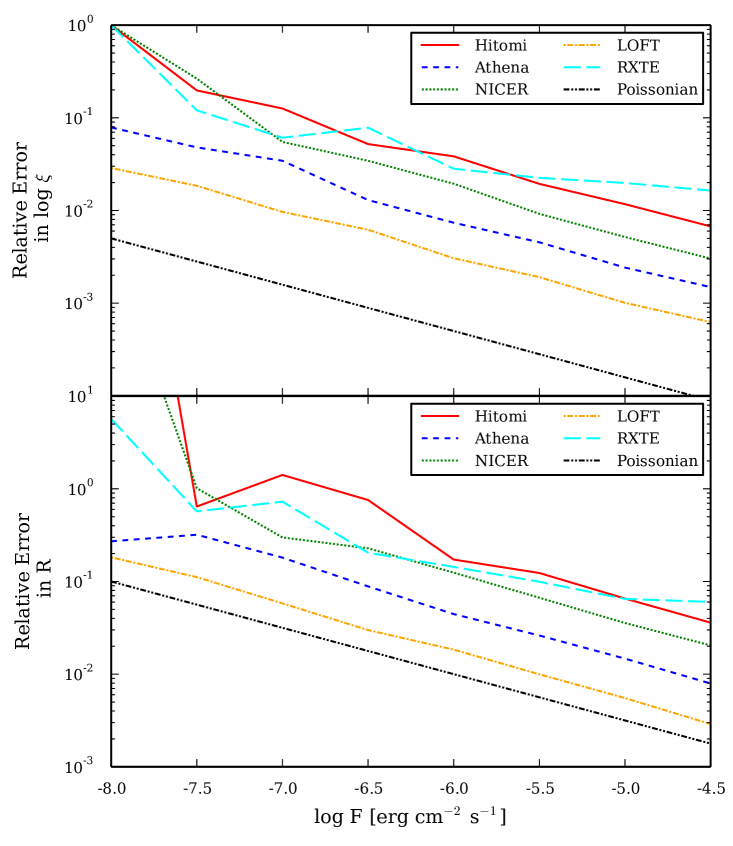
As with the burst parameters, the errors on the parameters increase to lower fluxes due to Poisson noise, but for NICER and Hitomi the relative errors of both parameters increase sharply at where the reflection signal is no longer significantly detectable (Figure 5). NICER can measure with a relative error for fluxes . Athena and LOFT measure with this relative error for all our modeled bursts, and can even constrain with an error for (Athena) and (LOFT), respectively.
As is related to the covering factor of the irradiated accretion disk, measurements of will provide information on the disk geometry. Constraining is a more difficult challenge and requires a stronger detection. Therefore, a Hitomi-like telescope would require to be able to measure with a relative error . However, NICER can achieve that precision for which is not much larger than the limit for Athena (), whereas LOFT could provide such precision for .
3.3. Comparison to RXTE
The most detailed burst observations to date have been performed with RXTE/PCA (e.g., Galloway et al., 2004). RXTE spectra of bright bursts with the full array of PCUs exhibit a hint of the Fe K line (Galloway et al., 2008), and reflection was detected for two superbursts (Ballantyne & Strohmayer, 2004; Keek et al., 2014b). For comparison with the other instruments, and to check the reliability of our method, we also create simulations for RXTE/PCA. This instrument consisted of collimated PCUs that are sensitive in the keV band and have a combined collecting area of (Jahoda et al., 2006). Although only a subset of the 5 PCUs was active during the majority of observations, we employ the response of the full array, which represents the highest quality burst observations. The response is generated using the tool pcarsp for the top layer and event mode data with channels, and the background is estimated with pcabackest, where the gain settings from Epoch 5C and background conditions from March 2011 were used as template.
First, to confirm that our method is obtaining the correct uncertainties in the reflection parameters, we include the uncertainties in and for the RXTE simulations in Fig. 7. We find that the reflection uncertainties are consistent with those measured at the peak of the superbursts near for 4U 1636-536 and for 4U 1820-30 (corrected for the different exposure times and the number of active PCUs). Thus, we are confident that the plotted uncertainties in the reflection parameters will be an accurate guide for these future instruments.
Since RXTE has been the principle instrument for burst analyses for over a decade, it is useful to show how neglecting the presence of reflection will impact the derived and for RXTE observations (Figure 8).
At low flux values, the uncertainties in and are consistent with being scattered around a trend expected for a Poisson distribution. This is similar to our results for NICER, where at high flux the scatter is reduced and the trend is purely described by Poisson noise (Figure 6). For RXTE, however, the trend appears somewhat less steep than a Poisson trend, and it is similar for fits with the blackbody and the reflection models. The same behavior is present for the reflection parameters (Figure 7). Although at certain flux values RXTE’s uncertainties are similar to NICER’s, the scatter is larger. At the largest considered flux, where the statistical quality of the spectra is highest, RXTE exhibits the largest relative uncertainties of all considered observatories: a factor larger for and a factor larger for compared to NICER.
Interestingly, the relative uncertainty in is systematically larger by a factor for the reflection fits compared to the blackbody fits. Given the PCA’s band-pass and modest spectral resolution, the broadening of the continuum by reflection may introduce a degeneracy between and the reflection parameters. As determines the shape of the main spectral component, this also affects the other spectral parameters, including . Furthermore, the main reflection feature observable by the PCA, the Fe K line, is sampled by just a few energy bins. Measurement of the reflection parameters is highly sensitive to statistical noise in those bins, and this may explain why the RXTE simulations exhibit a relatively large scatter in the uncertainties of the reflection parameters. The other instruments sample the reflection signal with a larger number of spectral bins, often including features below keV, resulting in a much better behaved measurement of the reflection parameters.
However, the RXTE simulations employ the full array of PCUs, whereas in practice not all were enabled during a particular observation. A typical number of active PCUs reduces the burst flux by . Also, most RXTE burst observations have been analyzed at a shorter time resolution of (e.g., Galloway et al., 2008), which is equivalent to a further shift in flux of . Therefore, in practice most RXTE burst analyses are equivalent to the lowest considered flux values, where reflection is not detectable and the behavior of the uncertainty in is closest to that of a Poisson distribution. We conclude that neglecting the possibility of reflection in RXTE fits of bursts did not greatly impact the measured temperatures, with the deviations being at most in our simulations.
3.4. Constraining the Reflection Geometry with LOFT
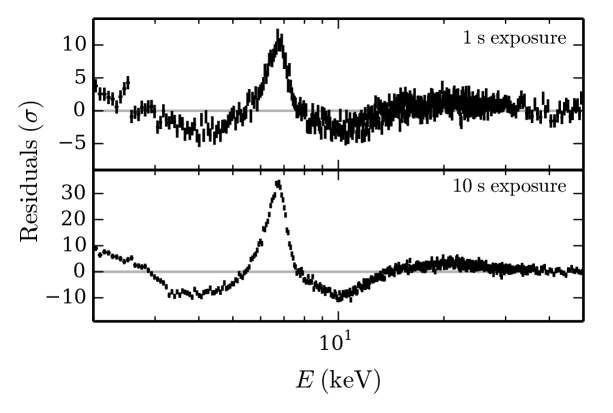
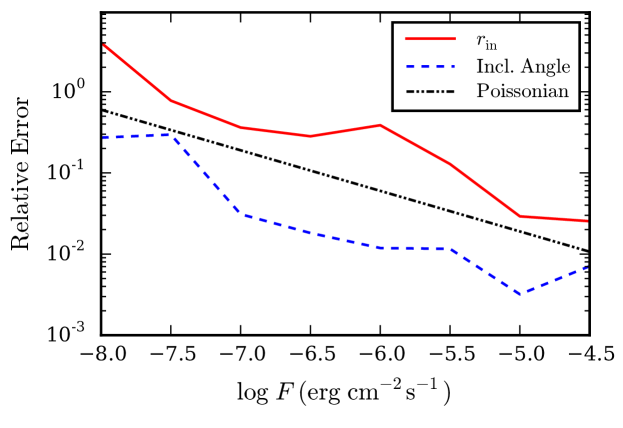
Contrary to the other considered missions, the band-pass of LOFT precludes it from detecting the reflection signatures below . However, its large collecting area enables such a detailed view of the Fe K line that LOFT would provide the most precise measurements of the spectral parameters (Figure 7). We illustrate the detectability of the iron line and edge by showing the residuals of blackbody fits to two reflection spectra with and (Figure 9). Because of the high signal-to-noise ratio, additional parameters can be constrained. We repeat the fits of the reflection model to the simulated LOFT spectra, leaving the inner radius of the reflection site and the inclination angle of the disk free. The relative errors of the two additional free parameters roughly follow a trend as a function of flux that is expected for a Poisson distribution (Figure 10). For a few second exposure at , the inner radius of the accretion disk can be crudely constrained to several tens of percent, whereas the disk’s inclination can be constrained within a few percent.
3.5. Sources with Low Absorption
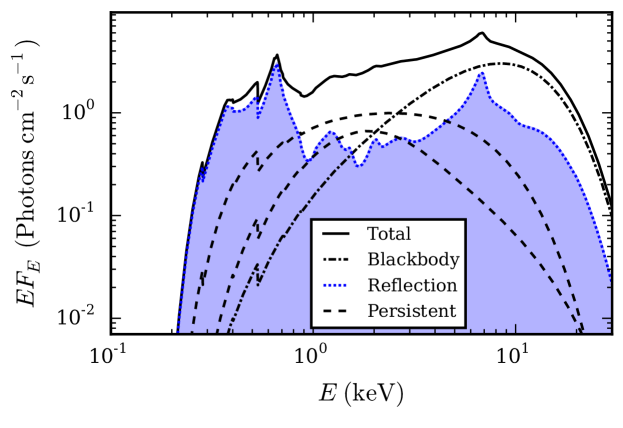
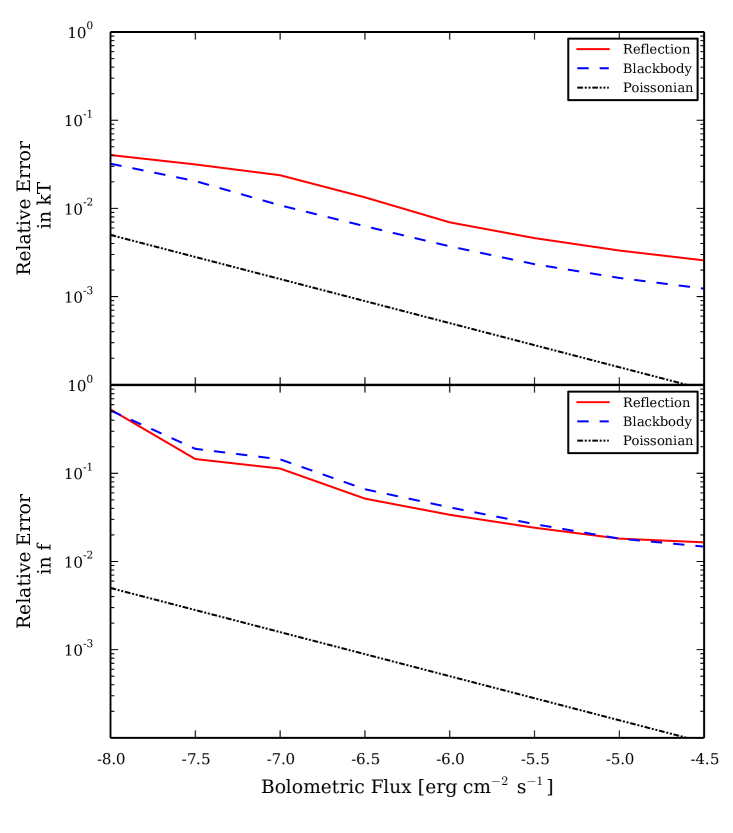
We have employed a relatively high absorption column that is typical for sources in the Galactic plane ( for 4U 1608-522; Keek et al., 2008), and therefore the predicted soft features are largely erased by interstellar absorption (Figure 2). A select few known bursting sources have a smaller absorption column of . This allows for the detection of emission features in the spectrum below (Figure 11), where burst reflection dominates the soft part of the spectrum. For Hitomi, NICER, and Athena, which cover the soft band, we redo the simulations using . This is the absorption column measured for SAX J1808.4-3658 (Wang et al., 2001). The rest of the spectral model is the same as before. For all three instruments the uncertainties in the reflection parameters are reduced for a given flux compared to the simulation with a larger value (Figure 12). For example, NICER reaches a precision for of in and measurements of the reflection fraction are improved as well. This is due to the large number of soft photons below keV that constitute the most prominent part of the reflection signal in this case (Figure 13). Furthermore, the scatter around the Poisson trend at low flux is reduced with respect to the simulations with higher absorption (Figure 7).
3.6. Limitations on Burst Observations due to Pile up
A common issue for X-ray detectors is “pile up.” If multiple photons are detected by the same or neighboring pixels within one read-out cycle, they may be recorded as a single photon with an energy that is the sum of the photon energies. This reduces the observed count rates and distorts spectra. For Hitomi SXI in the fastest read-out mode, a burst spectrum with keV and is expected to be piled up at a level of 10% for fluxes in excess of (Tsunemi et al., 2013), which covers the entire flux range that we considered in our simulations. Possibly, this issue could have been mitigated by a faster read-out mode, similar to the “burst” mode of XMM-Newton’s EPIC pn instrument. Such a mode was not planned for Hitomi (Tsunemi et al., 2013).
Operation of Athena WFI will include a small window mode that facilitates high count rates of up to (Meidinger et al., 2014). X-ray bursts may, however, reach this limit already for a flux of . This flux is close to the minimum flux required for detecting reflection. For bursts with fluxes below this limit, an integration time of several seconds may be sufficient to collect spectra with detectable reflection features. Conversely, for brighter bursts, the usual strategy of dealing with pile up may be applied: the center of the point spread function where pile up is present, is excluded from the spectra. This reduces the statistical quality of the spectra. However, similar to the weaker bursts, reflection features may still be detected. Moreover, as the launch date of Athena is still far in the future, technical solutions could be found to increase the count rate limit, such as a fast read-out mode.
The detectors on board NICER are of a different type, and were specifically designed to handle very high count rates. For , , and , our spectral model predicts a count rate of . The signal will be divided among 56 detectors, allowing NICER to easily handle such large rates. Similarly, dead time (the time a detector is inactive when an event is being processed) is negligible for typical bright bursts. Observations with NICER can, therefore, be used to the full extent to detect burst reflection. The same is true for LOFT, which likewise was designed to handle high throughput.
4. Discussion
4.1. Detectability of Burst Reflection
Detecting the presence of accretion disk reflection in X-ray burst spectra is challenging because of the short duration of the bursts and the mixture of multiple emission components all contributing to the observed source. We showed that the detectability of reflection features depends only mildly on the blackbody temperature , with lower being easier to detect as more of the emission falls in the band-passes of most of the modeled instruments. In contrast, the reflection features are significantly easier to detect for ionization parameters (Figures 3 and 5) because of the large equivalent width of the Fe K line and a strong soft excess. The larger values of the ionization parameter will likely occur near the onset of any burst when the flux on the disk is largest (Ballantyne & Strohmayer, 2004; Keek et al., 2014b). Thus, searches for reflection features in burst spectra will have the best chance for success with observations that are as close to the start of the burst as possible.
We investigated the detection of burst reflection with four instruments. For bursts with a flux of , NICER will significantly detect the presence of disk reflection in burst spectra, and will provide tight constraints on reflection parameters for 1 s exposures at . Our simulations all employ exposure times of 1 s, but the results are applicable to longer exposures for proportionally lower fluxes (such that the total number of counts is the same). Therefore, for spectra originating from a bright burst of sufficient duration, NICER will be able to also track how the features change in time in response to the burst.
Unfortunately, the relatively low effective area of a Hitomi-like telescope means that although it will be able to statistically detect the reflection signal for bursts with , it will be unable to constrain reflection parameters for any realistic burst or superburst. Aside from the instrument that we consider (the SXI), Hitomi also hosted the Soft X-ray Spectrometer (SXS). The SXI and SXS had overlapping band-passes and similar limitations on the photon rate that can be processed. Including the SXS would have doubled the collecting area, and this reduces the flux requirements from our simulations by a factor (). This is insufficient to substantially improve the detectability of burst reflection with Hitomi.
In the next decade, Athena will provide an order-of-magnitude improvement over NICER in detecting reflection features from bursts. With Athena it may be possible to directly constrain reflection features in a 1 s exposure of bright bursts, opening up the possibility of tracing the evolution of the reflection parameters during a burst in detail. An important issue is for an observing mode to be devised for the WFI to handle the large count rates expected from the brightest bursts in order to avoid pile up. Similar to Hitomi, Athena will also include a spectrometer that has a similar energy band as the WFI, and that can be employed to increase the collected number of photons by approximately a factor .
A LOFT-like mission with a m2 collecting area would revolutionize this field and be able to perform accretion disk tomography using the Fe K line from bright Type I X-ray bursts. This would provide detailed information on the time evolution of the accretion environment of neutron stars under the influence of strong X-ray irradiation.
4.2. The Soft X-Ray Band and the Influence of Absorption
The broad band-passes of the new and upcoming instruments present new opportunities to study the disk reflection signal. Models of the reflection features predict a soft excess in the reflection spectrum due to both a bremsstrahlung continuum and recombination lines (Ballantyne, 2004). Unfortunately, for most known bursting sources the interstellar absorption is large, and the signal in the soft band is substantially reduced. Still, the remaining signal is sufficient to enable the measurement of the reflection parameters during short exposures with NICER and Athena. Conversely, RXTE does not cover the soft band, and only detects the Fe K line and absorption edge. During short exposures, we find that RXTE’s reflection detection is strongly impacted by statistical noise in the few spectral bins that cover these features, which explains why reflection was only observed clearly in longer exposures for two superbursts. Therefore, coverage of the soft band is crucial for NICER and Athena to measure the reflection properties, even in the presence of strong absorption.
The recombination lines below keV carry information on the disk composition and density (Ballantyne, 2004). For a few sources the interstellar absorption is low enough to observe these features in detail: only of known bursts originate from sources with (e.g., Cornelisse et al., 2003; Galloway et al., 2008). An example of a source with a small absorption column is SAX J1808.4-3658 with (Wang et al., 2001). A Chandra observation of a burst from this source (with contemporaneous RXTE/PCA coverage) exhibits a soft excess with respect to a blackbody model, which is well fit with a model of reflection off a highly ionized accretion disk (in ’t Zand et al., 2013). However, the quality of the spectra was insufficient to distinguish burst reflection from, e.g., increased persistent emission. We find that observations with future instruments that are sensitive to the soft X-ray band will provide the strongest constraints on the reflection parameters.
The recently launched ASTROSAT (Singh et al., 2014) has an array of Large Area Xenon Proportional Counters (LAXPC) similar to the PCA, as well as a Soft X-ray Telescope (SXT). The effective area at keV of LAXPC is similar to that of RXTE/PCA. The SXT extends ASTROSAT’s coverage to lower energies. Its effective area at keV is, however, only , which is smaller than Chandra. We, therefore, expect that ASTROSAT will only observe reflection in long bursts, similar to RXTE.
4.3. Applications of Burst Reflection
In the same way as X-ray reflection has proved to be invaluable for studying the accretion processes around black holes, we expect burst reflection to provide invaluable insight into accretion physics in the vicinity of neutron stars. Here we discuss several important applications that will be enabled by observations of burst reflection.
4.3.1 Mass and Radius Measurements of Neutron Stars
In recent years X-ray bursts have been employed to measure the masses and radii of neutron stars in order to constrain the equation of state of dense matter (e.g., van Paradijs, 1979; Özel, 2006; Steiner et al., 2010; Güver et al., 2012; Poutanen et al., 2014). X-ray bursts provide the rare opportunity to determine both quantities simultaneously (e.g., Lattimer & Prakash, 2007). A crucial issue is the accurate interpretation of burst spectra, as deviations from a blackbody introduce systematic uncertainties. For example, free-free and Compton scattering in the neutron star atmosphere introduce subtle changes to the spectral shape. Detailed spectral models have been created for neutron star atmospheres during X-ray bursts (e.g., Suleimanov et al., 2011b), and have been successfully fit to certain burst spectra (Suleimanov et al., 2011a). For other observations, however, the atmosphere models do not reproduce the expected behavior (Kajava et al., 2014), especially in the high-flux soft persistent state. In this spectral state, the accretion disk is thought to extend closest to the neutron star (Done et al., 2007), such that the reflection signal is maximal. The reflection spectrum is also a reprocessed blackbody, which deviates more strongly from a blackbody (Figure 11). Therefore, a substantial contribution of reflection to the burst spectrum may explain those observations that are not well described by burst atmosphere models.
By detecting burst reflection, its contribution to the spectrum can be quantified. This provides guidance for mass-radius measurements to select those bursts that are least “contaminated.” Moreover, if the reflection parameters can be sufficiently well determined, the properties of the burst atmosphere and the reflection components may be constrained simultaneously. This will also be important for studies that use the shape of burst light curves to constrain nuclear reactions among short-lived proton-rich isotopes (e.g., Fisker et al., 2006; Cyburt et al., 2010; Parikh et al., 2013).
4.3.2 Evolution of the Accretion Environment
For X-ray reflection of coronal emission in AGN and compact binaries, the reflection signal is observed to evolve over time (e.g., Ballantyne et al., 2011; Keek & Ballantyne, 2016). These observations simultaneously probe changes in the corona and in the disk, making it challenging to uncover the evolution of the individual regions. For burst reflection the situation is less complicated, as the neutron star’s geometry remains largely constant, with the possible exception of a brief well discernible period of radius expansion. Furthermore, the time evolution of the burst emission from the neutron star can be successfully modeled in great detail (Heger et al., 2007; in ’t Zand et al., 2009). Therefore, the evolution of the reflection parameters during X-ray bursts predominantly probes changes in the accretion disk.
X-ray bursts provide a repeating experiment to investigate the response of accretion disks to sudden strong irradiation. During the two superbursts that at present provided the only clear detections of burst reflection, the accretion disks were found to be strongly ionized at the onset of the events, and the ionization parameter was reduced during the tail of the bursts (Ballantyne & Strohmayer, 2004; Keek et al., 2014b). For the 1999 superburst from 4U 1820-30 the reflection signal was sufficiently strong to trace the location of reflection: it initially was located further from the neutron star before returning to smaller radii in the tail, suggesting that this superburst initially disrupted the inner disk. In this paper we find that with future instruments, this type of analysis can be performed also for short bursts, which are detected at a thousand times higher rate than superbursts.
The reflection fraction, , is an important parameter for tracing changes in the geometry of the disk. A flat disk produces a value of (Lapidus & Sunyaev, 1985; Fujimoto, 1988). For the two mentioned superbursts, larger values may have been present (Ballantyne & Strohmayer, 2004; Keek et al., 2014b, 2015), which could indicate that the inner disk was puffed up due to the burst irradiation (He & Keek, 2016). X-ray heating of the disk may, however, not be the only important process during bursts. The generation of winds or the inflow of material by Poynting-Robertson drag could play a role as well (Ballantyne & Everett, 2005). Further theoretical studies are required to investigate this in more detail, and we expect that burst observations with future instruments will provide constraints for such models.
5. Conclusions
Reflection spectroscopy during Type I X-ray bursts holds the promise to open a new avenue for studying accretion physics in the vicinity of neutron stars, by revealing the response of accretion disks to sudden strong irradiation. Furthermore, burst reflection can act as a quantitative measure of which bursts are most suitable for mass-radius determination. Previously, reflection has only been detected during two superbursts. We investigate the detectability of burst reflection using a large set of simulated spectra that are representative of most known bursts. Taking into account the instrumental energy response, effective area, and ability to handle large count rates, we find that future X-ray observatories will be able to detect reflection during the frequent short Type I bursts. Considering all these factors leads us to conclude that NICER provides an excellent opportunity to study the interaction between X-ray bursts and the surrounding accretion disk that will not be significantly surpassed until the launch of Athena. Further in the future, an observatory with a large collecting area similar to the LOFT design would enable studying the accretion processes in unprecedented detail.
References
- Anders & Grevesse (1989) Anders, E., & Grevesse, N. 1989, Geochim. Cosmochim. Acta, 53, 197
- Arnaud (1996) Arnaud, K. A. 1996, in Astronomical Society of the Pacific Conference Series, Vol. 101, Astronomical Data Analysis Software and Systems V, ed. G. H. Jacoby & J. Barnes, 17
- Ballantyne (2004) Ballantyne, D. R. 2004, MNRAS, 351, 57
- Ballantyne & Everett (2005) Ballantyne, D. R., & Everett, J. E. 2005, ApJ, 626, 364
- Ballantyne et al. (2011) Ballantyne, D. R., McDuffie, J. R., & Rusin, J. S. 2011, ApJ, 734, 112
- Ballantyne & Strohmayer (2004) Ballantyne, D. R., & Strohmayer, T. E. 2004, ApJ, 602, L105
- Balucinska-Church & McCammon (1992) Balucinska-Church, M., & McCammon, D. 1992, ApJ, 400, 699
- Barcons et al. (2015) Barcons, X., Nandra, K., Barret, D., et al. 2015, Journal of Physics Conference Series, 610, 012008
- Belian et al. (1976) Belian, R. D., Conner, J. P., & Evans, W. D. 1976, ApJ, 206, L135
- Bradt et al. (1993) Bradt, H. V., Rothschild, R. E., & Swank, J. H. 1993, A&AS, 97, 355
- Chen et al. (2013) Chen, Y.-P., Zhang, S., Zhang, S.-N., et al. 2013, ApJ, 777, L9
- Chen et al. (2012) Chen, Y.-P., Zhang, S., Zhang, S.-N., Li, J., & Wang, J.-M. 2012, ApJ, 752, L34
- Cornelisse et al. (2003) Cornelisse, R., in ’t Zand, J. J. M., Verbunt, F., et al. 2003, A&A, 405, 1033
- Cyburt et al. (2010) Cyburt, R. H., Amthor, A. M., Ferguson, R., et al. 2010, ApJS, 189, 240
- Day & Done (1991) Day, C. S. R., & Done, C. 1991, MNRAS, 253, 35P
- Degenaar et al. (2016) Degenaar, N., Koljonen, K. I. I., Chakrabarty, D., et al. 2016, MNRAS, 456, 4256
- Done et al. (2007) Done, C., Gierliński, M., & Kubota, A. 2007, A&A Rev., 15, 1
- Fabian et al. (1989) Fabian, A. C., Rees, M. J., Stella, L., & White, N. E. 1989, MNRAS, 238, 729
- Fabian & Ross (2010) Fabian, A. C., & Ross, R. R. 2010, Space Sci. Rev., 157, 167
- Feroci et al. (2014) Feroci, M., den Herder, J. W., Bozzo, E., et al. 2014, in Society of Photo-Optical Instrumentation Engineers (SPIE) Conference Series, Vol. 9144, Society of Photo-Optical Instrumentation Engineers (SPIE) Conference Series, 2
- Fisker et al. (2006) Fisker, J. L., Görres, J., Wiescher, M., & Davids, B. 2006, ApJ, 650, 332
- Fujimoto (1988) Fujimoto, M. Y. 1988, ApJ, 324, 995
- Galloway et al. (2004) Galloway, D. K., Cumming, A., Kuulkers, E., et al. 2004, ApJ, 601, 466
- Galloway et al. (2008) Galloway, D. K., Muno, M. P., Hartman, J. M., Psaltis, D., & Chakrabarty, D. 2008, ApJS, 179, 360
- Gendreau et al. (2012) Gendreau, K. C., Arzoumanian, Z., & Okajima, T. 2012, in Society of Photo-Optical Instrumentation Engineers (SPIE) Conference Series, Vol. 8443
- Grindlay et al. (1976) Grindlay, J., Gursky, H., Schnopper, H., et al. 1976, ApJ, 205, L127
- Güver et al. (2012) Güver, T., Psaltis, D., & Özel, F. 2012, ApJ, 747, 76
- Hasinger & van der Klis (1989) Hasinger, G., & van der Klis, M. 1989, A&A, 225, 79
- Hayashida et al. (2014) Hayashida, K., Tsunemi, H., Tsuru, T. G., et al. 2014, in Society of Photo-Optical Instrumentation Engineers (SPIE) Conference Series, Vol. 9144, Society of Photo-Optical Instrumentation Engineers (SPIE) Conference Series, 29
- He & Keek (2016) He, C.-C., & Keek, L. 2016, ApJ, 819, 47
- Heger et al. (2007) Heger, A., Cumming, A., Galloway, D. K., & Woosley, S. E. 2007, ApJ, 671, L141
- Hynes et al. (2006) Hynes, R. I., Horne, K., O’Brien, K., et al. 2006, ApJ, 648, 1156
- in ’t Zand et al. (2007) in ’t Zand, J. J. M., Jonker, P. G., & Markwardt, C. B. 2007, A&A, 465, 953
- in ’t Zand et al. (2009) in ’t Zand, J. J. M., Keek, L., Cumming, A., et al. 2009, A&A, 497, 469
- in ’t Zand et al. (2013) in ’t Zand, J. J. M., Galloway, D. K., Marshall, H. L., et al. 2013, A&A, 553, A83
- in ’t Zand et al. (2015) in ’t Zand, J. J. M., Altamirano, D., Ballantyne, D. R., et al. 2015, ArXiv e-prints, arXiv:1501.02776
- Inogamov & Sunyaev (1999) Inogamov, N. A., & Sunyaev, R. A. 1999, Astronomy Letters, 25, 269
- Jahoda et al. (2006) Jahoda, K., Markwardt, C. B., Radeva, Y., et al. 2006, ApJS, 163, 401
- Ji et al. (2014) Ji, L., Zhang, S., Chen, Y., et al. 2014, ApJ, 782, 40
- Kajava et al. (2014) Kajava, J. J. E., Nättilä, J., Latvala, O.-M., et al. 2014, MNRAS, 445, 4218
- Keek & Ballantyne (2016) Keek, L., & Ballantyne, D. R. 2016, MNRAS, 456, 2722
- Keek et al. (2014a) Keek, L., Ballantyne, D. R., Kuulkers, E., & Strohmayer, T. E. 2014a, ApJ, 789, 121
- Keek et al. (2014b) —. 2014b, ApJ, 797, L23
- Keek et al. (2015) Keek, L., Cumming, A., Wolf, Z., et al. 2015, MNRAS, 454, 3559
- Keek et al. (2008) Keek, L., in ’t Zand, J. J. M., Kuulkers, E., et al. 2008, A&A, 479, 177
- Kuulkers et al. (2002) Kuulkers, E., Homan, J., van der Klis, M., Lewin, W. H. G., & Méndez, M. 2002, A&A, 382, 947
- Kuulkers et al. (2004) Kuulkers, E., in’t Zand, J., Homan, J., et al. 2004, in American Institute of Physics Conference Series, Vol. 714, X-ray Timing 2003: Rossi and Beyond, ed. P. Kaaret, F. K. Lamb, & J. H. Swank, 257–260
- Lamb & Lamb (1978) Lamb, D. Q., & Lamb, F. K. 1978, ApJ, 220, 291
- Lapidus & Sunyaev (1985) Lapidus, I. I., & Sunyaev, R. A. 1985, MNRAS, 217, 291
- Lattimer & Prakash (2007) Lattimer, J. M., & Prakash, M. 2007, Phys. Rep., 442, 109
- Lewin et al. (1993) Lewin, W. H. G., van Paradijs, J., & Taam, R. E. 1993, Space Science Reviews, 62, 223
- Maccarone & Coppi (2003) Maccarone, T. J., & Coppi, P. S. 2003, A&A, 399, 1151
- Maraschi & Cavaliere (1977) Maraschi, L., & Cavaliere, A. 1977, in Highlights in Astronomy, ed. E. A. Müller, Vol. 4 (Reidel, Dordrecht), 127
- Meidinger et al. (2014) Meidinger, N., Nandra, K., Plattner, M., et al. 2014, in Proc. SPIE, Vol. 9144, Space Telescopes and Instrumentation 2014: Ultraviolet to Gamma Ray, 91442J
- Miller (2007) Miller, J. M. 2007, ARA&A, 45, 441
- Özel (2006) Özel, F. 2006, Nature, 441, 1115
- Parikh et al. (2013) Parikh, A., José, J., Sala, G., & Iliadis, C. 2013, Progress in Particle and Nuclear Physics, 69, 225
- Paul et al. (2012) Paul, B., Archana, M., & Saripalli, L. 2012, Bulletin of the Astronomical Society of India, 40, 93
- Poutanen et al. (2014) Poutanen, J., Nättilä, J., Kajava, J. J. E., et al. 2014, MNRAS, 442, 3777
- Revnivtsev et al. (2013) Revnivtsev, M. G., Suleimanov, V. F., & Poutanen, J. 2013, MNRAS, 434, 2355
- Singh et al. (2014) Singh, K. P., Tandon, S. N., Agrawal, P. C., et al. 2014, in Society of Photo-Optical Instrumentation Engineers (SPIE) Conference Series, Vol. 9144, Society of Photo-Optical Instrumentation Engineers (SPIE) Conference Series, 1
- Steiner et al. (2010) Steiner, A. W., Lattimer, J. M., & Brown, E. F. 2010, ApJ, 722, 33
- Strohmayer & Bildsten (2006) Strohmayer, T., & Bildsten, L. 2006, New views of thermonuclear bursts (Compact stellar X-ray sources), 113–156
- Strohmayer & Brown (2002) Strohmayer, T. E., & Brown, E. F. 2002, ApJ, 566, 1045
- Strohmayer & Markwardt (2002) Strohmayer, T. E., & Markwardt, C. B. 2002, ApJ, 577, 337
- Suleimanov et al. (2011a) Suleimanov, V., Poutanen, J., Revnivtsev, M., & Werner, K. 2011a, ApJ, 742, 122
- Suleimanov et al. (2011b) Suleimanov, V., Poutanen, J., & Werner, K. 2011b, A&A, 527, A139+
- Swank et al. (1977) Swank, J. H., Becker, R. H., Boldt, E. A., et al. 1977, ApJ, 212, L73
- Takahashi et al. (2012) Takahashi, T., Mitsuda, K., Kelley, R., et al. 2012, in Society of Photo-Optical Instrumentation Engineers (SPIE) Conference Series, Vol. 8443, Society of Photo-Optical Instrumentation Engineers (SPIE) Conference Series, 1
- Tsunemi et al. (2013) Tsunemi, H., Hayashida, K., Nakajima, H., et al. 2013, in Society of Photo-Optical Instrumentation Engineers (SPIE) Conference Series, Vol. 8859, Society of Photo-Optical Instrumentation Engineers (SPIE) Conference Series, 0
- van Paradijs (1979) van Paradijs, J. 1979, ApJ, 234, 609
- van Paradijs & Lewin (1986) van Paradijs, J., & Lewin, H. G. 1986, A&A, 157, L10
- Walker (1992) Walker, M. A. 1992, ApJ, 385, 642
- Wang et al. (2001) Wang, Z., Chakrabarty, D., Roche, P., et al. 2001, ApJ, 563, L61
- Woosley & Taam (1976) Woosley, S. E., & Taam, R. E. 1976, Nature, 263, 101
- Worpel et al. (2013) Worpel, H., Galloway, D. K., & Price, D. J. 2013, ApJ, 772, 94
- Worpel et al. (2015) —. 2015, ApJ, 801, 60