Active Flows in Diagnostic of Troubleshooting on Backbone Links
Abstract
This paper aims to identify the operational region of a link in terms of its utilization and alert operators at the point where the link becomes overloaded and requires a capacity upgrade. The number of active flows is considered the real network state and is proposed to use a proxy for utilization. The Gaussian approximation gives the expression for the confidence interval on an operational region. The easy rule has been formulated to display the network defects by means of measurements of router loading and number of active flows. Mean flow performance is considered as the basic universal index characterized quality of network services provided to single user.
category:
C.2.3 Computer-communication networks Network Operationskeywords:
network monitoringcategory:
C.4 Performance of systems Measurement techniqueskeywords:
Network States on Flow Level, Mean Flow Performance, Test for Network Quality1 Introduction
Typically, the following four values are used for the estimation of the network quality:
-
•
Link or router loading (or available bandwidth for end-to-end connection)
-
•
Round trip time
-
•
Packet loss rate
-
•
IP packet delay variation (network jitter)
The available bandwidth, round trip time, packet loss rate and IP packet delay variation describe the quality of connectivity between two remote points or end-to-end connection. The link utilization is applied to the monitoring of a single hop between two routers [9, 16].
Network operators need to know when their backbone or peering links must be upgraded. Boundary values of network parameters may serve as an indicator e.g. as the current values of the network parameters reach a defined limit, the links have to be upgraded. The problem with this method is that there is no standardized set of network parameters to monitor. Each provider has its own set of technical specifications aimed at avoiding overload. Big providers, like Sprint [9], rely on the results of their own research. Usually, network operators monitor peak and average link utilization levels and upgrade their links when the utilization level is in the range 30%-60%.
The main focus of this paper is to use flow-based analysis [5] to monitor the backbone link and identify when an upgrade is needed. Previous work by Chuck Fraleigh et al [9] addressed a similar provisioning problem to reduce the per packet end-to-end delay. Dina Papagiannaki et al [16], at Infocom 03, introduced a methodology on the basis of SNMP statistics to predict when and where link additions/upgrades should take place in an IP backbone network.
For resource management in IP networks, several recent proposals [6] advocate for a flow oriented architecture. A flow is classically identified by the usual 5tuple composed of the source and destination addresses together with the source and destination port numbers and protocol type. The basic principles of flow-aware networking rely on the fact that flows are the elementary entities associated with user transactions. In order to provide end users with an acceptable quality, it is essential to share the bandwidth of the network by taking into account flows [4, 11, 13, 15]. To efficiently implement flow aware resource management techniques, however, it is essential to estimate the number of flows simultaneously active on a link in an operational network [2, 8].
Traffic accounting mechanisms based on flows should be considered as passive measurement mechanisms. Information is gathered by flows are useful for many purposes:
-
•
Understanding the behaviour of existing networks
-
•
Planning for network development and expansion
-
•
Quantifying network performance
-
•
Verifying the quality of network service
-
•
Attribution of network usage to users
Unfortunately, today there is no common view on how to estimate the connection quality, and how to find bottlenecks in networks.
Barakat et al [3] propose a model that relies on flow-level information to compute the total (aggregate) rate of data observed on an IP backbone link. For modelling purposes, the traffic is viewed as the superposition (i.e. multiplexing) of a large number of flows that arrive at random times and that stay active for random periods.
Our paper presents a technique for estimating the network behaviour based on the utilization curve which is representing correlation between link utilization and the number of active flows in it. We implicitly argue that the number of active flows may be considered as the real network state [2, 17] and is consequently, a better indication of utilization or desired operating point.
Our objective is to gather knowledge and plot the curve for network quality and related terms for utilization such as: length of operational region, mean flow performance, confidence interval, points of overload, etc. Traffic measurement and analysis is extended to consider the network quality for a large network or for a high-speed backbone [10, 14]. This will help discover possible bottlenecks on external links of enterprize network or backbones [9]. We locate the threshold point at which the addition of new flows does not increase the link utilization.
In order to prove our hypothesis we took measurements from the border gateway routers of Russian Internet Service Provider FREEnet. FREEnet (The Network For Research, Education and Engineering), an academic and research network, was founded on July 20, 1991, by the N.D.Zelinsky Institute of Organic Chemistry (IOC RAS) at the Center of Computer Assistance for Chemical Research (CACR). It assists and fulfills the networking needs of the research institutes of Russian Academy of Sciences, universities, colleges, and other research and academic institutions of Russia. FREEnet provides IPv4/IPv6 connectivity, worldwide multicast IP connectivity, DNS services, stratum 1 time service, mail relaying, collocation and hosting services, assorted information services.
Total capacity of upstream links is presently 2.1 Gbps, 1.3 Gbps links interconnect FREEnet with its peers (excluding FREEnet members). There are 6 regional branches that operate independently but they are cooperating as peers in accordance with FREEnet Charter principles. Tens of thousands researchers from hundreds institutions countrywide enjoy FREEnet services.
Earlier, in order to prove our hypothesis we took measurements from the border gateway routers of Russian ISP “SamaraTelecom” (ST) and from HEAnet - Ireland’s National Research and Education Network.
In the course of experiment average flow performance in investigated networks considerably differs. So flow performance in provincial Russian networks more then one order less similar indicator HEAnet. These results are completely not surprising; essentially they reflect quality of network services. At once there was an idea to apply the model found us for the comparative analysis of large networks or date-centers. Thus it is possible to use unique parameter - mean flow performance.
This paper describes an apllication of simple flow-based model [2, 3] to identify the quality of the connection and the instance when a backbone upgrade is required. We present our findings under the following headings:
-
•
Section 2 - using queueing theory for flow-based analysis of a backbone
-
•
Section 3 discusses three states of network on flow level
-
•
Section 4 - a test for network quality
-
•
Section 5 - results from experiments conducted in the real ISP’s
-
•
Section 6 describes techniques of comparison of a communication quality in the large networks.
2 The Flow Based Model
In this paper we present traffic as a stationary process, using the results from the papers of Barakat et al [3] and Ben Fredj et al [4]. They proposed a traffic model for uncongested backbone links that is simple enough to be used in network operations and engineering. The model of Barakat et al relies on Poisson shot-noise. With only 3 parameters (, arrival rate of flows, , average size of a flow, and , average value for the ratio of the square of a flow size and its duration), the model provides approximations for the average of the total rate (the throughput) on a backbone link and for its variations at short timescales. The model is designed to be general so that it can be easily used without any constraints from the definition of flows, or on the application or the transport protocol. In summary, this model allows us to completely characterize the data rate on a backbone link based on the following inputs:
-
•
Session arrivals in any period where the traffic intensity is approximately constant are accurately modelled by a homogeneous Poisson process of finite rate . The measurements of Barakat et al [3] showed that the arrival rate remains pretty constant for at least a 30 minute interval. In general, this assumption can be relaxed to more general processes such as MAPs (Markov Arrival Processes) [1], or non homogeneous Poisson processes, but we will keep working with it for simplicity of the analysis.
-
•
The distribution of flow sizes and flow durations . In this paper we denote as the arrival time of the -th flow, as its size (e.g., in bits), and as its duration (e.g., in seconds). Sequences and also form independently of each other and are identically distributed sequences.
-
•
The flow rate function (shot) is . A flow is called active at time when . Define as the rate of the -th flow at time (e.g., in bits/s), with equal to zero for and for .
Define as the total rate of data (e.g., in bits/s) on the modeled link at time . It is determined by adding the rates of the different flows. We can then write
| (1) |
The process from Eq. (1) can describe the number of active flows found at time in an queue [12], if at .
The model presented by Barakat et al [3] can compute the average and the variation of traffic on the backbone. In summary:
-
•
The average total rate of the traffic is given by the two parameters and :
(2) -
•
The variance of the total rate (i.e., burstiness of the traffic) is given by the two parameters and :
(3)
It should be mentioned that Eq. (2) is true only for the ideal case of a backbone link of unrestricted capacity, that can be applied to underloaded links. The main drawback of the ratio (2) is its lack of definite usage limits, due to the fact that variables describing the system are in no way connected with its current state. The average flow size does not depend on a specific system, it is an universal value determined by the current distribution of file sizes found in the Internet.
The arrival rate of flows describes the user’ s behaviour and doesn’ t depend on the network state and utilization. The cumulative number of flows that arrive at a link will remain linear even if the network has problems and doesn’ t satisfy all the incoming demands.
In order to describe the real network state with arbitrary load we should use Little’ s law:
| (4) |
Here is the mean duration of flow and is the mean number of active flows. Formula (4) is true [12] for any flow duration and thus for an arbitrary flow size distribution and rate limit. This formula describes the network state more precisely than Eq. (2) as the average number of active flows on the bandwidth unit increases with the utilization. In other words, the average duration of flow enables us to judge the real network state in contrast to its average value .
3 Network States on Flow Level
In order to analyze the connection quality at the backbone area or the link to the provider we are going to investigate a graphical dependence between the link utilization and the number of active flows in it [2]. These variables are easy measurable quantities in despite of average values and . The separate network state is pictured by single point on coordinate plane with axes and . The curve depicting average values has been shown in Fig. 1.
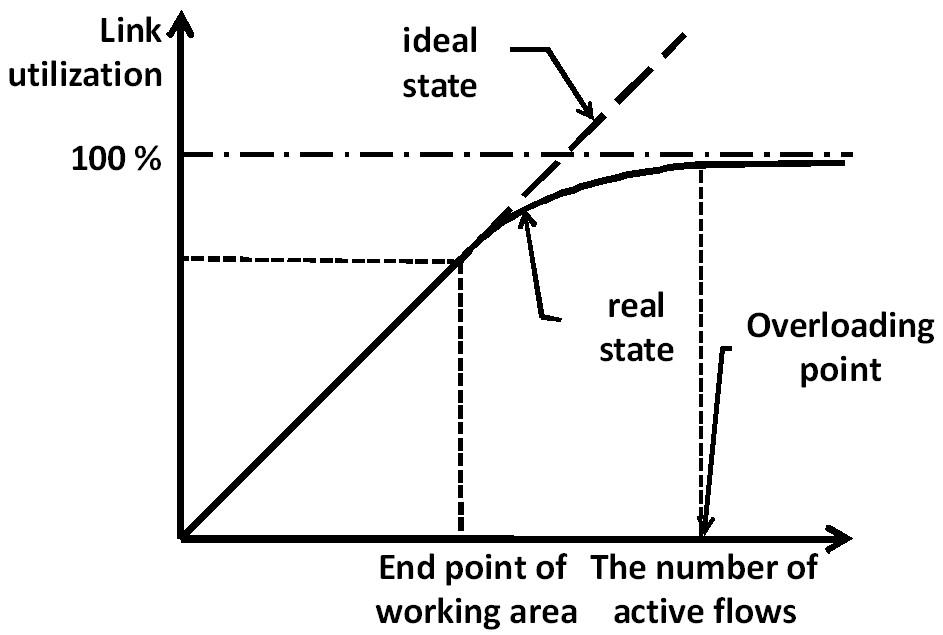
On the curve shown in Fig. 1, three parts can be identified, corresponding to the different network states. The first part of the curve describes the network state close to the ideal. If the investigated link has unrestricted capacity there should be a stable linear relationship between number of lows and link utilization . The curve describing the network behavior beyond a certain point will be convex. The linear part of the curve corresponding to the ideal network behavior is defined as the operational region. The operational region ends at the threshold point which should be found experimentally. The dislocation of this point depends on many factors, such as, transport layer protocol, network topology, the amount of buffering at the link, etc.
The second part of the curve corresponds to the moderately loaded network, when the diversion from the ideal network state becomes obvious. There is an increase in the average duration of a flow compared to the working area, and therefore, a larger number of active flows on the bandwidth unit characteristic of this network state.
The third part of the curve corresponds to the totally disabled network with considerable packet loss evident. We propose some simple preliminary models for an overloaded link, accounting for user impatience and reattempt behaviour. In a real network, if demand exceeds capacity, the number of flows in progress does not increase indefinitely. As perflow throughput decreases, some flows or sessions will be interrupted, due either to user impatience or to aborts by TCP or higher layer protocols.
In the end of this section estimation of confidence interval is given for the operational region of our curve. Since the total rate is the result of multiplexing of flows of independent rates, the Central Limit Theorem [12] tells us that the distribution of tends to Gaussian at high loads, which is typical of backbone links. As it is mentioned in Section 2, the variance of the total rate requires two parameters: the arrival rate of flows and the expectation of the ratio between the square of the size of a flow duration (see Eq. 3). It tells us that the total rate should lie between and in order to provide a required quality of service. When we talked about the required quality of service we implied the accordance of network behavior to Eq. (2), here is the -quantile of the centered and normalized total rate .
4 Testbed Setup
In order to prove our hypothesis we took measurements on border gateway routers from FREEnet, HEAnet - Ireland’s National Research and Education Network, and also from the Russian ISP “SamaraTelecom” (ST). All networks have several internal and external links. ST’s basic load lies on one channel to the Internet, whereas HEAnet and FREEnet relies on a number of connections. Measurements from Gigabit links were taken for FREEnet and 155Mbps, 622Mbps are for HEAnet and ST. The utilization of these links varies widely from 5% to 60% with a clearly identifiable busy period.
A passive monitoring system based on Cisco’s NetFlow [7] technology was used to collect link utilization values and active flow numbers in real-time. In Moscow and Samara we measured on a Cisco 7206 router with NetFlow switched on. At HEAnet a Cisco 12008 was utilized. A detailed description of Cisco NetFlow can be found in the Cisco documentation [7].
This is achieved using the following commands on the Cisco 7206:
-
•
sh ip cache flow - gives information about the number of active and inactive flows, about the parameters of the flows in the real time.
-
•
show interface summary - gives information about the current link utilization.
On a GSR Router these commands look like:
-
•
enable
-
•
attach slot-number
-
•
show ip cache flow
The FREEnet data was obtained using scripts running every 30 minutes from middle of January to the end of March 2008. The data sets from two routers of FREEnet have been collected for further analysis. The full loading of first router varies in limits of hundreds megabits per second (100-220 Mbps) and tens megabits for second router (see Fig. 5). During the tests we fixed information about any network events that could influence on connection quality. The ST data were recorded at 30-minute intervals, twenty-four hours a day for a week to discover network behavior with different loading levels. The HEAnet data was obtained using scripts running every 5 minutes for a period of 72 hours. It is quite easy to write a script, which will collect the data from the router to the management server.
5 Experimental Validation and Diagnostic of Troubleshooting
The network state at every instant describes by point on two-dimensional plot where abscise shows the number of active flow and ordinate shows router loading . Basic tasks of experimental validation of our model consist in
In order to do experimental test of our model the data set should be divided into several intervals depending on number of active flows. Inside each interval the average values and their variance were calculated for flow performances as well as for other parameters characterizing network states.
| n | , | , | , | , | |
|---|---|---|---|---|---|
| Mbps | Mbps | bps | bps | ||
| 1 | 17489 | 113.1 | 23.1 | 6784 | 1386 |
| 2 | 23260 | 126.0 | 21.4 | 5682 | 965 |
| 3 | 27007 | 152.0 | 39.2 | 5628 | 1452 |
| 4 | 34902 | 156.7 | 26.9 | 4990 | 770 |
| 5 | 45104 | 163.9 | 33.9 | 3634 | 752 |
| 6 | 55019 | 176.3 | 33.2 | 3205 | 604 |
| 7 | 64778 | 215.4 | 42.2 | 3325 | 652 |
The earlier tests have been conducted on the boundary router of the ST and HEAnet, and they didn’t allow to verify the model with high precision. The new data from FREEnet contains thousands of points describing network states.
FREEnet Data Set 1 has been divided into seven intervals according to the number of active flows (15000 - 20000, 20000 - 25000, 25000 - 30000, 30000 - 40000, 50000 - 60000, 60000). Inside each interval basic parameters characterizing active flows have been calculated and the result is represented in the Table 1. Here is the average number of active flows for the interval denoted by . describes the average router loading in Megabit per second (Mbps), and is average flow performance measured in bit per second (bps). are the standard deviation for flow performances and router loading correspondingly.
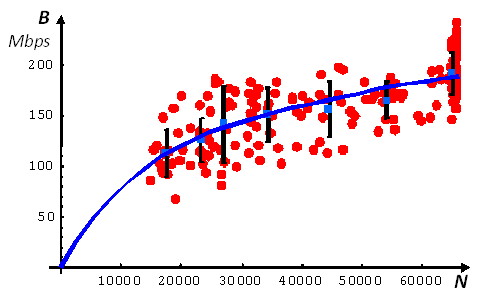
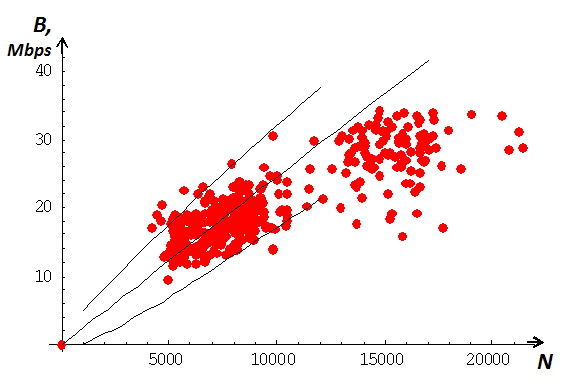
The results of the measurement for FREEnet Data Set 1 are pictured on Fig. 2. Basic curve is constructed as the line of average values, it describes network states on flow level. The error bar restricts the confidential interval for network states. Comparison with theoretical prediction from Section 3 leads to the conclusion that the area of network exploitation lies inside the operational region.
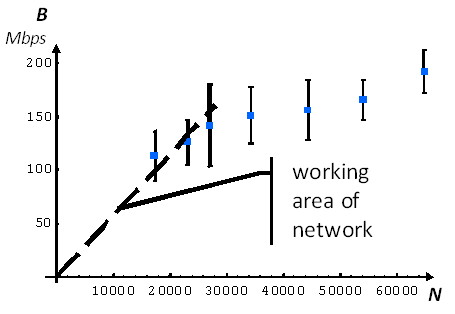
In order to restrict the operational region the straight portion of curve from Fig. 2 should be marked as it is shown on Fig. 3. The slope angle of this straight line is found as the average flow performance . Only three initial points from investigated data set may be placed in the limits of operational region. The angle of inclination gives the average flow performance equal to 5700 bps for FREEnet. If the number of flows exceeds 30000 then network gets moderately loading that leads to a reduction of the flow performance. The router loading does not increase uniformly with the number of requests, and the connection quality becomes almost twice as bad (see Table 1).
| n | , | , | , | , | |
|---|---|---|---|---|---|
| Mbps | Mbps | bps | bps | ||
| 1 | 5446 | 15.42 | 2.25 | 2843 | 413 |
| 2 | 6531 | 17.11 | 2.45 | 2364 | 377 |
| 3 | 7508 | 17.74 | 2.35 | 2364 | 313 |
| 4 | 8370 | 18.92 | 2.24 | 2261 | 268 |
| 5 | 9443 | 20.67 | 3.81 | 2190 | 404 |
| 6 | 15495 | 28.05 | 5.40 | 1811 | 349 |
In Table 2 the Data Set 2 from the second router of FREEnet with lower loading is presented. Investigated region divides into six intervals according to the number of active flows (5000 - 6000, 6000 - 7000, 7000 - 8000, 9000 - 10000, 10000). Operational region for second router of FREEnet is restricted by 10 000 active flows as it is shown in Fig. 4. Only last intervals should be excluded from straight portion of utilization curve.
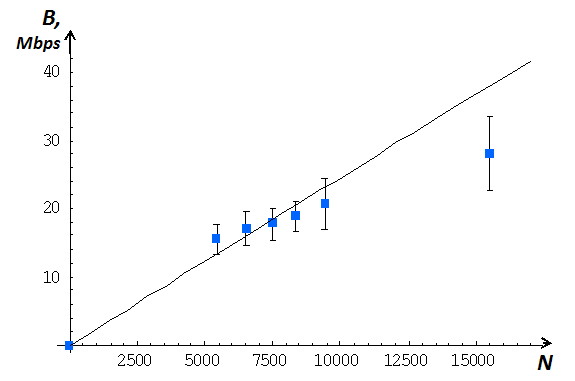
Fig. 5 illustrates the network states and the form of confidence interval for operation region with normal quantile function .
A correlation coefficient indicates the strength and direction of a linear relationship between two random variables. In order to verify the parabolic form of confidence interval the correlation coefficient between variables and should be calculated for both DataSet of FREEnet (see Tables 1 and 2). Comparing second and forth columns of mentioned Tables the values of correlation coefficient are equal 0.70 for DataSet1 and 0.93 for DataSet2. These magnitudes allow us to say about high correlation between theoretical model and its experimental examination.
A significant question concerns the numerical value for the the numerical coefficient from Eq. (5). The function can be computed using the Gaussian approximation, which gives for example . Our data from Tables 1, 2 allow calculating their magnitudes:
| (6) |
| n | for | Gaussian | Correlation |
|---|---|---|---|
| test | coefficient | ||
| 1 | not enough data | ||
| 2 | not enough data | ||
| 3 | not enough data | ||
| 4 | 3.49 (9.49) | 0.70 | |
| 5 | not enough data | ||
| 6 | 3.45 (7.81) | ||
| 7 | 0.50 (9.49) |
Significant assumption underlies a theoretical model that distribution of flow performances may be considered as Gaussian distribution. The number of testing network states inside many intervals from Tables 1, 2 allow to check a given set for similarity to the normal distribution. Here we use the Pearson test and the results of this test could be found in Tables 3 and 4. Column 2 shows the value of for , in round brackets it is shown Table values for . It should be noted that all investigated intervals with sufficient number of states discover the normal type of distribution.
| n | for | Gaussian | Correlation |
|---|---|---|---|
| test | coefficient | ||
| 1 | 9.15 (12.6) | ||
| 2 | 10.0 (11.1) | ||
| 3 | 3.24 (14.1) | 0.93 | |
| 4 | 10.0 (14.1) | ||
| 5 | not enough data | ||
| 6 | 1.94 (14.1) |
In conclusion of this Section it should be noted that expression (5) allows formulating the easy rule how to display the network defects. If two consistent measurements running every 5(30) minutes give the deviation of real network states from the confidence interval with then network problem has been detected. Confidence interval is described by flow performance and the values which may be found only as result of data processing. Unfortunately, the corresponding software is not completed yet.
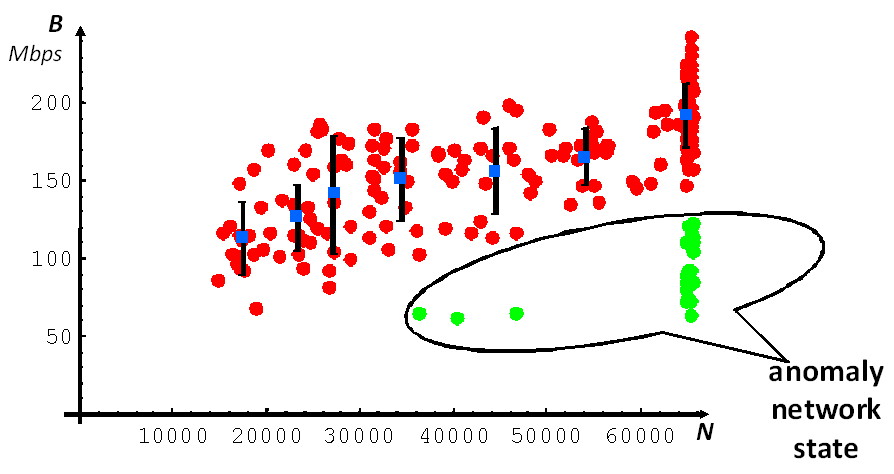
This rule received an apt illustration during FREEnet network testing. A network incident has been detected: a wide links to large FTP server has been temporally turned down. These anomaly network states departure the confidence interval corresponding to standard behavior of investigated network and form separate cluster as it has shown on Fig. 6.
So our model receives the experimental confirmation and the diagnostic method based on introduction of confidence interval may be applied to network monitoring.
6 Parameters of Comparative Studies
During experiments it has been noticed that the average flow performances in investigated networks are considerable different.
For different Russian networks this parameter varies from hundreds bps to tens Kbps, for regional network it exceeds 2Kbps very seldom. For comparison, the mean flow performance in HEAnet differs on almost one order and equals 15000 bps that allows them to provide high speed video applications through public network. In other words the investigated Russian network needs expanding bandwidth of trunk links, especially those ones that connect remote regions. It is problem number one for Russian Networks for Science and Education.
The idea evolved to apply our model for comparative analysis of large networks or data-center connectivity. The equation (5) allows us to compare the length of operation regions, mean flow performances, the width of confidence intervals, etc.
It should be noted that the curve of mean values from Fig. 2 describes the behavior of investigated network as a whole. Mean flow performance allows to judge about the quality of network services provided to single user. The calculation of active flow number has a significant feature; the flow is considered active for a long time after transmission of the last packet. Therefore the real speed of network services exceeds the value almost by one order.
From the end user’s point of view the mean flow performance is the basic universal index. Principally, this value should be considered as the basic index characterizing the quality of network services.
There is a dependence of access to high-speed Internet services and mean flow performance. For example, streaming video began possible to look at our university as soon as the given indicator has exceeded value in 10 Kbps. It is very much a rough estimate, additional researches are necessary to find boundary values of mean flow performance, necessary for introduction of this or that high-speed service. This problem in networks of cellular operators where standards of data transmission GPRS, EDGE and even 3G are not capable to give yet high speeds to an unlimited circle of clients is especially actual.
7 Conclusion
In this paper some methods are described that allow us to evaluate connection quality in large networks based on flow technology, and give an indication as to when capacity needs to be increased. At the moment we are working on developing utilities, which will make it possible to construct the dependence of link loading on the number of active flows automatically, and calculate the length of the operation region as well as coefficients for confidence interval.
The special attention has been given how by means of the constructed model to make a technique of comparison of the big networks. It has been established that as object for comparison the unique parameter - mean flow performance can act. The high-grade comparative analysis should contain the conformity table between mean flow performance and possibility of start high-speed Internet services that demands the further experiments.
This paper has demonstrated that it is possible to easily determine the confidence interval, operation region and the overload point of a network connection, utilizing low cost commodity hardware and simple software. This allows us to identify the anomaly network states and moment when a backbone upgrade is required. Further experiments are necessary in order to develop software utilities for this purpose. Thus, providing analytical generalizations, we established common terminology for processes, taking place in networks.
References
- [1] E. Altman, K. Avratchenkov, C. Barakat, A stochastic model for TCP/IP with stationary random losses, ACM SIGCOMM, September 2000
- [2] F. Afanasiev, A. Petrov, and A. Sukhov, A Flow-based analysis of Internet traffic, Russian Edition of Network Computing, 5(98) (2003) 92-95 (arXiv:cs/0306037)
- [3] C. Barakat, P. Thiran, G. Iannaccone, C. Diot, P. Owezarski P., A flow-based model for Internet backbone traffic, IEEE Transactions on Signal Processing - Special Issue on Signal Processing in Networking, vol. 51, no. 8 (2003) 2111-2124
- [4] S. Ben Fredj, T. Bonald T., A. Proutiere, G. Regnie, J. Roberts, Statistical Bandwidth Sharing: A Study of Congestion at Flow Level, ACM SIGCOMM, August 2001
- [5] N. Brownlee, C. Mills, G. Ruth, Traffic Flow Measurement: Architecture (RFC 2722), October 1999
- [6] Y. Chabchoub, C. Fricker, F. Guillemin, and P. Robert, A Study of Flow Statistics of IP Traffic with Application to Sampling, Lecture Notes in Computer Science, 4516 (2007) 678-689
- [7] Cisco IOS NetFlow site, Cisco Systems, http://www.cisco.com/go/netflow/
- [8] L. Deri, nProbe: an Open Source NetFlow Probe for Gigabit Networks, TERENA 2003
- [9] C. Fraleigh, F. Tobagi, C. Diot, Provisioning IP Backbone Networks to Support Latency Sensitive Traffic, INFOCOM, Volume: 1 (2003) 375-385
- [10] R. Lippmann, J. Haines, D. Fried, J. Korba and K. Das, The 1999 DARPA off-line intrusion detection evaluation, Computer Networks, 34(4) (2000) 579-595
- [11] Y. Jiang, P. Emstad, A. Nevin, V. Nicola, and M. Fidler, Measurement based admission control for a flow-aware network, in Next Generation Internet Networks, (2005) 318 325.
- [12] L. Kleinrock, Queueing Systems, Wiley, NY, 1975, Vol. I: Theory
- [13] A. Kortebi, L. Muscariello, S. Oueslati, and J. Roberts, Minimizing the overhead in implementing flow-aware networking, in ANCS 05: Proceedings of the 2005 symposium on Architecture for networking and communications systems. New York, NY, USA: ACM Press (2005) 153 162
- [14] NSS Group, Intrusion Detection Systems Group Test (Edition 4), NSS Group, 2004
- [15] S. Oueslati and J. Roberts, A new direction for quality of service: Flow aware networking, in Next Generation Internet Networks (2005) 226-232
- [16] K. Papagiannaki, N. Taft, Z.-L Zhang, C. Diot, Long-Term Forecasting of Internet Backbone Traffic: Observations and Initial Models, INFOCOM 2003
- [17] W. Yang W., J. Gong, W. Ding, X. Wu, Network Traffic Emulation for IDS Evaluation, IFIP International Conference on Network and Parallel Computing, ISBN: 978-0-7695-2943-1 (2007) 608-612