Advancing Abductive Reasoning in Knowledge Graphs through
Complex Logical Hypothesis Generation
Abstract
Abductive reasoning is the process of making educated guesses to provide explanations for observations. Although many applications require the use of knowledge for explanations, the utilization of abductive reasoning in conjunction with structured knowledge, such as a knowledge graph, remains largely unexplored. To fill this gap, this paper introduces the task of complex logical hypothesis generation, as an initial step towards abductive logical reasoning with KG. In this task, we aim to generate a complex logical hypothesis so that it can explain a set of observations. We find that the supervised trained generative model can generate logical hypotheses that are structurally closer to the reference hypothesis. However, when generalized to unseen observations, this training objective does not guarantee better hypothesis generation. To address this, we introduce the Reinforcement Learning from Knowledge Graph (RLF-KG) method, which minimizes differences between observations and conclusions drawn from generated hypotheses according to the KG. Experiments show that, with RLF-KG’s assistance, the generated hypotheses provide better explanations, and achieve state-of-the-art results on three widely used KGs.111https://github.com/HKUST-KnowComp/AbductiveKGR
1 Introduction
Abductive reasoning plays a vital role in generating explanatory hypotheses for observed phenomena across various research domains (Haig, 2012). It is a powerful tool with wide-ranging applications. For example, in cognitive neuroscience, reverse inference (Calzavarini and Cevolani, 2022), which is a form of abductive reasoning, is crucial for inferring the underlying cognitive processes based on observed brain activation patterns. Similarly, in clinical diagnostics, abductive reasoning is recognized as a key approach for studying cause-and-effect relationships (Martini, 2023). Moreover, abductive reasoning is fundamental to the process of hypothesis generation in humans, animals, and computational machines (Magnani, 2023). Its significance extends beyond these specific applications and encompasses diverse fields of study. In this paper, we are focused on abductive reasoning with structured knowledge, specifically, a knowledge graph.
A typical knowledge graph (KG) stores information about entities, like people, places, items, and their relations in graph structures. Meanwhile, KG reasoning is the process that leverages knowledge graphs to infer or derive new information (Zhang et al., 2021a, 2022; Ji et al., 2022). In recent years, various logical reasoning tasks are proposed over knowledge graph, for example, answering complex queries expressed in logical structure (Hamilton et al., 2018; Ren and Leskovec, 2020), or conducting logical rule mining (Galárraga et al., 2015; Ho et al., 2018; Meilicke et al., 2019).
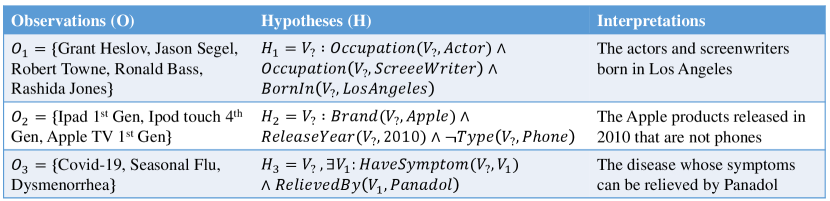
However, the abductive perspective of KG reasoning is crucial yet unexplored. Consider the first example in Figure 1, where observation depicts five celebrities followed by a user on a social media platform. The social network service provider is interested in using structured knowledge to explain the users’ observed behavior. By leveraging a knowledge graph like Freebase (Bollacker et al., 2008), which contains basic information about these individuals, a complex logical hypothesis can be derived suggesting that they are all actors and screenwriters born in Los Angeles. In the second example from Figure 1, related to a user’s interactions on an e-commerce platform (), the structured hypothesis can explain the user’s interest in products released in excluding . The third example, dealing with medical diagnostics, presents three diseases (). The corresponding hypothesis indicates they are diseases with symptom , and can be relieved by . From a general perspective, these problems illustrate how abductive reasoning with knowledge graphs seeks hypotheses that best explain given observations (Josephson and Josephson, 1996; Thagard and Shelley, 1997).
A straightforward approach to tackle this reasoning task is to employ a search-based method to explore potential hypotheses based on the given observation. However, this approach faces two significant challenges. The first challenge arises from the incompleteness of knowledge graphs (KGs), as searching-based methods heavily rely on the availability of complete information. In practice, missing edges in KGs can negatively impact the performance of search-based methods (Ren and Leskovec, 2020). The second challenge stems from the complexity of logically structured hypotheses. The search space for search-based methods becomes exponentially large when dealing with combinatorial numbers of candidate hypotheses. Consequently, the search-based method struggles to effectively and efficiently handle observations that require complex hypotheses for explanation.
To overcome these challenges, we propose a solution that leverages generative models within a supervised learning framework to generate logical hypotheses for given observations. Our approach involves sampling hypothesis-observation pairs from observed knowledge graphs (Ren et al., 2020; Bai et al., 2023d) and training a transformer-based generative model (Vaswani et al., 2017) using the teacher-forcing method. However, a potential limitation of supervised training is that it primarily captures structural similarities, without necessarily guaranteeing improved explanations when applied to unseen observations. To address this, we introduce a technique called Reinforcement Learning from the Knowledge Graph (RLF-KG). It utilizes proximal policy optimization (PPO) (Schulman et al., 2017) to minimize the discrepancy between the observed evidence and the conclusion derived from the generated hypothesis. By incorporating reinforcement learning techniques, our approach aims to directly improve the explanatory capability of the generated hypotheses and ensure their effectiveness when generalized to unseen observations.
We evaluate the proposed methods for effectiveness and efficiency on three knowledge graphs: FB15k-237 (Toutanova and Chen, 2015), WN18RR (Toutanova and Chen, 2015), and DBpedia50 (Shi and Weninger, 2018). The results consistently demonstrate the superiority of our approach over supervised generation baselines and search-based methods, as measured by two evaluation metrics across all three datasets. Our contributions can be summarized as follows:
-
•
We introduce the task of complex logical hypothesis generation, which aims to identify logical hypotheses that best explain a given set of observations. This task can be seen as a form of abductive reasoning with KGs.
-
•
To address the challenges posed by the incompleteness of knowledge graphs and the complexity of logical hypotheses, we propose a generation-based method. This approach effectively handles these difficulties and enhances the quality of generated hypotheses.
-
•
Additionally, we developed the Reinforcement Learning from the Knowledge Graph (RLF-KG) technique. By incorporating feedback from the knowledge graph, RLF-KG further improves the hypothesis generation model. It minimizes the discrepancies between the observations and the conclusions of the generated hypotheses, leading to more accurate and reliable results.
2 Problem Formulation
In this task, a knowledge graph is denoted as , where is the set of vertices and is the set of relation types. Each relation type is a function , with indicating the existence of a directed from vertex to vertex of type in the graph , and otherwise.
We adopt the open-world assumption of knowledge graphs (Drummond and Shearer, 2006), treating missing edges as unknown rather than false. The reasoning model can only access the observed KG , while the true KG is hidden and encompasses the observed graph .
Abductive reasoning is a type of logical reasoning that involves making educated guesses to infer the most likely reasons for the observations (Josephson and Josephson, 1996; Thagard and Shelley, 1997). For further details on the distinctions between abductive, deductive, and inductive reasoning, refer to Appendix A. In this work, we focus on a specific abductive reasoning type in the context of knowledge graphs. We first introduce some concepts in this context.
An observation is a set of entities in . A logical hypothesis on a graph is defined as a predicate of a variable vertex in first-order logical form, including existential quantifiers, AND (), OR (), and NOT (). The hypothesis can always be written in disjunctive normal form,
| (1) | ||||
| (2) |
where each can take the forms: , , , , where represents a fixed vertex, the represent variable vertices in , and is a relation type.
The subscript denotes that the hypothesis is formulated based on the given graph . This means that all entities and relations in the hypothesis must exist in , and the domain for variable vertices is the entity set of . For example, please refer to Appendix B. The same hypothesis can be applied to a different knowledge graph, , provided that includes the entities and edges present in . When the context is clear or the hypothesis pertains to a general statement applicable to multiple knowledge graphs (e.g., observed and hidden graphs), the symbol is used without the subscript.
Nodes Actions Stack 1 [I] 1 2 [I] 1,2 3 [Brand] 1,2,3 4 [Apple] 1,2,3,4 1,2 5 [Release] 1,2,5 6 [2010] 1,2,5,6 1 7 [N] 1,7 8 [Type] 1,7,8 9 [Phone] 1,7,8,9 empty Tokens: [I][I][Brand][Apple] [Release][2010][N][Type][Phone]
The conclusion of the hypothesis on a graph , denoted by , is the set of entities for which holds true on :
| (3) |
Suppose represents an observation, is the observed graph, and is the hidden graph. Then abductive reasoning in knowledge graphs aims to find the hypothesis on whose conclusion on the hidden graph , , is most similar to . Formally, the similarity is quantified using the Jaccard index, defined as:
| (4) |
In other words, the goal is to find a hypothesis that maximizes .
3 Hypothesis Generation with RLF-KG
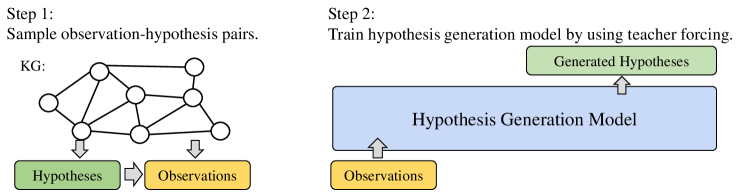
Our methodology, referred to as reinforcement learning from the knowledge graph (RLF-KG), is depicted in Fig. 4 and involves the following steps: (1) Randomly sample observation-hypothesis pairs from the knowledge graph. (2) Train a generative model to generate hypotheses from observations using the pairs. (3) Enhance the generative model using RLF-KG, leveraging reinforcement learning to minimize discrepancies between observations and generated hypotheses.
3.1 Sampling Observation-Hypothesis Pairs
In the first step, we randomly sample hypotheses from the observed training knowledge graph. This process starts by randomly selecting a hypothesis, followed by conducting a graph search on the training graph to derive its conclusion, which is then treated as the observation corresponding to the hypothesis. Details of the hypothesis sampling algorithm are provided in Appendix D.
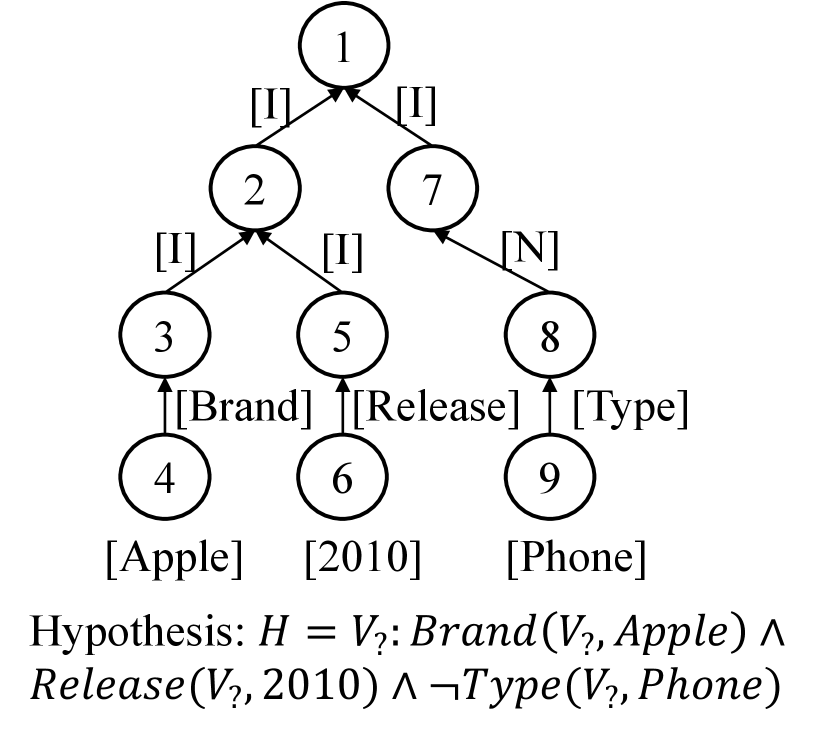
Then, we convert both hypotheses and observations into sequences suitable for the generative models. For observations, we standardize the order of the elements, ensuring that permutations of the same observation set yield identical outputs. Each entity in an observation is represented as a unique token, such as [Apple] and [Phone], as shown in Figure 2, and is associated with an embedding.
Since each hypothesis can be represented as a directed acyclic graph, for hypotheses, we use a representation inspired by action-based parsing, similar to approaches seen in other logical reasoning studies (Hamilton et al., 2018; Ren and Leskovec, 2020; Ren et al., 2020). This involves utilizing a depth-first search algorithm, described in Appendix D, to generate a sequence of actions that represents the content and structure of the graph. Logical operations such as intersection, union, and negation are denoted by special tokens [I], [U], and [N] respectively, following prior work (Bai et al., 2023d). Relations and entities are similarly treated as unique tokens, for example, [Brand] and [Apple].
Furthermore, Algorithm 3 facilitates the reconstruction of a graph from an action sequence, serving as the detokenization process for hypotheses.
3.2 Supervised Training of Hypothesis Generation Model
In the second step, we train a generative model using the sampled pairs. Let represent the token sequences for observations, and for hypotheses. The loss for the generative model on this example is based on the standard sequence modeling loss:
| (5) | ||||
| (6) |
We utilize a standard transformer to implement the conditional generative model, employing two distinct approaches. The first approach follows the encoder-decoder architecture as described by Vaswani et al. (2017), where observation tokens are fed into the transformer encoder, and the shifted hypothesis tokens are input into the transformer decoder. The second approach involves concatenating the observation and hypothesis tokens and using a decoder-only transformer to generate hypotheses. Following the setup of these architectures, we train the model using supervised training techniques.
3.3 Reinforcement Learning from Knowledge Graph Feedback (RLF-KG)
During the supervised training process, the model learns to generate hypotheses that have similar structures to reference hypotheses. However, higher structural similarity towards reference answers does not necessarily guarantee the ability to generate logical explanations, especially when encountering unseen observations during training.
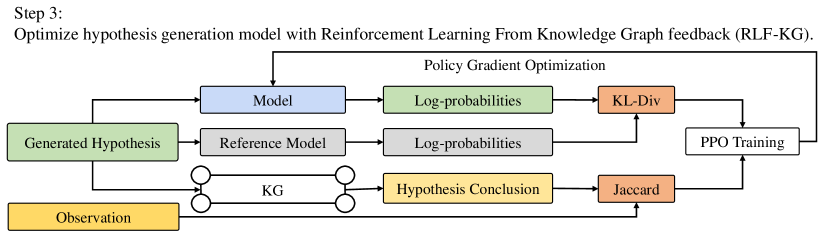
To address this limitation, in the third step, we employ reinforcement learning (Ziegler et al., 2020) in conjunction with knowledge graph feedback (RLF-KG) to enhance the trained conditional generation model . Let represents the observed training graph, the hypothesis token sequence, the observation token sequence, and the corresponding hypothesis and observation, respectively. We select the reward to be the Jaccard similarity between and and the conclusion , which is a reliable and information leakage-free approximation for the objective of the abductive reasoning task in Equation 4. Formally, the reward function is defined as
| (7) |
Following Ziegler et al. (2020), we treat the trained model obtained from supervised training as the reference model, and initialize the model to be optimized with . Then, we modify the reward function by incorporating a KL divergence penalty. This modification aims to discourage the model from generating hypotheses that deviate excessively from the reference model.
To train the model , we employ the proximal policy optimization (PPO) algorithm (Schulman et al., 2017). The objective is to maximize the expected modified reward, given as follows:
| (8) |
where the is training observation distribution and is the conditional distribution of on modeled by the model . By utilizing PPO and the modified reward function, we can effectively guide the model towards generating hypotheses that strike a balance between the similarity to the reference model and logical coherence.
4 Experiment
| Dataset | Relations | Entities | Training | Validation | Testing | All Edges |
|---|---|---|---|---|---|---|
| FB15k-237 | 237 | 14,505 | 496,126 | 62,016 | 62,016 | 620,158 |
| WN18RR | 11 | 40,559 | 148,132 | 18,516 | 18,516 | 185,164 |
| DBpedia50 | 351 | 24,624 | 55,074 | 6,884 | 6,884 | 68,842 |
We utilize three distinct knowledge graphs, namely FB15k-237 (Toutanova and Chen, 2015), DBpedia50 (Shi and Weninger, 2018), and WN18RR (Toutanova and Chen, 2015), for our experiments. Table 1 provides an overview of the number of training, evaluation, and testing edges, as well as the total number of nodes in each knowledge graph. To ensure consistency, we randomly partition the edges of these knowledge graphs into three sets - training, validation, and testing - using an 8:1:1 ratio. Consequently, we construct the training graph , validation graph , and testing graph by including the corresponding edges: training edges only, training + validation edges, and training + validation + testing edges, respectively.
Following the methodology outlined in Section 3.2, we proceed to sample pairs of observations and hypotheses. To ensure the quality and diversity of the samples, we impose certain constraints during the sampling process. Firstly, we restrict the size of the observation sets to a maximum of thirty-two elements. This limitation is enforced ensuring that the observations remain manageable. Additionally, specific constraints are applied to the validation and testing hypotheses. Each validation hypothesis must incorporate additional entities in the conclusion compared to the training graph, while each testing hypothesis must have additional entities in the conclusion compared to the validation graph. This progressive increase in entity complexity ensures a challenging evaluation setting. The statistics of queries sampled for datasets are detailed in Appendix C.
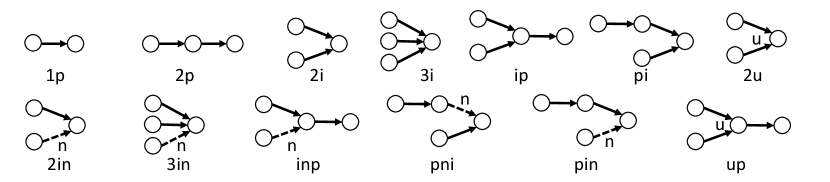
In line with previous work on KG reasoning (Ren and Leskovec, 2020; Ren et al., 2020), we utilize thirteen pre-defined logical patterns to sample the hypotheses. Eight of these patterns, known as existential positive first-order (EPFO) hypotheses (1p/2p/2u/3i/ip/up/2i/pi), do not involve negations. The remaining five patterns are negation hypotheses (2in/3in/inp/pni/pin), which incorporate negations. It is important to note that the generated hypotheses may or may not match the type of the reference hypothesis. The structures of the hypotheses are visually presented in Figure 5, and the corresponding numbers of samples drawn for each hypothesis type can be found in Table 5.
4.1 Evaluation Metric
Jaccard Index
The quality of the generated hypothesis is primarily measured using the Jaccard index same as that defined for abductive reasoning in Section 2, but we treat the constructed test graph as the hidden graph. It is important to note that the test graph contains ten percent of edges that were not observed during the training or validation stages. Formally, given an observation and a generated hypothesis , we employ a graph search algorithm to determine the conclusion of on , denoted as . Then the Jaccard metric for evaluation is defined as
| (9) |
quantifing the similarity between the conclusion and the observation .
Smatch Score
Smatch (Cai and Knight, 2013) is originally designed for comparing semantic graphs but has been recognized as a suitable metric for evaluating complex logical queries, which can be treated as a specialized form of semantic graphs (Bai et al., 2023d). In this task, a hypothesis can be represented as a graph, e.g. Fig. 2, and we can transform it to be compatible with the semantic graph format. The detailed computation of the Smatch score on hypothesis graphs is described in detail in Appendix F. Intuitively, the Smatch score between the generated hypothesis and the reference hypothesis , denoted as , quantifies the structural resemblance between the graphs corresponding to and i.e., how much the nodes, edges, and the labels on them look the same between the two graphs.
| Dataset | Model | 1p | 2p | 2i | 3i | ip | pi | 2u | up | 2in | 3in | pni | pin | inp | Ave. |
|---|---|---|---|---|---|---|---|---|---|---|---|---|---|---|---|
| FB15k-237 | Encoder-Decoder | 0.626 | 0.617 | 0.551 | 0.513 | 0.576 | 0.493 | 0.818 | 0.613 | 0.532 | 0.451 | 0.499 | 0.529 | 0.533 | 0.565 |
| + RLF-KG | 0.855 | 0.711 | 0.661 | 0.595 | 0.715 | 0.608 | 0.776 | 0.698 | 0.670 | 0.530 | 0.617 | 0.590 | 0.637 | 0.666 | |
| Decoder-Only | 0.666 | 0.643 | 0.593 | 0.554 | 0.612 | 0.533 | 0.807 | 0.638 | 0.588 | 0.503 | 0.549 | 0.559 | 0.564 | 0.601 | |
| + RLF-KG | 0.789 | 0.681 | 0.656 | 0.605 | 0.683 | 0.600 | 0.817 | 0.672 | 0.672 | 0.560 | 0.627 | 0.596 | 0.626 | 0.660 | |
| WN18RR | Encoder-Decoder | 0.793 | 0.734 | 0.692 | 0.692 | 0.797 | 0.627 | 0.763 | 0.690 | 0.707 | 0.694 | 0.704 | 0.653 | 0.664 | 0.708 |
| + RLF-KG | 0.850 | 0.778 | 0.765 | 0.763 | 0.854 | 0.685 | 0.767 | 0.719 | 0.743 | 0.732 | 0.738 | 0.682 | 0.710 | 0.753 | |
| Decoder-Only | 0.760 | 0.734 | 0.680 | 0.684 | 0.770 | 0.614 | 0.725 | 0.650 | 0.683 | 0.672 | 0.688 | 0.660 | 0.677 | 0.692 | |
| + RLF-KG | 0.821 | 0.760 | 0.694 | 0.693 | 0.827 | 0.656 | 0.770 | 0.680 | 0.717 | 0.704 | 0.720 | 0.676 | 0.721 | 0.726 | |
| DBpedia50 | Encoder-Decoder | 0.706 | 0.657 | 0.551 | 0.570 | 0.720 | 0.583 | 0.632 | 0.636 | 0.602 | 0.572 | 0.668 | 0.625 | 0.636 | 0.627 |
| + RLF-KG | 0.842 | 0.768 | 0.636 | 0.639 | 0.860 | 0.667 | 0.714 | 0.758 | 0.699 | 0.661 | 0.775 | 0.716 | 0.769 | 0.731 | |
| Decoder-Only | 0.739 | 0.692 | 0.426 | 0.434 | 0.771 | 0.527 | 0.654 | 0.688 | 0.602 | 0.563 | 0.663 | 0.640 | 0.701 | 0.623 | |
| + RLF-KG | 0.777 | 0.701 | 0.470 | 0.475 | 0.821 | 0.534 | 0.646 | 0.702 | 0.626 | 0.575 | 0.696 | 0.626 | 0.713 | 0.643 |
4.2 Experiment Details
In this experiment, we use two transformer structures as the backbones of the generation model. For the encoder-decoder transformer structure, we use three encoder layers and three decoder layers. Each layer has eight attention heads with a hidden size of 512. Note that the positional encoding for the input observation sequence is disabled, as we believe that the order of the entities in the observation set does not matter. For the decoder-only structure, we use six layers, and the other hyperparameters are the same. In the supervised training process, we use AdamW optimizer and grid search to find hyper-parameters. For the encoder-decoder structure, the learning rate is with the resulting batch size of , , and for FB15k-237, WN18RR, and DBpedia, respectively. For the decoder-only structure, the learning rate is with batch-size of , , and for FB15k-237, WN18RR, and DBpedia respectively, and linear warming up of steps. In the reinforcement learning process, we use the dynamic adjustment of the penalty coefficient (Ouyang et al., 2022). More detailed hyperparameters are shown in Appendix I. All the experiments can be conducted on a single GPU with 24GB memory.
| FB15k-237 | WN18RR | DBpedia50 | ||||
|---|---|---|---|---|---|---|
| Jaccard | Smatch | Jaccard | Smatch | Jaccard | Smatch | |
| Encoder-Decoder | 0.565 | 0.602 | 0.708 | 0.558 | 0.627 | 0.486 |
| + RLF-KG (Jaccard) | 0.666 | 0.530 | 0.753 | 0.540 | 0.731 | 0.541 |
| + RLF-KG (Jaccard + Smatch) | 0.660 | 0.568 | 0.757 | 0.545 | 0.696 | 0.532 |
| Decoder-Only | 0.601 | 0.614 | 0.692 | 0.564 | 0.623 | 0.510 |
| + RLF-KG (Jaccard) | 0.660 | 0.598 | 0.726 | 0.518 | 0.643 | 0.492 |
| + RLF-KG (Jaccard + Smatch) | 0.656 | 0.612 | 0.713 | 0.540 | 0.645 | 0.504 |
| Method | FB15k-237 | WN18RR | DBpedia50 | ||||||
|---|---|---|---|---|---|---|---|---|---|
| Runtime | Jaccard | Smatch | Runtime | Jaccard | Smatch | Runtime | Jaccard | Smatch | |
| Brute-force Search | 16345 mins | 0.635 | 0.305 | 4084 mins | 0.742 | 0.322 | 1132 mins | 0.702 | 0.322 |
| Generation + RLF-KG | 264 mins | 0.666 | 0.530 | 32 mins | 0.753 | 0.540 | 5 mins | 0.731 | 0.541 |
4.3 Experiment Results and Discussions
We validate RLF-KG effectiveness by comparing the Jaccard metric of the model before and after this process. Table 2 displays performance across thirteen hypothesis types on FB15k-237, WN18RR, and DBpedia50. It illustrates Jaccard indices between observations and conclusions of generated hypotheses from the test graph. The encoder-decoder and the decoder-only transformers are assessed under fully supervised training on each dataset. Additionally, performance is reported when models collaborate with reinforcement learning from knowledge graph feedback (RLF-KG).
4.3.1 Performance Gain after RLF-KG
We notice RLF-KG consistently enhances hypothesis generation across three datasets, improving both encoder-decoder and decoder-only models. This can be explained by RLF-KG’s ability to incorporate knowledge graph information into the generation model, diverging from simply generating hypotheses akin to reference hypotheses.
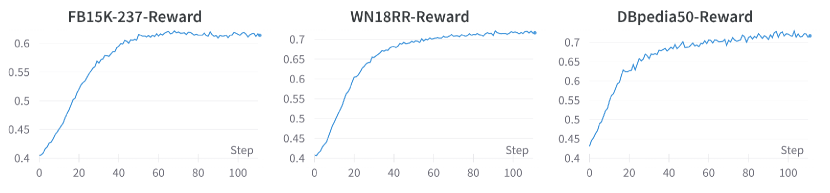
Additionally, after the RLF-KG training, the encoder-decoder model surpasses the decoder-only structured transformer model. This is due to the task’s nature, where generating a sequence of tokens from an observation set does not necessitate the order of the observation set. Figure 6 supplements the previous statement by illustrating the increasing reward throughout the PPO process. We also refer readers to Appendix K for qualitative examples demonstrating the improvement in the generated hypotheses for the same observation.
4.3.2 Adding Structural Reward to PPO
We explore the potential benefits of incorporating structural similarity into the reward function used in PPO training. While RLF-KG originally relies on the Jaccard index, we consider adding the Smatch score, a measure of structural differences between generated and sampled hypotheses. We conducted additional experiments to include as an extra term in the reward function.
The results, presented in Table 3, indicate that by incorporating the structural reward, the model can indeed generate hypotheses that are closer to the reference hypotheses yc in structural sense. However, the Jaccard scores reveal that with the inclusion of structural information, the overall performance is comparable to or slightly worse than the original reward function. This is because adding Smatch score tends to cause the generation model to fit or potentially overfit the training data according to the above graph-level similarity, limiting its ability to generalize to unseen test graphs. The Jaccard reward (Eq. 7), however, captures a measure closer to the goal of our task . Detailed Smatch scores by query types can be found in Appendix G.
4.3.3 Comparison Between Search Methods
We chose the relatively simple brute-force search (Algorithm 4) as our search-based baseline due to the inherent high complexity of search algorithms for this task. For each observation, the algorithm explores all potential 1p hypotheses within the training graph and selects the one with the highest Jaccard similarity on the training graph. Despite its simplicity and complexity linear to the number of edges, the algorithm requires significantly more time than our method, not to mention other more complex heuristics.
Following this choice, we compare inference time and performance between the generation-based and the brute-force search algorithm. Table 4 highlights the unsuitability of the brute-force search for scaling up due to its high complexity. In contrast, generation-based methods demonstrate substantially faster performance.
Moreover, the generation methods not only outperform the search-based method in Jaccard performance but also show a significant improvement in Smatch performance. The relatively high Jaccard score of the brute-force search is attributed to its inherent access to an approximation of Jaccard during the search process. Due to the nature of the graph splits, the approximation of Jaccard on the test graph using the training graph for 1p queries is found to be quite accurate, which enhances the average score. The detailed Jaccard scores are presented in Appendix H. However, the brute-force search struggles with more complex types of queries.
5 Related Work
The problem of abductive knowledge graph reasoning shares connections with various other knowledge graph reasoning tasks, including knowledge graph completion, complex logical query answering, and rule mining.
Rule Mining
Rule mining focuses on inductive logical reasoning, namely discovering logical rules over the knowledge graph. Various methods are proposed in this line of work (Galárraga et al., 2015; Ho et al., 2018; Meilicke et al., 2019; Cheng et al., 2022, 2023). While the direct application of rule mining to solve this task is theoretically applicable, rule mining algorithms such as those described by Galárraga et al. (2015) also rely on searches to construct the horn clauses, which face scalability issues.
Complex logical query
Complex logical query answering is a task of answering logically structured queries on KG. Query embedding primary focus is the enhancement of embedding structures for encoding sets of answers (Hamilton et al., 2018; Sun et al., 2020; Liu et al., 2021; Bai et al., 2023c, a, b; Hu et al., 2023; Yin et al., 2023; Wang et al., 2023a, b; Hu et al., 2024; Liu et al., 2024). For instance, Ren and Leskovec (2020) and Zhang et al. (2021b) introduce the utilization of geometric structures such as rectangles and cones within hyperspace to represent entities. Neural MLP (Mixer) (Amayuelas et al., 2022) use MLP and MLP-Mixer as the operators. Bai et al. (2022) suggests employing multiple vectors to encode queries, thereby addressing the diversity of answer entities. FuzzQE (Chen et al., 2022) uses fuzzy logic to represent logical operators. Probabilistic distributions can also serve as a means of query encoding (Choudhary et al., 2021a, b), with examples including Beta Embedding (Ren and Leskovec, 2020) and Gamma Embedding (Yang et al., 2022).
6 Conclusion
In summary, this paper has introduced the task of abductive logical knowledge graph reasoning. Meanwhile, this paper has proposed a generation-based method to address knowledge graph incompleteness and reasoning efficiency by generating logical hypotheses. Furthermore, this paper demonstrates the effectiveness of our proposed reinforcement learning from knowledge graphs (RLF-KG) to enhance our hypothesis generation model by leveraging feedback from knowledge graphs.
Limitations
Our proposed methods and techniques in the paper are evaluated on a specific set of knowledge graphs, namely FB15k-237, WN18RR, and DBpedia50. It is unclear how well these approaches would perform on other KGs with different characteristics or domains. Meanwhile, knowledge graphs can be massive and continuously evolving, our method is not yet able to address the dynamic nature of knowledge evolutions, like conducting knowledge editing automatically. It is important to note that these limitations should not undermine the significance of the work but rather serve as areas for future research and improvement.
Acknowledgements
We thank the anonymous reviewers and the area chair for their constructive comments. The authors of this paper were supported by the NSFC Fund (U20B2053) from the NSFC of China, the RIF (R6020-19 and R6021-20), and the GRF (16211520 and 16205322) from RGC of Hong Kong. We also thank the support from the UGC Research Matching Grants (RMGS20EG01-D, RMGS20CR11, RMGS20CR12, RMGS20EG19, RMGS20EG21, RMGS23CR05, RMGS23EG08).
References
- Amayuelas et al. (2022) Alfonso Amayuelas, Shuai Zhang, Susie Xi Rao, and Ce Zhang. 2022. Neural methods for logical reasoning over knowledge graphs. In The Tenth International Conference on Learning Representations, ICLR 2022, Virtual Event, April 25-29, 2022. OpenReview.net.
- Bai et al. (2023a) Jiaxin Bai, Xin Liu, Weiqi Wang, Chen Luo, and Yangqiu Song. 2023a. Complex query answering on eventuality knowledge graph with implicit logical constraints. In Advances in Neural Information Processing Systems 36: Annual Conference on Neural Information Processing Systems 2023, NeurIPS 2023, New Orleans, LA, USA, December 10 - 16, 2023.
- Bai et al. (2023b) Jiaxin Bai, Chen Luo, Zheng Li, Qingyu Yin, and Yangqiu Song. 2023b. Understanding inter-session intentions via complex logical reasoning. CoRR, abs/2312.13866.
- Bai et al. (2023c) Jiaxin Bai, Chen Luo, Zheng Li, Qingyu Yin, Bing Yin, and Yangqiu Song. 2023c. Knowledge graph reasoning over entities and numerical values. In Proceedings of the 29th ACM SIGKDD Conference on Knowledge Discovery and Data Mining, KDD 2023, Long Beach, CA, USA, August 6-10, 2023, pages 57–68. ACM.
- Bai et al. (2022) Jiaxin Bai, Zihao Wang, Hongming Zhang, and Yangqiu Song. 2022. Query2Particles: Knowledge graph reasoning with particle embeddings. In Findings of the Association for Computational Linguistics: NAACL 2022, pages 2703–2714, Seattle, United States. Association for Computational Linguistics.
- Bai et al. (2023d) Jiaxin Bai, Tianshi Zheng, and Yangqiu Song. 2023d. Sequential query encoding for complex query answering on knowledge graphs. Transactions on Machine Learning Research.
- Bollacker et al. (2008) Kurt D. Bollacker, Colin Evans, Praveen K. Paritosh, Tim Sturge, and Jamie Taylor. 2008. Freebase: a collaboratively created graph database for structuring human knowledge. In Proceedings of the ACM SIGMOD International Conference on Management of Data, SIGMOD 2008, Vancouver, BC, Canada, June 10-12, 2008, pages 1247–1250. ACM.
- Cai and Knight (2013) Shu Cai and Kevin Knight. 2013. Smatch: an evaluation metric for semantic feature structures. In Proceedings of the 51st Annual Meeting of the Association for Computational Linguistics, ACL 2013, 4-9 August 2013, Sofia, Bulgaria, Volume 2: Short Papers, pages 748–752. The Association for Computer Linguistics.
- Calzavarini and Cevolani (2022) Fabrizio Calzavarini and Gustavo Cevolani. 2022. Abductive reasoning in cognitive neuroscience: Weak and strong reverse inference. Synthese, 200(2):1–26.
- Chen et al. (2022) Xuelu Chen, Ziniu Hu, and Yizhou Sun. 2022. Fuzzy logic based logical query answering on knowledge graphs. In Thirty-Sixth AAAI Conference on Artificial Intelligence, AAAI 2022, Thirty-Fourth Conference on Innovative Applications of Artificial Intelligence, IAAI 2022, The Twelveth Symposium on Educational Advances in Artificial Intelligence, EAAI 2022 Virtual Event, February 22 - March 1, 2022, pages 3939–3948. AAAI Press.
- Cheng et al. (2023) Kewei Cheng, Nesreen K. Ahmed, and Yizhou Sun. 2023. Neural compositional rule learning for knowledge graph reasoning. In The Eleventh International Conference on Learning Representations, ICLR 2023, Kigali, Rwanda, May 1-5, 2023. OpenReview.net.
- Cheng et al. (2022) Kewei Cheng, Jiahao Liu, Wei Wang, and Yizhou Sun. 2022. Rlogic: Recursive logical rule learning from knowledge graphs. In KDD ’22: The 28th ACM SIGKDD Conference on Knowledge Discovery and Data Mining, Washington, DC, USA, August 14 - 18, 2022, pages 179–189. ACM.
- Choudhary et al. (2021a) Nurendra Choudhary, Nikhil Rao, Sumeet Katariya, Karthik Subbian, and Chandan K. Reddy. 2021a. Probabilistic entity representation model for reasoning over knowledge graphs. In Advances in Neural Information Processing Systems 34: Annual Conference on Neural Information Processing Systems 2021, NeurIPS 2021, December 6-14, 2021, virtual, pages 23440–23451.
- Choudhary et al. (2021b) Nurendra Choudhary, Nikhil Rao, Sumeet Katariya, Karthik Subbian, and Chandan K. Reddy. 2021b. Self-supervised hyperboloid representations from logical queries over knowledge graphs. In WWW ’21: The Web Conference 2021, Virtual Event / Ljubljana, Slovenia, April 19-23, 2021, pages 1373–1384. ACM / IW3C2.
- Douven (2021) Igor Douven. 2021. Abduction. In Edward N. Zalta, editor, The Stanford Encyclopedia of Philosophy, Summer 2021 edition. Metaphysics Research Lab, Stanford University.
- Drummond and Shearer (2006) Nick Drummond and Rob Shearer. 2006. The open world assumption. In eSI Workshop: The Closed World of Databases meets the Open World of the Semantic Web, volume 15, page 1.
- Galárraga et al. (2015) Luis Galárraga, Christina Teflioudi, Katja Hose, and Fabian M. Suchanek. 2015. Fast rule mining in ontological knowledge bases with AMIE+. VLDB J., 24(6):707–730.
- Haig (2012) Brian D. Haig. 2012. Abductive Learning, pages 10–12. Springer US, Boston, MA.
- Hamilton et al. (2018) William L. Hamilton, Payal Bajaj, Marinka Zitnik, Dan Jurafsky, and Jure Leskovec. 2018. Embedding logical queries on knowledge graphs. In Advances in Neural Information Processing Systems 31: Annual Conference on Neural Information Processing Systems 2018, NeurIPS 2018, December 3-8, 2018, Montréal, Canada, pages 2030–2041.
- Ho et al. (2018) Vinh Thinh Ho, Daria Stepanova, Mohamed H. Gad-Elrab, Evgeny Kharlamov, and Gerhard Weikum. 2018. Rule learning from knowledge graphs guided by embedding models. In The Semantic Web - ISWC 2018 - 17th International Semantic Web Conference, Monterey, CA, USA, October 8-12, 2018, Proceedings, Part I, volume 11136 of Lecture Notes in Computer Science, pages 72–90. Springer.
- Hu et al. (2024) Qi Hu, Weifeng Jiang, Haoran Li, Zihao Wang, Jiaxin Bai, Qianren Mao, Yangqiu Song, Lixin Fan, and Jianxin Li. 2024. Fedcqa: Answering complex queries on multi-source knowledge graphs via federated learning. CoRR, abs/2402.14609.
- Hu et al. (2023) Qi Hu, Haoran Li, Jiaxin Bai, and Yangqiu Song. 2023. Privacy-preserving neural graph databases. CoRR, abs/2312.15591.
- Ji et al. (2022) Shaoxiong Ji, Shirui Pan, Erik Cambria, Pekka Marttinen, and Philip S. Yu. 2022. A survey on knowledge graphs: Representation, acquisition, and applications. IEEE Trans. Neural Networks Learn. Syst., 33(2):494–514.
- Josephson and Josephson (1996) John R Josephson and Susan G Josephson. 1996. Abductive inference: Computation, philosophy, technology. Cambridge University Press.
- Liu et al. (2021) Lihui Liu, Boxin Du, Heng Ji, ChengXiang Zhai, and Hanghang Tong. 2021. Neural-answering logical queries on knowledge graphs. In KDD ’21: The 27th ACM SIGKDD Conference on Knowledge Discovery and Data Mining, Virtual Event, Singapore, August 14-18, 2021, pages 1087–1097. ACM.
- Liu et al. (2024) Lihui Liu, Zihao Wang, Jiaxin Bai, Yangqiu Song, and Hanghang Tong. 2024. New frontiers of knowledge graph reasoning: Recent advances and future trends. In Companion Proceedings of the ACM on Web Conference 2024, WWW 2024, Singapore, Singapore, May 13-17, 2024, pages 1294–1297. ACM.
- Magnani (2023) Lorenzo Magnani. 2023. Handbook of Abductive Cognition. Springer International Publishing.
- Martini (2023) Carlo Martini. 2023. Abductive Reasoning in Clinical Diagnostics, pages 467–479. Springer International Publishing, Cham.
- Meilicke et al. (2019) Christian Meilicke, Melisachew Wudage Chekol, Daniel Ruffinelli, and Heiner Stuckenschmidt. 2019. Anytime bottom-up rule learning for knowledge graph completion. In Proceedings of the Twenty-Eighth International Joint Conference on Artificial Intelligence, IJCAI 2019, Macao, China, August 10-16, 2019, pages 3137–3143. ijcai.org.
- Ouyang et al. (2022) Long Ouyang, Jeffrey Wu, Xu Jiang, Diogo Almeida, Carroll L. Wainwright, Pamela Mishkin, Chong Zhang, Sandhini Agarwal, Katarina Slama, Alex Ray, John Schulman, Jacob Hilton, Fraser Kelton, Luke Miller, Maddie Simens, Amanda Askell, Peter Welinder, Paul F. Christiano, Jan Leike, and Ryan Lowe. 2022. Training language models to follow instructions with human feedback. In NeurIPS.
- Ren et al. (2020) Hongyu Ren, Weihua Hu, and Jure Leskovec. 2020. Query2box: Reasoning over knowledge graphs in vector space using box embeddings. In 8th International Conference on Learning Representations, ICLR 2020, Addis Ababa, Ethiopia, April 26-30, 2020. OpenReview.net.
- Ren and Leskovec (2020) Hongyu Ren and Jure Leskovec. 2020. Beta embeddings for multi-hop logical reasoning in knowledge graphs. In Advances in Neural Information Processing Systems 33: Annual Conference on Neural Information Processing Systems 2020, NeurIPS 2020, December 6-12, 2020, virtual.
- Schulman et al. (2017) John Schulman, Filip Wolski, Prafulla Dhariwal, Alec Radford, and Oleg Klimov. 2017. Proximal Policy Optimization Algorithms. ArXiv:1707.06347 [cs].
- Shi and Weninger (2018) Baoxu Shi and Tim Weninger. 2018. Open-world knowledge graph completion. In Proceedings of the Thirty-Second AAAI Conference on Artificial Intelligence, (AAAI-18), the 30th innovative Applications of Artificial Intelligence (IAAI-18), and the 8th AAAI Symposium on Educational Advances in Artificial Intelligence (EAAI-18), New Orleans, Louisiana, USA, February 2-7, 2018, pages 1957–1964. AAAI Press.
- Sun et al. (2020) Haitian Sun, Andrew O. Arnold, Tania Bedrax-Weiss, Fernando Pereira, and William W. Cohen. 2020. Faithful embeddings for knowledge base queries. In Advances in Neural Information Processing Systems 33: Annual Conference on Neural Information Processing Systems 2020, NeurIPS 2020, December 6-12, 2020, virtual.
- Thagard and Shelley (1997) Paul Thagard and Cameron Shelley. 1997. Abductive reasoning: Logic, visual thinking, and coherence. In Logic and Scientific Methods: Volume One of the Tenth International Congress of Logic, Methodology and Philosophy of Science, Florence, August 1995, pages 413–427. Springer.
- Toutanova and Chen (2015) Kristina Toutanova and Danqi Chen. 2015. Observed versus latent features for knowledge base and text inference. In Proceedings of the 3rd Workshop on Continuous Vector Space Models and their Compositionality, CVSC 2015, Beijing, China, July 26-31, 2015, pages 57–66. Association for Computational Linguistics.
- Vaswani et al. (2017) Ashish Vaswani, Noam Shazeer, Niki Parmar, Jakob Uszkoreit, Llion Jones, Aidan N. Gomez, Lukasz Kaiser, and Illia Polosukhin. 2017. Attention is all you need. In Advances in Neural Information Processing Systems 30: Annual Conference on Neural Information Processing Systems 2017, December 4-9, 2017, Long Beach, CA, USA, pages 5998–6008.
- Wang et al. (2023a) Zihao Wang, Weizhi Fei, Hang Yin, Yangqiu Song, Ginny Y. Wong, and Simon See. 2023a. Wasserstein-fisher-rao embedding: Logical query embeddings with local comparison and global transport. In Findings of the Association for Computational Linguistics: ACL 2023, Toronto, Canada, July 9-14, 2023, pages 13679–13696. Association for Computational Linguistics.
- Wang et al. (2023b) Zihao Wang, Yangqiu Song, Ginny Y. Wong, and Simon See. 2023b. Logical message passing networks with one-hop inference on atomic formulas. In The Eleventh International Conference on Learning Representations, ICLR 2023, Kigali, Rwanda, May 1-5, 2023. OpenReview.net.
- Yang et al. (2022) Dong Yang, Peijun Qing, Yang Li, Haonan Lu, and Xiaodong Lin. 2022. Gammae: Gamma embeddings for logical queries on knowledge graphs. In Proceedings of the 2022 Conference on Empirical Methods in Natural Language Processing, EMNLP 2022, Abu Dhabi, United Arab Emirates, December 7-11, 2022, pages 745–760. Association for Computational Linguistics.
- Yin et al. (2023) Hang Yin, Zihao Wang, Weizhi Fei, and Yangqiu Song. 2023. Efo-cqa: Towards knowledge graph complex query answering beyond set operation. CoRR, abs/2307.13701.
- Zhang et al. (2021a) Jing Zhang, Bo Chen, Lingxi Zhang, Xirui Ke, and Haipeng Ding. 2021a. Neural, symbolic and neural-symbolic reasoning on knowledge graphs. AI Open, 2:14–35.
- Zhang et al. (2022) Wen Zhang, Jiaoyan Chen, Juan Li, Zezhong Xu, Jeff Z. Pan, and Huajun Chen. 2022. Knowledge graph reasoning with logics and embeddings: Survey and perspective. CoRR, abs/2202.07412.
- Zhang et al. (2021b) Zhanqiu Zhang, Jie Wang, Jiajun Chen, Shuiwang Ji, and Feng Wu. 2021b. Cone: Cone embeddings for multi-hop reasoning over knowledge graphs. In Advances in Neural Information Processing Systems 34: Annual Conference on Neural Information Processing Systems 2021, NeurIPS 2021, December 6-14, 2021, virtual, pages 19172–19183.
- Ziegler et al. (2020) Daniel M. Ziegler, Nisan Stiennon, Jeffrey Wu, Tom B. Brown, Alec Radford, Dario Amodei, Paul Christiano, and Geoffrey Irving. 2020. Fine-Tuning Language Models from Human Preferences. ArXiv:1909.08593 [cs, stat].
Appendix A Clarification on Abductive, Deductive, and Inductive Reasoning
Here we use simple syllogisms to explain the connections and differences between abductive reasoning and the other two types of reasoning, namely, deductive and inductive reasoning. In deductive reasoning, the inferred conclusion is necessarily true if the premises are true. Suppose we have a major premise : All men are mortal, a minor premise : Socrates is a man, then we can conclude that Socrates is mortal. This can also be expressed as the inference . On the other hand, abductive reasoning aims to explain an observation and is non-necessary, i.e., the inferred hypothesis is not guaranteed to be true. We also start with a premise : All cats like catching mice, and then we have some observation : Katty like catching mice. The abduction gives a simple yet most probable hypothesis : Katty is a cat, as an explanation. This can also be written as the inference . Different than deductive reasoning, the observation should be entailed by the premise and the hypotheses , which can be expressed by the implication . The other type of non-necessary reasoning is inductive reasoning, where, in contrast to the appeal to explanatory considerations in abductive reasoning, there is an appeal to observed frequencies (Douven, 2021). For instance, premises : Most Math students learn linear algebra in their first year and : Alice is a Math student infer : Alice learned linear algebra in her first year, i.e., . Note that the inference rules in the last two examples are not strictly logical implications.
It is worth mentioning that there might be different definitions or interpretations of these forms of reasoning.
Appendix B Example of Observation-Hypothesis Pair
For example, observation can be a set of name entities like , , , . Given this observation, an abductive reasoner is required to give the logical hypothesis that best explains it. For the above example, the expected hypothesis in natural language is that they are actors and screenwriters, and they are also born in Los Angeles. Mathematically, the hypothesis can be represented by a logical expression of the facts of the KG: . Although the logical expression here only contains logical conjunction AND (), we consider more general first-order logical form as defined in Section 2.
Appendix C Statistics of Queries Sampled for Datasets
Table 5 presents the numbers of queries sampled for each dataset in each stage.
| Dataset | Training Samples | Validation Samples | Testing Samples | |||
|---|---|---|---|---|---|---|
| Each Type | Total | Each Type | Total | Each Type | Total | |
| FB15k-237 | 496,126 | 6,449,638 | 62,015 | 806,195 | 62,015 | 806,195 |
| WN18RR | 148,132 | 1,925,716 | 18,516 | 240,708 | 18,516 | 240,708 |
| DBpedia50 | 55,028 | 715,364 | 6,878 | 89,414 | 6,878 | 89,414 |
Appendix D Algorithm for Sampling Observation-Hypothesis Pairs
Algorithm 1 is designed for sampling complex hypotheses from a given knowledge graph. Given a knowledge graph and a hypothesis type , the algorithm starts with a random node and proceeds to recursively construct a hypothesis that has as one of its conclusions and adheres the type . During the recursion process, the algorithm examines the last operation in the current hypothesis. If the operation is a projection, the algorithm randomly selects one of ’s in-edge . Then, the algorithm calls the recursion on node and the sub-hypothesis type of again. If the operation is an intersection, it applies recursion on the sub-hypotheses and the same node . If the operation is a union, it applies recursion on one sub-hypothesis with node and on other sub-hypotheses with an arbitrary node, as union only requires one of the sub-hypotheses to have as an answer node. The recursion stops when the current node contains an entity.
Input Knowledge graph , hypothesis type
Output Hypothesis sample
Appendix E Algorithms for Conversion between Queries and Actions
We here present the details of tokenizing the hypothesis graph (Algorithm 2), and formulating a graph according to the tokens, namely the process of de-tokenization (Algorithm 3). Inspired by the action-based semantic parsing algorithms, we view tokens as actions. It is worth noting that we employ the symbols for the hypothesis graph to differentiate it from the knowledge graph.
Input Hypothesis plan graph
Output Action sequence
Input Action sequence
Output Hypothesis plan graph
Appendix F Details of using Smatch to evaluate structural differneces of queries
Smatch Cai and Knight (2013) is an evaluation metric for Abstract Meaning Representation (AMR) graphs. An AMR graph is a directed acyclic graph with two types of nodes: variable nodes and concept nodes, and three types of edges:
-
•
Instance edges, which connect a variable node to a concept node and are labeled literally “instance”. Every variable node must have exactly one instance edge, and vice versa.
-
•
Attribute edges, which connect a variable node to a concept node and are labeled with attribute names.
-
•
Relation edges, which connect a variable node to another variable node and are labeled with relation names.
Given a predicted AMR graph and the gold AMR graph , the Smatch score of with respect to is denoted by . is obtained by finding an approximately optimal mapping between the variable nodes of the two graphs and then matching the edges of the graphs.
Our hypothesis graph is similar to the AMR graph, in:
-
•
The nodes are both categorized as fixed nodes and variable nodes
-
•
The edges can be categorized into two types: edges from a variable node to a fixed node and edges from a variable node to another variable node. And edges are labeled with names.
However, they are different in that the AMR graph requires every variable node to have instance edges, while the hypothesis graph does not.
The workaround for leveraging the Smatch score to measure the similarity between hypothesis graphs is creating an instance edge from every entity to some virtual node. Formally, given a hypothesis with hypothesis graph , we create a new hypothesis graph to accommodate the AMR settings as follows: First, we initialize . Then, create a new relation type and add a virtual node into . Finally, for every variable node , we add a relation into . Then, given a predicted hypothesis and a gold hypothesis , the Smatch score is defined as
| (10) |
Through this conversion, a variable entity of is mapped to a variable entity of if and only if is matched with . This modification does not affect the overall algorithm for finding the optimal mapping between variable nodes and hence gives a valid and consistent similarity score. However, this adds an extra point for matching between instance edges, no matter how the variable nodes are mapped.
Appendix G Detailed Smatch Scores by Query Types
| Dataset | Model | 1p | 2p | 2i | 3i | ip | pi | 2u | up | 2in | 3in | pni | pin | inp | Ave. |
|---|---|---|---|---|---|---|---|---|---|---|---|---|---|---|---|
| FB15k-237 | Enc.-Dec. | 0.342 | 0.506 | 0.595 | 0.602 | 0.570 | 0.598 | 0.850 | 0.571 | 0.652 | 0.641 | 0.650 | 0.655 | 0.599 | 0.602 |
| RLF-KG (J) | 0.721 | 0.643 | 0.562 | 0.480 | 0.364 | 0.475 | 0.769 | 0.431 | 0.543 | 0.499 | 0.513 | 0.518 | 0.370 | 0.530 | |
| RLF-KG (J+S) | 0.591 | 0.583 | 0.577 | 0.531 | 0.447 | 0.520 | 0.820 | 0.505 | 0.602 | 0.563 | 0.571 | 0.595 | 0.484 | 0.568 | |
| Dec.-Only | 0.287 | 0.481 | 0.615 | 0.623 | 0.599 | 0.626 | 0.847 | 0.574 | 0.680 | 0.656 | 0.675 | 0.677 | 0.636 | 0.614 | |
| RLF-KG (J) | 0.344 | 0.445 | 0.675 | 0.585 | 0.537 | 0.638 | 0.853 | 0.512 | 0.696 | 0.575 | 0.647 | 0.688 | 0.574 | 0.598 | |
| RLF-KG (J+S) | 0.303 | 0.380 | 0.692 | 0.607 | 0.565 | 0.671 | 0.857 | 0.506 | 0.727 | 0.600 | 0.676 | 0.734 | 0.634 | 0.612 | |
| WN18RR | Enc.-Dec. | 0.375 | 0.452 | 0.591 | 0.555 | 0.437 | 0.585 | 0.835 | 0.685 | 0.586 | 0.516 | 0.561 | 0.549 | 0.530 | 0.558 |
| RLF-KG (J) | 0.455 | 0.468 | 0.563 | 0.562 | 0.361 | 0.530 | 0.810 | 0.646 | 0.560 | 0.530 | 0.536 | 0.539 | 0.465 | 0.540 | |
| RLF-KG (J+S) | 0.443 | 0.457 | 0.565 | 0.572 | 0.366 | 0.545 | 0.814 | 0.661 | 0.541 | 0.553 | 0.532 | 0.546 | 0.491 | 0.545 | |
| Dec.-Only | 0.320 | 0.443 | 0.582 | 0.551 | 0.486 | 0.597 | 0.809 | 0.696 | 0.594 | 0.526 | 0.575 | 0.574 | 0.577 | 0.564 | |
| RLF-KG (J) | 0.400 | 0.438 | 0.566 | 0.491 | 0.403 | 0.519 | 0.839 | 0.667 | 0.547 | 0.450 | 0.497 | 0.466 | 0.450 | 0.518 | |
| RLF-KG (J+S) | 0.375 | 0.447 | 0.584 | 0.499 | 0.432 | 0.545 | 0.825 | 0.679 | 0.584 | 0.477 | 0.543 | 0.522 | 0.507 | 0.540 | |
| DBpedia50 | Enc.-Dec. | 0.345 | 0.396 | 0.570 | 0.548 | 0.344 | 0.576 | 0.712 | 0.544 | 0.474 | 0.422 | 0.477 | 0.488 | 0.428 | 0.486 |
| RLF-KG (J) | 0.461 | 0.424 | 0.634 | 0.584 | 0.361 | 0.575 | 0.809 | 0.579 | 0.584 | 0.497 | 0.544 | 0.533 | 0.454 | 0.541 | |
| RLF-KG (J+S) | 0.419 | 0.410 | 0.638 | 0.555 | 0.373 | 0.586 | 0.785 | 0.579 | 0.560 | 0.459 | 0.536 | 0.542 | 0.474 | 0.532 | |
| Dec.-Only | 0.378 | 0.408 | 0.559 | 0.526 | 0.397 | 0.568 | 0.812 | 0.626 | 0.480 | 0.414 | 0.489 | 0.494 | 0.474 | 0.510 | |
| RLF-KG (J) | 0.405 | 0.411 | 0.558 | 0.496 | 0.376 | 0.507 | 0.825 | 0.621 | 0.477 | 0.397 | 0.468 | 0.444 | 0.406 | 0.492 | |
| RLF-KG (J+S) | 0.398 | 0.415 | 0.567 | 0.497 | 0.383 | 0.533 | 0.827 | 0.630 | 0.510 | 0.420 | 0.484 | 0.457 | 0.430 | 0.504 |
| Dataset | 1p | 2p | 2i | 3i | ip | pi | 2u | up | 2in | 3in | pni | pin | inp | Ave. |
|---|---|---|---|---|---|---|---|---|---|---|---|---|---|---|
| FB15k-237 | 0.945 | 0.340 | 0.365 | 0.218 | 0.184 | 0.267 | 0.419 | 0.185 | 0.301 | 0.182 | 0.245 | 0.155 | 0.157 | 0.305 |
| WN18RR | 0.957 | 0.336 | 0.420 | 0.274 | 0.182 | 0.275 | 0.427 | 0.183 | 0.323 | 0.224 | 0.270 | 0.155 | 0.156 | 0.322 |
| DBpedia | 0.991 | 0.336 | 0.399 | 0.259 | 0.182 | 0.245 | 0.441 | 0.183 | 0.332 | 0.226 | 0.290 | 0.154 | 0.155 | 0.322 |
Appendix H Detailed Jaccard Performance of the Brute-force Search
Table 8 shows the detailed Jaccard performance of the brute-force search.
| Dataset | 1p | 2p | 2i | 3i | ip | pi | 2u | up | 2in | 3in | pni | pin | inp | Ave. |
|---|---|---|---|---|---|---|---|---|---|---|---|---|---|---|
| FB15k-237 | 0.980 | 0.563 | 0.639 | 0.563 | 0.732 | 0.633 | 0.744 | 0.585 | 0.659 | 0.479 | 0.607 | 0.464 | 0.603 | 0.635 |
| WN18RR | 0.997 | 0.622 | 0.784 | 0.776 | 0.955 | 0.666 | 0.753 | 0.605 | 0.783 | 0.757 | 0.762 | 0.540 | 0.630 | 0.741 |
| DBpedia | 0.997 | 0.705 | 0.517 | 0.517 | 0.982 | 0.461 | 0.783 | 0.754 | 0.722 | 0.658 | 0.782 | 0.544 | 0.700 | 0.702 |
Appendix I Hyperparameters of the RL Process
The PPO hyperparameters are shown in Table 9. We warm-uped the learning rate from of the peak to the peak value within the first of total iterations, followed by a decay to of the peak using a cosine schedule.
| Hyperparam. | Enc.-Dec. | Dec.-Only | ||||
|---|---|---|---|---|---|---|
| FB15k-237 | WN18RR | DBpedia50 | FB15k-237 | WN18RR | DBpedia50 | |
| Learning rate | 2.4e-5 | 3.1e-5 | 1.8e-5 | 0.8e-5 | 0.8e-5 | 0.6e-5 |
| Batch size | 16384 | 16384 | 4096 | 3072 | 2048 | 2048 |
| Minibatch size | 512 | 512 | 64 | 96 | 128 | 128 |
| Horizon | 4096 | 4096 | 4096 | 2048 | 2048 | 2048 |
Appendix J Algorithms for One-Hop Searching
We now introduce the Algorithm 4 used for searching the best one-hop hypothesis with the tail among all entities in the observation set to explain the observations.
Input Observation set
Output Hypothesis
Appendix K Case Studies
Explore Table 10, 11 and 12 for concrete examples generated by various abductive reasoning methods, namely search, generative model with supervised training, and generative model with supervised training incorporating RLF-KG.
| Sample | Interpretation | Companies operating in industries that intersect with Yahoo! but not with IBM. | |
|---|---|---|---|
| Hypothesis | The observations are the such that | ||
| Observation | EMI, | CBS_Corporation, | |
| Columbia, | GMA_Network, | ||
| Viacom, | Victor_Entertainment, | ||
| Yahoo!, | Sony_Music_Entertainment_(Japan)_Inc., | ||
| Bandai, | Toho_Co.,_Ltd., | ||
| Rank_Organisation, | The_New_York_Times_Company, | ||
| Gannett_Company, | Star_Cinema, | ||
| NBCUniversal, | TV5, | ||
| Pony_Canyon, | Avex_Trax, | ||
| The_Graham_Holdings_Company, | The_Walt_Disney_Company, | ||
| Televisa, | Metro-Goldwyn-Mayer, | ||
| Google, | Time_Warner, | ||
| Microsoft_Corporation, | Dell, | ||
| Munhwa_Broadcasting_Corporation, | News_Corporation | ||
| Searching | Interpretation | Which companies operate in media industry? | |
| Hypothesis | The observations are the such that | ||
| Conclusion | Absent: - Google, - Microsoft_Corporation, - Dell | ||
| Jaccard | 0.893 | ||
| Smatch | 0.154 | ||
| Enc.-Dec. | Interpretation | Companies operating in industries that intersect with Yahoo! but not with Microsoft Corporation. | |
| Hypothesis | The observations are the such that | ||
| Conclusion | Absent: Microsoft_Corporation | ||
| Jaccard | 0.964 | ||
| Smatch | 0.909 | ||
| + RLF-KG | Interpretation | Companies operating in industries that intersect with Yahoo! but not with Oracle Corporation. | |
| Hypothesis | The observations are the such that | ||
| Concl. | Same | ||
| Jaccard | 1.000 | ||
| Smatch | 0.909 | ||
| Sample | Interpretation | Locations that adjoin second-level divisions of the United States of America that adjoin Washtenaw County. | |
|---|---|---|---|
| Hypothesis | The observations are the such that | ||
| Observation | Jackson_County, | Macomb_County, | |
| Wayne_County, | Ingham_County | ||
| Washtenaw_County, | |||
| Searching | Interpretation | Locations that adjoin Oakland County. | |
| Hypothesis | The observations are the such that | ||
| Conclusion | Absent: - Jackson_County - Ingham_County | ||
| Jaccard | 0.600 | ||
| Smatch | 0.182 | ||
| Enc.-Dec. | Interpretation | Second-level divisions of the United States of America that adjoin locations that adjoin Oakland County. | |
| Hypothesis | The observations are the such that | ||
| Conclusion | Extra: Oakland_County Absent: Wayne_County | ||
| Jaccard | 0.667 | ||
| Smatch | 0.778 | ||
| + RLF-KG | Interpretation | Second-level divisions of the United States of America that adjoin locations contained within Michigan. | |
| Hypothesis | The observations are the such that | ||
| Conclusion | Extra: - Oakland_County - Genesee_County | ||
| Jaccard | 0.714 | ||
| Smatch | 0.778 | ||
| Ground Truth | Interpretation | Works, except for “Here ’Tis,” that have subsequent works in the jazz genre. | |
|---|---|---|---|
| Hypothesis | The observations are the such that | ||
| Observation | Deep,_Deep_Trouble, | Lee_Morgan_Sextet, | |
| Good_Dog,_Happy_Man, | Paris_Nights\/New_York_Mornings, | ||
| I_Don’t_Want_to_Be_Your_Friend, | Take_the_Box | ||
| Interior_Music, | |||
| Searching | Interpretation | Works subsequent to “Closer” (Corinne Bailey Rae song). | |
| Hypothesis | The observations are the such that | ||
| Conclusion | Only Paris_Nights\/New_York_Mornings | ||
| Jaccard | 0.143 | ||
| Smatch | 0.154 | ||
| Enc.-Dec. | Interpretation | Works, except for “Lee Morgan Sextet,” that have subsequent works in the jazz genre. | |
| Hypothesis | The observations are the such that | ||
| Conclusion | Extra: Here_’Tis Absent: Lee_Morgan_Sextet | ||
| Jaccard | 0.750 | ||
| Smatch | 0.909 | ||
| + RLF-KG | Interpretation | Works that have subsequent works in the jazz genre. | |
| Hypothesis | The observations are the such that | ||
| Conclusion | Extra: Here_’Tis | ||
| Jaccard | 0.875 | ||
| Smatch | 0.400 | ||