Air Quality in the New Delhi Metropolis under COVID-19 Lockdown
Abstract
Air pollution has been on continuous rise with increase in industrialization in metropolitan cities of the world. Several measures including strict climate laws and reduction in the number of vehicles were implemented by several nations. The COVID-19 pandemic provided a great opportunity to understand the daily human activities effect on air pollution. Majority nations restricted industrial activities and vehicular traffic to a large extent as a measure to restrict COVID-19 spread. In this paper, we analyzed the impact of such COVID19-induced lockdown on the air quality of the city of New Delhi, India. We analyzed the average concentration of common gaseous pollutants viz. sulfur dioxide (SO2), ozone (O3), nitrogen dioxide (NO2), and carbon monoxide (CO). These concentrations were obtained from the tropospheric column of Sentinel-5P (an earth observation satellite of European Space Agency) data. We observed that the city observed a significant drop in the level of atmospheric pollutant’s concentration for all the major pollutants as a result of strict lockdown measure. Such findings are also validated with pollutant data obtained from ground based monitoring stations. We observed that near-surface pollutant concentration dropped significantly by 50% for PM2.5, 71.9% for NO2, and 88% for CO, after the lockdown period. Such studies would pave the path for implementing future air pollution control measures by environmentalists.
keywords:
Sustainable Development Goals (SDG) , Lockdown , Atmospheric pollutant analysis , Time series analysis , Air quality , TROPOMI1 Introduction
Air pollution is one of the most important sustainability concerns faced by most of the developed nations of the world [1]. It is identified in the Sustainable Development Goals (SDG): Goal 3 (Good Health and Well-being) [2] and Goal 11 (Sustainable Cities and Communities) [3]. Guégana et al. in [2] discusses SDG: Goal 3 (Good Health and Well-being) and the need for integrative thinking in public and animal health for developing countries. Furthermore, Vaidya and Chatterji in [3] discuss SDG 11 and the new urban agenda for addressing global sustainability at an urban scale. The occurrences of forest fires that happen at sporadic intervals also lead to increased air pollution [4]. The recent onset of COVID-19 (C19) and its associated lockdown led to an increased awareness of this pressing issue. Jia et al. in [5] showed insignificant impact on air quality due to lockdown in Memphis, US using ground based monitoring data, in comparison to previous months. Similar observations were observed in the city of New York, US, where Zangari et al. observed that there was no significant air quality changes in New York because of the COVID-19 pandemic [6]. On the other hand, a city like Delhi, India known for severe air pollution issues showed a large contrast for noticeable observations in our study both with satellite and ground based data.
The lockdown induced by the COVID-19 pandemic observed a decrease in atmospheric pollutants around the globe. Owing to the complete halt of vehicular traffic and reduction in industrial activities, we observed a positive impact on the amount of atmospheric pollutants and the overall air quality. The lockdown because of COVID-19 pandemic has provided the environmental researchers an opportunity to analyze the atmospheric pollutants in finer scale. Bourdrel et al. in [7] attempted to provide a relationship between air quality and chronic diseases in the context of COVID-19. Similar work on the relationship between air pollution and COVID-19 infections and mortality was performed by Ali and Islam in [8]. Furthermore, Nigam et al. in [9] identified the positive effects of COVID-19 in the industrial cities of Ankleshwar and Vapi in India. They noted a massive decrease in the concentration of NO2 in the atmosphere, owing to the halt in industrial activities. Karaer in [10] analyzed the 67 Florida Counties to present the strong correlation between the drop in NO2 concentrations (from Sentinel-5p) and Vehicle Mile Traveled (VMT) estimates from cell phone mobility records. Kaloni et al. performed a systematic analysis on the impact of COVID-19 on the air pollution of Dublin city [11]. Franch-Pardo et al. in [12] provided a systematic review of 221 scientific articles published in 2020 that used spatial and GIS technologies to understand the dynamics of COVID-19. Doolette et al. investigated the atmosphere from the context of nanoparticle fertilizer in precision agriculture [13]. Such recent works reveal that there is a promising opportunity for researchers to analyze the atmospheric pollutants, in the context of COVID-19 pandemic.
In this paper, we focused our case study on the city of New Delhi in India. The primary reasons of choosing New Delhi was because this city has a historical problem of poor air quality, and therefore it provided us an opportune moment in performing such atmospheric analysis. The city of New Delhi has its long-lasting history with high pollution levels [14]. Traditionally, government introduced several measures including plying of odd and even numbered vehicles on alternative days, and introduction of CNG vehicles [15, 16]. However, there was an insignificant improvement in Air Quality Index (AQI) [17]. The AQI level stayed in severe and very poor category [18]. However, with the introduction of lockdown owing to C19 pandemic, we observed a significant improvement in AQI level, and reached the moderate category during the lockdown .
In this paper,111In the spirit of reproducible research, code used to obtain plots and results is shared at https://github.com/dkaloni/LockdownAnalysis. we discussed the impact of the lockdown induced by the C19 pandemic on the atmospheric air quality. The novel contributions of this paper are as follows:
-
1.
Systematic analysis of the impact of lockdown on air quality;
-
2.
Subjective and objective validation of improved air quality from satellite and ground-based data; and
-
3.
Release of open-source code and datasets for further benchmarking by the community.
The rest of the paper is arranged as follows. Section 2 discusses the TROPOMI instrument of Sentinel-5P data that is used for our analysis and the data format of files obtained from the sources. Section 3 discusses with the methodology used to obtain large sized satellite data and resolving it to usable form. Section 4 briefly explains the change in nitrogen dioxide over the Central India region, followed by discussion on concentration of harmful gases in the atmosphere of Delhi using satellite data. Section 5 correlate satellite data with the ground-based monitoring station data and thereby confirming our findings with regard to harmful gases. Finally, Section 6 concludes the paper and discusses the future work.
2 Air Quality Monitoring Datasets
Copernicus, an European Union’s Earth Observation Programme consists of several satellites. The Sentinel-5P is one of the Earth Orbit Polar Satellite System collecting data on trace gases concentration, climate and air quality.
2.1 TROPOMI
TROPOMI stands for TROPOspheric Monitoring Instrument and is a satellite instrument attached to Sentinel-5P to examine the air quality with the best accuracy to date [19]. TROPOMI consists of four detectors that can detect wavelength in the shortwave infrared, near-infrared, and UV–visible covering a large portion of spectrum range. TROPOMI provides the best resolution data to study concentration of gases like sulfur dioxide, nitrogen dioxide, formaldehyde, methane, ozone, carbon monoxide, and aerosols present in the atmosphere [20].
Sentinel-5P’s TROPOMI is the primary source of data for this study. It consists of two-dimensional detector collecting data in strips of Earth. Satellite moves km in the period of nearly s. Direction along the track of the satellite is km whereas along the track direction it is km.
2.2 Ground-Based Monitoring Station Data
In addition to the satellite data [21, 22], ground-based observation data can perfectly complement the satellite data in monitoring the atmospheric events. These ground-based observation data include weather stations [23], rain gauges [24], pyranometers and ground-based sky imagers [25, 26]. These ground-based observations provided us a fantastic alternative approach on the study of air quality [27, 38]. Such observations provided us a near-accurate estimate of the level of atmospheric pollutants on the surface of the earth. Therefore, we obtained a complete analysis on the effect of lockdown on the level of atmospheric pollutants — from both satellite and ground-based observation. In our study, the ground-based data was collected from ITO station of Central Pollution Control Board (CPCB).222The source of the ground-based dataset is https://app.cpcbccr.com/ccr/.
(before lockdown-I)
(on lockdown-I)
(lockdown-I lifted)
(during lockdown-II)
(during lockdown-II)
India confirmed its first confirmed case of COVID-19 on 30-Jan-2020, and thereby saw a slow growth in the number of cases during the month of February. Cases count increased sharply in the middle of the month of March, and consequently educational institutes were closed down to control the spread. Subsequently, a strict lockdown to further curtail the spread was imposed throughout the nation. The lockdown was implemented in stages. The lockdown-I was done for a single day on 22-Mar-2020 (popularly known as the janta curfew). Subsequently, the upcoming lockdown-II was imposed on 25-Mar-2020 and remained enforced till 14-Apr-2020, to curtain the spread and avoid community transmission as much as possible.
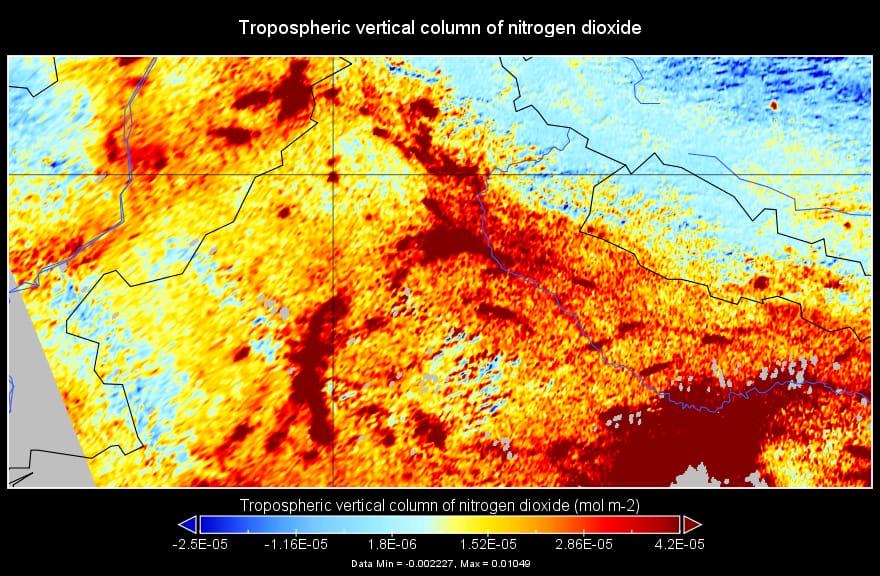
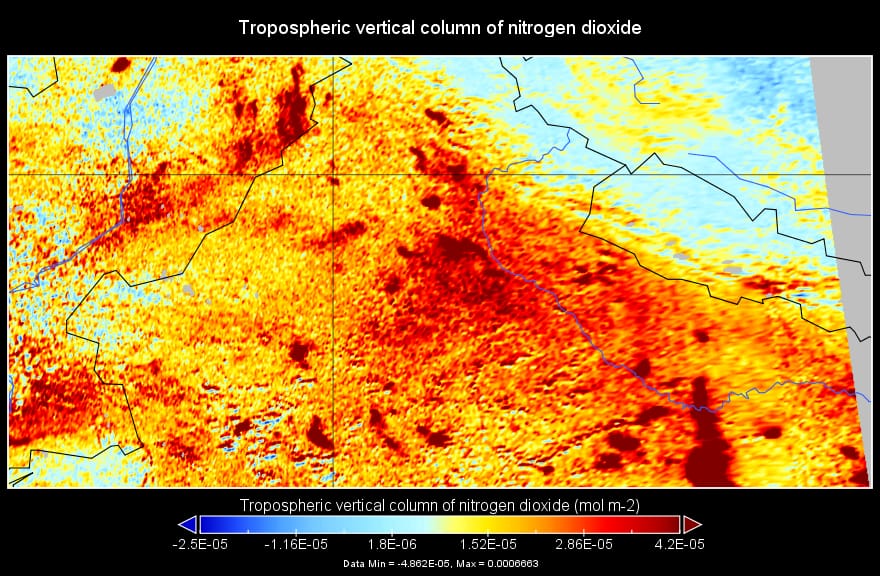
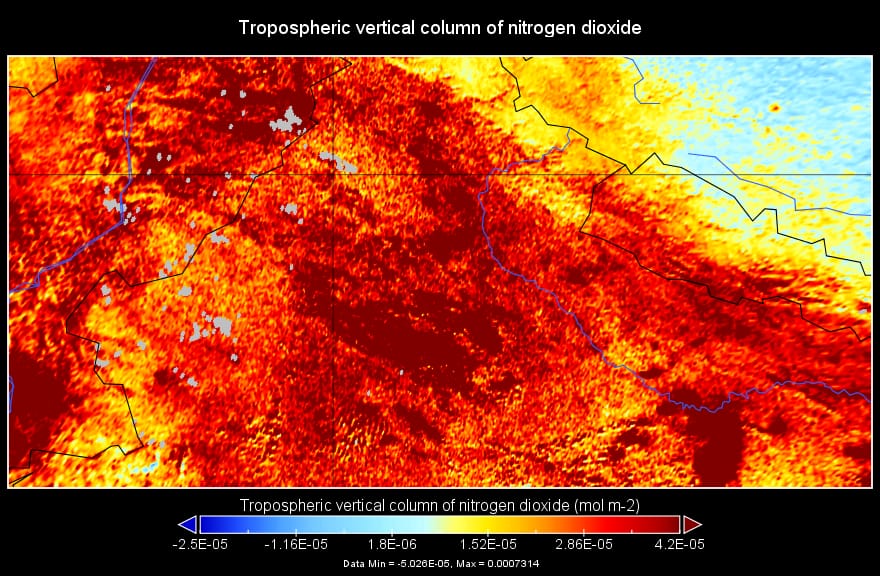
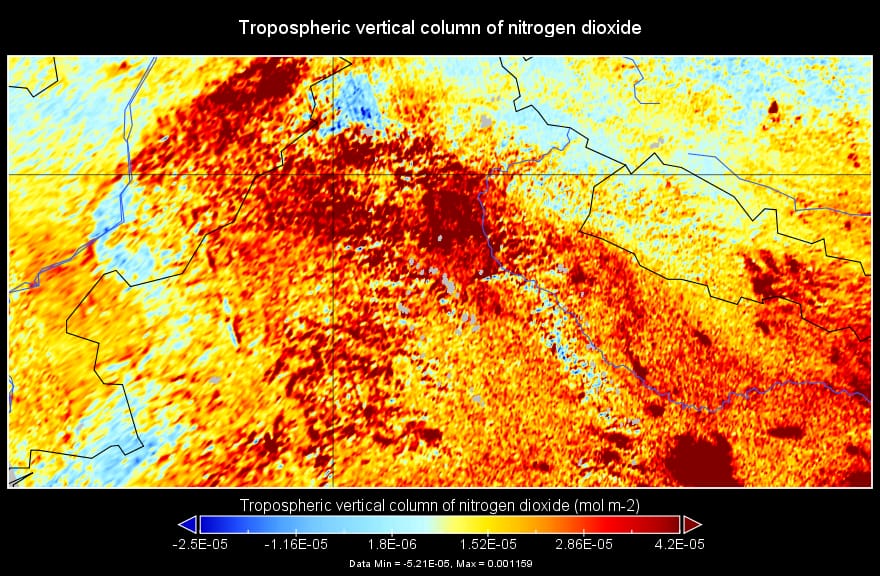
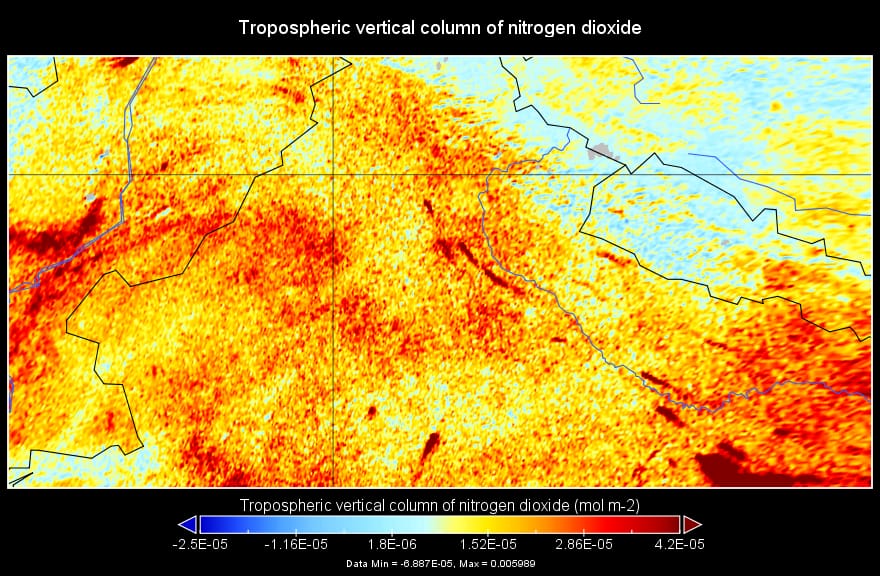
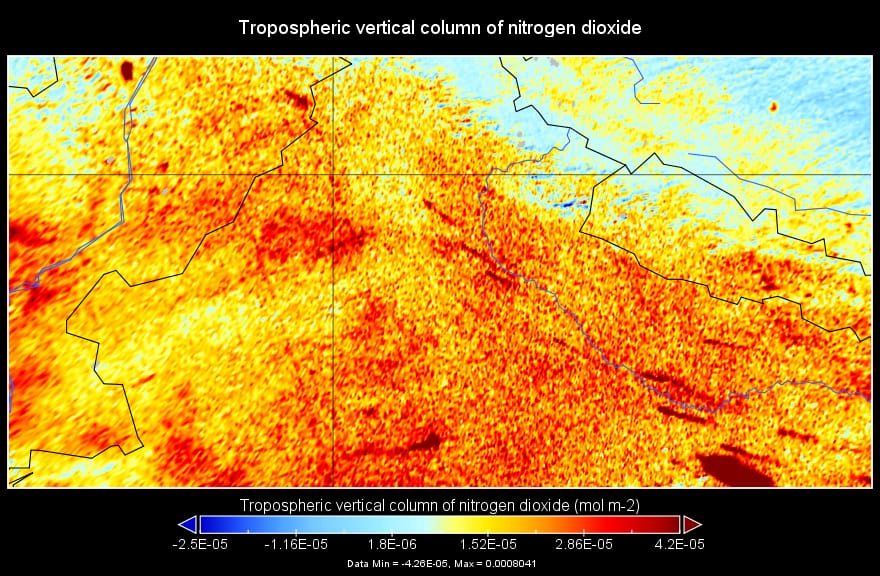
This presented a surprisingly great reduction in pollution levels, with AQI shifted to the moderate category clearly directed the effectiveness of lockdown with respect to drop in air pollution. Fig. 1 demonstrates that with complete closure of factories and vehicle movement near to zero, the environment saw a sudden drop of about 36.6% in the average nitrogen dioxide tropospheric column concentration in the atmosphere above Delhi on 22-Mar-2020. This trend in the reduction of the concentration of NO2 continued for the subsequent days as well [28]. There was a second lockdown on 25-Mar-2020, and we observed a low concentration of NO2 on 28-Mar-2020 and 29-Mar-2020, as illustrated in Fig. 1(e) and Fig. 1(f).
3 Our Approach
This study was mainly focused on Delhi and involved processing data specifically for the Delhi region. We systematically analyzed the data obtained from both satellite and ground-based observations. The data obtained from TROPOMI were stored in NetCDF format. The NetCDF stands for Network Common Data Form, and is the format of file used for multidimensional data to study atmospheric features. The Sentinel-5P data uses NetCDF files to share and store files in an array-like structure stacked together. It is generally used to share climate data and for related purposes. The NetCDF4 file contains both the data and the metadata for the product.
To subset out New Delhi from the global TROPOMI dataset, we performed a sequence of methodological steps in order to subset out the data of New Delhi from the global dataset. The selection of New Delhi region was performed by providing the range of latitude and longitude of the region. We subset out the Delhi region by providing the latitude range from to and longitude range from to . The data points included in this region of interest were thereby used for the subsequent computation of pollutant concentration. The measurements were stored and archived in individual NetCDF files. Each NetCDF file indicated the concentration of a trace gas for the selected day of the study. We then combined all the obtained files into a single file by adding a new dimension of time to the dataset for comparative study.333The NCO is a set of command line utilities used to operate NetCDF files efficiently, available at http://nco.sourceforge.net/. This combined file provided us with data points for the area spread across the time dimension.
Our obtained combined NetCDF file provided us the estimate of the average daily concentration of the various atmospheric pollutants. We processed these files to obtain the pollutant concentrations of the different pollutant gases. We replaced the NaN values of the data grid to , and thereby calculated the sum of the all the measurement values in the particular grid. We divided the resultant sum by the number of non-zero values to have a daily average for the region. This enabled us to calculate the average concentration of a particular pollutant over the selected region of New Delhi across a 15-days period. These steps were subsequently repeated for the different gases in the tropospheric column.
4 Satellite-based Pollutants Analysis
In this section, we delved further into the concentration of the individual pollutants obtained from the TROPOMI dataset. We compared the average concentration of such pollutant with that of the previous year data to quantify the improvement in the air quality.
4.1 Nitrogen Dioxide
The data used for this study is nitrogendioxide_tropospheric_column product of the file which gives the total atmospheric NO2 column between the surface and the top of the troposphere, which stands for tropospheric vertical column of nitrogen dioxide [30].
We performed the primary analysis on the subset of central India. We generate the spatial concentration maps of nitrogen dioxide (cf. Fig. 1) using panoply, a geo-referenced data viewer by NASA Goddard Institute of Space Studies. The nitrogen dioxide concentration was above average on 19-Mar-2020, which dropped significantly on 22-Mar-2020 (day of janta curfew). It noticed a sharp increase again on 23-Mar-2020 as it was a normal day, and vehicles, factories operated in full strength increasing NO2 emission in the atmosphere. However, since lockdown was again imposed from 25-Mar-2020 for 21 days, the improvement can be clearly noticed on Fig. 1(e) and Fig. 1(f). We also noticed reduction in NO2 concentration in the troposphere during the initial days of lockdown-II.
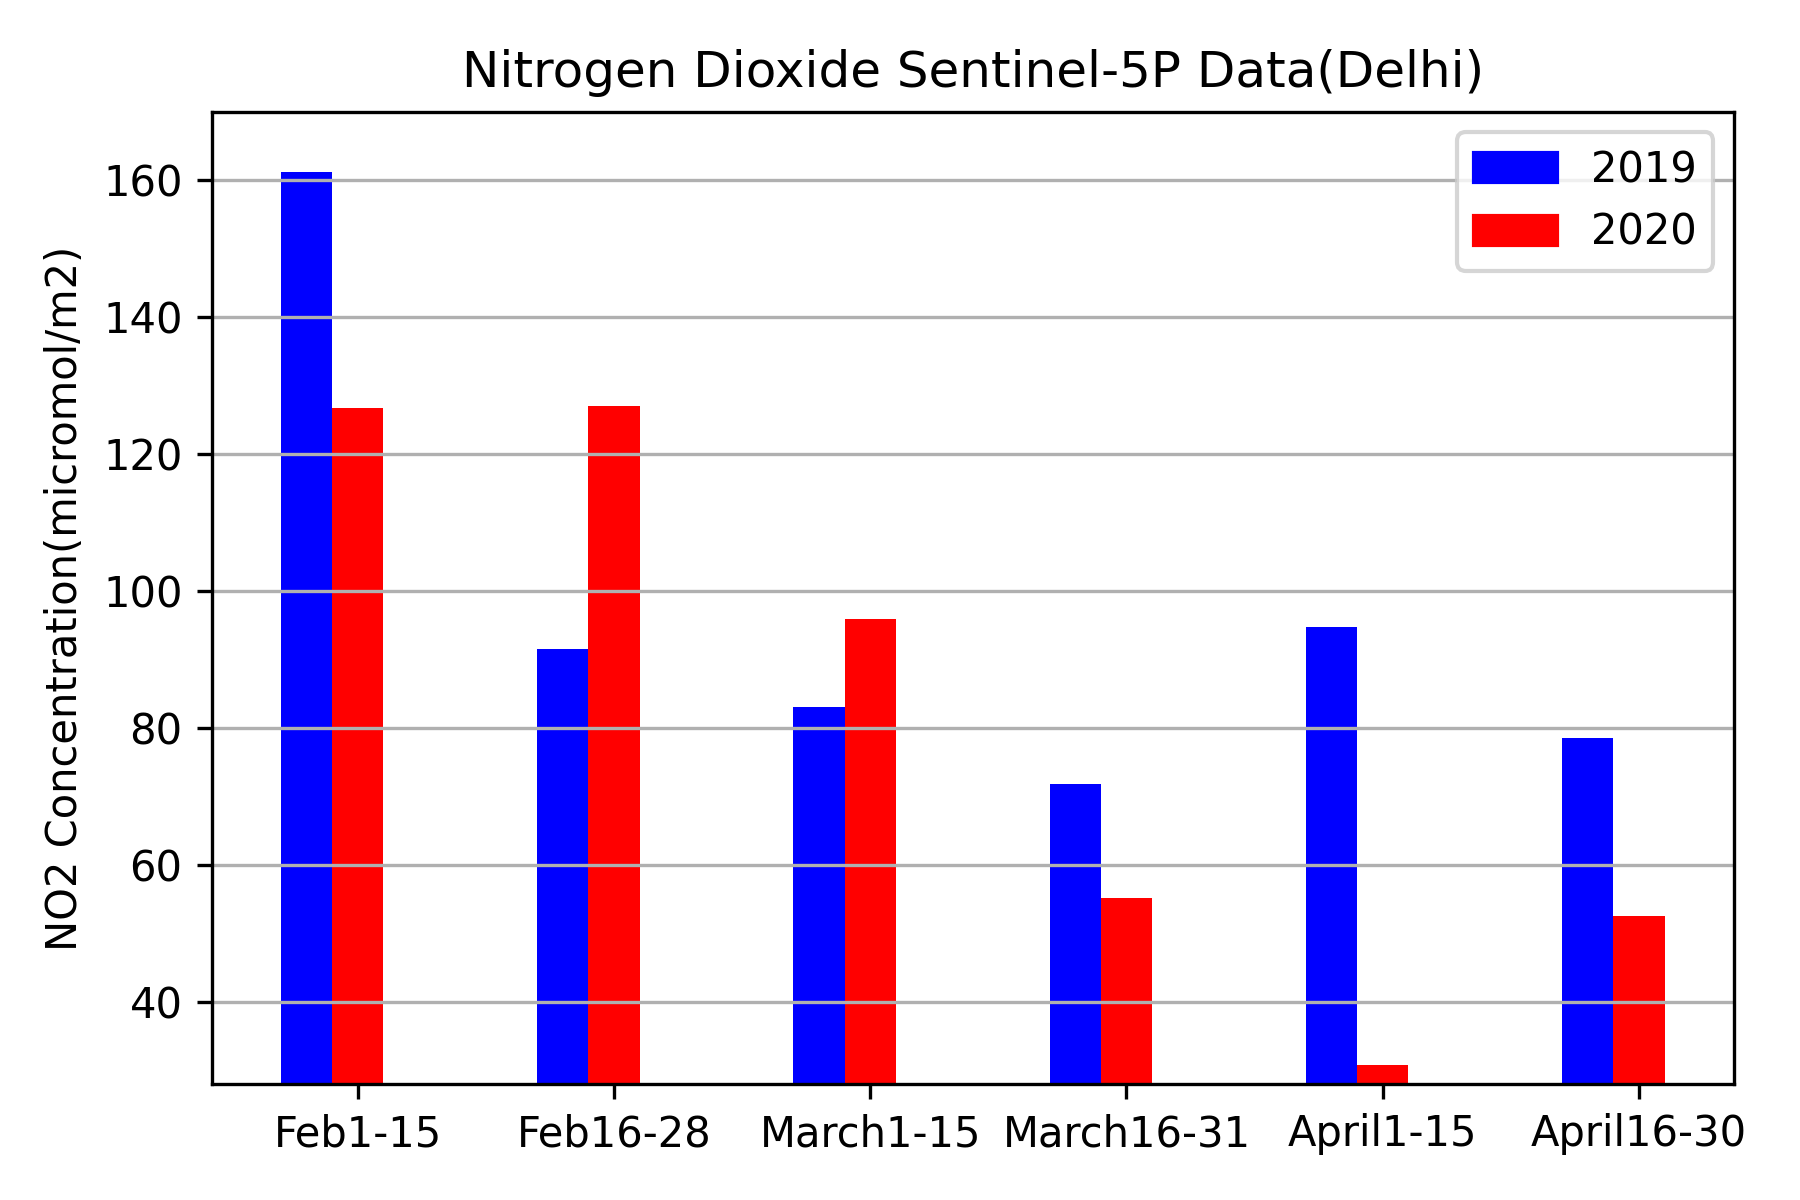
Fig. 2 shows that Delhi observed a similar trend and drop in concentration was clear. In Delhi, the calculated average concentration of nitrogen dioxide was mol/m2 for first half of Mar-2020 and dropped to mol/m2 for the second half of Mar-2020. The condition further improved, and the average NO2 concentration dropped to mol/m2 for the first fortnight of Apr-2020. The plots clearly show that concentration continued to drop after lockdown. However, with the ease of lockdown towards the end of Apr-2020, it again started increasing.
4.2 Sulfur Dioxide
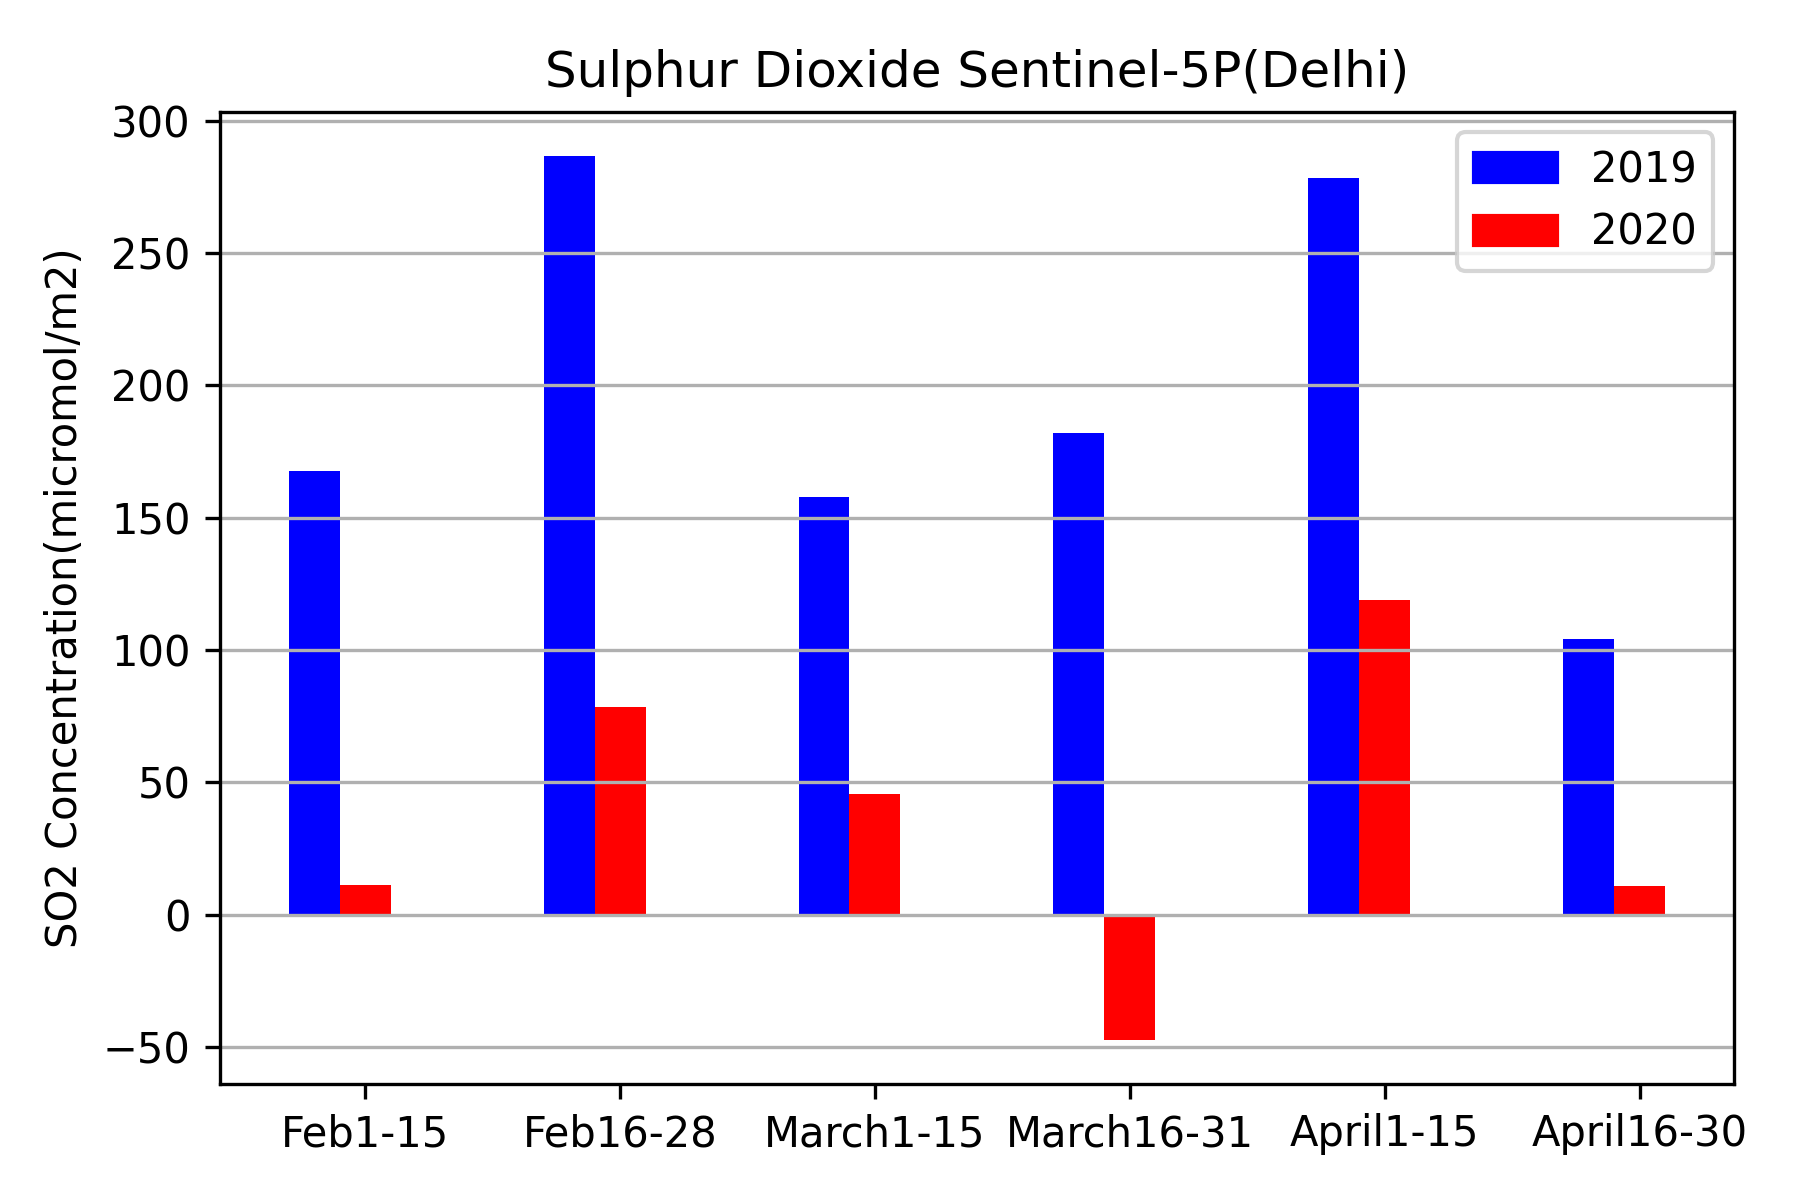
The data used for this study is sulphurdioxide_total_vertical_column product of the NetCDF file which provided the total atmospheric column between the surface and the top of the troposphere [31]. Fig. 2 shows that the average concentration for the first fortnight of Mar-2020 was mol/m2 which dropped to mol/m2. The negative vertical column values are an indication of sensor detecting low concentration of the pollutant.444Please refer to page 9, with the heading ‘Negative Vertical Column Density values’ from the product manual available here: https://sentinels.copernicus.eu/documents/247904/3541451/Sentinel-5P-Sulphur-Dioxide-Readme.pdf. As per the product manual [32] these values should not be filtered except for outliers, i.e. for vertical columns lower than mol/m2. This clearly indicates a drop in SO2 concentration to such a low level that region was under clear category. But, this increased to mol/m2 for the first fortnight of Apr-2020 due to the other meteorological factors and again dropped to mol/m2 for the second fortnight of Apr-2020. These other meteorological factors include surface wind speed, surface pressure, relative humidity and 850-mb level temperature. These meteorological parameters impact the pollutant concentration and introduce variability in its concentration. In comparison to 2019 data for the same period, the concentration of SO2 was mol/m2 for 16–31, Mar-2019, mol/m2 for 1–15, Apr-2019 and mol/m2 for 16–30, Apr-2019. The sulfur dioxide concentration for the month of Apr-2020 saw a drop of about 66% in comparison to Apr-2019 average concentration.
4.3 Carbon Monoxide
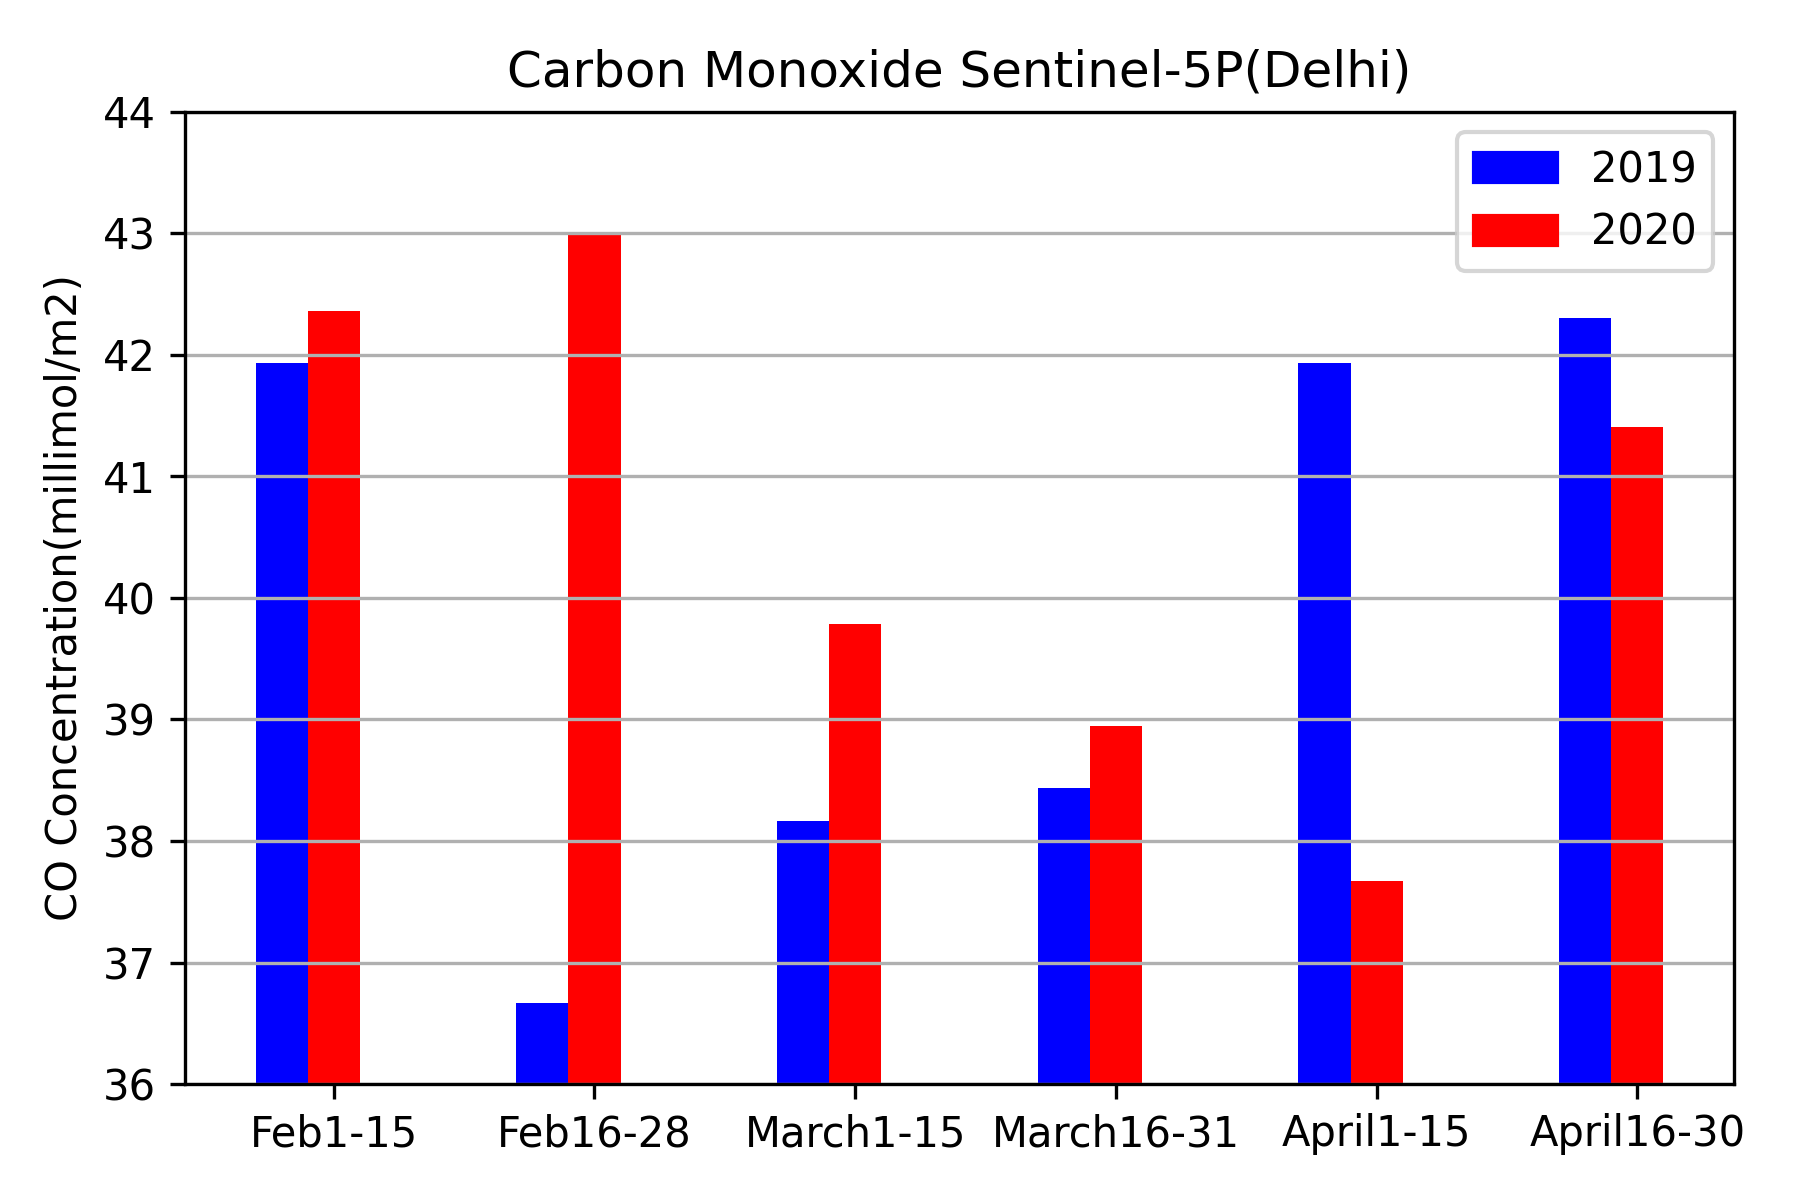
The data used for analyzing carbon monoxide concentration was carbonmonoxide_total_column product of the NetCDF file, which provided the total atmospheric column between the surface and the top of the atmosphere [33]. Fig. 2 shows that the Delhi’s average concentration for Mar-2019 was 38.79 mmol/m2, whereas in Mar-2020, the recorded concentration was 39.36 mmol/m2. The first fortnight of Apr-2019 recorded concentration of 41.92 mmol/m2, and the first fortnight of Apr-2020 recorded 37.67 mmol/m2. This indicated a drop of 10% indicating that the lockdown showed significant impact in the reduction of concentration of CO in the first half of April.
4.4 Ozone
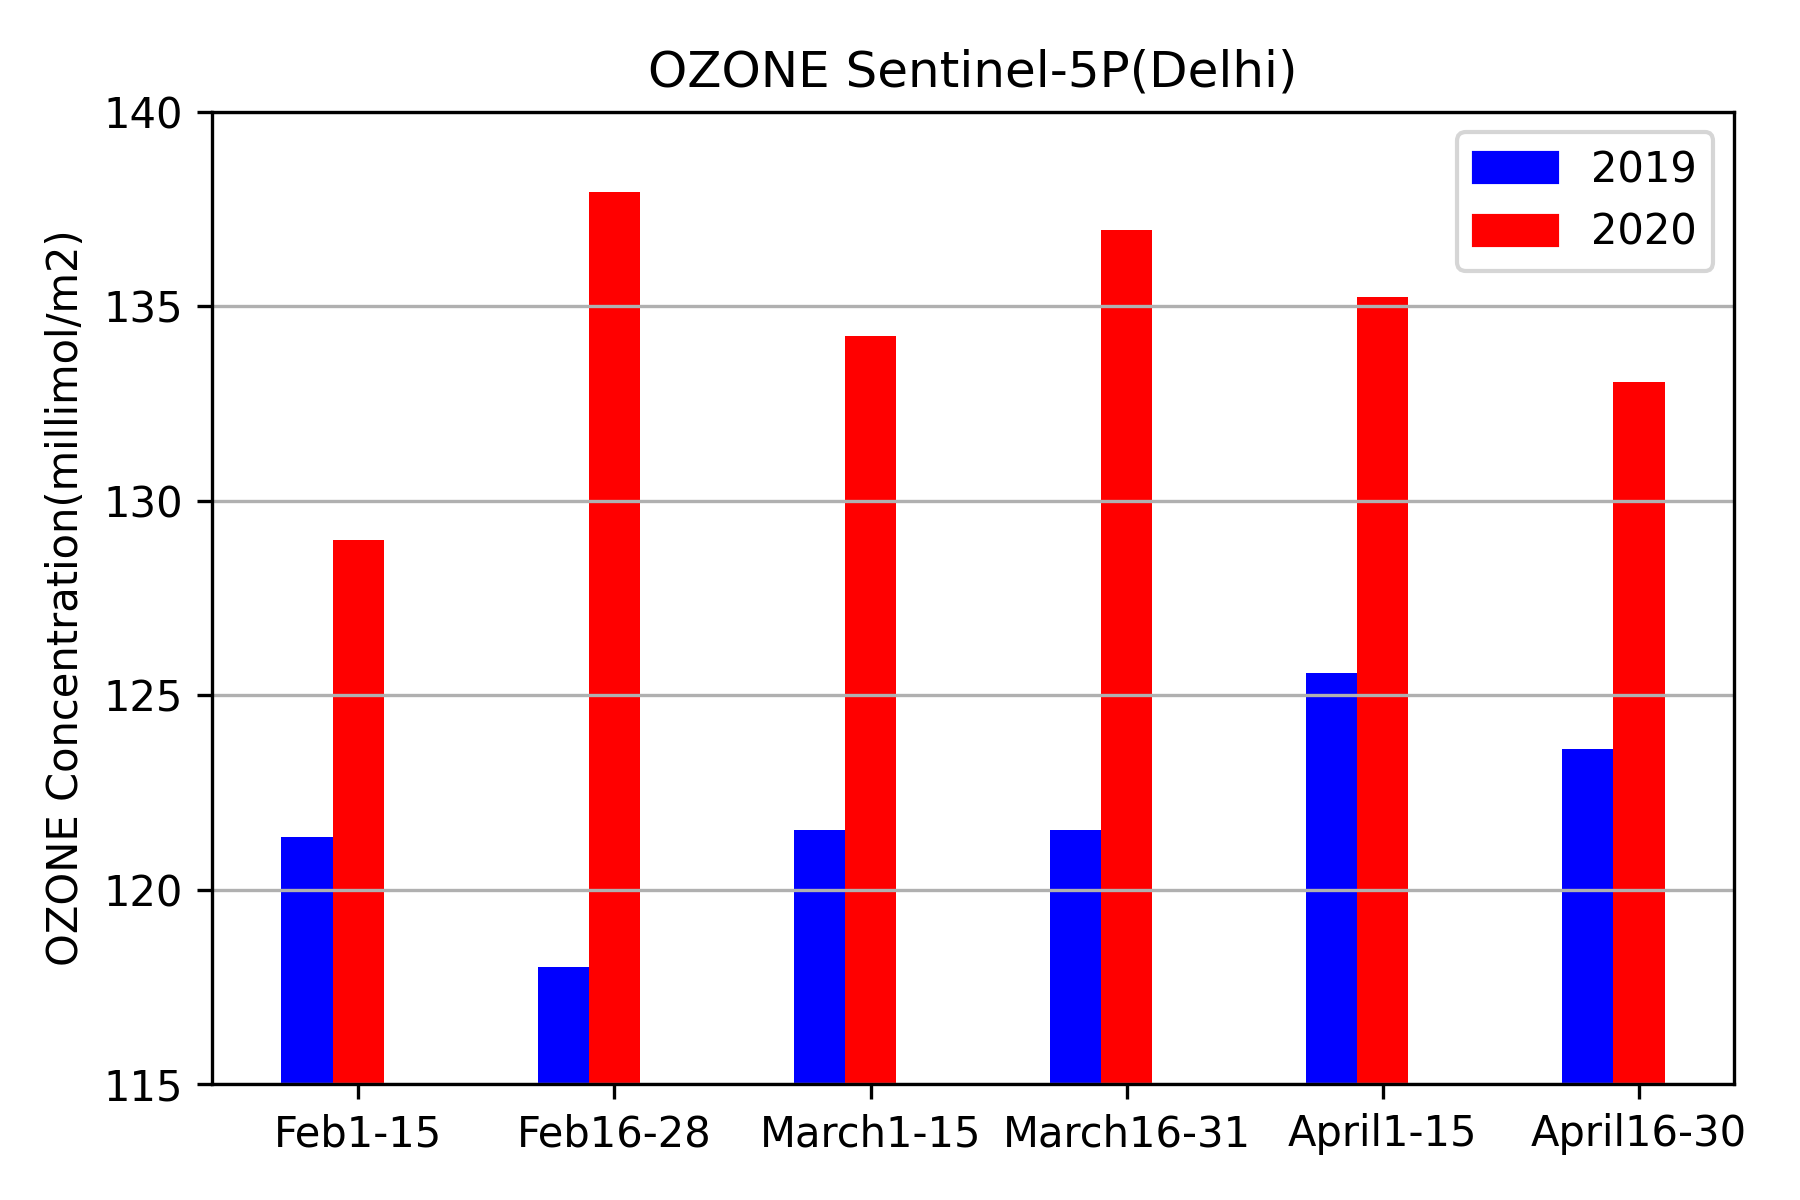
Another harmful gas is ozone which is not directly emitted but is a product of reactions between volatile organic compounds and oxides of nitrogen (NOx) in presence of sunlight. Previous several years of data showed that ozone concentration usually increases during spring and summer season in National Capital Region of India [34]. The data used for analyzing Ozone concentration was ozone_total_vertical_column product of the NetCDF file which provided the total atmospheric column between the surface and the top of the atmosphere [35]. We observed from Fig. 2 that ozone concentration for Apr-2019 was 124.59 mmol/m2 whereas that increased by 7% to 134.14 mmol/m2 for the month of Apr-2020. Similar increase in concentration was observed for the month of March. One of the stated reasons for increased levels of ozone concentration in the atmosphere of Delhi is that, ozone forms when NOx and volatile gases react under the influence of sunlight and temperature. But the cyclical chemistry of ozone suggests that ozone again reacts with the NOx present in the atmosphere and gets removed. Hence, even though ozone is formed in high NOx concentration areas with other gases providing suitable conditions, it does not stay. However, the ozone has a longer resident life and builds up in its concentration, when it moves to less polluted areas (i.e. Delhi during lockdown). The NO2 concentration is considered a good representative of NOx.
4.5 Impact of lockdown
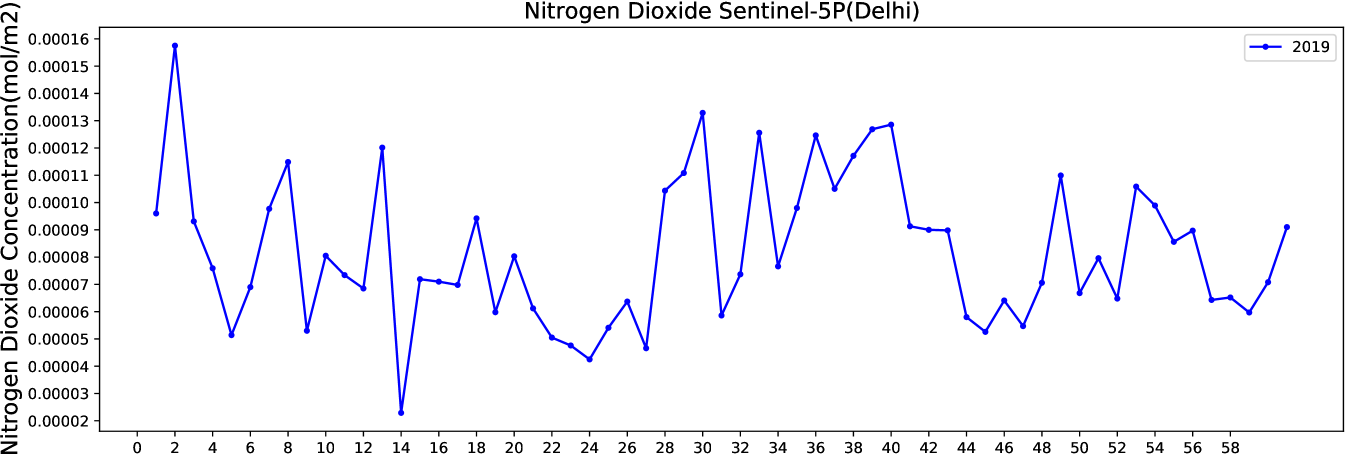
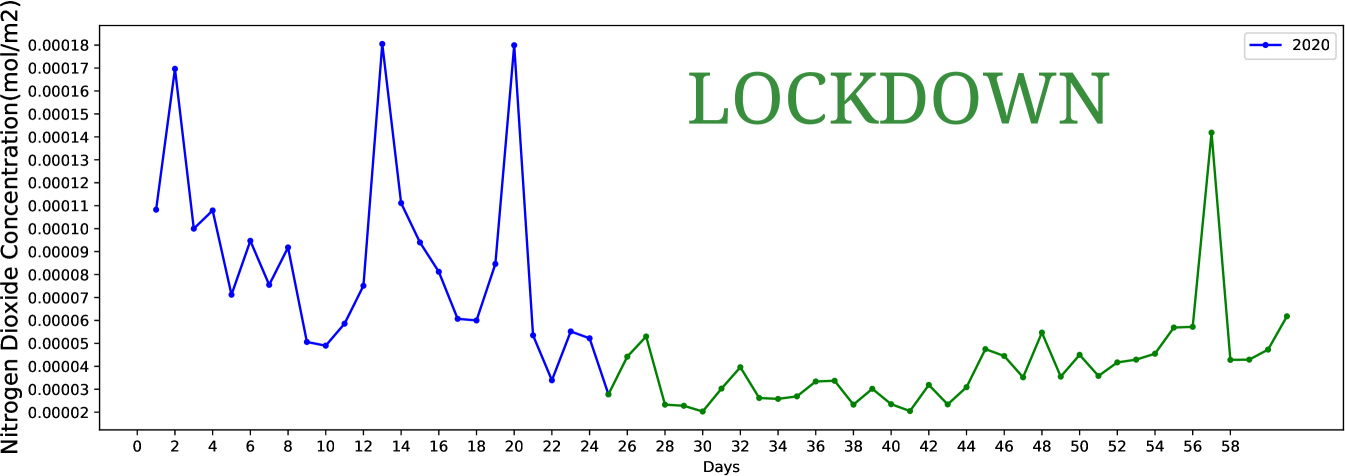
Finally, for comparative study for month of March and April between 2019 and 2020 we obtained daily average concentration of Nitrogen Dioxide for Delhi from the complete dataset and plot each day average concentration as data points on a time-series plot. Fig. 3 shows the impact of the lockdown on the concentration of nitrogen dioxide in the atmosphere. The -axis in Fig. 3 indicates the days starting from 1-Mar-2019 (top graph) and 1-Mar-2020 (below graph) respectively. The -axis indicates the daily concentration of nitrogen dioxide in the atmosphere. We observed similar trend in NO2 concentration for the first half of March 2020 as compared to previous year. This is then followed by a sharp drop after 25-Mar-2020. The NO2 concentration dropped significantly after lockdown was imposed. We indicated the days in lockdown in green color in Fig. 3 for clarity. Post lockdown, the nitrogen dioxide maintained a significant lower value as compared to that of the same period of 2019.
5 Ground-based Pollutants Analysis
The ground-based pollutant data was collected for ITO station of Central Pollution Control Board, Ministry of Environment, India. It is one of the largest atmosphere monitoring station in India. The data is freely accessible from https://app.cpcbccr.com/ccr. We collected and analyzed data for a period of two years for the years 2019 and 2020. We collected the Air Quality Index (AQI), Particulate Matter 10 (PM10), Particulate Matter 2.5 (PM2.5), and other pollutant gases present in the atmosphere. We specifically plotted the daily concentration data for the months of February, March and April across the years because the lockdown came into effect during these months.
The particulate matter data collected from these ground-based monitoring stations indicated an improvement in the PM concentration [18]. The PM2.5 concentration in Delhi before the lockdown was in the range of g/m3 to g/m3. However, after the lockdown period, the concentration clearly dropped by about 50% to the range of g/m3 to g/m3. A similar drop was visible in the concentration of PM10, which was recorded to be g/m3 on 20-Mar-2020. This reduced to g/m3 on 22-Mar-2020 and g/m3 on 26-Mar-2020, following the similar decreasing trend for the period of lockdown [36].
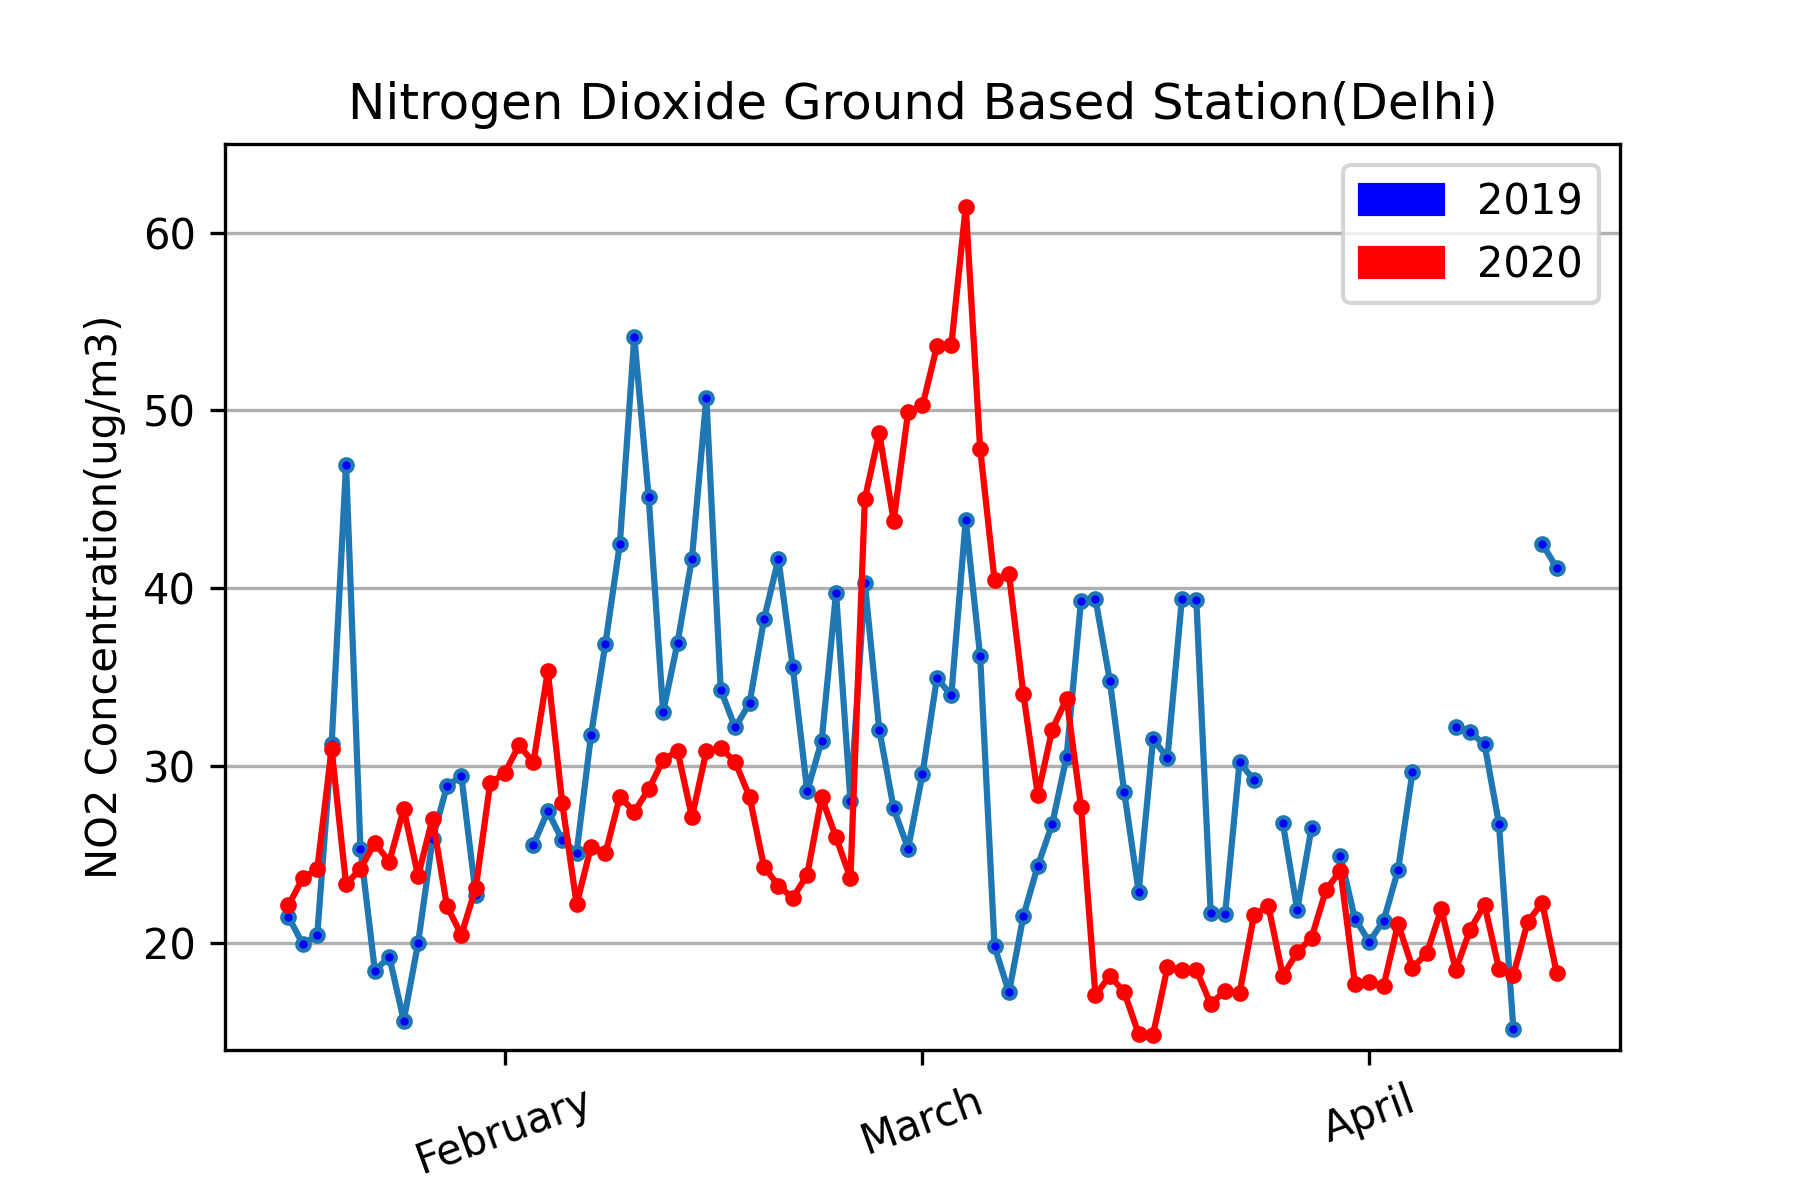
In addition to this particulate matter concentration, we observed similar trend in the concentration of harmful gases in the atmosphere, which is in line with our analysis on Sentinel-5P satellite data. In Fig. 4, we observed that the concentration of NO2 significantly changed throughout the month of Mar-2020. The NO2 concentration in the air had a peak of g/m3 on 20-Mar-2020 (just two days before janta curfew), which dropped to g/m3 on 22-Mar-2020 (date of janta curfew) and continued to drop to about g/m3 on 31-Mar-2020. Consequently, the average concentration of NO2 saw a significant drop from g/m3 to g/m3 during the month of Mar-2020. We observed similar trend in the reduction of NO2 concentration when compared between the same days of 2019 and 2020.
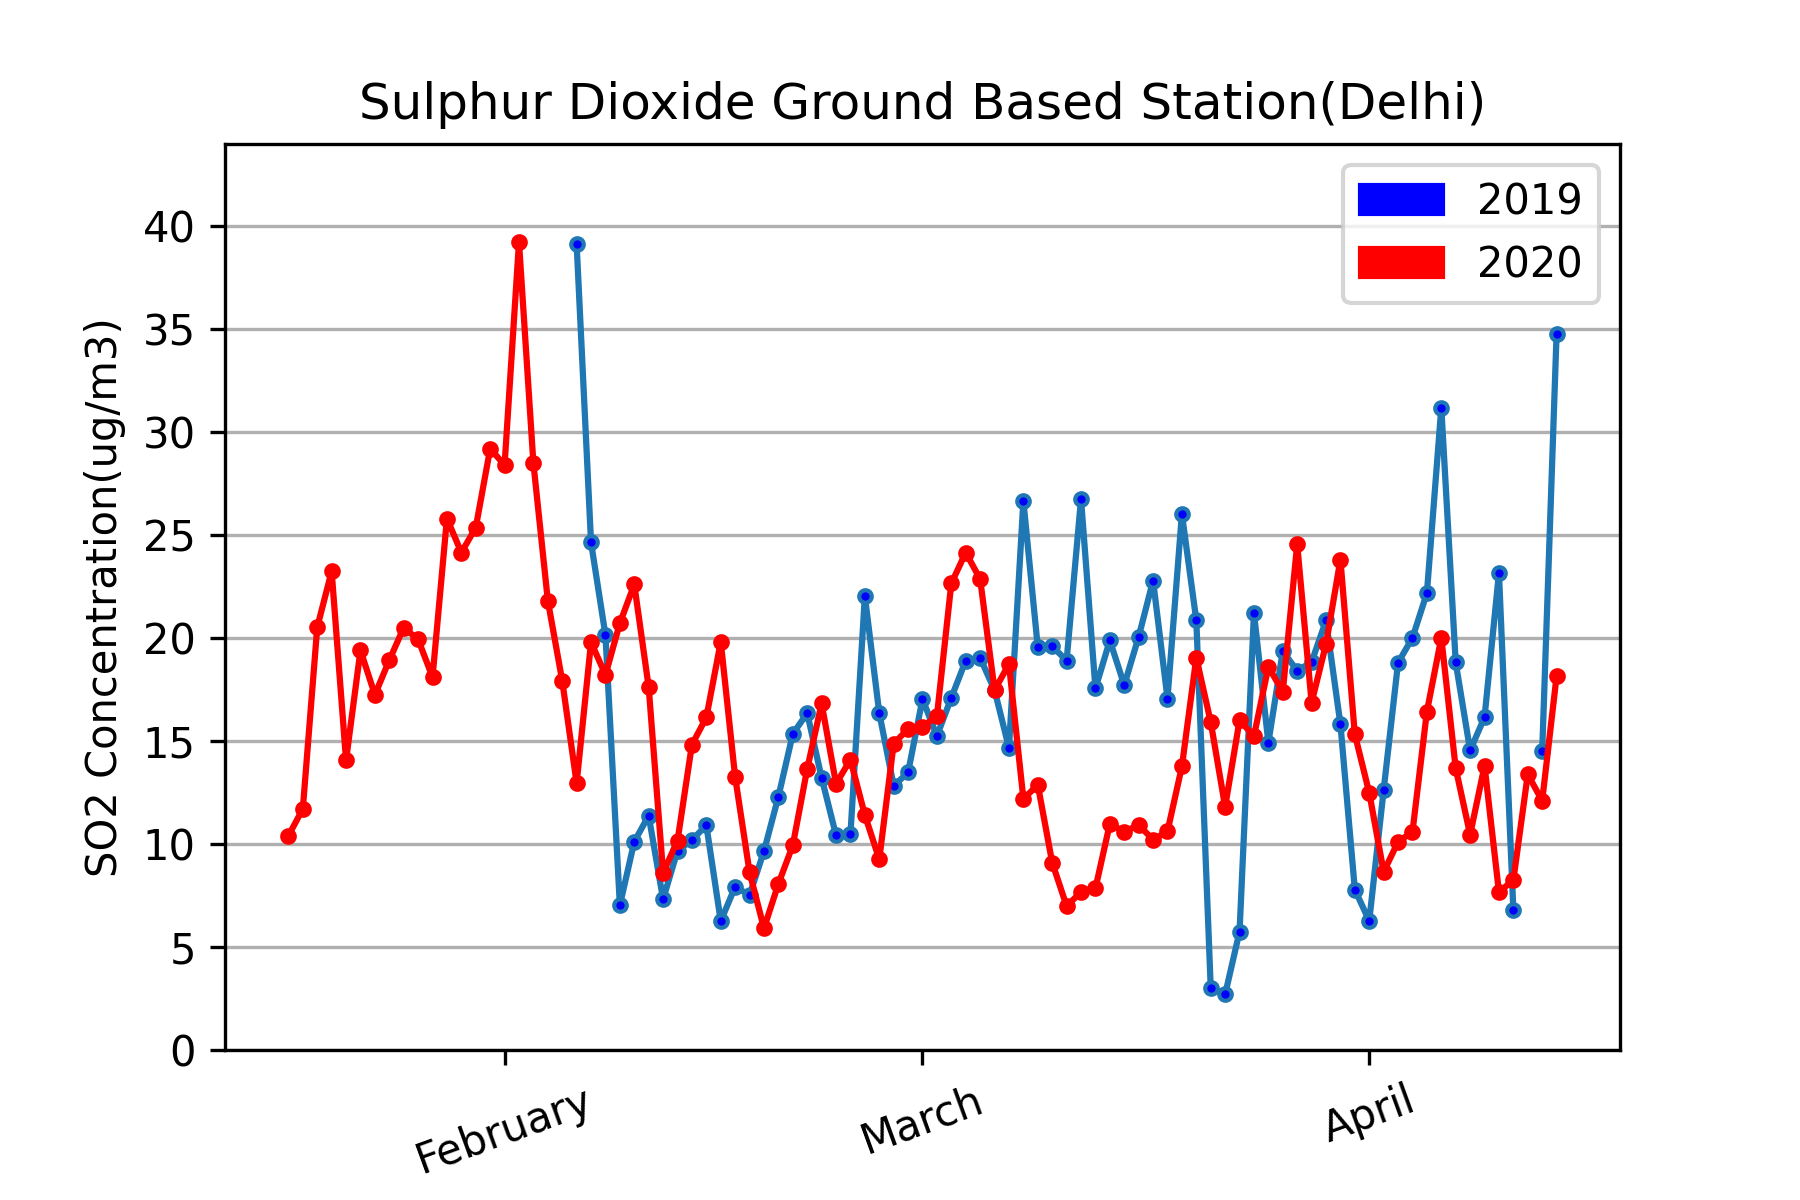
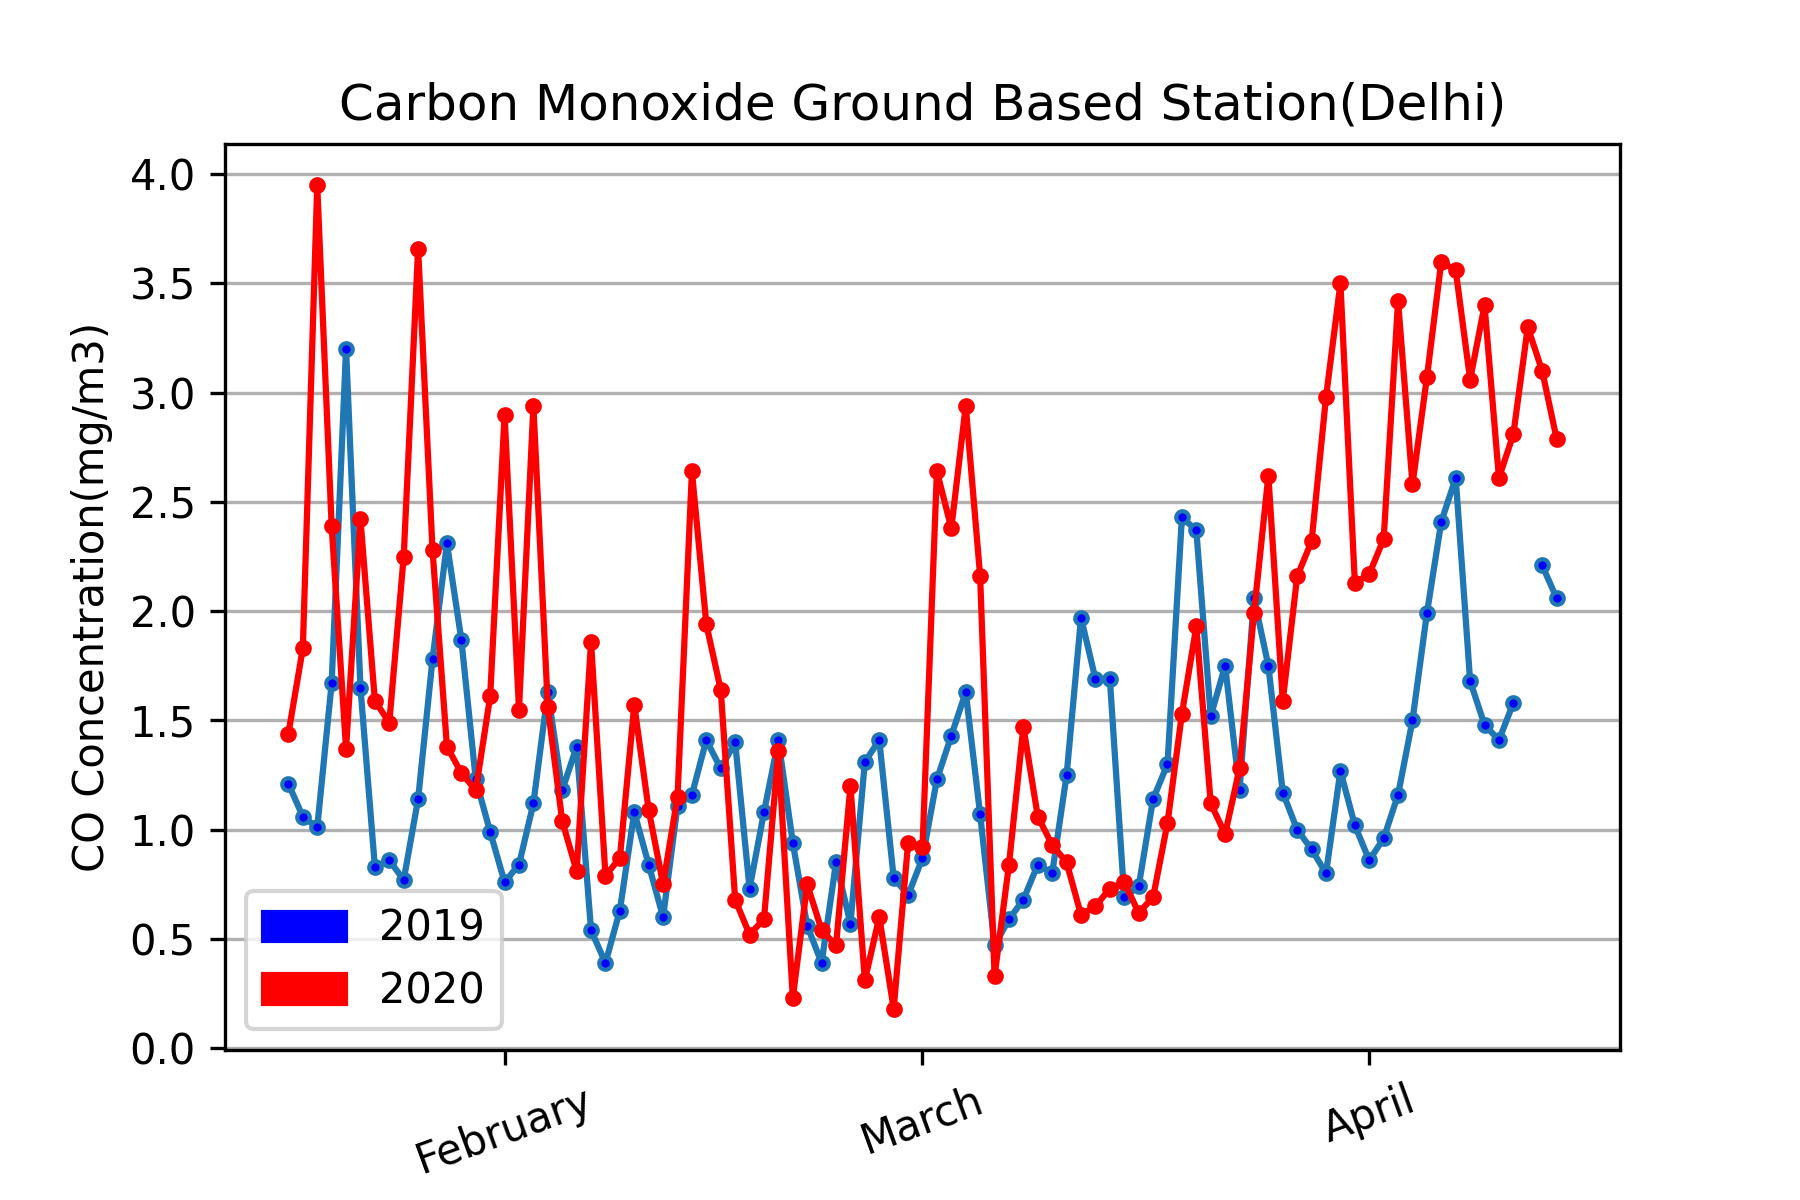
Similarly, Sulfur Dioxide (SO2) concentration in the air had a peak of g/m3 on 20-Mar-2020 (just two days before janta curfew), which dropped to g/m3 on 22-Mar-2020 (day of janta curfew) and continued to drop to g/m3 on 28-Mar-2020. The ground based data showed an abnormal increase in Sulfur Dioxide concentration for the first half of April which subsequently dropped noticeably in later April. Carbon Monoxide (CO) is generally produced from incomplete combustion of fuels containing carbon. Ground based collected data showed that the concentration of CO dropped to 2.94 mg/m3 on 20-Mar-2020, and further dropped to 0.33 mg/m3 on 22-Mar-2020 (day of janta curfew) indicating a drop of approximately 88%. This decrease continued till the end of Mar-2020 and first week of Apr-2020.
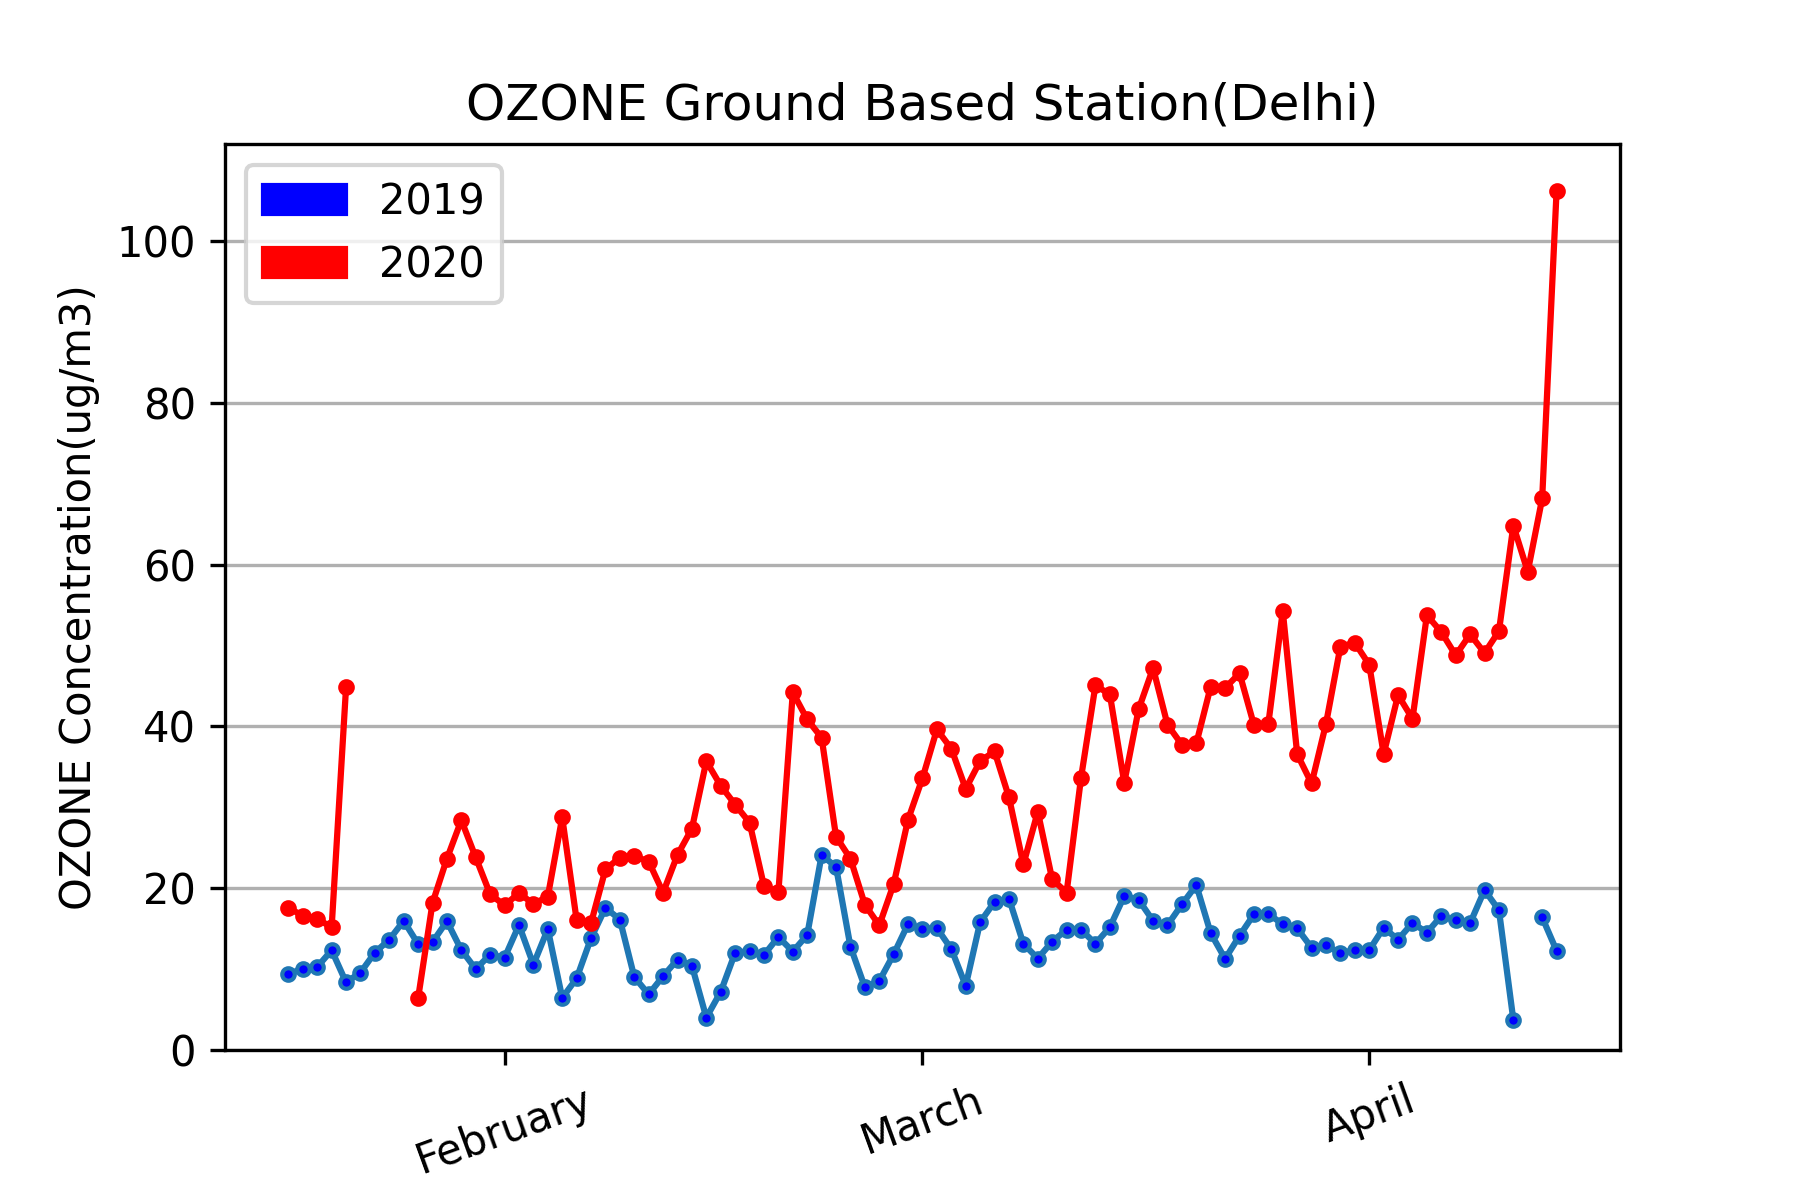
We also obtained the daily average ozone concentration in the atmosphere from the ground-based pollutant data. We observed from the ground-based data that O3 concentration kept on rising post lockdown. The minimum concentration for month of Mar-2020 was g/m3 on 14-Mar-2020 and had a peak of g/m3 on 29-Mar-2020 which was one of the initial day of lockdown. These values kept on increasing and reached maximum value of g/m3(for April) on 30-Apr-2020. This trend is in agreement with the satellite-based O3 concentration analysis.
Our study indicated that the restrictions put in place because of COVID-19 had a clear positive impact on the pollutant concentration in the atmosphere. Owing to these restrictions, there was a reduced human movement, reduced vehicular emissions, and less industrial activities. Such studies can pave the path for the government (both at national and state level) to enact laws in dramatically reducing emission of toxic air pollutants, and provide healthcare protections to the citizens. These steps can include reducing toxic air pollution from the industrial sources, enacting stringent standards for vehicles and engines, and educating the general public via community-driven voluntary programmes. Such laws were enacted by the Government of India via the Motor Vehicles Act, 1988, that required petrol driven vehicles to require PUC (Pollution Under Control) certificate for low emission of carbon monoxide in the atmosphere. Therefore, our study will greatly assist the environmentalists in better understanding the atmosphere.
6 Conclusion & Future Works
Delhi being one of the most polluted cities observed a drastic and noticeable drop in harmful gases like Nitrogen Dioxide, Carbon Monoxide, and Sulfur Dioxide. An interesting phenomena noticed in the atmosphere of Delhi was the increase in ozone concentration as the lockdown was imposed which was also linked to the improvement in the atmospheric conditions comparatively. Obtaining satellite data from Sentinel-5P depicted the scenario from a different perspective, where ground based station data verified the obtained results exactly. Remote location with lack of ground based monitoring stations will benefit from such remote sensing techniques for atmospheric monitoring without any additional setup cost. The COVID-19 lockdown brought a rare opportunity for researchers to understand the environment much better and thereby attempt to influence the policy makers to implement stricter environment laws.
Our future work include the short-term forecasting of pollutant data from historical data. We intend to use the popular LSTM-based models [37, 39] to learn the underlying pattern of such time-series pollutant data. Furthermore, we also plan to mine COVID-19 related texts in different languages [40], and provide an universal knowledge bank. We also intend to understand the impact of other real-life affecting factors, including population size, urban/rural divide, level of industrialization, income, and pulmonary diseases, on the air quality of a megacity. Such studies will enable us in proposing relevant recommendations to city planners and environmental agencies.
Acknowledgments
This research was conducted with the financial support of Science Foundation Ireland under Grant Agreement No. 13/RC/2106_P2 at the ADAPT SFI Research Centre at University College Dublin. ADAPT, the SFI Research Centre for AI-Driven Digital Content Technology, is funded by Science Foundation Ireland through the SFI Research Centres Programme.
References
- [1] P. Agrawal, G. Kaur, S. S. Kolekar, Investigation on biomedical waste management of hospitals using cohort intelligence algorithm, Soft Computing Letters 3 (2021) 100008.
- [2] J.-F. Guégana, G. Suzán, S. Kati-Coulibaly, D. N. Bonpamgue, J.-P. Moatti, Sustainable development goal# 3,“health and well-being”, and the need for more integrative thinking, Veterinaria México 5 (2) (2018) 1–18.
- [3] H. Vaidya, T. Chatterji, SDG 11 sustainable cities and communities, in: Actioning the Global Goals for Local Impact, Springer, 2020, pp. 173–185.
- [4] K. R. Singh, K. Neethu, K. Madhurekaa, A. Harita, P. Mohan, Parallel SVM model for forest fire prediction, Soft Computing Letters (2021) 100014.
- [5] C. Jia, X. Fu, D. Bartelli, L. Smith, Insignificant impact of the “stay-at-home” order on ambient air quality in the memphis metropolitan area, usa, Atmosphere 11 (6) (2020) 630.
- [6] S. Zangari, D. T. Hill, A. T. Charette, J. E. Mirowsky, Air quality changes in New York city during the COVID-19 pandemic, Science of the Total Environment 742 (2020) 140496.
- [7] T. Bourdrel, I. Annesi-Maesano, B. Alahmad, C. N. Maesano, M.-A. Bind, The impact of outdoor air pollution on COVID-19: a review of evidence from in vitro, animal, and human studies, European Respiratory Review 30 (159) (2021).
- [8] N. Ali, F. Islam, The effects of air pollution on COVID-19 infection and mortality—a review on recent evidence, Frontiers in Public Health 8 (2020).
- [9] R. Nigam, K. Pandya, A. J. Luis, R. Sengupta, M. Kotha, Positive effects of COVID-19 lockdown on air quality of industrial cities (Ankleshwar and Vapi) of Western India, Scientific Reports 11 (1) (2021) 1–12.
- [10] A. Karaer, N. Balafkan, M. Gazzea, R. Arghandeh, E. E. Ozguven, Analyzing COVID-19 impacts on vehicle travels and daily nitrogen dioxide (no2) levels among florida counties, Energies 13 (22) (2020) 6044.
- [11] D. Kaloni, Y. H. Lee, S. Dev, Impact of COVID19-induced lockdown on air quality in Ireland, in: Proc. International Geoscience and Remote Sensing Symposium (IGARSS), 2021.
- [12] I. Franch-Pardo, M. R. Desjardins, I. Barea-Navarro, A. Cerdà, A review of GIS methodologies to analyze the dynamics of COVID-19 in the second half of 2020, Transactions in GIS (2021).
- [13] C. Doolette, T. Read, N. Howell, T. Cresswell, E. Lombi, Zinc from foliar-applied nanoparticle fertiliser is translocated to wheat grain: a 65zn radiolabelled translocation study comparing conventional and novel foliar fertilisers, Science of The Total Environment 749 (2020) 142369.
- [14] B. Alparslan, M. Jain, J. Wu, S. Dev, Analyzing air pollutant concentrations in New Delhi, India, in: Proc. Progress in Electromagnetics Research Symposium-Fall (PIERS-FALL), 2021.
- [15] The impact of Delhi’s CNG program on air quality, https://media.rff.org/documents/RFF-DP-07-06.pdf.
- [16] S. K. Mathur, P. Murali Prasad, P. Kulshreshtha, S. Khorana, M. Chauhan, The impact of odd-even transportation policy and other factors on pollution in Delhi: A spatial and RDD analysis, Tech. rep., ARTNeT Working Paper Series (2019).
- [17] M. Mohan, A. Kandya, An analysis of the annual and seasonal trends of air quality index of Delhi, Environmental monitoring and assessment 131 (1) (2007) 267–277.
-
[18]
N. Khan, An exploratory study of impact of
lockdown on the air quality of Delhi, Applied Ecology and Environmental
Sciences 8 (5) (2020) 261–268.
URL http://pubs.sciepub.com/ - [19] L. Guanter, I. Aben, P. Tol, J. Krijger, A. Hollstein, P. Köhler, A. Damm, J. Joiner, C. Frankenberg, J. Landgraf, Potential of the TROPOspheric Monitoring Instrument (TROPOMI) onboard the Sentinel-5 Precursor for the monitoring of terrestrial chlorophyll fluorescence, Atmospheric Measurement Techniques 8 (3) (2015) 1337–1352.
- [20] Tropomi instrument details, http://www.tropomi.eu/.
- [21] Q. Sun, L. Zhang, X. Ding, J. Hu, Z. Li, J. Zhu, Slope deformation prior to Zhouqu, China landslide from InSAR time series analysis, Remote Sensing of Environment 156 (2015) 45–57.
- [22] B. P. Das, M. S. Pathan, Y. H. Lee, S. Dev, Estimating ground-level nitrogen dioxide concentration from satellite data, in: Proc. Progress in Electromagnetics Research Symposium-Fall (PIERS-FALL), 2021.
- [23] N. Akrami, K. Ziarati, S. Dev, Graph-based local climate classification in Iran, International Journal of Climatology (2021).
- [24] S. Manandhar, S. Dev, Y. H. Lee, Y. S. Meng, S. Winkler, A data-driven approach for accurate rainfall prediction, IEEE Transactions on Geoscience and Remote Sensing 57 (11) (2019) 9323–9331.
- [25] S. Dev, F. M. Savoy, Y. H. Lee, S. Winkler, Estimating solar irradiance using sky imagers, Atmospheric Measurement Techniques 12 (10) (2019) 5417–5429.
- [26] S. Dev, Y. H. Lee, S. Winkler, Color-based segmentation of sky/cloud images from ground-based cameras, IEEE Journal of Selected Topics in Applied Earth Observations and Remote Sensing 10 (1) (2017) 231–242.
- [27] N. Danesi, M. Jain, Y. H. Lee, S. Dev, Monitoring atmospheric pollutants from ground-based observations, in: Proc. IEEE AP-S Symposium and USNC-URSI Radio Science Meeting, IEEE, 2021.
- [28] S. Srivastava, A. Kumar, K. Bauddh, A. S. Gautam, S. Kumar, 21-day lockdown in India dramatically reduced air pollution indices in Lucknow and New Delhi, India, Bulletin of Environmental Contamination and Toxicology (2020) 1.
- [29] B. Nagappa, M. Sakthivel, Y. Marimuthu, A. Rastogi, A. Ramalingam, S. K. Sarin, Now casting and forecasting of COVID-19 outbreak in the national capital region of Delhi, medRxiv (2020).
- [30] Copernicus sentinel data processed by ESA, Koninklijk Nederlands Meteorologisch Instituut (KNMI) (2018), Sentinel-5P TROPOMI Tropospheric NO2 1-orbit l2 7km x 3.5km, Greenbelt, MD, USA, Goddard Earth Sciences Data and Information Services Center (GES DISC), 10.5270/S5P-s4ljg54, accessed: 2020-06-20.
- [31] Copernicus Sentinel data processed by ESA, German Aerospace Center (DLR) (2019), Sentinel-5P TROPOMI Sulphur Dioxide SO2 1-Orbit L2 5.5km x 3.5km, Greenbelt, MD, USA, Goddard Earth Sciences Data and Information Services Center (GES DISC), 10.5270/S5P-yr8kdpp, accessed: 2020-06-20.
- [32] S5p mission performance centre sulphur dioxide, https://sentinels.copernicus.eu/documents/247904/3541451/Sentinel-5P-Sulphur-Dioxide-Readme.pdf.
- [33] Copernicus Sentinel data processed by ESA, Koninklijk Nederlands Meteorologisch Instituut (KNMI)/Netherlands Institute for Space Research (SRON) (2019), Sentinel-5P TROPOMI Carbon Monoxide CO Column 1-Orbit l2 7km x 7km, Greenbelt, MD, USA, Goddard Earth Sciences Data and Information Services Center (GES DISC), 10.5270/S5P-1hkp7rp, accessed: 2020-06-20.
- [34] C. India, Air quality analysis during summer lockdown: Some highlights, Discussion paper (2020).
- [35] Copernicus Sentinel data processed by ESA, German Aerospace Center (DLR) (2019), Sentinel-5P TROPOMI Total Ozone Column 1-Orbit l2 5.5km x 3.5km, Greenbelt, MD, USA, Goddard Earth Sciences Data and Information Services Center (GES DISC), 10.5270/S5P-fqouvyz, accessed: 2020-06-20.
- [36] S. Mahato, S. Pal, K. G. Ghosh, Effect of lockdown amid COVID-19 pandemic on air quality of the megacity Delhi, India, Science of the Total Environment (2020) 139086.
- [37] M. S. Pathan, M. Jain, Y. H. Lee, T. AlSkaif, S. Dev, Efficient forecasting of precipitation using LSTM, in: Proc. Progress in Electromagnetics Research Symposium-Fall (PIERS-FALL), 2021.
- [38] N. Danesi, M. Jain, Y. H. Lee, S. Dev, Predicting Ground-based PM2.5 Concentration in Queensland, Australia, in: Proc. Progress in Electromagnetics Research Symposium-Fall (PIERS-FALL), 2021.
- [39] M. Jain, S. Manandhar, Y. H. Lee, S. Winkler, S. Dev, Forecasting precipitable water vapor using LSTMs, in: Proc. IEEE AP-S Symposium and USNC-URSI Radio Science Meeting, IEEE, 2020.
- [40] P. Berjon, A. Nag, S. Dev, Analysis of French phonetic idiosyncrasies for accent recognition, Soft Computing Letters (2021) 100018.