Aliphatics and Aromatics in the Universe: The Pre-JWST Era
DRAFT:
Abstract
The so-called “unidentified infrared emission” (UIE) features at 3.3, 6.2, 7.7, 8.6, and 11.3 ubiquitously seen in a wide variety of astrophysical regions are generally attributed to polycyclic aromatic hydrocarbon (PAH) molecules. Astronomical PAHs often have an aliphatic component (e.g., aliphatic sidegroups like methyl –CH3 may be attached as functional groups to PAHs) as revealed by the detection in many UIE sources of the aliphatic C–H stretching feature at 3.4. With its unprecedented sensitivity, unprecedented spatial resolution and high spectral resolution, the James Webb Space Telescope (JWST) holds great promise for revolutionizing the studies of aliphatics and aromatics in the universe. To facilitate analyzing JWST observations, we present a theoretical framework for determining the aliphatic fractions () of PAHs, the fractions of C atoms in aliphatic units, from the emission intensity ratios of the 3.4 aliphatic C–H feature to the 3.3 aromatic C–H feature. To demonstrate the effectiveness of this framework, we compile the 3.3 and 3.4 UIE data obtained in the pre-JWST era for an as complete as possible sample, and then apply the framework to these pre-JWST data. We derive a median aliphatic fraction of , and find that the aliphatic fractions are the highest in protoplanetary nebulae illuminated by cool stars lacking ultraviolet radiation. Nevertheless, the “hardness” of stellar photons is not the only factor affecting the PAH aliphaticity, other factors such as the starlight intensity may also play an important role.
1 Introduction
Polycyclic aromatic hydrocarbon (PAH) molecules, composed of fused benzene rings, have long been thought to be ubiquitous in the interstellar medium (ISM), as evidenced by a series of emission bands observed at wavelengths 3.3, 6.2, 7.7, 8.6 and 11.3, which are coincident with the vibrational transitions of PAHs (Léger & Puget 1984, Allamandola et al. 1985). These emission bands are often also known as the “unidentified infrared (IR) emission” (UIE) bands. Of all interstellar carbon, 15% is thought to be incorporated into PAHs (Li & Draine 2001). Their emission accounts for up to 20% of the total IR power of the Milky Way and star-forming galaxies (see Li 2020).
It has been generally held that astronomical PAHs are not really pure aromatic compounds (see Kwok 2022). They may include ring defects, substituents, partial dehydrogenation and sometimes superhydrogenation or deuteration (see Yang et al. 2017a and references therein). Astronomical PAHs often also include an aliphatic component (e.g., aliphatic sidegroups like methyl –CH3 may be attached as functional groups to PAHs), as revealed by the detection in many UIE sources of a weak satellite emission feature at 3.4 which always accompanies the 3.3 emission feature (see Yang et al. 2017b and references therein). While the 3.3 feature arises from aromatic C–H stretch, the 3.4 feature is generally thought to arise from aliphatic C–H stretch, although it could also be due to anharmonicity (Barker et al. 1987) and superhydrogenation (Bernstein et al. 1996, Yang et al. 2020). In addition, some UIE sources also exhibit two aliphatic C–H deformation bands at 6.85 and 7.25 (see Yang et al. 2016a and references therein). Typically, for those sources with prominent 6.85 and 7.25 bands, the 3.4 band is often pronounced.
Let be the aliphatic fraction of PAHs, i.e., the ratio of the number of C atoms in aliphatic units () to that in aromatic rings () plus that in aliphatic units. In recent years, the PAH aliphatic fraction has received increasing attention (e.g., see Kwok & Zhang 2011; Li & Draine 2012; Rouillé et al. 2012; Steglich et al. 2013; Pilleri et al. 2015; Bernstein et al. 2017; Buragohain et al. 2015, 2016, 2020; Allamandola et al. 2021; Yang et al. 2013, 2016a,b, 2017a,b). Despite the widespread acceptance and extreme popularity of the PAH model, the exact nature of the UIE carriers remains unknown and many candidate materials have been proposed. All these hypotheses generally agree that the UIE bands arise from some sort of aromatic hydrocarbon material. The major debate lies in the exact structure of the UIE carriers: are they (i) free-flying, predominantly aromatic gas-phase molecules like PAHs, or (ii) amorphous solids (either bulk or nano-sized) with a mixed aromatic/aliphatic structure (e.g., see Sakata et al. 1987, Papoular et al. 1993, Kwok & Zhang 2011, Jones et al. 2013)? One way to address this is to examine the aliphatic fraction of the UIE carriers: while PAHs, by definition, are predominantly aromatic, all other (proposed) carriers are considerably aliphatic (see Yang et al. 2017b).
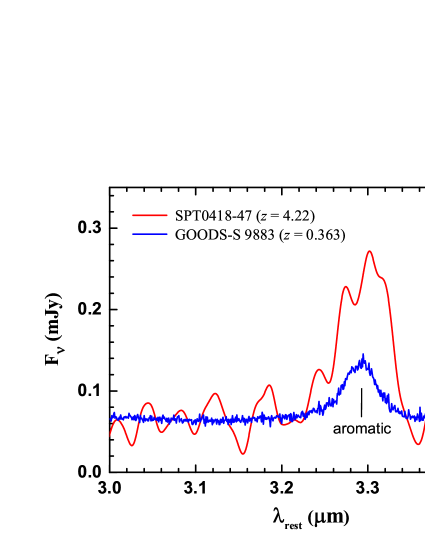
Prior to the launch of the James Webb Space Telescope (JWST), the 3.4 feature, together with the 3.3 feature, has already been seen in a wide variety of Galactic and extragalactic regions, including reflection nebulae, Hii regions, photodissociated regions (PDRs), protoplanetary nebulae, planetary nebulae, protoplanetary disks around Herbig Ae/Be stars and T Tauri stars, and external galaxies (see Yang et al. 2017b). Undoubtedly, the high spectral resolution and unprecedented sensitivity of JWST will bring the studies on aliphatics and aromatics to a new height. Indeed, as illustrated in Figure 1, the 3.3 and (tentatively) 3.4 features were very recently seen in the mid-IR spectrum of SPT0418-47, a galaxy at a redshift of , obtained with the Mid-IR Instrument (MIRI) on board JWST (Spilker et al. 2023). The 3.3 and 3.4 emission features have also been detected by JWST, through its Near Infrared Camera (NIRCam), in dozens of moderately distant galaxies at redshifts 0.2–0.5 in the Great Observatories Origins Deep Survey–South (GOODS-S; see Lyu et al. 2023). It is expected that JWST will accumulate a rich set of such spectra for a wide range of astrophysical regions, particularly in the distant universe.
We have initiated a program to explore the aliphatic and aromatic contents of PAHs in the universe, both in the Milky Way and external galaxies, both near and far. In this work, we focus on the 3.3 and 3.4 emission features detected in the pre-JWST era. This paper is organized as follows. In §2 we present a theoretical framework for relating the aliphatic fractions of PAHs to the emission intensity ratios of the 3.4 feature to the 3.3 feature. This theoretical framework will not only be used in later sections but in the very near future also serve the JWST community as an effective tool for quantitatively determining the aliphatic fractions of PAHs. The 3.3 and 3.4 emission features of various astrophysical regions detected in the pre-JWST era will be summarized and analyzed in §3. We will quantitatively determine the aliphatic fractions of PAHs and discuss the results in §4. Finally, we summarize our major results in §5.
2 IR Emission Spectra of PAHs with Aliphatic Sidegroups: Theoretical Framework
To facilitate the analysis of the 3.3 and 3.4 emission detected in the pre-JWST era, we first set up a theoretical framework to model the IR emission of PAHs containing aliphatic sidegroups and relate the emission intensities of the 3.3 and 3.4 features to the PAH aliphatic fraction. In the JWST era, this theoretical framework will also be used to analyze JWST observations to quantitatively determine the aliphatic fractions of PAHs.
Due to their small heat contents, PAHs are transiently heated in the ISM by single stellar photons (see Li 2004). They will not attain an equilibrium temperature, instead, they will experience temperature spikes and undergo temperature fluctuations. For PAHs containing aliphatic contents (which we call “aliphatic” PAHs), we consider PAHs attached with aliphatic sidegroups like methylene and methyl. Following Draine & Li (2001), we will calculate the temperature probability distribution functions and emission spectra of aliphatic PAHs of aromatic C atoms, aromatic H atoms, aliphatic C atoms, and aliphatic H atoms. For such molecules, we approximate their absorption cross sections by adding three Drude functions to that of PAHs of C atoms and H atoms These Drude functions represent the 3.4 aliphatic C–H stretch, and the 6.85 and 7.25 aliphatic C–H deformations. The absorption cross section of an aliphatic PAH molecule of aromatic C atoms, aromatic H atoms, aliphatic C atoms, and aliphatic H atoms becomes
| (1) | |||||
| (2) | |||||
| (3) | |||||
| (4) |
where is the number of C atoms contained in an aliphatic PAH molecule; , , and are respectively the central wavelengths of the 3.4, 6.85 and 7.25 aliphatic C–H features; , , and are respectively the FWHMs of the 3.4, 6.85 and 7.25 features (, , and are dimentionless parameters; see Draine & Li 2007); and are the intensities of the aromatic and aliphatic C–H stretches, respectively; and are the intensities of the C–C stretches; and are the intensities of the aliphatic C–H deformation bands; and and are respectively the integrated strengths per (aromatic) C atom of the 3.3 aromatic C–H stretch and 6.2 aromatic C–C stretch (see Draine & Li 2007). We take for neutrals and for cations as computed by Yang et al. (2013). We take the lower limits of and for neutrals, and for cations as derived in Yang et al. (2016a). We note that, with (suitable for methyl sidegroups), the absorption cross sections given in eqs.1–4 are the same as that of Yang et al. (2016a).
Let be the probability that the temperature of the aliphatic PAH molecule will be in . The emissivity (in unit of ) of this molecule becomes
| (5) |
The 3–4 interstellar UIE emitters are in the size range of 20–30 C atoms, as shown in Figures 6, 7 of Draine & Li (2007). For illustrative purpose, we consider (like coronene). For a coronene-like molecule, up to 12 methylene or methyl sidegroups can be attached, we thus consider aliphatic C atoms and aliphatic H atoms. For all molecules, is fixed. Yang et al. (2016a) have shown that the model IR emission spectra (scaled by starlight intensity) are essentially independent of the absolute values of the starlight intensities. Therefore, we only consider , with defined as
| (6) |
where is the intensity of starlight, and is the starlight intensity of the solar neighbourhood interstellar radiation field (ISRF) of Mathis, Mezger & Panagia (1983; MMP83). In addition to the MMP83 ISRF, we consider five types of radiation fields, approximated by the stellar model atmospheric spectra of Kurucz (1979) of effective temperatures of , like that of M2V stars, the Sun, A2V stars, B1.5V stars and B0V stars, respectively. The reflection nebula NGC 2023 is illuminated by HD 37903, an B1.5V star with , while IRAS 03035+5819 is illuminated by an B0V star of .
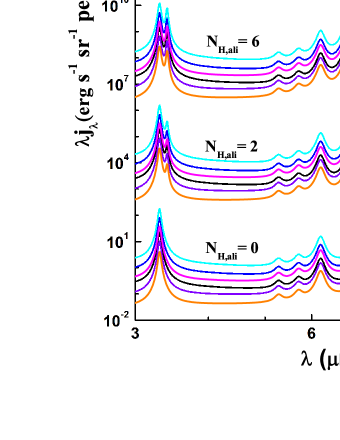
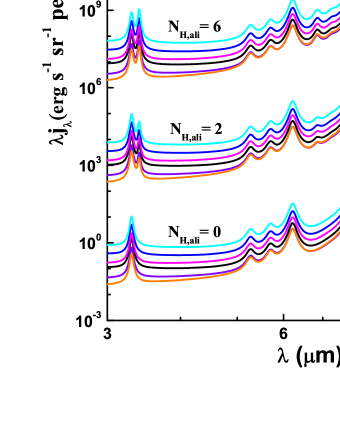
We adopt the “thermal-discrete” method of Draine & Li (2001) to compute the temperature probability distribution functions and the IR emission spectra of both neutral and ionized aliphatic PAHs excited by starlight of different spectra. In Figures 2 and 3 we show the model emission spectra in 3–15 respectively for neutral and ionized aliphatic PAHs of illuminated by stars of different . It is apparent that the 3.4 and 6.85 aliphatic C–H features are clearly visible and become stronger as increases. The 7.25 aliphatic C–H feature, however, remains hardly noticeable even for . This is because the intrinsic strength of the 7.25 feature () is much weaker compared to that of the 3.4 and 6.85 features (, ; see Yang et al. 2016a).
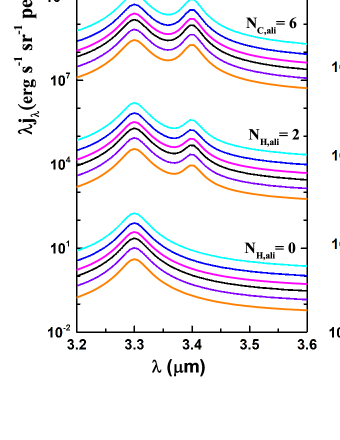
In the following, we will focus on the 3.3 and 3.4 features. Figure 4 highlights the spectra in the wavelength range of 3.2–3.6 for both neutral and ionized aliphatic PAHs with . The 3.4 aliphatic C–H band becomes pronounced even at . At , the 3.4 feature becomes comparable to or even stronger than the 3.3 aromatic C–H feature. For the same , PAH cations emit less at 3.3 and 3.4 than their neutral counterparts.
For a given , we derive , the model emission intensity ratio of the 3.4 band to the 3.3 band, from
| (7) |
where and are respectively the calculated intensities of the 3.4 and 3.3 emission features; and and are respectively the feature-integrated excess emission of the 3.3 and 3.4 features of aliphatic PAHs.
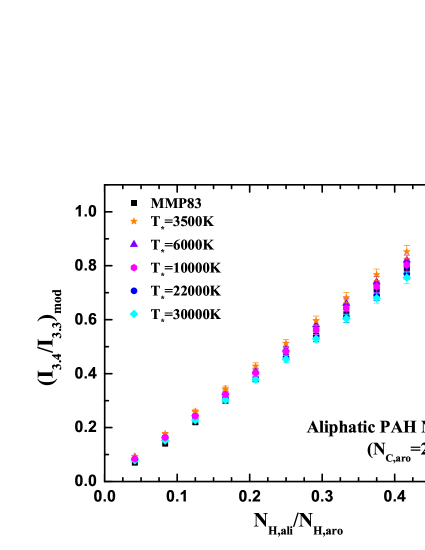
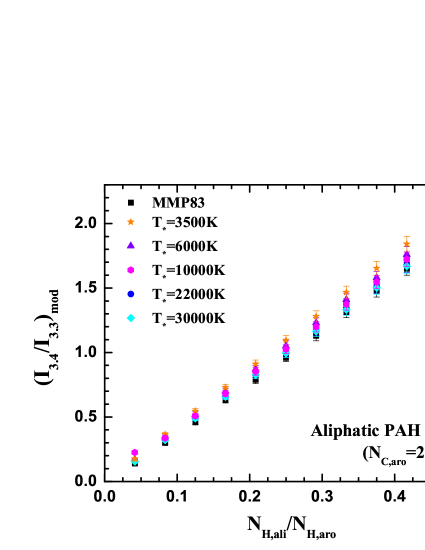
In Figures 5 and 6 we show the model intensity ratios as a function of for neutral and ionized PAHs, respectively. Basically, the model band ratios are linearly correlated with for both neutrals and cations. The correlation slope, defined as , is a weak function of and listed in Table 1. On average, for neutrals and for cations. Therefore, to first order, we obtain for neutrals and for cations. With the temperature dependence of the correlation slope taken into account, the model band ratio can be expressed as
| (8) |
where , the correlation slope, is
| (9) |
The correlation slope somewhat decreases as increases. This is because, in regions illuminated by hot stars (of higher ), the stellar photons are more energetic. Upon absorption of such an energetic photon emitted from hotter stars, PAHs are excited to higher temperatures and emit more effectively at shorter wavelengths (e.g., 3.3) than at longer wavelengths (e.g., 3.4). Therefore, for a given , a smaller is expected for regions illuminated by stars of higher .
To relate through , we assume that one aliphatic C atom corresponds to 2.5 aliphatic C–H bonds (intermediate between methylene –CH2 and methyl –CH3) and one aromatic C atom corresponds to 0.75 aromatic C–H bond (intermediate between benzene C6H6 and coronene C24H12). Therefore, the ratio of the number of C atoms in aliphatic units to that in aromatic rings is . As the 3.3 and 3.4 C–H stretches are predominantly emitted by neutral PAHs, we therefore recommend the following relation to estimate from the observed band ratios :
| (10) |
In case there is no information on (e.g., the MMP83 ISRF), we recommend
| (11) |
The aliphatic fraction of PAHs is determined from
| (12) |
There is no need to compute the temperature probability distribution functions and the IR emission spectra of aliphatic PAHs as long as one is only interested in the aliphatic fraction of the UIE carrier.
3 Aliphatic and Aromatic Observations in the Pre-JWST Era
A wealth of observational spectra for the aliphatic and aromatic C–H stretches are available in archive or literature. This allows an in-depth study of the aliphatics and aromatics in the universe. We compile the aliphatic and aromatic C–H emission data, as complete as possible, from observations made with space-borne satellites such as the Infrared Space Observatory (ISO) and AKARI, airborne telescopes such as the Kuiper Airborne Observatory (KAO), and ground-based telescopes such as the Infrared Telescope Facilities (IRTF) and the United Kingdom Infrared Telescope (UKIRT).
To this end, we find 28 sources which show both the 3.3 and 3.4 features. These sources include Galactic PDRs, protoplanetary nebulae (PPNe), planetary nebulae (PNe), reflection nebulae (RNe), young stellar objects (YSOs), and HII regions, as well as external galaxies.
For each source, we fit the observed spectrum in terms of two or more Drude profiles combined with an underlying linear continuum:
| (13) |
where and are the coefficients of the linear continuum; and are the central wavelength and width of the -th Drude profile; , the power emitted from -th Drude profile (in unit of ), is obtained by integrating the emission feature over wavelength:
| (14) |
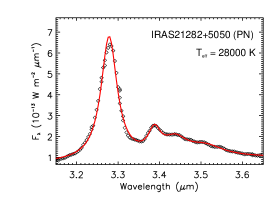
For the Drude profiles, the 3.3 and 3.4 features are always included for consideration. In some objects (e.g., IRAS 21282+5050), one or more additional weak features at 3.43, 3.47, 3.51, and 3.56 are also present and each of these features is also approximated as a Drude profile. We sum up the power emitted from all these sub-features and attribute them to the aliphatic C–H stretches. Therefore, for the ratio of the power emitted from the aliphatic C–H stretches to that from the aromatic C–H stretches, we take provided that these subfeatures are detected. If only the 3.3 and 3.4 features show up, we take . We note that in the literature the band ratios have been reported for some sources. We prefer to derive by ourselves because in the literature there is a certain arbitrarity in defining the underlying continuum for the features and the strengths of the features were calculated in different ways. When taking data from different publications, these differences may actually play a role. We therefore decide to derive in a coherent way for all sources.
4 Results and Discussion
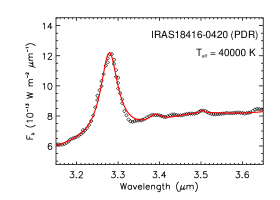
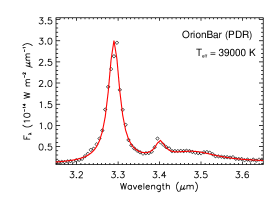
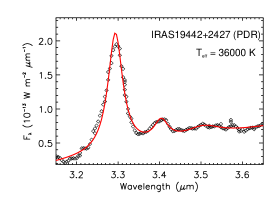
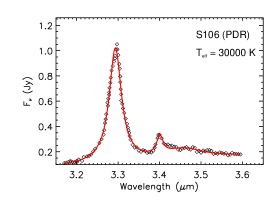
Figure 7 shows the aliphatic and aromatic C–H stretches seen in emission in PDRs excited by B0V or earlier-type stars with . The aliphatic C–H stretches are relatively weak and the aliphatic fractions of PAHs are all smaller than 3%. This is understandable since PDRs are rich in energetic photons so that the aliphatic sidegroups attached to PAHs could easily be stripped off.
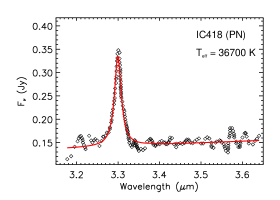
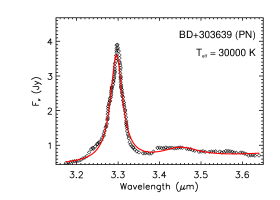
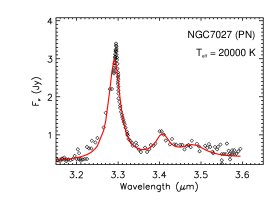
Figure 8 shows the near-IR spectra of four PNe. NGC 7027, excited by an B2.5V star of , exhibits the strongest aliphatic C–H stretches among these four PNe. As the illuminating star becomes hotter, decreases, so does the PAH aliphatic fraction. With , IC 418 does not show any noticeable aliphatic C–H emission. In contrast, excited by an B0V star of , BD+303639 shows a broad, shallow feature around 3.4–3.5. By attributing this feature to aliphatic C–H stretches, we estimate an aliphatic fraction of 5.3% for PAHs in BD+303639.
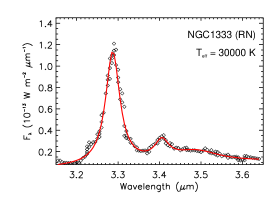
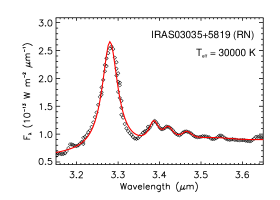
The aliphatic and aromatic C–H stretches of two reflection nebulae are shown in Figure 9. IRAS 03035+5819 exhibits a series of weak aliphatic C–H stretching features. NGC 1333 and IRAS 03035+5819 are both excited by an B0V star of and their PAH aliphatic fractions are comparable to that of BD+303639 (PN), but appreciably higher than that of S106 (PDR). Both BD+303639 and S106 are illuminated by stars with , just like NGC 1333 and IRAS 03035+5819.
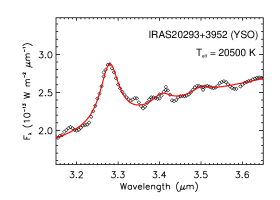
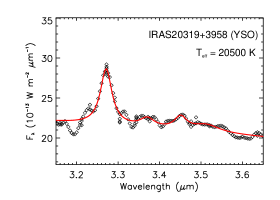
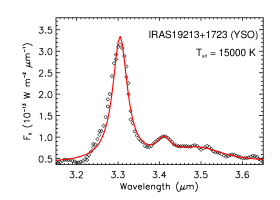
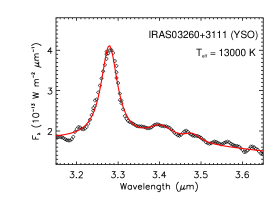
Figure 10 shows the near-IR spectra of four YSOs. All four objects show several sub-features at 3.4–3.6 attributed to aliphatic C–H stretches. The PAH aliphatic fraction does not show any strong dependence on .
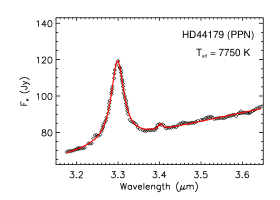
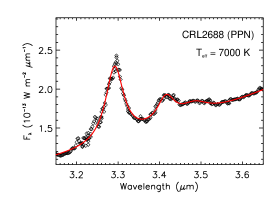
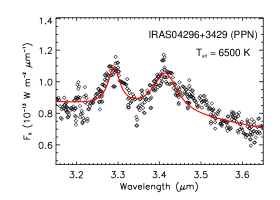
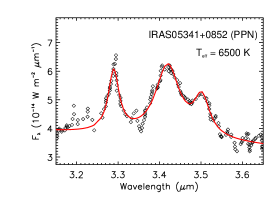
We show in Figure 11 the aliphatic and aromatic C–H stretching features of four PPNe. Except the Red Rectangle illuminated by HD 44179 of , PAHs in these PPNe are rich in aliphatic contents and their aliphatic fractions are high, with for IRAS 04296+3429, for IRAS 05341+0852, and for CRL 2688. All these three aliphatic-rich PPNe are excited by cool stars which lack UV photons ( for IRAS 04296+3429 and IRAS 03541+0852, and for CRL 2688). This suggests that, in UV-poor regions, once attained, PAHs are capable of maintaining their aliphatic sidegroups without being stripped off. Nevertheless, the Red Rectangle, also illuminated by a cool star with little UV radiation, shows very weak emission at 3.4 and the PAH aliphatic fraction is only 0.3%. This indicates that, in addition to the “hardness” of the exciting stellar photons, some other factors (e.g., the starlight intensity) are also at play in affecting the PAH aliphatic fractions.
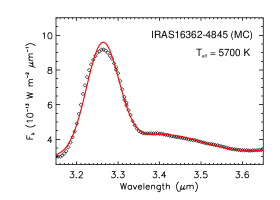
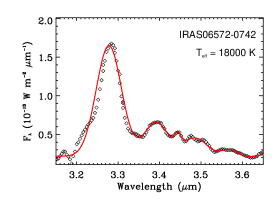
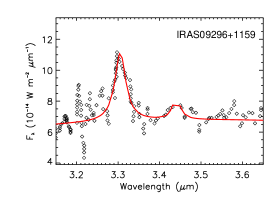
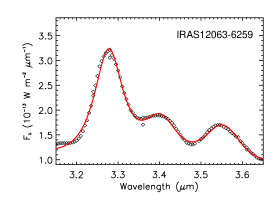
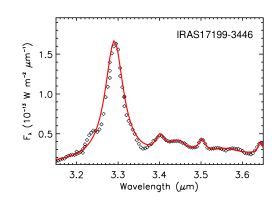
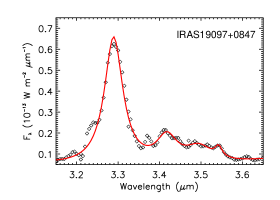
Among our 24 Galactic sources, six objects lack information about their illuminating stars. Their near-IR spectra are shown in Figure 12 and the intensity of the aliphatic C–H stretching feature (relative to the aromatic C–H feature) varies substantially, from essentially no 3.4 emission in IRAS 16362-4845 to highly aliphatic in IRAS 12063-6259 () and in IRAS 06572-0742 (). IRAS 16362-4845 exhibits a smooth, flat continuum at 3.4–3.6. The PAH aliphatic fractions of IRAS 09296+1159 (), IRAS 17199-3446 (), and IRAS 19097+0847 () are moderate.
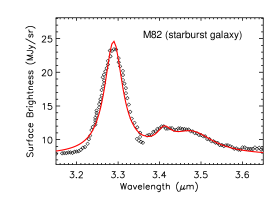
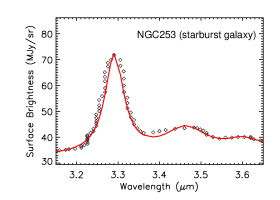
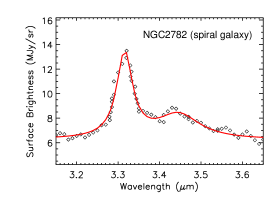
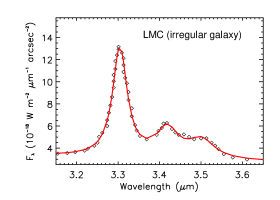
Figure 13 shows the aliphatic and aromatic C–H stretches of four nearby galaxies. They all show considerable emission at 3.4 and their PAH aliphatic fractions all exceed 7%. The Large Magellanic Cloud (LMC) and NGC 253, a dusty starburst galaxy, also show a weak sub-feature at 3.5 and 3.6, respectively. It is not clear if (and how) the galaxy metallicity affects the PAH aliphatic fraction. It has long been known that, since the ISO time, the PAH abundance decreases as the metallicity drops (see Li 2020 and references therein). It is unclear if the presence and the intensity of the 3.4 feature (relative to the 3.3 feature) are related to the metallicity. In this respect, JWST, with its unprecedented sensitivity and spatial resolution, will allow an in-depth study. In principle, in low-metallicity regions, PAHs are less likely to attain aliphatic sidegroups because of the low C/H ratio (and therefore low –CH3 abundance) and more likely to attain extra H atoms to be superhydrogenated. As the intrinsic strength of the 3.4 aliphatic C–H stretch of superhydrogenated PAHs is close to that of PAHs with aliphatic sidegroups (see Yang et al. 2020), observationally, it is difficult to distinguish whether the 3.4 feature arises from superhydrogenated PAHs or from PAHs with aliphatic sidegroups. Also, it is not clear if (and how) the 3.4 feature is affected by the star formation rate. We await JWST for quantitative investigations.
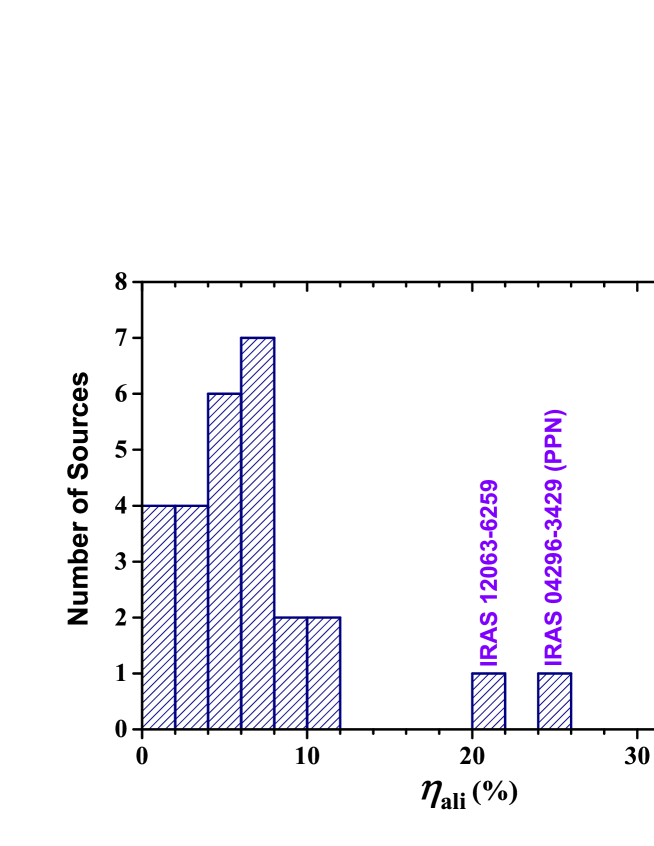
In Figure 14 we show the PAH aliphatic fraction distribution of our sample of 28 sources. It can be seen that the majority (24/28) of these sources has . The median of the PAH aliphatic fraction is . Two PPNe—IRAS 04296+3429 () IRAS 05341+0852 ()—are unusually rich in aliphatics. Another object—IRAS 12063-6259 () of which the exact nature is unknown—also has a large aliphatic content.
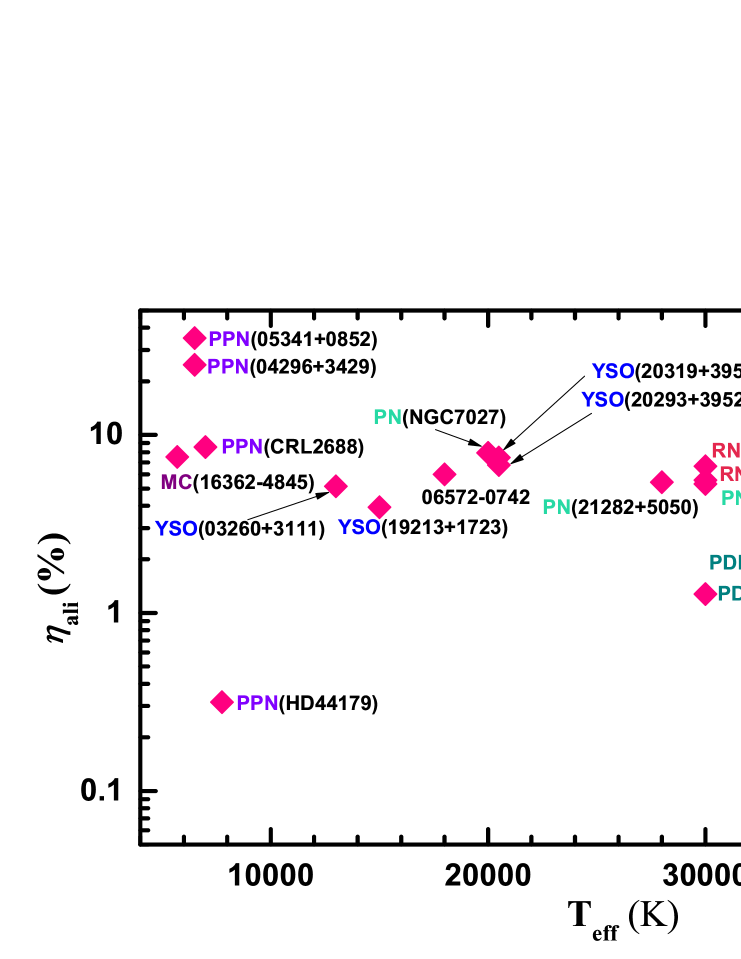
We explore whether (and how) the PAH aliphatic fraction varies with astrophysical environments (e.g., hardness of the exciting starlight photons). As shown in Figure 15, appears higher in regions illuminated by stars with lower . Indeed, as discussed above, it is generally true that in UV-poor PPNe the 3.4 emission feature (relative to the 3.3 feature) is much stronger than that of PNe, RNe, and PDRs (see Figure 11). Nevertheless, the Red Rectangle, a PPN illuminated by HD 44179 of , has a rather low , much lower than that of PDR and RNs illuminated by stars of much higher . This implies that, not only the hardness but also the intensity of the starlight may affect the accumulation and survival of aliphatic sidegroups attached to PAHs. This can be studied in more detail by future JWST/NIRSpec observations of spatially-resolved PAH spectra. Previously, the spatial variations of with the exciting UV starlight intensities have been investigated (e.g., see Joblin et al. 1996, Sloan et al. 1997, Goto et al. 2003). Again, with its unprecedented sensitivity and spatial resolution, JWST will allow us to explore the spatial variations of the PAH aliphatic fractions and their relations to the physical and chemical conditions in an unprecedented depth.
While the 3.4 aliphatic C–H emission is widely seen in various astrophysical environments, prior to JWST, the detection of the 6.85 and 7.25 aliphatic C–H deformation bands is rare and has so far been reported only in a couple dozen objects, mostly based on the observations made with the Infrared Spectrograph (IRS) on board the Spitzer Space Telescope and the Shorter Wavelength Spectrometer (SWS) on board ISO (see Sloan et al. 2014, Yang et al. 2016a). This will change with the launch of JWST: due to its unprecedented sensitivity, the MIRI spectrometer is well suited for detecting the 6.85 and 7.25 bands (while the NIRSpec spectrograph is ideal for detecting the 3.4 band). A combination of the 3.4, 6.85 and 7.25 bands would allow us to probe the aliphatic contents of large PAHs (e.g., see Li & Draine 2012). It is interesting to note that, in some planetary nebulae, where the 3.4 emission is observed, an 5.25 band is often also seen. The 5.25 band is thought to be coming from large compact PAHs (see Boersma et al. 2009). Larger compact PAHs with aliphatic side groups should be more eligible to survive in environments illuminated by cool stars. It would be interesting to consider, in the JWST era, large aliphatic PAHs in a theoretical framework similar to that presented in §2 and see if any correlations exist between these bands.
Finally, we note that the 3.4 band could also arise from superhydrogenated PAHs whose edges contain excess H atoms (Bernstein et al. 1996, Sandford et al. 2013, Yang et al. 2020). The addition of excess H atoms to PAHs converts the flat sp2 aromatic bonding of their asscoiated C atoms into tetrahedral sp3 aliphatic bonding, resulting in the creation of aliphatic C–H stretching bands. Compared with methylated PAHs in which one aliphatic C atom corresponds to three aliphatic C–H bonds, for superhydrogenated PAHs, one “superhydrogenated” C atom corresponds to two aliphatic C–H bonds. For superhydrogenated PAHs, the ratio of the intensity of the 3.4 aliphatic C–H stretch to that of the 3.3 aromatic C–H stretch (Yang et al. 2020) is similar to that of methylated PAHs (; Yang et al. 2013, 2017b). Therefore, the aliphatic fraction as defined in eq.12 would be higher by a factor of , if the observed 3.4 emission is attributed to superhydrogenated PAHs.
5 Summary
To facilitate a quantitative analysis of the aliphatic and aromatic contents of PAHs in the JWST era, we have proposed a theoretical framework for determining the aliphatic fractions () of PAHs and have applied the framework to pre-JWST UIE data. Our major results are as follows:
-
1.
An analytical formula for relating the PAH aliphatic fraction () to the emission intensity ratio of the 3.4 feature to the 3.3 feature () is presented. This relation is somewhat dependent on the “hardness” of the exciting stellar photons measured by the stellar effective temperature ().
-
2.
To demonstrate the effectiveness of this framework (of deriving from ), we have compiled the 3.3 and 3.4 UIE data obtained in the pre-JWST era for an as complete as possible sample of 28 Galactic and extragalactic sources. We have then applied the – relation to these pre-JWST data.
-
3.
We have derived the PAH aliphatic fraction for each source from the observed band ratio and found a median aliphatic fraction of . Generally, the aliphatic fractions are the highest in protoplanetary nebulae illuminated by cool stars lacking UV radiation. However, the hardness of stellar photons is not the only factor affecting the PAH aliphaticity, other factors such as the starlight intensity may also play an important role.
References
- (1) Allamandola, L.J., Tielens, A.G.G.M., & Barker, J.R. 1985, ApJ, 290, L25
- (2) Allamandola, L. J., Boersma, C., Lee, T. J., et al. 2021, ApJL, 917, L35
- (3) Barker, J. R., Allamandola, L. J., & Tielens, A.G.G.M. 1987, ApJ, 315, L61
- (4) Bernstein, L. S., Shroll, R. M., Lynch, D. K., & Clark, F. O. 2017, ApJ, 836, 229
- (5) Bernstein, M.P., Sandford, S.A., & Allamandola, L.J. 1996, ApJ, 472, L127
- (6) Boersma, C., Mattioda, A. L., Bauschlicher, C. W., et al. 2009, ApJ, 690, 1208
- (7) Buragohain, M., Pathak, A., Sarre, P., Onaka, T., & Sakon, I. 2015, MNRAS, 454, 193
- (8) Buragohain, M., Pathak, A., Sarre, P., Onaka, T., & Sakon, I. 2016, Planet. Space Sci., 133, 97
- (9) Buragohain, M., Pathak, A., Sakon, I., & Onaka, T. 2020, ApJ, 892, 11
- (10) Draine, B.T., & Li, A. 2001, ApJ, 551, 807
- (11) Draine, B.T., & Li, A. 2007, ApJ, 657, 810
- (12) Geballe, T.R., Lacy, J.H., Persson, S.E., McGregor, P. J., & Soifer, B.T. 1985, ApJ, 292, 500
- (13) Geballe, T. R. & van der Veen, W. E. C. J. 1990, A&A, 235, L9
- (14) Geballe, T. R., Tielens, A. G. G. M., Kwok, S., & Hrivnak, B. J. 1992, ApJL, 387, L89
- (15) Goto, M., Gaessler, W., Hayano, Y., et al. 2003, ApJ, 589, 419
- (16) Joblin, C., Tielens, A.G.G.M., Allamandola, L.J., & Geballe, T.R. 1996, ApJ, 458, 610
- (17) Jones, A. P., Fanciullo, L., Köhler, M., et al. 2013, A&A, 558, A62
- (18) Jourdain de Muizon, M., Geballe, T.R., d’Hendecourt, L.B., & Baas, F. 1986, ApJ, 306, L105
- (19) Jourdain de Muizon, M., d’Hendecourt, L. B., & Geballe, T. R. 1990, A&A,, 227, 526
- (20) Kondo, T., Kaneda, H., Oyabu, S., et al. 2012, ApJ, 751, L18
- (21) Kurucz, R.L. 1979, ApJS, 40, 1
- (22) Kwok, S. 2022, Ap&SS, 367, 16
- (23) Kwok, S., & Zhang, Y. 2011, Nature, 479, 80
- (24) Léger, A., & Puget, J.L. 1984, A&A, 137, L5
- (25) Li, A., 2004, in Astrophysics of Dust, Witt, A.N., Clayton, G.C., & Draine, B.T. (eds.), ASP Conf. Ser., 309, 417
- (26) Li, A. 2020, Nature Astronomy, 4, 339
- (27) Li, A., & Draine, B.T. 2001, ApJ, 554, 778
- (28) Li, A., & Draine, B.T. 2012, ApJ, 760, L35
- (29) Lyu, J.W., Yang, X.J., Li, A., et al. 2023, in preparation
- (30) Mathis, J.S., Mezger, P.G., & Panagia, N. 1983, A&A, 128, 212
- (31) Mori, T. I., Onaka, T., Sakon, I., et al. 2014, ApJ, 784, 53
- (32) Onaka, T., Nakamura, T., Sakon, I., et al. 2018, ApJ, 853, 31
- (33) Pilleri, P., Joblin, C., Boulanger, F., et al. 2015, A&A, 577, A16
- (34) Papoular, R., Breton, J., Gensterblum, G., Nenner, I., Papoular, R. J., & Pireaux, J.-J. 1993, A&A, 270, L5
- (35) Rouillé, G., Steglich, M., Carpentier, Y., et al. 2012, ApJ, 752, 25.
- (36) Sakata, A., Wada, S., Onaka, T., & Tokunaga, A.T. 1987, ApJ, 320. L63
- (37) Sandford, S.A., Bernstein, M. P., & Materese, C.K. 2013, ApJS, 205, 8
- (38) Sloan, G.C., Bregman, J.D., Geballe, T.R., Allamandola, L.J., & Woodward, C.E. 1997, ApJ, 474, 735
- (39) Sloan, G. C., Jura, M., Duley, W. W., et al. 2007, ApJ, 664, 1144
- (40) Sloan, G. C., Lagadec, E., Zijlstra, A. A., et al. 2014, ApJ, 791, 28
- (41) Spilker, J. S., Phadke, K. A., Aravena, M., et al. 2023, Nature, 618, 708
- (42) Steglich, M., Jäger, C., Huisken, F., et al. 2013, ApJS, 208, 26
- (43) Yamagishi, M., Kaneda, H., Ishihara, D., et al. 2012, A&A, 541, A10
- (44) Yang, X. J., Glaser, R., Li, A., & Zhong, J. X. 2013, ApJ, 776, 110
- (45) Yang, X. J., Glaser, R., Li, A., & Zhong, J. X. 2016a, MNRAS, 462, 1551
- (46) Yang, X. J., Li, A., Glaser, R., & Zhong, J. X. 2016b, ApJ, 825, 22
- (47) Yang, X. J., Li, A., Glaser, R., & Zhong, J. X. 2017a, ApJ, 837, 171
- (48) Yang, X. J., Glaser, R., Li, A., & Zhong, J. X. 2017b, New Astron. Rev., 77, 1
- (49) Yang, X. J., Li, A., & Glaser, R. 2020, ApJS, 247, 1
| (K) | Neutral PAHs | Cationic PAHs |
|---|---|---|
| 3500 | 2.06 | 4.38 |
| 6000 | 1.98 | 4.20 |
| 10000 | 1.93 | 4.14 |
| 22000 | 1.84 | 3.97 |
| 30000 | 1.81 | 3.96 |
| Average | 1.92 | 4.13 |
| Stdev | 0.09 | 0.16 |
| Object | Type | Correlation | |||
|---|---|---|---|---|---|
| (K) | Slope | (%) | |||
| IRAS 18416-0420 | PDR | 40000 | 1.87 | 0.15 | 2.33 |
| Orion Bar | PDR | 39000 | 1.86 | 0.11 | 1.74 |
| IRAS 19442+2427 | PDR | 36000 | 1.84 | 0.17 | 2.67 |
| S106 | PDR | 30000 | 1.81 | 0.08 | 1.28 |
| IC418 | PN | 36700 | 1.84 | 0.01 | 0.08 |
| BD+303639 | PN | 30000 | 1.81 | 0.34 | 5.30 |
| IRAS 21282+5050 | PN | 28000 | 1.81 | 0.35 | 5.42 |
| NGC7027 | PN | 20000 | 1.84 | 0.53 | 7.94 |
| IRAS 03035+5819 | RN | 30000 | 1.81 | 0.43 | 6.67 |
| NGC 1333 | RN | 30000 | 1.81 | 0.36 | 5.58 |
| IRAS 20293+3952 | YSO | 20500 | 1.83 | 0.49 | 7.47 |
| IRAS 20319+3958 | YSO | 20500 | 1.83 | 0.44 | 6.78 |
| IRAS 19213+1723 | YSO | 15000 | 1.87 | 0.26 | 3.93 |
| IRAS 03260+3111 | YSO | 13000 | 1.90 | 0.34 | 5.15 |
| HD44179 | PPN | 7750 | 1.97 | 0.02 | 0.32 |
| CRL2688 | PPN | 7000 | 1.98 | 0.62 | 8.56 |
| IRAS 04296+3429 | PPN | 6500 | 1.99 | 2.18 | 24.79 |
| IRAS 05341+0852 | PPN | 6500 | 1.99 | 3.56 | 34.94 |
| IRAS 16362-4845 | MC | 5700 | 2.00 | 0.54 | 7.54 |
| IRAS 06572-0742 | … | 18000 | 1.85 | 0.39 | 6.00 |
| IRAS 09296+1159 | … | … | 1.92 | 0.24 | 3.54 |
| IRAS 12063-6259 | … | … | 1.92 | 1.64 | 20.37 |
| IRAS 17199-3446 | … | … | 1.92 | 0.32 | 4.82 |
| IRAS 19097+0847 | … | … | 1.92 | 0.31 | 4.59 |
| M82 | starburst galaxy | … | 1.92 | 0.58 | 8.35 |
| NGC253 | starburst galaxy | … | 1.92 | 0.52 | 7.48 |
| NGC2782 | spiral galaxy | … | 1.92 | 0.81 | 11.26 |
| LMC | irregular galaxy | … | 1.92 | 0.72 | 10.06 |