11email: hideki.umehata@riken.jp 22institutetext: Institute of Astronomy, Graduate School of Science, The University of Tokyo, 2-21-1 Osawa, Mitaka, Tokyo 181-0015, Japan 33institutetext: Centre for Extragalactic Astronomy, Department of Physics, Durham University, South Road, Durham DH1 3LE, UK 44institutetext: Research Center for the Early Universe, Graduate School of Science, The University of Tokyo, 7-3-1 Hongo, Bunkyo-ku, Tokyo 113-0033, Japan 55institutetext: Division of Particle and Astrophysical Science, Graduate School of Science, Nagoya University, Aichi 464-8602, Japan 66institutetext: National Astronomical Observatory of Japan, 2-21-1, Osawa, Mitaka, Tokyo 181-8588, Japan 77institutetext: Purple Mountain Observatory and Key Laboratory for Radio Astronomy, Chinese Academy of Sciences, Nanjing, China 88institutetext: School of Astronomy and Space Science, University of Science and Technology of China, Hefei, China 99institutetext: Research Center for Space and Cosmic Evolution, Ehime University, Bunkyo-cho 2-5, Matsuyama 790-8577, Japan 1010institutetext: Department of Astronomical Science, SOKENDAI (The Graduate University for Advanced Studies), Mitaka, Tokyo 181-8588, Japan
ALMA Deep Field in SSA22:
Deep surveys with the Atacama Large Millimeter Array (ALMA) have uncovered a population of dusty star-forming galaxies which are faint or even undetected at optical to near-infrared wavelengths. Their faintness at short wavelengths makes the detailed characterization of the population challenging. Here we present a spectroscopic redshift identification and a characterization of one of these near-infrared-dark galaxies discovered by an ALMA deep survey. The detection of [C i](1-0) and CO(4-3) emission lines determines the precise redshift of the galaxy, ADF22.A2, to be . On the basis of a multi-wavelength analysis, ADF22.A2 is found to be a massive, star-forming galaxy with a stellar mass of and SFR yr-1. The molecular gas mass was derived to be , indicating a gas fraction of , and the ratios of and suggest that the nature of the interstellar medium in ADF22.A2 is in accordance with those of other bright submillimeter galaxies. The properties of ADF22.A2, including the redshift, star-formation rate, stellar mass, and depletion time scale ( Gyr), also suggest that ADF22.A2 has the characteristics expected for the progenitors of quiescent galaxies at . Our results demonstrate the power of ALMA contiguous mapping and line scan, which help us to obtain an unbiased view of galaxy formation in the early Universe.
Key Words.:
submillimeter: galaxies – galaxies: starburst – galaxies: high-redshift – submillimeter: ISM – galaxies: evolution –1 Introduction
Intense star-forming activity in a growing galaxy is often obscured by dust in the early Universe. The absorption of stellar emission and reradiation by dust make the galaxy apparently faint at optical-to-near-infrared wavelengths even though they have star-formation rates of 100-1000 yr-1 (Blain et al. 2002; Casey et al. 2014 for reviews). Consequently it is challenging to recognize a fraction of star-forming galaxies selected at (sub)millimeter even in a deep near-infrared image. Such a ”near-infrared-dark” population was first identified among bright submillimeter galaxies (SMGs) (e.g., Dey et al. 1999; Smail et al. 1999; Frayer et al. 2004). The faintness makes it difficult to determine spectroscopic redshift using traditional spectroscopic observations at (observed) optical-to-near infrared wavelengths, which has been a major obstacle in studying these populations. As an alternative, bright rest-frame far-infrared (FIR) lines such as [C ii] and CO lines has been utilized to determine , which undoubtedly shows that they are heavily dust-obscured star-forming galaxies at high redshift. For instance, Wang et al. (2009) placed a strong upper limit (=27.3 AB at 3) on GN10 at (the redshift has been reported by Pavesi et al. 2018), and Walter et al. (2012) found that HDF850.1, which has no counterpart on an HST image, is located at .
Following these works in the era when the Atacama Large Millimeter/submillimeter Array (ALMA) had not been available, the advent of interferometers such as ALMA has allowed us to detect and precisely locate fainter and more abundant (sub)millimeter populations. One avenue of research is follow-up observations of SMGs that were originally discovered by a single-dish telescope. For instance, Simpson et al. (2014) found ten SMGs which were detected at 3.6 m, but they were blank at shorter wavelengths. While obtaining a spectroscopic redshift of these types of near-infrared-dark SMGs is still not easy, a handful of these galaxies are now placed at via molecular and atomic line detections at (sub)millimeter and the number is increasing (e.g., Swinbank et al. 2012; Riechers et al. 2017; Oteo et al. 2018; Casey et al. 2019; Jin et al. 2019; Jiménez-Andrade et al. 2020; Riechers et al. 2020).
ALMA deep surveys, which use many pointings to create a contiguous field, are another avenue of research to measure dust-obscured star-forming activity across the cosmic time (e.g., Tadaki et al. 2015; Umehata et al. 2015; Walter et al. 2016; Dunlop et al. 2017). Some of the galaxies identified by these types of surveys are known to be blank at the H-band (“HST-dark”; e.g., Franco et al. 2018) and Ks-band (e.g., Umehata et al. 2015; Yamaguchi et al. 2016; 2019). The existence of the near-infrared-dark ALMA galaxies has also been uncovered using another approach. Wang et al. (2019) report the identifications of ALMA sources which were originally selected as “H-dropout” galaxies, which are IRAC sources without HST/WFC3 F160W counterparts. They suggest that these types of “ALMA-detected H-dropouts” are the bulk populations of massive ( ) star-forming galaxies at and that they dominate the total star-formation rate density at such a massive regime in the era (see also Dudzevičiūtė et al. 2020).
These works suggest that some fraction of galaxies could have been missed in previous studies on the basis of the optical-to-near-infrared selection. Charting the nature of the near-infrared-dark ALMA galaxies is necessary for a comprehensive view of galaxy formation and evolution in the early Universe. While the faintness of the optical-to-near-infrared emission makes the spectroscopy in these types of bands quite challenging, the search for molecular and atomic lines at the (sub)millimeter wavelengths can be a solution. In this letter, we report a secure redshift identification of a near-infrared-dark galaxy discovered by an ALMA deep survey. We derive properties of the interstellar medium (ISM) and discuss the role of these types of galaxies in the galaxy formation history. Throughout this letter, we adopt a cosmology with , and H0=70 km s-1 Mpc-1.
2 Observations
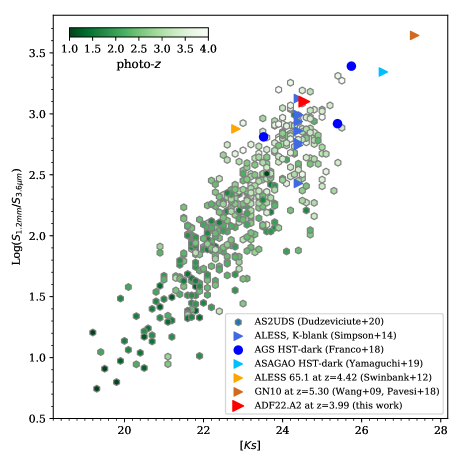
Our target, ADF22.A2, was originally discovered through our ALMA deep survey in the SSA22 field. This field represents a significant proto-cluster at (e.g., Steidel et al. 1998; Hayashino et al. 2004; Yamada et al. 2012), and the ALMA mosaic was designed to observe a region located at the proto-cluster core at 1.1 mm (ALMA deep field in SSA22 or ADF22; Umehata et al. 2015; 2017; 2018; 2019; Hayatsu et al. 2017). ADF22.A2 is the second brightest source in a subregion among ADF22 (ADF22A) with a flux density of mJy (Umehata et al. 2017). ADF22.A2 was detected at 3.6 m and 4.5 m, while it was completely invisible even at the Ks-band or shorter wavelengths (Table. 1). In this work, we refer to ALMA-identified galaxies, which have no detectable counterpart at optical-to-near-infrared wavelengths, as “near-infrared-dark” galaxies. ADF22.A2 is then an example of the population. While this practical selection allows us to shed light on the populations which are missed in optical-to-near infrared surveys on the basis of an available data set, it is not straightforward to compare galaxies between different works since there are a wide variety of data sets, including bands and depths as well as the brightness of galaxies. Considering this ambiguity, we compared ADF22.A2 with other near-infrared-dark ALMA galaxies (Wang et al. 2009; Swinbank et al. 2012; Simpson et al. 2014; Franco et al. 2018; Yamaguchi et al. 2019) and a systematical sample of ALMA-identified SMGs (Dudzevičiūtė et al. 2020) in Fig. 1, where the Ks-band magnitude and a flux ratio (Log ()) are displayed. ADF22.A2 and the majority of the near-infrared-dark populations are characterized as faint at the -band ( AB) and have a low / flux ratio (), which naively suggests that they are at a higher redshift and/or have a lower stellar mass among the ALMA-identified galaxies (see also Simpson et al. 2014).
Band 3 observations of ADF22.A2 were performed at two frequency set-ups. The first was carried out as a part of project 2015.1.00212.S and 2016.1.00543.S (PI. H. Umehata for both) at 84.1–87.8 GHz and 96.1–99.8 GHz (Umehata et al. 2019). The 36–44 available antennas were used and observations were executed in two periods; the former one was between 2016 July 21 and 2016 August 19, and the latter one was between 2017 May 7 and 2017 July 4. These resulted in the total on-source time of 13.9 hours for a 13-point mosaic, covering the 7 arcmin2 area which is nearly cospatial with the 1.1 mm mosaic in ADF22A. J2226+0052 and J2148+0657 were observed for bandpass and phase calibration. To set the absolute flux scale, Pallas, J2148+0657, J2232+1143 and Titan were observed. Subsequently, ADF22.A2 was observed as a part of project 2017.1.00602.S (PI. N. H. Hayatsu) at 91.4–95.2 GHz and 103.4–107.2 GHz. Observations were carried out with 43-45 usable 12 m antennas between 2018 January 18 and 20. The total on-source time was 263 min. The quasar J2148+0657 was utilized for the bandpass, phase, and flux calibration.
The ALMA data were reduced using the Common Astronomy Software Application (casa) versions 4.7.0, 4.7.2, 5.1.0, and 5.4.0 (McMullin et al. 2007). The data were processed using the standard casa pipeline. The calibrated visibility data were used for imaging with the casa task tclean. We created dirty cubes with a 100 km s-1 velocity bin, applying uvtaper, which yields the synthesized beam sizes of . The dirty cubes were utilized to identify emission lines. For the identified lines, cleaning was done down to . As we show, we detected a bright CO(4-3) line, and hence we also repeated the clean process without any tapering for the spectral window which encompasses the line. A band 3 continuum map was also created using line-free channels without tapering, which have the synthesized beam (P.A. deg) and a typical root mean square (RMS) noise of 44 Jy beam-1.
| RA (ALMA, ICRS) | 22 17 36.11 |
|---|---|
| Dec. (ALMA, ICRS) | 00 17 36.70 |
| (ALMA) | 2.02 0.02 |
| (ALMA) | |
| MegaCam 0.381 m | |
| Suprime-Cam 0.437 m | |
| Suprime-Cam 0.545 m | |
| Suprime-Cam 0.651 m | |
| Suprime-Cam 0.768 m | |
| Suprime-Cam 0.920 m | |
| MOIRCS 1.25 m | |
| MOIRCS 1.63 m | |
| MOIRCS 2.15 m | |
| IRAC 3.6 m | |
| IRAC 4.5 m | |
| IRAC 5.6 m | |
| IRAC 8.0 m | |
| SPIRE 250 m | |
| SPIRE 350 m | |
| SPIRE 500 m | |
| SCUBA2 850 m | 3.67 1.18 |
| JVLA 3 GHz |
3 Results
3.1 Line detections and spectroscopic redshift
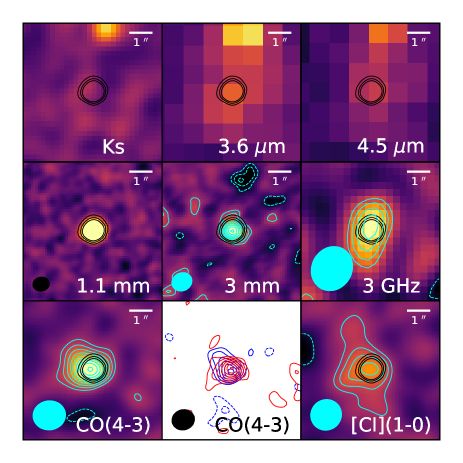
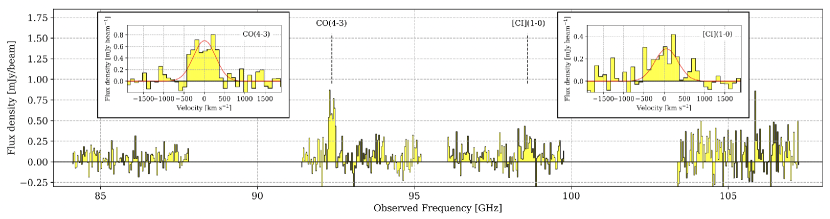
As is shown in Fig. 2 and Fig. 3, we successfully detected two emission lines in the combined band 3 spectra at around 92.4 GHz and 98.6 GHz, which provides an unambiguous redshift of for CO(4-3) ( GHz) and [C i](1-0) ( GHz). The redshift was determined from a one-component Gaussian profile fitting to the CO(4-3) spectra, which has a superior signal-to-noise ratio (S/N), while the [C i](1-0) line profile shows a consistent value . Line fluxes were primary estimated from the Gaussian profile fit to the spectra extracted at a centroid position in an integrated line-emission map. We also measured the CO(4-3) flux on the integrated emission map using the casa task imfit to find a slightly (16%) larger value. We finally adopted fluxes of Jy km s-1 and Jy km s-1, while applying the aperture correction. These estimates correspond to line luminosities ) and ) , respectively. We note that the brightness distributions of the [C i](1-0) and CO(4-3) emission lines can decrease due to the effect of the cosmic microwave background (CMB) at (da Cunha et al. 2013a; Zhang et al. 2016), though it is difficult to properly estimate the effect on ADF22.A2.
3.2 Stellar mass, IR luminosity, and SFR
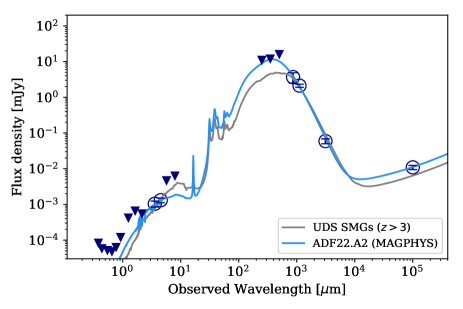
To infer several physical parameters making use of the precise redshift, we applied the high-redshift extension of the SED-fitting algorithm magphys which includes the effects of dust attenuation (Charlot & Fall 2000) and describes star formation history by a range of ages and star formation time scales (da Cunha et al. 2008; 2013b). We used the available photometry, which cover optical-to-near infrared (from the U band to Spitzer IRAC 8 m; Umehata et al. 2014 and references therein), Herschel/SPIRE bands (Kato et al. 2016), SCUBA2 (Geach et al. 2017), ALMA band 6 (Umehata et al. 2017), band 3, and JVLA 3 GHz (Ao et al. 2017). The 3 mm continuum flux was measured to be Jy using casa/imfit. While we measured flux densities at the optical to near-infrared through aperture photometries in the same manner as is reported in Umehata et al. (2014), the counterpart in IRAC 3.6 m and 4.5 m images is close to a foreground object and thus we estimated the fluxes deblending the two using GALFIT (Peng et al. 2002) (see Appendix for details). The SPIRE fluxes were also deblended in same manner as in Swinbank et al. (2014). The photometry and best-fit SED are shown in Fig. 4 and Table. 1. For comparison purposes, averaged SEDs, which were derived for SMGs in the UDS field using the same code, magphys, and scaled at 1.1 m flux, are displayed (Dudzevičiūtė et al. 2020). A large fraction of the ADF22.A2 photometry is also explainable by the template, which indicates that ADF22.A2 may have similar characteristics as the other SMGs at .
We note that ADF22.A2 has no X-ray counterpart (Lehmer et al. 2009) and thus the existence of an X-ray active galactic nucleus (AGN) has not been identified. The 3 GHz radio continuum emission is also well fitted by magphys, which suggests ADF22.A2 show a general, far-infrared correlation, and are not associated with a radio-loud AGN. Due to the relatively poor constraints around the peak of the SED, the derived dust properties might be more uncertain. The effect of the CMB on the continuum flux in the Rayleigh-Jeans regime (e.g., da Cunha et al. 2013a; Jin et al. 2019) is also not considered in this paper.
The fitting yields median values and 68% confidence intervals for the stellar mass , the infrared luminosity , and the star-formation rate yr-1. We note that the relatively large uncertainties principally arose due to the limited number of available photometry points. The faintness at optical-to-near-infrared wavelengths, including the non-detection at the restframe around 1.6 m, hampered us from putting a constraint on the and age as well as the stellar mass. The peak (or shorter wavelength) regime of the dust SED is only constrained by limits and hence it is difficult to constrain the related properties. The initial mass function (IMF) can also have an impact these derived properties. We adopted a Chabrier IMF (Chabrier 2003) (but see also Zhang et al. 2018).
3.3 Molecular gas mass and gas mass conversion factor
The total molecular gas mass stored in ADF22.A2 was also estimated in three ways. First, we utilized the [C i](1–0) emission as a tracer of the gas mass. The [C i](1–0) line is proposed to be a measure of the molecular gas mass. The critical density is similar to that of CO(1–0). Moreover [C i] is sensitive to CO-dark molecular gas where cosmic rays can destroy CO (e.g., Papadopoulos & Greve 2004; Bothwell et al. 2017; Jiao et al. 2017). We calculated the [C i]-based H2 mass, assuming an optically thin case, following Papadopoulos & Greve (2004):
| (1) |
where is the abundance ratio of [C i]/H2. Here we adopt (Papadopoulos & Greve 2004; Bothwell et al. 2017). The Einstein coefficient s-1 was incorporated. We used the excitation factor (Bothwell et al. 2017; Oteo et al. 2018). Then Equation (1) gives . Second, we also estimated the total H2 mass using CO(4–3), though caution should be exercised since such a mid- transition line traces relatively dense and warm molecular gas. If we assume a brightness temperature ratio of and the conversion factor =1.0 (K km s-1pc2)-1 (Ivison et al. 2011; Riechers et al. 2011; Bothwell et al. 2013), the observed CO(4-3) line intensity suggests a molecular gas mass of . Thirdly, we made use of the dust mass as a tracer. The dust mass derived by SED fitting using magphys is . Assuming a dust-to-gas mass conversion factor of 120 (Wilson et al. 2008), this implies a molecular gas mass of . Thus estimates using the three methods are consistent. In this paper, we use the [C i]-based gas mass in the following discussion. Finally we checked a diversity of derived , which brought the derived molecular gas mass with different tracers into agreement. The measurements on the basis of [C i] and dust give and through the comparison with CO-based gas mass, respectively. Thus the conversion factors derived from three clues are generally in good agreement for ADF22.A2, while there are a number of assumed parameters including and a dust-to-gas mass conversion.
4 Discussion and conclusion
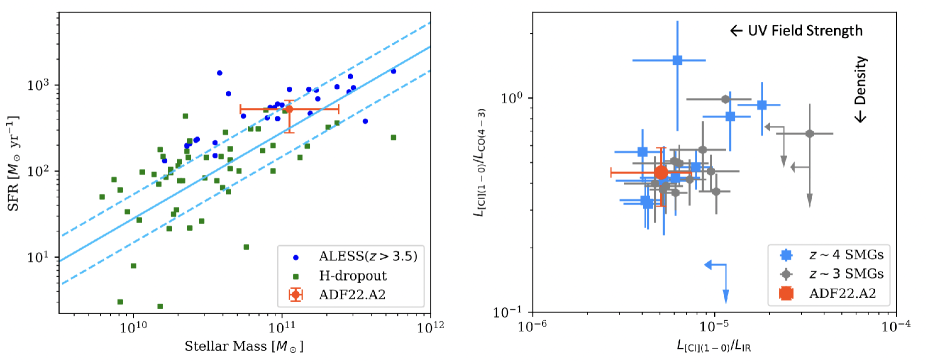
The robust identification of its redshift, , and the suite of multi-wavelength data sets pave the way to identify an example of near-infrared-dark galaxies in the history of galaxy assembly and understand the physical and chemical properties of these types of populations. The left panel of Fig. 5 shows the relation between the stellar mass and SFR for ADF22.A2, compared with two other samples of near-infrared-dark galaxies and the “main-sequence” relation at derived by Schreiber et al. (2017) on the basis of ALMA band 7 observations. The panel suggests that ADF22.A2 is characterized by massive dusty star-forming galaxies, which are located around (or above) the main-sequence at . ADF22.A2 is also located at a region where SMGs selected by an ALMA Survey of Submillimetre Galaxies in the Extended Chandra Deep Field South (ALESS, da Cunha et al. 2015) and ”H-dropout” populations (Wang et al. 2019), which tend to be fainter at (sub)millimeter than the SMGs originally sampled as a single-dish source overlap, which indicates that ADF22.A2 shares the properties with both populations. This would be reasonable, considering the fact that ADF22.A2 was first identified by an ALMA deep survey (Umehata et al. 2015) and successively identified by SCUBA2 (Geach et al. 2017), while it was missed by the previous AzTEC/ASTE survey (Umehata et al. 2014).
Since ADF22.A2 was found in an ALMA deep survey which covers a significant cosmic volume contiguously, one can estimate the cosmic volume of the near-infrared-dark ALMA galaxies. Wang et al. (2019) estimated the number density of the H-dropout galaxies Mpc-3 on the basis of photometric redshifts. If we consider a similar redshift range () as was adopted in Wang et al. (2019), the cosmic volume covered by the region of ADF22A is Mpc3, and the expected number of these types of populations is around unity. Considering the fact that the detection limit is comparable between the works (Umehata et al. 2017; Wang et al. 2019) and that all of the 18 ADF22A sources now have spectroscopic redshifts (Umehata et al. 2019), both estimates are consistent. This gives another clue supporting the prevalence of the near-infrared-dark ALMA galaxies in the early Universe. We also note that there are some caveats, however. The sample in Wang et al. (2019) is for H-dropout galaxies, and the selection criteria are not perfectly equal to ours. Most of the spectroscopic redshifts of the H-dropout galaxies are still lacking; hence, they leave uncertainties as to the cosmic volume.
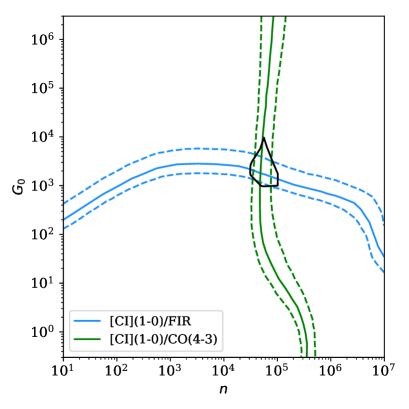
The detection of the [C i](1–0) and CO(4–3) lines, together with infrared luminosity, gives us a clue as to the nature of the ISM. We derived the gas density and the strength of the far-ultraviolet radiation field on the basis of the PDR model of Kaufman et al. (1999) and Kaufman et al. (2006). While dust continuum and [C i](1–0) emission are generally optically thin, CO emission is optically thick. We increase the observed CO luminosity by a factor of two to incorporate this effect. Fig. 6 shows the comparison between the observed ratios and the theoretical models. The PDR models suggest the atomic gas density of cm-3 and the UV radiation field for ADF22.A2 (Fig. 6). The right panel of Fig. 5 shows the ratios of and compared with lensed SMGs (Bothwell et al. 2017; Cañameras et al. 2018;Nesvadba et al. 2019) and SMGs (Alaghband-Zadeh et al. 2013). The consistency of the line ratios suggests that these characteristics, the UV radiation field strength and gas density of the ISMs within ADF22.A2, are similar to those of other dusty starburst galaxies selected from traditional bright SMG surveys. More samples of near-infrared-dark ALMA galaxies, which have measurements of [C i](1–0) and CO(4–3) lines, will pave the way to further characterize ISM properties of the population.
We also placed ADF22.A2 in the context of galaxy evolution across the cosmic time. Recently an increasing number of quiescent galaxies has been identified at (e.g., Schreiber et al. 2018; Tanaka et al. 2019; Valentino et al. 2019). These findings invoke the prevalent galaxy populations which experience an active star-forming phase at higher redshifts. The measurements of ADF22.A2 suggest a gas-mass fraction of , which are defined as /(). Together with a significant amount of stellar mass , the gas mass fraction indicates that ADF22.A2 is a relatively evolved system. The gas depletion time of ADF22.A2 is Gyr; hence, ADF22.A2 would evolve into a massive (log()) quiescent system at on the simple assumption that the galaxy simply consumes the estimated molecular gas reservoir with the constant star-formation rate. These results support the scenario that the near-infrared-dark ALMA populations are progenitors of quiescent galaxy populations at .
ADF22.A2 demonstrates that ALMA deep surveys are a powerful tool to obtain an unbiased picture of galaxy formation and evolution, exemplifying an intriguing galaxy which was identified and characterized by ALMA observations. Further systematic census will help us understand the general nature of the near-infrared-dark ALMA galaxies.
Acknowledgements.
We thank an anonymous referee for a number of constructive comments. We thank Ms. Ugne Dudzevičiūtė for providing catalogs and a SED template. We thank Prof. R. J. Ivison for useful discussions. H.U. and K.K. acknowledge support from JSPS KAKENHI grant (17K14252, 20H01953, 17H06130). This work was supported by the NAOJ ALMA Scientific Research Grant Number 2017-06B. I.R.S. and A.M.S. acknowledge support by the Science and Technology Facilities Council [grant number ST/P000541/1]. Y.A. acknowledges financial support by NSFC grant 11933011. This paper makes use of the following ALMA data: ADS/JAO. ALMA#2013.1.00162.S, #2015.1.00212.S, #2016.1.00543.S, #2017.1.00602.S. ALMA is a partnership of ESO (representing its member states), NSF (USA) and NINS (Japan), together with NRC (Canada), MOST and ASIAA (Taiwan), and KASI (Republic of Korea), in cooperation with the Republic of Chile. The Joint ALMA Observatory is operated by ESO, AUI/NRAO and NAOJ. The National Radio Astronomy Observatory is a facility of the National Science Foundation operated under cooperative agreement by Associated Universities, Inc. This paper is based on data collected at Subaru Telescope, which is operated by the National Astronomical Observatory of Japan. This work is based on observations made with the Spitzer Space Telescope, which is operated by the Jet Propulsion Laboratory, California Institute of Technology under a contract with NASA.References
- Alaghband-Zadeh et al. (2013) Alaghband-Zadeh, S., Chapman, S. C., Swinbank, A. M., et al. 2013, MNRAS, 435, 1493
- Ao et al. (2017) Ao, Y., Matsuda, Y., Henkel, C., et al. 2017, ApJ, 850, 178
- Blain et al. (2002) Blain, A. W., Smail, I., Ivison, R. J., Kneib, J. P., & Frayer, D. T. 2002, Phys. Rep, 369, 111
- Bothwell et al. (2017) Bothwell, M. S., Aguirre, J. E., Aravena, M., et al. 2017, MNRAS, 466, 2825
- Bothwell et al. (2013) Bothwell, M. S., Smail, I., Chapman, S. C., et al. 2013, MNRAS, 429, 3047
- Cañameras et al. (2018) Cañameras, R., Yang, C., Nesvadba, N. P. H., et al. 2018, A&A, 620, A61
- Casey et al. (2014) Casey, C. M., Narayanan, D., & Cooray, A. 2014, Phys. Rep, 541, 45
- Casey et al. (2019) Casey, C. M., Zavala, J. A., Aravena, M., et al. 2019, ApJ, 887, 55
- Chabrier (2003) Chabrier, G. 2003, PASP, 115, 763
- Charlot & Fall (2000) Charlot, S. & Fall, S. M. 2000, ApJ, 539, 718
- da Cunha et al. (2008) da Cunha, E., Charlot, S., & Elbaz, D. 2008, MNRAS, 388, 1595
- da Cunha et al. (2013a) da Cunha, E., Groves, B., Walter, F., et al. 2013a, ApJ, 766, 13
- da Cunha et al. (2013b) da Cunha, E., Walter, F., Decarli, R., et al. 2013b, ApJ, 765, 9
- da Cunha et al. (2015) da Cunha, E., Walter, F., Smail, I. R., et al. 2015, ApJ, 806, 110
- Dey et al. (1999) Dey, A., Graham, J. R., Ivison, R. J., et al. 1999, ApJ, 519, 610
- Dudzevičiūtė et al. (2020) Dudzevičiūtė, U., Smail, I., Swinbank, A. M., et al. 2020, MNRAS[arXiv:1910.07524]
- Dunlop et al. (2017) Dunlop, J. S., McLure, R. J., Biggs, A. D., et al. 2017, MNRAS, 466, 861
- Franco et al. (2018) Franco, M., Elbaz, D., Béthermin, M., et al. 2018, A&A, 620, A152
- Frayer et al. (2004) Frayer, D. T., Reddy, N. A., Armus, L., et al. 2004, AJ, 127, 728
- Geach et al. (2017) Geach, J. E., Dunlop, J. S., Halpern, M., et al. 2017, MNRAS, 465, 1789
- Hainline et al. (2009) Hainline, L. J., Blain, A. W., Smail, I., et al. 2009, ApJ, 699, 1610
- Hayashino et al. (2004) Hayashino, T., Matsuda, Y., Tamura, H., et al. 2004, AJ, 128, 2073
- Hayatsu et al. (2017) Hayatsu, N. H., Matsuda, Y., Umehata, H., et al. 2017, PASJ, 69, 45
- Ivison et al. (2011) Ivison, R. J., Papadopoulos, P. P., Smail, I., et al. 2011, MNRAS, 412, 1913
- Jiao et al. (2017) Jiao, Q., Zhao, Y., Zhu, M., et al. 2017, ApJ, 840, L18
- Jiménez-Andrade et al. (2020) Jiménez-Andrade, E. F., Zavala, J. A., Magnelli, B., et al. 2020, ApJ, 890, 171
- Jin et al. (2019) Jin, S., Daddi, E., Magdis, G. E., et al. 2019, ApJ, 887, 144
- Kato et al. (2016) Kato, Y., Matsuda, Y., Smail, I., et al. 2016, MNRAS, 460, 3861
- Kaufman et al. (2006) Kaufman, M. J., Wolfire, M. G., & Hollenbach, D. J. 2006, ApJ, 644, 283
- Kaufman et al. (1999) Kaufman, M. J., Wolfire, M. G., Hollenbach, D. J., & Luhman, M. L. 1999, ApJ, 527, 795
- Lehmer et al. (2009) Lehmer, B. D., Alexander, D. M., Chapman, S. C., et al. 2009, MNRAS, 400, 299
- McMullin et al. (2007) McMullin, J. P., Waters, B., Schiebel, D., Young, W., & Golap, K. 2007, Astronomical Society of the Pacific Conference Series, Vol. 376, CASA Architecture and Applications, ed. R. A. Shaw, F. Hill, & D. J. Bell, 127
- Nesvadba et al. (2019) Nesvadba, N. P. H., Cañameras, R., Kneissl, R., et al. 2019, A&A, 624, A23
- Oteo et al. (2018) Oteo, I., Ivison, R. J., Dunne, L., et al. 2018, ApJ, 856, 72
- Papadopoulos & Greve (2004) Papadopoulos, P. P. & Greve, T. R. 2004, ApJ, 615, L29
- Pavesi et al. (2018) Pavesi, R., Sharon, C. E., Riechers, D. A., et al. 2018, ApJ, 864, 49
- Peng et al. (2002) Peng, C. Y., Ho, L. C., Impey, C. D., & Rix, H.-W. 2002, AJ, 124, 266
- Riechers et al. (2011) Riechers, D. A., Hodge, J., Walter, F., Carilli, C. L., & Bertoldi, F. 2011, ApJ, 739, L31
- Riechers et al. (2020) Riechers, D. A., Hodge, J. A., Pavesi, R., et al. 2020, ApJ, 895, 81
- Riechers et al. (2017) Riechers, D. A., Leung, T. K. D., Ivison, R. J., et al. 2017, ApJ, 850, 1
- Schreiber et al. (2018) Schreiber, C., Glazebrook, K., Nanayakkara, T., et al. 2018, A&A, 618, A85
- Schreiber et al. (2017) Schreiber, C., Pannella, M., Leiton, R., et al. 2017, A&A, 599, A134
- Simpson et al. (2014) Simpson, J. M., Swinbank, A. M., Smail, I., et al. 2014, ApJ, 788, 125
- Smail et al. (1999) Smail, I., Ivison, R. J., Kneib, J. P., et al. 1999, MNRAS, 308, 1061
- Steidel et al. (1998) Steidel, C. C., Adelberger, K. L., Dickinson, M., et al. 1998, ApJ, 492, 428
- Swinbank et al. (2012) Swinbank, A. M., Karim, A., Smail, I., et al. 2012, MNRAS, 427, 1066
- Swinbank et al. (2014) Swinbank, A. M., Simpson, J. M., Smail, I., et al. 2014, MNRAS, 438, 1267
- Tadaki et al. (2015) Tadaki, K.-i., Kohno, K., Kodama, T., et al. 2015, ApJ, 811, L3
- Tanaka et al. (2019) Tanaka, M., Valentino, F., Toft, S., et al. 2019, ApJ, 885, L34
- Umehata et al. (2019) Umehata, H., Fumagalli, M., Smail, I., et al. 2019, Science, 366, 97
- Umehata et al. (2018) Umehata, H., Hatsukade, B., Smail, I., et al. 2018, PASJ, 70, 65
- Umehata et al. (2014) Umehata, H., Tamura, Y., Kohno, K., et al. 2014, MNRAS, 440, 3462
- Umehata et al. (2015) Umehata, H., Tamura, Y., Kohno, K., et al. 2015, ApJ, 815, L8
- Umehata et al. (2017) Umehata, H., Tamura, Y., Kohno, K., et al. 2017, ApJ, 835, 98
- Valentino et al. (2019) Valentino, F., Tanaka, M., Davidzon, I., et al. 2019, arXiv e-prints, arXiv:1909.10540
- Walter et al. (2016) Walter, F., Decarli, R., Aravena, M., et al. 2016, ApJ, 833, 67
- Walter et al. (2012) Walter, F., Decarli, R., Carilli, C., et al. 2012, Nature, 486, 233
- Wang et al. (2019) Wang, T., Schreiber, C., Elbaz, D., et al. 2019, Nature, 572, 211
- Wang et al. (2009) Wang, W.-H., Barger, A. J., & Cowie, L. L. 2009, ApJ, 690, 319
- Wilson et al. (2008) Wilson, C. D., Petitpas, G. R., Iono, D., et al. 2008, ApJS, 178, 189
- Yamada et al. (2012) Yamada, T., Nakamura, Y., Matsuda, Y., et al. 2012, AJ, 143, 79
- Yamaguchi et al. (2019) Yamaguchi, Y., Kohno, K., Hatsukade, B., et al. 2019, ApJ, 878, 73
- Yamaguchi et al. (2016) Yamaguchi, Y., Tamura, Y., Kohno, K., et al. 2016, PASJ, 68, 82
- Zhang et al. (2016) Zhang, Z.-Y., Papadopoulos, P. P., Ivison, R. J., et al. 2016, Royal Society Open Science, 3, 160025
- Zhang et al. (2018) Zhang, Z.-Y., Romano, D., Ivison, R. J., Papadopoulos, P. P., & Matteucci, F. 2018, Nature, 558, 260
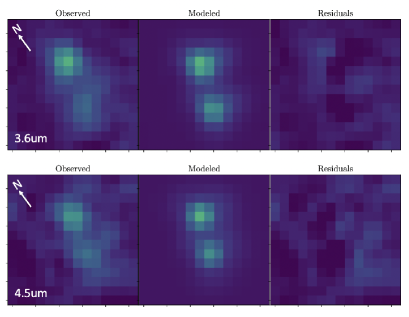
Appendix A Deblending IRAC photometry
Since the counterpart of ADF22.A2 has a close companion in the 3.6 m and 4.5 images, we measured the flux density using galfit (Peng et al. 2002). We fit the region around ADF22.A2 using three components, including two point sources and the sky. Fig. 7 shows the best-fit results. The derived fluxes are Jy and Jy, respectively (see also Table 1). These measurements exceed the 3 detection limits for a point source (0.4 Jy and 0.8 Jy at 3.6 m and 4.5 m, respectively), as was derived by Hainline et al. (2009).