An End-to-End Food Image Analysis System
Abstract
Modern deep learning techniques have enabled advances in image-based dietary assessment such as food recognition and food portion size estimation. Valuable information on the types of foods and the amount consumed are crucial for prevention of many chronic diseases. However, existing methods for automated image-based food analysis are neither end-to-end nor are capable of processing multiple tasks (e.g., recognition and portion estimation) together, making it difficult to apply to real life applications. In this paper, we propose an image-based food analysis framework that integrates food localization, classification and portion size estimation. Our proposed framework is end-to-end, i.e., the input can be an arbitrary food image containing multiple food items and our system can localize each single food item with its corresponding predicted food type and portion size. We also improve the single food portion estimation by consolidating localization results with a food energy distribution map obtained by conditional GAN to generate a four-channel RGB-Distribution image. Our end-to-end framework is evaluated on a real life food image dataset collected from a nutrition feeding study.
Introduction
Dietary assessment refers to the process of determining what someone eats and how much energy is consumed during the course of a day, which is essential for understanding the link between diet and health. Modern deep learning techniques have achieved great success in image-based dietary assessment for food localization and classification [1, 2, 3, 4, 5, 6, 7, 8], as well as food portion size estimation [9, 10, 11, 12, 13, 14, 6]. However, none of these methods can achieve food localization, classification and portion size estimation in an end-to-end fashion, which makes it challenging to integrate into a complete system for fast and streamlined process.
Image based food localization and classification problems can be viewed as specialized tasks in computer vision. The goal of food localization is to locate each individual food region for a given image with a bounding box. Pixels within the bounding box are assumed to represent a single food, which is the input to the food classification task. Food localization serves as a pre-processing step since it is common for food images in real life to contain multiple food items.
However, accurate estimation of an object’s portion size is a challenging task, particularly from a single-view food image as most 3D information has been lost when the eating scene is projected from 3D world coordinates onto 2D image coordinates. An object’s portion size is defined as the numeric value that is directly related to the spatial quantity of the object in world coordinates. The goal of food portion size estimation is to derive the food energy from an input image since energy intake is an important indicator for diet assessment. There are existing methods [13, 14] that can estimate food portion size for the entire input image by generating a food energy distribution map, however, they cannot estimate the portion size of each food item separately. This is important as an individual food item can vary greatly in the energy contribution leading to significant estimation error. In this work, we address this problem by using a four-channel RGB-Distribution image, where the individual energy distribution map is obtained by applying food localization results on the entire food energy distribution map generated using conditional GAN as described in Section Food Portion Size Estimation.
The success of modern deep learning based methods also rely on the availability of training data. Currently, there is no available food image dataset that includes groundtruth bounding box information, food category and corresponding portion size value for each food item in the image. Groundtruth portion size information is difficult to obtain from crowd-based annotation on RGB images, unless these numeric values are recorded during image collection. To address this issue, we introduce an eating occasion dataset containing all the groundtruth information listed above and the food portion size is provided by registered dietitians. We will describe the collection of this dataset in Section Eating Occasion Image to Food Energy Dataset.
The main contributions of this paper can be summarized as follows.
-
•
We propose an end-to-end framework for image-based diet assessment that integrates food localization, classification and portion size estimation
-
•
We introduce a novel method for single food item portion size estimation by using a four-channel RGB-Distribution image, where the individual energy distribution map is obtained by applying food localization results on the entire food energy distribution map generated by conditional GAN
-
•
We introduce a new food eating occasion image dataset containing bounding box information, food category and portion size for evaluating the proposed end-to-end framework
Eating Occasion Image to Food Energy Dataset
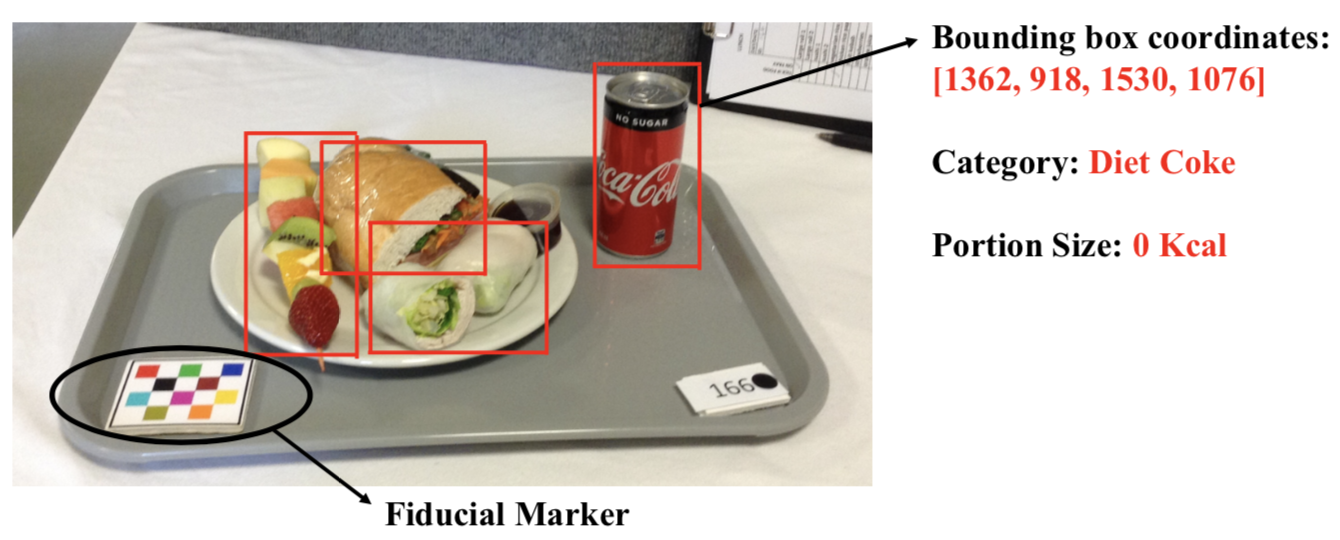
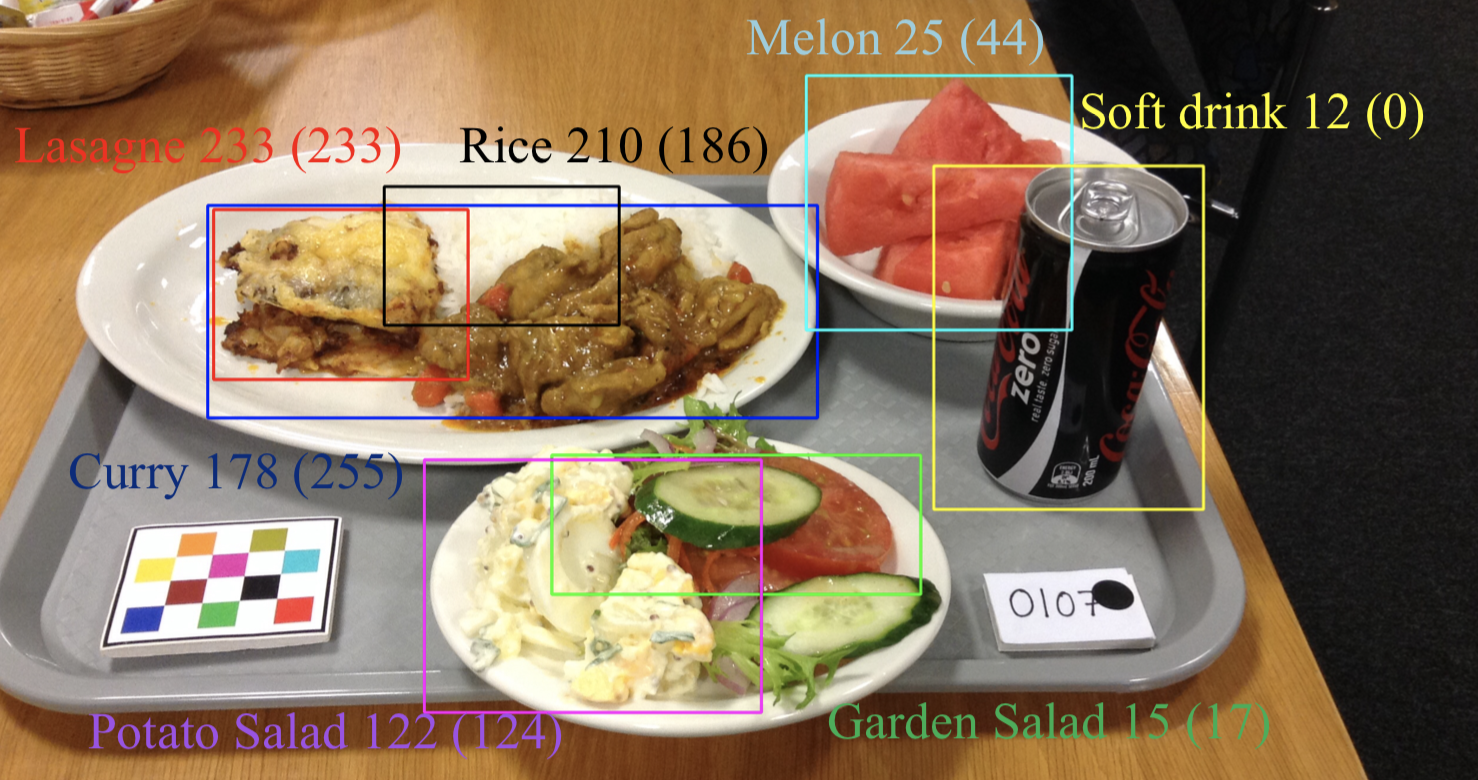
Annotated image datasets have been instrumental for driving progress in many deep learning based applications such as food detection and classification. Existing food images datasets may contain groundtruth bounding box and food label information [16, 17] or just the food label [18, 19] which is not suitable for portion size estimation due to the lack of groundtruth information. In this paper, we introduce an eating occasion image to food energy dataset containing bounding box information, food category and portion size value. Food images were collected from a nutrition study as part of an image-assisted 24-hour dietary recall (24HR) study [20] conducted by registered dietitians. The study participants were healthy volunteers aged between 18 and 70 years old. A mobile app was used to capture images of the eating scenes for 3 meals (breakfast, lunch and dinner) over a 24-hour period. Foods are provided in buffet style where pre-weighed foods and beverages are served to the participants. Based on the known foods and their weight, food energy is calculated and used as groundtruth. The dataset contains 154 annotated eating occasion images, with a total of 915 individual food images which belong to 31 categories. The corresponding groundtruth information includes bounding box to locate individual food, food category and portion size (in Kcal). The bounding box is given by the coordinates of input image as as shown in Figure 1.
Data Augmentation
We split the dataset with for validation for testing and the remaining for training. The problem with a small dataset is that the models trained on them cannot generalize well for data from the validation and test set. Hence, these models suffer from the problem of overfitting. Data augmentation is an efficient way to address this problem, where we increase the amount of training data by rotation (90 degrees, 270 degrees) and flip (x-axis, y-axis, both). We randomly implemented the operations based on the number of training images for that category, i.e. we implemented less operations for the category which contains more images. We augment the training data while keeping the groundtruth information unchanged before and after the augmentation operations.
Method
Food Localization and Classification
The goal of food localization is to locate individual food region for a given input image by providing a bounding box, where each bounding box should contain only one food item. Deep learning based methods for localization such as Faster R-CNN [21] have shown success in many computer vision applications. It proposes potential regions that may contain the object with bounding boxes. Advanced CNN architectures such as VGG [22] and ResNet [23] can be used as the backbone structure for these methods.
The localization network locates all individual food items within the input food image and then sends them to the classification network. We apply Convolutional Neural Networks (CNNs) to classify the food item within each bounding box, which has been widely used in image classification applications. We use cross-entropy loss for classification task as shown below:
| (1) |
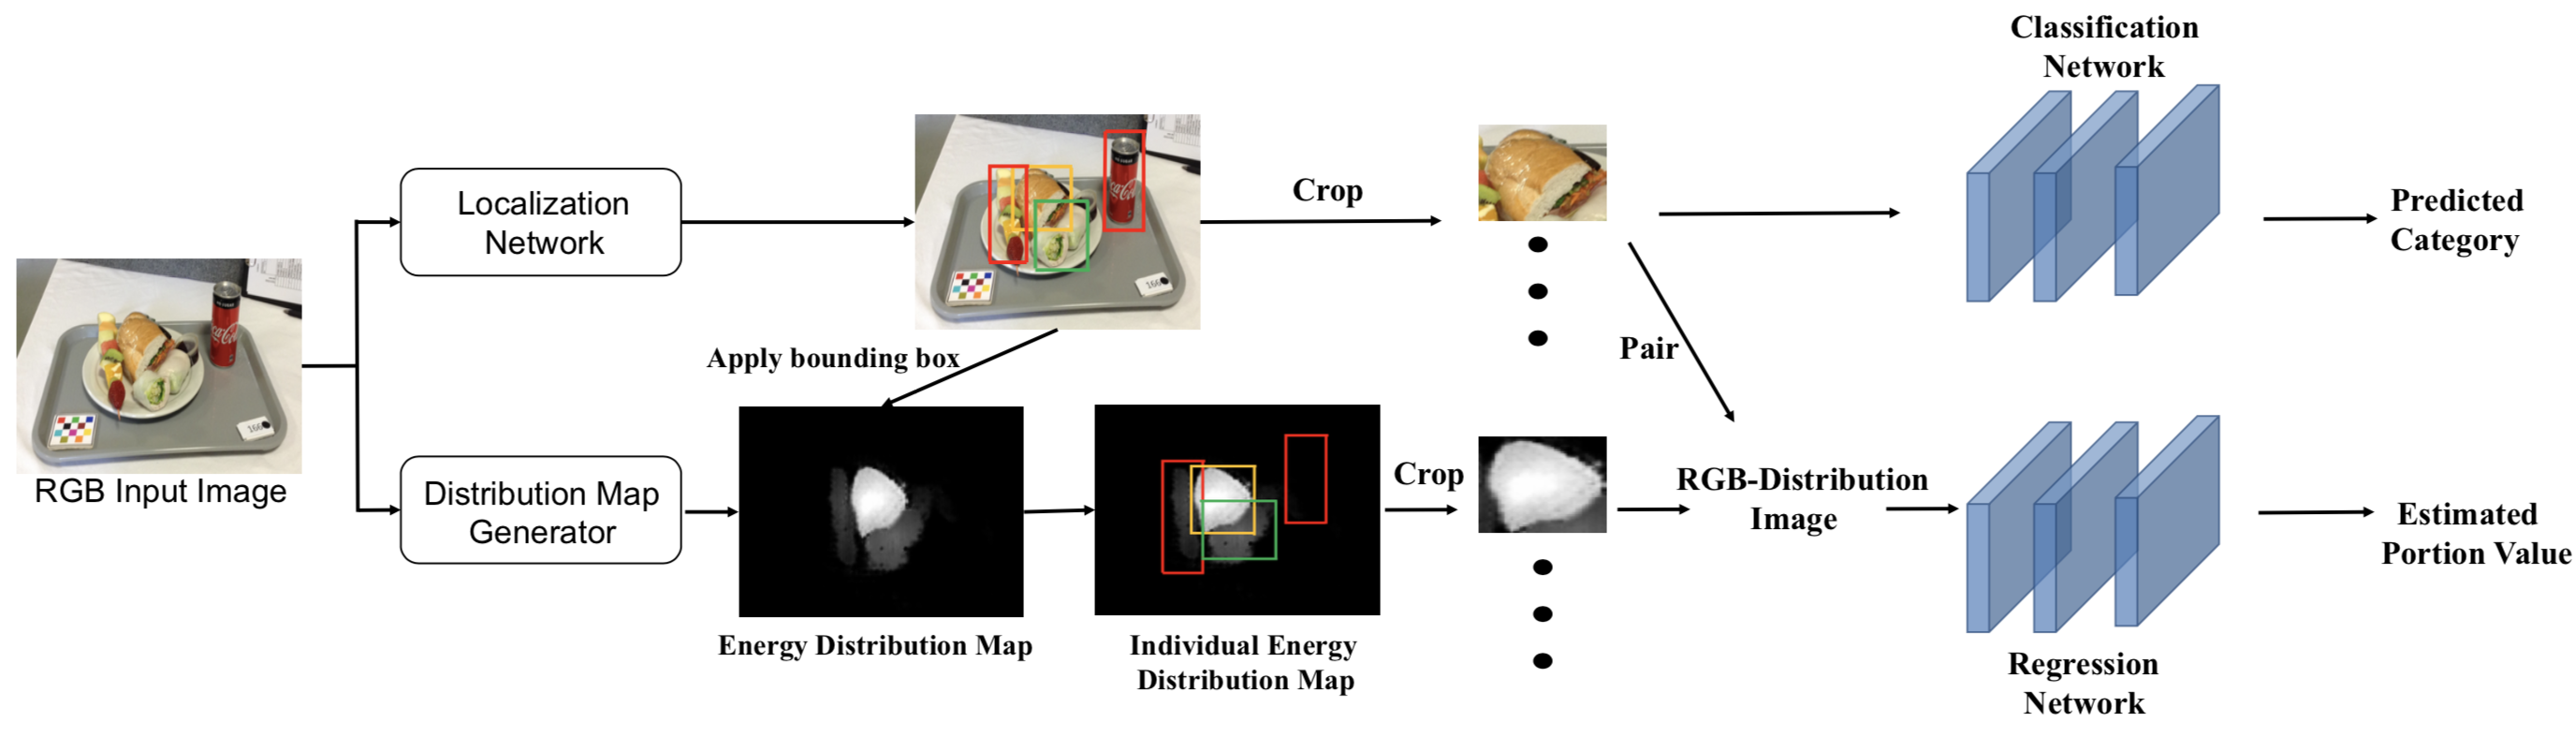
where x is the cropped food image and is its corresponding one hot label for the food category, denotes the output of classification with dimension . The food localization and classification pipeline are described in Figure 2.
Food Portion Size Estimation
Portion size is a property that strongly relates to the presence of an object in 3D space, so it is very difficult to accurately estimate an object’s portion size by given an arbitrary 2D image. In [14], a synthetic intermediate result of ‘energy distribution’ image was proposed, where the ‘energy distribution’ image has pixel-to-pixel correspondence and weights at different pixel locations to represent how food energy is distributed in the eating occasion. For example, pixels corresponding to steak have much higher weights than pixels of apple. [24] then uses the generated distribution image to estimate food portion size by applying a regression network. On the other hand, [6] uses RGB food image only and apply feature adaptation to estimate food portion size. Our method combines the two methods and use a RGB-Distribution image to improve the estimate of the food portion size.
Generate energy distribution map: We first train an energy distribution map generator by using a Generative Adversarial Networks [25] under conditional settings [26]. We define:
| (2) |
where is the generator, is the discriminator, is the L1 reconstruction loss, and is the conditional GAN loss as defined in [26]:
| (3) | ||||
where is the source domain (RGB image), is the target domain (energy distribution map) and is random noise. The energy distribution map is a single-channel image where higher pixel value indicates higher energy distribution.
Apply food localization bounding box: After we generate the energy distribution map for the entire eating occasion food image, we apply the bounding box generated in Section Food Localization and Classification to obtain the energy distribution map for individual food item.
Generate RGB-Distribution image: We then combine the cropped RGB single food image with its corresponding energy distribution map to generate a RGB-Distribution image, which has four channels: R, G, B, and distribution map. The RGB-Distribution image is sent to a regression network to estimate food portion size. L1-norm loss is used for portion size estimation:
| (4) |
where is the groundtruth portion size value and denotes the output of regression network with dimension 1. The lower half of Figure 2 shows the pipeline for estimating portion size for each individual food item.
Experimental Results
In this section, we evaluate our proposed end-to-end framework using the dataset introduced in Section Eating Occasion Image to Food Energy Dataset.
For the localization and classification tasks, mean Average Precision (mAP) is the most common performance metrics. We firstly define several related terminologies: The intersection of union (IoU) refers to the ratio of overlapped region between predicted bounding box and groundtruth bounding box over the union of the two bounding boxes. True Positive (TP), False Positive (FP), True Negative (TN) and False Negative (FN). For example, TP means the predicted bounding box is assigned with correct food label and the corresponding IoU socre is larger than a threshold. Based on these definitions, we can calculate precision (Equation 5) and recall (Equation 6).
| (5) |
| (6) |
Average Precision (AP) for each category is the average precision value for recall value over to for each food category, and mAP is the mean value of all APs of all categories.
Since we use L1-norm loss as shown in Equation 4 to train the regression network, we use the Mean Absolute Error (MAE) to evaluate portion size estimation, defined as
| (7) |
where is the estimated portion size of the -th image, is the groundtruth portion size of the -th image and is the number of testing images.
Implementation Detail
Results for localization and classification
The mAP results for food localization and classification tasks on our proposed dataset under different thresholds are shown in Table 1. is commonly used and practical IoU threshold and we achieve satisfactory but is a challenging threshold as we set the threshold of . In addition, our dataset is challenging since the number of training data is insufficient although some data augmentation methods are implemented. We also calculate the the mAP by changing the IoU threshold from 0.5 to 0.95 with a step size of 0.05 as shown in last column.
| mAP@.5 | mAP@.75 | mAP@[.5,.95] |
| 0.6235 | 0.2428 | 0.2919 |
Results for portion size estimation
Compare to state-of-the-art methods: We compare our result of food portion size estimation with two state-of-the-art food portion estimation methods: [24] and [6] that directly using food distribution map or single RGB image for regression respectively as described in Section Food Portion Size Estimation. The input for our proposed method to estimate food portion size is a generated RGB-Distribution image of cropped RGB image and cropped energy distribution image using the localization network. As shown in Table 2, our method outperforms the other two methods for single food item portion size estimation with smallest MAE as our proposed method takes into consideration for both the RGB and energy distribution information.
| Methods | Mean Absolute Error (MAE) |
|---|---|
| Fang et al. [24] | 109.94 Kcal |
| He et al. [6] | 107.55 Kcal |
| Our Method | 105.64 Kcal |
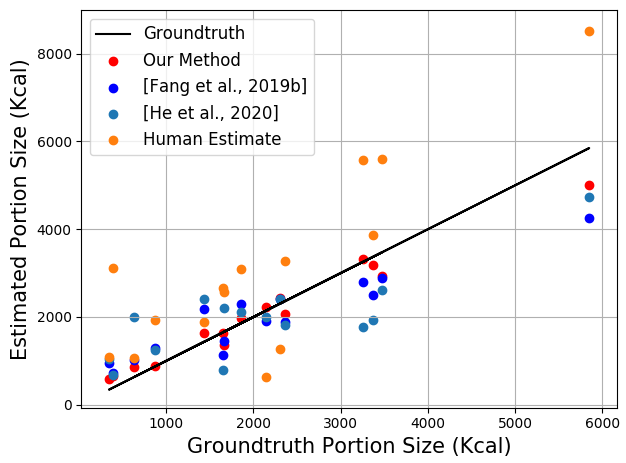
Compare to human estimates: We also compare our results for food portion size estimation of the entire eating occasion image that containing multiple single food items with 15 participants’ estimates from the same study. During the data collecting time, the participants are required to estimate the portion size of the meal they just consumed in a structured interview while viewing the eating occasion images. We sum up all single food portion size estimated by our proposed method, [24] , [6] and human estimates respectively for each eating occasion image. We apply error percentage as metric in this part which is defined as
| (8) |
where is the estimated portion size and is the groundtruth portion size.
| Methods | Error Percentage |
|---|---|
| Human Estimates | 62.14% |
| Fang et al. [24] | 35.06% |
| He et al. [6] | 25.32% |
| Our Method | 11.22% |
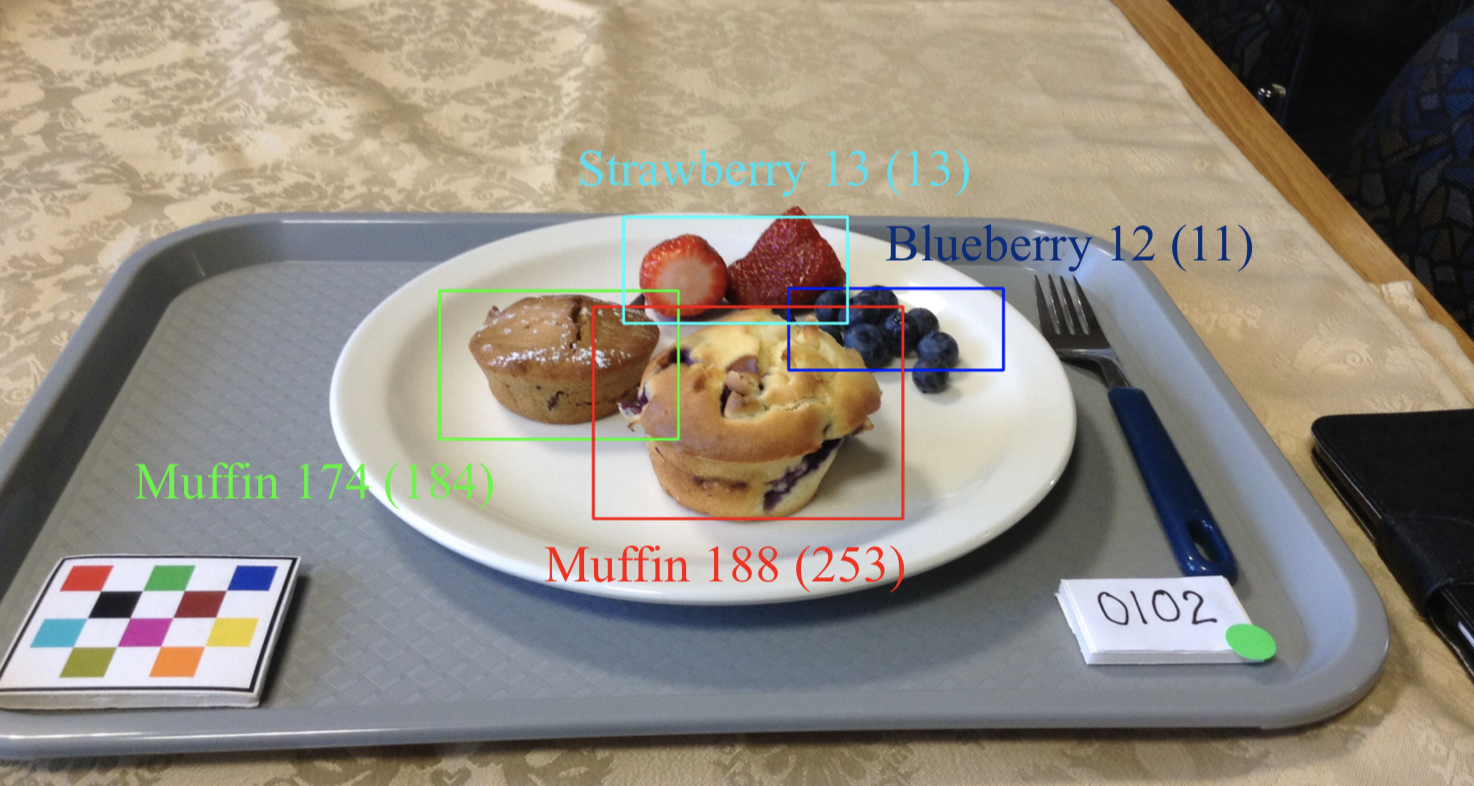
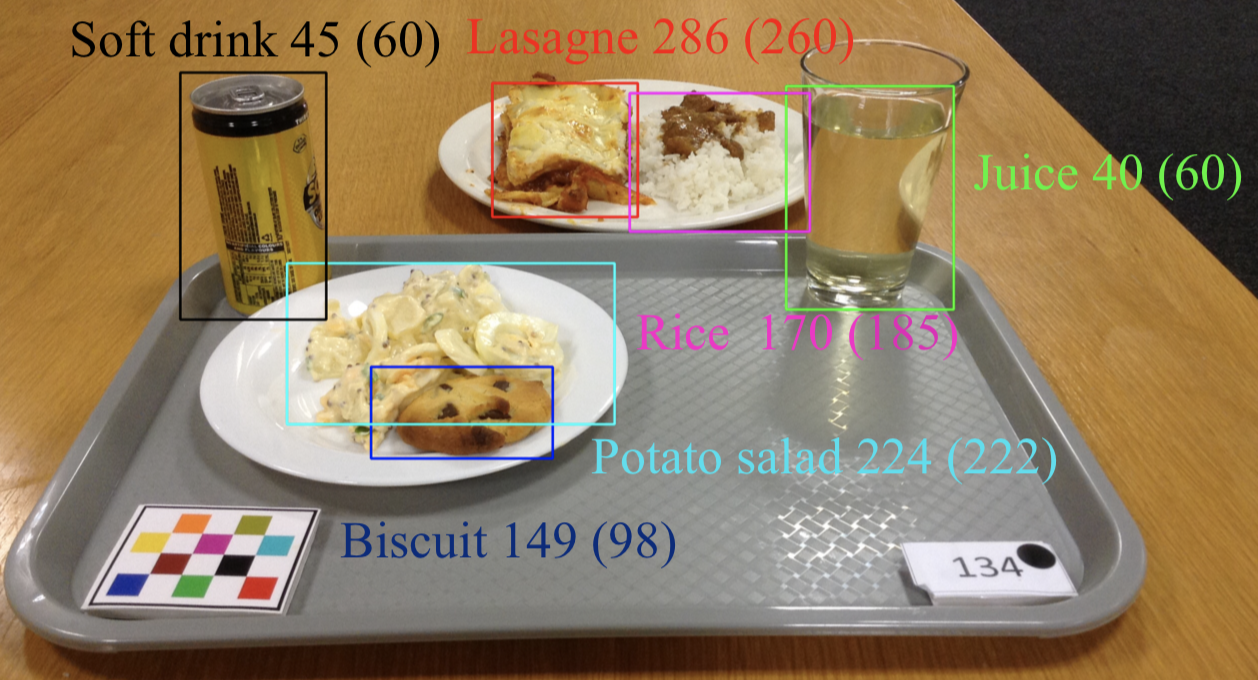
As shown in Table 3, the error percentage (EP) of human estimates is 62.14%, which also indicates that predicting food portion size using only information from food images is really an challenging task for majority of people. Our method gives the best result on EP for 11.22%, which improves more than 50% in terms of EP compared with human estimates. Figure 4 shows the results for each eating occasion image in test set. Our predicted energy (red dots) is most closest to the groundtruth energy (black line).
Conclusion
In this paper, we propose an end-to-end image-based food analysis framework that integrates food localization, classification and portion size estimation. We introduce a novel method to estimate individual food portion size using RGB-Distribution image, where the individual energy distribution map is obtained by applying localization results on the entire energy distribution map generated by conditional GAN. Our framework is evaluated on a real life eating occasion food image dataset with groundtruth information of bounding box, food category and portion size. For localization and classification, we calculate the mAP under different thresholds and we show a satisfactory result. Our proposed method for food portion size estimation outperforms existing methods in terms of MAE as we consider both the RGB information and energy distribution information when estimating the portion size using a regression network. Our method also achieves the best improvement of error percentage from 62.14% to 11.22% when compared with human estimates for the entire eating occasion image, showing great potential for advancing the field of image-based dietary assessment.
References
- [1] H. Wu, M. Merler, R. Uceda-Sosa, and J. R. Smith, “Learning to make better mistakes: Semantics-aware visual food recognition,” Proceedings of the 24th ACM international conference on Multimedia, pp. 172–176, 2016.
- [2] K. Yanai and Y. Kawano, “Food image recognition using deep convolutional network with pre-training and fine-tuning,” Proceedings of the IEEE International Conference on Multimedia & Expo Workshops, pp. 1–6, July 2015.
- [3] C. Liu, Y. Cao, Y. Luo, G. Chen, V. Vokkarane, and Y. Ma, “Deepfood: Deep learning-based food image recognition for computer-aided dietary assessment,” International Conference on Smart Homes and Health Telematics, pp. 37–48, 2016.
- [4] P. Pandey, A. Deepthi, B. Mandal, and N. B. Puhan, “Foodnet: Recognizing foods using ensemble of deep networks,” IEEE Signal Processing Letters, vol. 24, no. 12, pp. 1758–1762, 2017.
- [5] M. Bolaños and P. Radeva, “Simultaneous food localization and recognition,” 2016 23rd International Conference on Pattern Recognition, pp. 3140–3145, 2016.
- [6] J. He, Z. Shao, J. Wright, D. Kerr, C. Boushey, and F. Zhu, “Multi-task image-based dietary assessment for food recognition and portion size estimation,” arXiv preprint arXiv:2004.13188, 2020.
- [7] J. He, R. Mao, Z. Shao, and F. Zhu, “Incremental learning in online scenario,” Proceedings of the IEEE Conference on Computer Vision and Pattern Recognition, pp. 13 926–13 935, 2020.
- [8] R. Mao, J. He, Z. Shao, S. K. Yarlagadda, and F. Zhu, “Visual aware hierarchy based food recognition,” arXiv preprint arXiv:2012.03368, 2020.
- [9] K. Aizawa, Y. Maruyama, H. Li, and C. Morikawa, “Food balance estimation by using personal dietary tendencies in a multimedia Food Log,” IEEE Transactions on Multimedia, vol. 15, no. 8, pp. 2176 – 2185, December 2013.
- [10] S. Fang, C. Liu, F. Zhu, E. Delp, and C. Boushey, “Single-view food portion estimation based on geometric models,” Proceedings of the IEEE International Symposium on Multimedia, pp. 385–390, December 2015, Miami, FL.
- [11] A. Myers, N. Johnston, V. Rathod, A. Korattikara, A. Gorban, N. Silberman, S. Guadarrama, G. Papandreou, J. Huang, and K. Murphy, “Im2Calories: towards an automated mobile vision food diary,” Proceedings of the IEEE International Conference on Computer Vision, December 2015, Santiago, Chile.
- [12] J. Dehais, A. Greenburg, S. Shevchick, A. Soni, M. Anthimpoulos, and S. Mougiakakou, “Estimation of food volume and carbs,” Google Patents, Feb. 13 2018, uS Patent 9,892,501.
- [13] S. Fang, Z. Shao, D. A. Kerr, C. J. Boushey, and F. Zhu, “An end-to-end image-based automatic food energy estimation technique based on learned energy distribution images: Protocol and methodology,” Nutrients, vol. 11, no. 4, p. 877, 2019.
- [14] S. Fang, Z. Shao, R. Mao, C. Fu, E. J. Delp, F. Zhu, D. A. Kerr, and C. J. Boushey, “Single-view food portion estimation: learning image-to-energy mappings using generative adversarial networks,” Proceedings of the IEEE International Conference on Image Processing, pp. 251–255, October 2018, athens, Greece.
- [15] C. Xu, F. Zhu, N. Khanna, C. J. Boushey, and E. J. Delp, “Image enhancement and quality measures for dietary assessment using mobile devices,” Computational Imaging X, vol. 8296. International Society for Optics and Photonics, 2012, p. 82960Q.
- [16] Y. Kawano and K. Yanai, “Automatic expansion of a food image dataset leveraging existing categories with domain adaptation,” Proceedings of European Conference on Computer Vision Workshops, pp. 3–17, September 2014, Zurich, Switzerland.
- [17] Y. Matsuda, H. Hoashi, and K. Yanai, “Recognition of multiple-food images by detecting candidate regions,” Proceedings of IEEE International Conference on Multimedia and Expo, pp. 25–30, July 2012, Melbourne, Australia.
- [18] L. Bossard, M. Guillaumin, and L. V. Gool, “Food-101 – mining discriminative components with random forests,” Proceedings of European Conference on Computer Vision, vol. 8694, pp. 446–461, September 2014, Zurich, Switzerland.
- [19] Xin Wang, D. Kumar, N. Thome, M. Cord, and F. Precioso, “Recipe recognition with large multimodal food dataset,” 2015 IEEE International Conference on Multimedia Expo Workshops (ICMEW), pp. 1–6, June 2015.
- [20] C. Schipp, J. Wright, C. Boushy, E. Delp, S. Dhaliwal, and D. Kerr, “Can images improve portion size estimation of the asa24 image-assisted food recall: A controlled feeding study,” Nutrition & Dietetics; 75 (Suppl. 1): 107, 2018.
- [21] S. Ren, K. He, R. Girshick, and J. Sun, “Faster r-cnn: Towards real-time object detection with region proposal networks,” Proceedings of Advances in Neural Information Processing Systems, pp. 91–99, December 2015.
- [22] K. Simonyan and A. Zisserman, “Very deep convolutional networks for large-scale image recognition,” arXiv preprint arXiv:1409.1556, 2014.
- [23] K. He, X. Zhang, S. Ren, and J. Sun, “Deep residual learning for image recognition,” Proceedisng of the IEEE Conference on Computer Vision and Pattern Recognition, pp. 770–778, June 2016, Las Vegas, NV.
- [24] S. Fang, Z. Shao, D. A. Kerr, C. J. Boushey, and F. Zhu, “An end-to-end image-based automatic food energy estimation technique based on learned energy distribution images: Protocol and methodology,” Nutrients, vol. 11, 2019.
- [25] I. Goodfellow, J. Pouget-Abadie, M. Mirza, B. Xu, D. Warde-Farley, S. Ozair, A. Courville, and Y. Bengio, “Generative adversarial nets,” Advances in Neural Information Processing Systems 27, pp. 2672–2680, December 2014, Montreal, Canada.
- [26] P. Isola, J. Y. Zhu, T. Zhou, and A. A. Efros, “Image-to-image translation with conditional adversarial networks,” Proceedings of the IEEE Conference on Computer Vision and Pattern Recognition, pp. 5967–5976, July 2017, Honolulu, HI.
- [27] A. Paszke, S. Gross, S. Chintala, G. Chanan, E. Yang, Z. DeVito, Z. Lin, A. Desmaison, L. Antiga, and A. Lerer, “Automatic differentiation in PyTorch,” Proceedings of the Advances Neural Information Processing Systems Workshop, 2017.