Received July 2, 2020, accepted August 31, 2020, date of publication September 7, 2020, date of current version October 13, 2020. 10.1109/ACCESS.2020.3022063
This work was supported by JSPS KAKENHI grant number JP16H06540 and the PRMU mentorship program.
Corresponding author: Toru Tamaki (e-mail: tamaki@hiroshima-u.ac.jp).
An Entropy Clustering Approach for Assessing Visual Question Difficulty
Abstract
We propose a novel approach to identify the difficulty of visual questions for Visual Question Answering (VQA) without direct supervision or annotations to the difficulty. Prior works have considered the diversity of ground-truth answers of human annotators. In contrast, we analyze the difficulty of visual questions based on the behavior of multiple different VQA models. We propose to cluster the entropy values of the predicted answer distributions obtained by three different models: a baseline method that takes as input images and questions, and two variants that take as input images only and questions only. We use a simple k-means to cluster the visual questions of the VQA v2 validation set. Then we use state-of-the-art methods to determine the accuracy and the entropy of the answer distributions for each cluster. A benefit of the proposed method is that no annotation of the difficulty is required, because the accuracy of each cluster reflects the difficulty of visual questions that belong to it. Our approach can identify clusters of difficult visual questions that are not answered correctly by state-of-the-art methods. Detailed analysis on the VQA v2 dataset reveals that 1) all methods show poor performances on the most difficult cluster (about 10% accuracy), 2) as the cluster difficulty increases, the answers predicted by the different methods begin to differ, and 3) the values of cluster entropy are highly correlated with the cluster accuracy. We show that our approach has the advantage of being able to assess the difficulty of visual questions without ground-truth (i.e., the test set of VQA v2) by assigning them to one of the clusters. We expect that this can stimulate the development of novel directions of research and new algorithms.
Index Terms:
Computer vision, Visual Question Answering, Entropy of answer distributions=-15pt
I Introduction
Visual Question Answering (VQA) is one of the most challenging tasks in computer vision [1, 2]: given a pair of question text and image (a visual question), a system is asked to answer the question. It has been attracting a lot of attention in recent years because it has a large potential to impact many applications such as smart support for the visually impaired [3], providing instructions to autonomous robots [4], and for intelligent interaction between humans and machines [5]. Towards these goals, many methods and datasets have been proposed. However, while VQA models typically try to predict answers to visual questions, we take a different approach in this paper; i.e., we analyze the difficulty of visual questions.
The VQA task is particularly challenging due to the diversity of annotations. Unlike common tasks, such as classification where precise ground truth labels are provided by the annotators, a visual question may have multiple different answers annotated by different crowd workers, as shown in Figure I. In VQA v2 [6] and VizWiz [7], which are commonly used in this task, each visual question was annotated by 10 crowd workers, and almost half of the visual questions in these datasets have multiple answers [8, 9], as shown in Table I for VQA v2. Each of the visual questions in Figure I is followed by ground truth answers and corresponding entropy values. Entropy values are large when ground truth answers annotated by crowd workers are diverse, and entropy is zero when crowd workers agree to a single answer.
[t]()[width=.95] images/fig1-crop.pdf Examples of visual questions and corresponding 10 answers of VQA v2 datasets, and corresponding entropy values. “Q” shows the question text, and “A” shows the ground truth answers, where the mark “x” is used for indicating the number of crowd workers who had annotated that answer (e.g., “ ‘red’x9 ” signifies that there were nine people who had answered ‘red’, “ ‘orange’x1 ” shows that one person answered ‘orange’, and so on.).
The disagreement of crowd workers in ground truth annotations has been an annoying issue for researchers dealing with tasks which involve crowdsource annotations [10, 11, 12]. Recently some works on VQA have tackled this issue. Gurari et al. [8] analyzed the number of unique answers annotated by crowd workers and proposed a model that predicts when crowdsourcing answers (dis)agree by using binary classifiers. Bhattacharya et al. [9] categorized reasons why answers of crowd workers differ, and found which co-occurring reasons arise frequently.
These works have revealed why multiple answers may arise and when they disagree, however this is not enough to find out how multiple answers make the visual question difficult for VQA models. Malinowski et al. [13] reported that the disagreement harms the performance of the VQA model, therefore the diversity of answers should be an important clue. However, formulating the (dis)agreement as binary (single or multiple answers) drops the information of the extent how diverse multiple answers are. For example, suppose two different answers are given to a visual question. This may mean that “five people gave one answer and the other five gave the other answer,” or, that “one gave one answer and the rest 9 gave the other.” In the latter case, the answer given by the first annotator may be noisy, hence not suitable for taking into account. To remove such noisy answers, prior work [8, 9] employed a minimum number of answer agreement. If the agreement threshold is set to (at least two annotators are needed for each answer to be valid), then the answer given by the single annotator is ignored. However setting a threshold is ad-hoc and different threshold may lead to different results when other datasets annotated by more (other than 10) workers would be available.
| #Ans | Yes/No | Number | Other | All |
|---|---|---|---|---|
| 1 | 41561 | 9775 | 18892 | 70228 |
| 2 | 33164 | 6701 | 18505 | 58370 |
| 3 | 5069 | 3754 | 15238 | 24061 |
| 4 | 621 | 2110 | 12509 | 15240 |
| 5 | 103 | 1528 | 10661 | 12292 |
| 6 | 23 | 1239 | 9186 | 10448 |
| 7 | 0 | 1062 | 7666 | 8728 |
| 8 | 0 | 952 | 6169 | 7121 |
| 9 | 0 | 726 | 4528 | 5254 |
| 10 | 0 | 287 | 2325 | 2612 |
| total | 80541 | 28134 | 105679 | 214354 |
| ave | 1.570.46 | 2.931.59 | 4.041.75 | 2.971.60 |
In this paper, we propose to use the entropy values of answer predictions produced by different VQA models to evaluate the difficulty of visual questions for the models, in contrast to prior work [14] that uses the entropy of ground truth answers as a metric of diversity or (dis)agreement of annotations. In general, entropy is large when the distribution is broad, and small when it has a narrow peak. To the best of our knowledge, this is the first work to use entropy for analysing the difficulty of visual questions.
The use of the entropy of answer distribution enables us to analyse visual questions in a novel aspect. Prior works have reported overall performance as well as performances on three subsets of VQA v2 [6]; Yes/No (answers are yes or no for questions such as “Is it …” and “Does she …”), Numbers (answers are counts, numbers, or numeric, “How many …”), and Others (other answers, “What is …”). These three types have different difficulties (i.e., Yes/No type is easier, Other type is harder), and performances of each type are useful to highlight how models behave to different types of visual questions. In fact, usually the first two words carry the information of the entire question [8], and previous work [15] uses this fact to switch the internal model to adopt suitable components to each type. This categorization of question types is useful, however not enough to find which visual questions are difficult. If we can evaluate the difficulty of visual questions, this could push forward the development of better VQA models.
Our goal is to present a novel way of analysing visual questions by clustering the entropy values obtained from different models. Images and questions convey different information [16, 17], hence models that take images only or question only are often used as baselines [2, 9, 6]. Datasets often have language bias [6, 18, 19, 15] and then questions only may be enough to answer reasonably. However the use of the image information should help to answer the question correctly. Our key idea is that the entropy values of three models (that use image only (I), question only (Q), and both (Q+I)) are useful to characterize each visual question.
The contributions of this work can be summarized as follows.
-
•
Instead of using the entropy of ground truth annotations, we use the entropy of the predicted answer distribution for the first time to analyse how diverse predicted answers are. We show that entropy values of different models are useful to characterize visual questions.
-
•
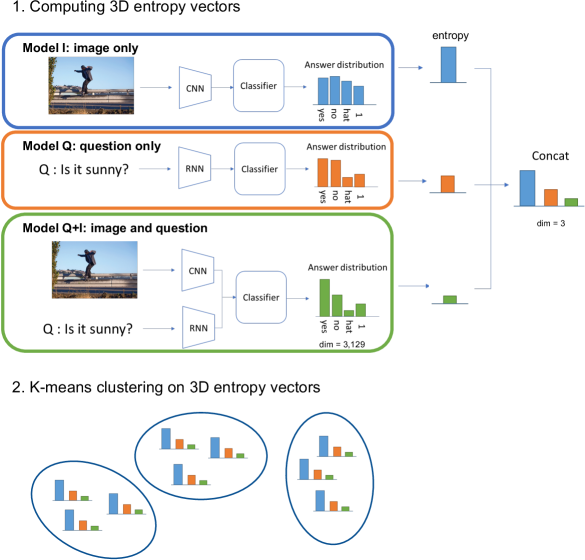
We propose an entropy clustering approach to categorize the difficulty levels of visual questions (see Figure 1). After training three different models (I, Q, and Q+I), predicting answer distributions and computing entropy values, the visual questions are clustered. This is simple yet useful, and enables us to find which visual questions are most difficult to answer.
-
•
We discuss the performances of several state-of-the-art methods. Our key insight is that the difficulty of visual question clusters is common to all methods, and tackling the difficult clusters may lead to the development of a next generation of VQA methods.
II Related work
The task of VQA has attracted a lot of attention in recent years. Challenges have been conducted since 2016, and many datasets have been proposed. In addition to the normal VQA task, related tasks have emerged, such as EmbodiedQA [4], TextVQA [20], and VQA requiring external knowledge [21, 22, 23, 24]. Still the basic framework of VQA is active and challenging, and some tasks include VQA as an important component, such as visual question generation [25, 26], visual dialog [5, 27], and image captions [28].
VQA datasets have two types of answers. For multiple-choice [6, 29, 30], several candidate answers are shown to annotators for each question. For open-ended questions [2, 6, 7, 31, 32], annotators are asked to answer in free text, hence answers tend to differ for many reasons [9]. Currently two major datasets, VQA [2, 6] and VizWiz [7], suffer from this issue because visual questions in these datasets were answered by 10 crowd workers, while other datasets [32, 29, 33, 34, 21, 31, 30, 35] have one answer per visual question.
This disagreement between annotators has recently been investigated in several works. Bhattacharya et al. [9] proposed 9 reasons why and when answers differ: low-quality image (LQI), answer not present (IVE), invalid (INV), difficult (DFF), ambiguous (AMB), subjective (SBJ), synonyms (SYN), granular (GRN), and spam (SMP). The first six reasons come from both/either question and/or image, and the last three reasons are due to issues inherent to answers. They found that ambiguity occurs the most, and co-occurs with synonyms (same but different wordings) and granular (same but different concept levels). This work gives us quite an important insight about visual questions, however only for those that have multiple different answers annotated. Gurari et al. [8] investigated the number of unique answers annotated by crowd workers, but didn’t consider how answers differ if disagreed. Instead they use a threshold of agreement to show how many annotators answered the same. Yang et al. [14] investigated the diversity of ground truth annotations. They trained a model to estimate the number of unique answers in the ground truth. Their motivation is collecting almost all diverse ground truth answers with a limited budget for crowdsourcing. If more answers are expected, then they continue to ask crowdworkers to provide more answers. If enough answers have been collected, they stop collecting answers to that question.
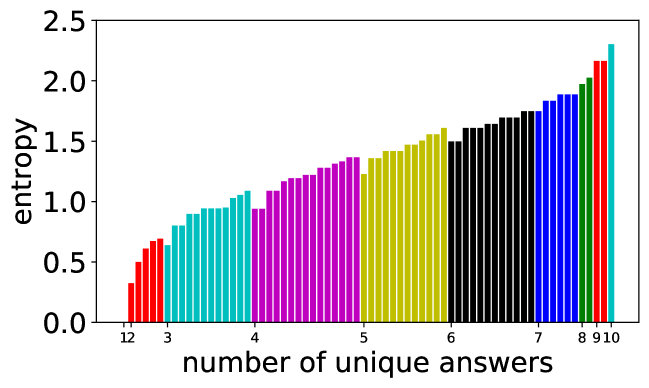
Our approach is to use the entropy of the answer distributions of the predictions of VQA models. This is a novel aspect, and complementary to the prior works. Entropy takes into account by a single number the fraction of multiple answers as well as the distribution of answers. It therefore provides another modality to analyse visual questions at a fine-grained level. Figure 2 shows how entropy values change for the same number of unique answers. The leftmost bar’s value is zero because there is only a single answer (i.e. all answers agree), and the rightmost bar represents the case when all 10 answers are different. In between, entropy values are sorted inside the same number of unique answers. In the experiments we will see that the entropy of the answer distributions of VQA model predictions is consistent with the entropy of the ground truth answers, and also with the number of unique answers.
For computing the entropy, we use three different VQA models (image only, question only, and both) with the expectation that images and question texts convey different information. This has been studied in some recent works such as [19] that utilizes the difference between normal VQA (Q+I) and question-only (Q) models. Many recent works capture the difference of visual and textual information by using the attention mechanism between. Some co-attention models [36, 37, 38] use visual and textual attention in each modality or in an one-way manner (e.g., from question to image). Some other works (such as DCN [39], BAN [40], and MCAN [41]) investigate “dense” co-attention that use bidirectional attention between images and questions. More recent works try to capture a more complex visual-textual information [42, 43, 44, 45]. Our work instead tries to keep our approach as simple as possible by using three independently trained models to obtain the entropy.
We should note that this approach is different from uncertainty of prediction. Teney et al. [46] proposed a model using soft scores because scores may indicate uncertainty in ground truth annotations, and minimizing the loss between ground truth and prediction answer distribution. This approach is useful, yet it doesn’t show the nature of visual questions.
Our approach is closely related to hard example mining [47, 48] and hardness / failure prediction [49]. Hard example mining approaches determine which examples are difficult to train during training, while hardness prediction jointly trains the task classifier and an auxiliary hardness prediction network. Compared to these works, our approach differs in the following two aspects. First, the VQA task is multi-modal and assessing the difficulty of visual questions has not been considered before. Second, our approach is off-line and can determine the difficulty without ground-truth, i.e., before actually trying to answer the visual questions in the test set.
III Clustering visual questions with entropy
Here we formally define the entropy. Let be the set of possible answers that a VQA model would predict, and or the probability distribution predicted by the VQA model, which satisfies and . The entropy of the VQA model prediction is defined by
| (1) |
III-A Clustering method
To perform clustering, we hypothesize that “easy visual questions lead to low entropy while difficult visual questions to high entropy.” A similar concept has been reported in terms of the human consensus with multiple ground truth annotations [13], but in this paper we address the relation between the difficulty and the entropy of answer distributions produced by VQA models. This is reasonable because for easy visual questions VQA systems can predict answer distributions in which the correct answer category has large probability while other categories are low. In contrast, difficult visual questions makes VQA systems generate broad answer distributions because many answer candidates may be equally plausible. Entropy can capture the diversity of predicted answer distributions, and also that of ground truth annotations in the same manner.
We prepare three different models that use as input image only (I), question only (Q), and both question and image (Q+I). In this case, we expect the following three levels of difficulty of visual questions:
-
•
Level 1: Reasonably answered by using question only.
-
•
Level 2: Difficult to answer with question only but good with images.
-
•
Level 3: Difficult even if both image and question are provided.
For a certain visual question, it is of level 1 if the answer distribution of the Q model has low entropy. It is of level 2 if the Q model is high entropy and the Q+I model is low entropy. If both the Q and Q+I models have high entropy, then the visual question is of level 3. (We show a procedure to determine these levels in section III-C.) This concept is realised by the following procedure. 1) Train the I, Q, and Q+I models on the training set with image only, questions only, and both images and questions, respectively. 2) Evaluate the validation set by using the three models and compute answer distributions and entropy values of each of visual questions. 3) Perform clustering on the validation set with entropy values. Clustering features are the entropy values of the three models.
III-B Datasets and setting
We use VQA v2 [6]: it consists of training, validation, and test sets. To train models, we use the training set (82,783 images, 443,757 questions, and 4,437,570 answers). We use the validation set (40,504 images, 214,354 questions, and 2,143,540 answers) for clustering and analysis.
We choose Pythia v0.1 [50, 51] as a base model, and modify it so that it takes questions only (Q model), or images only (I model). To do so, we simply set either image features or question features to zero vectors. With no modification, it is Q+I model (i.e. Pythia v0.1). As in prior works [52, 53, 46, 41], 3129 answers in the training set that occur at least 8 times are chosen as candidates, which results in a multi-class problem predicting answer distributions of 3129 dimension. Note that other common choices for the number of answers are 3000 [36, 54] and 1000 [55]. Even when different numbers are used, our entropy clustering approach works and we expect our findings to hold.
To compare the performance with state-of-the-art methods, we use BUTD [52], MBF [56], MFH [36], BAN [40] (including BAN-4 and BAN-8), MCAN [41] (including small and large), and Pythia v0.3 [51, 20].
The metric for performance evaluation is the following, which is commonly used for this dataset [2]:
| (2) |
in other words, an answer is 100% correct if at least three annotated answers match that answer.
First we show the performance of each model in Table II. As expected, the I model performs worst because there is no clue of questions in the image. In contrast, Q model performs reasonably better, particularly for Yes/No type. Average performances of different models (excluding I and Q) are about 84%, 47%, and 58% for types of Yes/No, Number, and Other, respectively. Note that we show average and standard deviations (std) in Table II, and the std values look relatively large. This is natural and it is due to the definition of VQA accuracy (Eq. (2)). For each prediction, accuracy is discrete: 0, 33.3, 66.6, or 100 depending on how many people provided that ground truth answer. Averaging these discrete values results in a large std. (In other words, large discretization errors lead to a large std. For example, 10 predictions with accuracy of 100 and 35 with accuracy of 0 result in .) It is quite common for VQA papers to report average accuracy only without std, probably because std is large for any models and not useful for comparison. In this paper we report std of accuracy as well as std for entropy and the reasons to differ.
| Model | Overall | Yes/No | Number | Other |
|---|---|---|---|---|
| I | 24.6541.42 | 64.2144.51 | 0.273.16 | 0.997.48 |
| Q | 44.8346.76 | 68.4843.00 | 32.0543.45 | 30.2142.91 |
| Q+I [50] | 67.4743.35 | 84.5233.01 | 47.5546.25 | 59.7845.00 |
| BUTD [52] | 63.7944.61 | 81.2035.84 | 43.9045.93 | 55.8145.78 |
| MFB [56] | 65.1444.21 | 83.1134.31 | 45.3246.16 | 56.7245.60 |
| MFH [36] | 66.2343.85 | 84.1233.45 | 46.7146.27 | 57.7945.40 |
| BAN-4 [40] | 65.8743.90 | 83.5733.88 | 47.2346.17 | 57.3445.43 |
| BAN-8 [40] | 66.0043.87 | 83.4833.95 | 47.2046.17 | 57.6945.40 |
| MCAN-small [41] | 67.2043.42 | 84.9132.68 | 49.3546.23 | 58.4645.18 |
| MCAN-large [41] | 67.4743.33 | 85.3332.24 | 48.9646.23 | 58.7845.13 |
| Pythia v0.3 [20] | 65.9144.42 | 84.3033.56 | 44.9046.47 | 57.4946.07 |
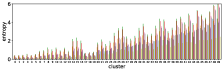
Next in Table III we show the entropy values of the predicted answer distributions by different models for each of the three types, as well as ground truth annotations. Average entropy values of models (excluding I and Q) for each type are 0.25, 1.62, 1.72, respectively. Yes/No type has smaller entropy than the others because answer distributions tend to gather around only two candidates (“Yes” and “No”). Note that the range of entropy values is different for model predictions and for the ground truth answers. Entropy ranges from (single answer) to (10 different answers) for ground truth answers, and from ( for a single entry, otherwise ) to (uniform values of ) for model predictions.
| Model | Overall | Yes/No | Number | Other |
|---|---|---|---|---|
| I | 4.190.42 | 4.160.42 | 4.190.43 | 4.210.41 |
| Q | 1.801.32 | 0.590.22 | 2.280.94 | 2.601.22 |
| Q+I [50] | 0.841.06 | 0.200.27 | 1.391.18 | 1.191.15 |
| BUTD [52] | 1.241.33 | 0.320.29 | 1.861.25 | 1.771.45 |
| MFB [56] | 1.761.86 | 0.420.31 | 2.071.77 | 2.711.95 |
| MFH [36] | 1.631.77 | 0.400.31 | 2.001.76 | 2.461.89 |
| BAN-4 [40] | 0.991.20 | 0.210.27 | 1.601.25 | 1.431.31 |
| BAN-8 [40] | 0.951.17 | 0.200.26 | 1.531.23 | 1.361.27 |
| MCAN-small [41] | 1.211.71 | 0.170.27 | 1.661.82 | 1.891.91 |
| MCAN-large [41] | 1.151.64 | 0.160.26 | 1.631.76 | 1.781.84 |
| Pythia v0.3 [20] | 0.590.82 | 0.130.22 | 0.860.93 | 0.890.87 |
| GT | 0.670.68 | 0.250.29 | 0.660.68 | 0.990.71 |
| cluster | 0 | 1 | 2 | 3 | 4 | 5 | 6 | 7 | 8 | 9 | |
|---|---|---|---|---|---|---|---|---|---|---|---|
| base model entropy | I | 3.770.27 | 4.470.24 | 4.220.39 | 4.090.40 | 4.220.40 | 4.190.40 | 4.230.40 | 4.270.39 | 4.230.41 | 4.420.41 |
| Q | 0.600.24 | 0.610.23 | 2.690.32 | 1.780.29 | 4.090.47 | 1.480.41 | 2.610.36 | 4.010.49 | 2.680.49 | 4.330.62 | |
| Q+I[50] | 0.200.26 | 0.210.27 | 0.240.27 | 0.250.28 | 0.630.46 | 1.450.45 | 1.460.35 | 2.250.43 | 2.770.47 | 3.790.56 | |
| state-of-the-art entropy | BUTD[52] | 0.380.45 | 0.420.48 | 0.850.98 | 0.770.83 | 1.731.35 | 1.790.92 | 2.030.97 | 3.131.06 | 3.010.90 | 3.980.91 |
| MFB[56] | 0.550.67 | 0.570.68 | 1.411.41 | 1.151.16 | 2.771.80 | 2.391.43 | 2.851.48 | 4.441.36 | 4.031.36 | 5.471.27 | |
| MFH[36] | 0.490.56 | 0.510.57 | 1.231.27 | 1.001.03 | 2.471.75 | 2.191.30 | 2.601.37 | 4.211.42 | 3.831.33 | 5.371.33 | |
| BAN-4[40] | 0.250.37 | 0.270.39 | 0.610.81 | 0.530.67 | 1.321.21 | 1.460.83 | 1.680.89 | 2.671.07 | 2.630.89 | 3.610.99 | |
| BAN-8[40] | 0.230.36 | 0.260.37 | 0.570.77 | 0.500.64 | 1.211.16 | 1.400.82 | 1.600.87 | 2.551.07 | 2.540.90 | 3.481.01 | |
| MCAN-small[41] | 0.230.45 | 0.250.49 | 0.701.16 | 0.540.89 | 1.741.78 | 1.661.3 | 2.01.45 | 3.661.67 | 3.351.46 | 4.951.52 | |
| MCAN-large[41] | 0.210.42 | 0.230.45 | 0.641.07 | 0.510.84 | 1.621.71 | 1.591.23 | 1.91.37 | 3.51.65 | 3.211.43 | 4.821.53 | |
| Pythia v0.3[20] | 0.140.28 | 0.160.29 | 0.280.50 | 0.250.44 | 0.690.78 | 0.890.68 | 0.990.69 | 1.590.85 | 1.760.80 | 2.200.90 | |
| test set entropy | I | 3.770.26 | 4.470.24 | 4.210.39 | 4.080.40 | 4.220.41 | 4.190.41 | 4.230.40 | 4.280.40 | 4.240.41 | 4.430.41 |
| Q | 0.600.23 | 0.610.23 | 2.700.32 | 1.780.29 | 4.090.47 | 1.480.41 | 2.620.37 | 4.020.49 | 2.680.50 | 4.330.61 | |
| Q+I[50] | 0.180.25 | 0.200.26 | 0.240.27 | 0.260.29 | 0.630.45 | 1.450.45 | 1.460.35 | 2.250.44 | 2.780.49 | 3.780.56 | |
| base model acc. | I | 53.1347.09 | 54.8146.93 | 0.676.88 | 1.6111.58 | 0.756.89 | 2.3313.20 | 0.695.87 | 1.057.18 | 0.906.28 | 1.137.00 |
| Q | 69.7042.54 | 66.7343.73 | 32.9145.13 | 46.9147.63 | 16.3235.09 | 34.9942.62 | 24.1337.8 | 8.7123.97 | 14.5429.74 | 5.5018.76 | |
| Q+I[50] | 86.1531.32 | 82.8734.48 | 84.5332.9 | 83.0834.53 | 67.7942.20 | 47.1044.24 | 45.7343.64 | 26.0438.10 | 22.5334.56 | 9.3225.05 | |
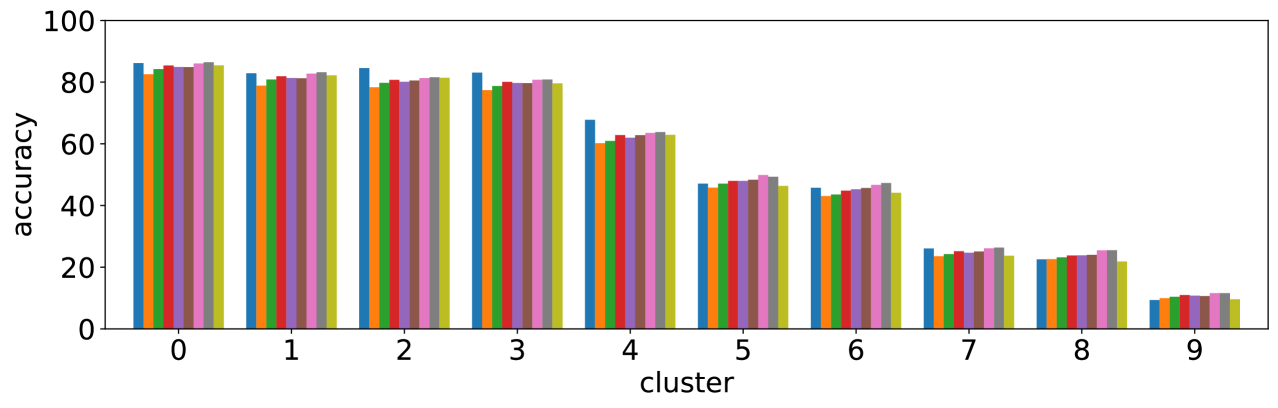
| state-of-the-art accuracy | BUTD[52] | 82.5534.81 | 78.8537.62 | 78.3238.36 | 77.3939.08 | 60.1844.87 | 45.7744.21 | 43.0643.62 | 23.5336.76 | 22.635.03 | 9.9325.37 |
| MFB[56] | 84.2033.29 | 80.8436.24 | 79.7737.26 | 78.7338.16 | 60.9344.76 | 47.0944.38 | 43.5643.56 | 24.2537.11 | 23.1635.32 | 10.3925.85 | |
| MFH[36] | 85.3832.21 | 81.8935.41 | 80.7236.51 | 80.0637.09 | 62.8444.23 | 47.9744.36 | 44.8243.69 | 25.1737.79 | 23.7735.47 | 10.9726.82 | |
| BAN-4[40] | 84.8932.65 | 81.3535.75 | 80.1136.95 | 79.7037.32 | 61.9844.48 | 47.9744.20 | 45.2743.72 | 24.6737.24 | 23.8435.47 | 10.7626.41 | |
| BAN-8[40] | 84.8832.64 | 81.2535.85 | 80.5136.67 | 79.6737.37 | 62.7944.23 | 48.3344.24 | 45.6543.74 | 25.0737.62 | 24.0035.59 | 10.6226.21 | |
| MCAN-small[41] | 86.0631.49 | 82.7634.63 | 81.3135.97 | 80.7836.50 | 63.5243.96 | 49.8644.24 | 46.6743.72 | 26.1038.02 | 25.4636.33 | 11.5627.42 | |
| MCAN-large[41] | 86.4431.10 | 83.1834.25 | 81.5835.79 | 80.8636.53 | 63.7943.88 | 49.3344.30 | 47.2743.78 | 26.3538.05 | 25.5036.27 | 11.5827.30 | |
| Pythia v0.3[20] | 85.5632.46 | 82.2935.46 | 82.3536.42 | 80.1937.90 | 65.2145.60 | 48.5446.50 | 47.1346.57 | 27.3142.05 | 26.3240.98 | 11.7030.28 | |
| GT statistics | entropy | 0.300.36 | 0.290.36 | 0.600.60 | 0.500.54 | 0.990.66 | 0.970.65 | 1.130.65 | 1.370.67 | 1.450.65 | 1.340.70 |
| ave # ans | 1.720.98 | 1.690.96 | 2.711.91 | 2.391.67 | 3.982.30 | 3.842.26 | 4.432.37 | 5.422.57 | 5.752.53 | 5.392.68 | |
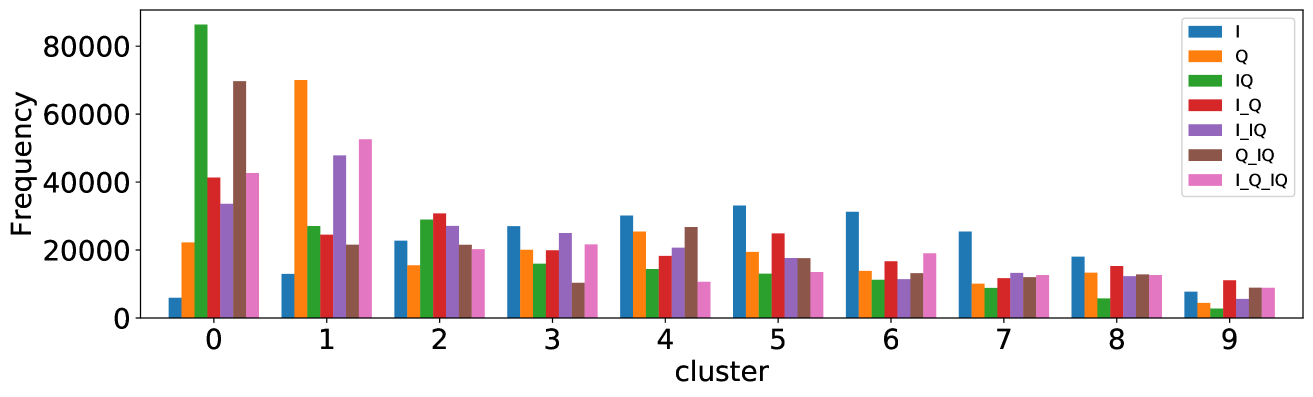
| total | 42637 | 52600 | 20235 | 21643 | 10631 | 13516 | 19010 | 12608 | 12620 | 8854 | |
| Yes/No | 35483 | 44426 | 22 | 262 | 6 | 288 | 23 | 13 | 13 | 5 | |
| Number | 1194 | 1471 | 2770 | 5778 | 253 | 4489 | 4969 | 1255 | 3790 | 2165 | |
| Other | 5960 | 6703 | 17443 | 15603 | 10372 | 8739 | 14018 | 11340 | 8817 | 6684 | |
| # agree | 20762 | 26338 | 6770 | 8528 | 1488 | 1912 | 1988 | 954 | 699 | 789 | |
| # disagree | 21875 | 26262 | 13465 | 13115 | 9143 | 11604 | 17022 | 11654 | 11921 | 8065 | |
| reasons to differ [9] | LQI | 0.050.04 | 0.050.04 | 0.020.03 | 0.030.04 | 0.010.03 | 0.030.04 | 0.030.04 | 0.020.04 | 0.030.04 | 0.060.08 |
| IVE | 0.480.21 | 0.480.21 | 0.110.14 | 0.180.19 | 0.100.10 | 0.230.20 | 0.190.19 | 0.150.15 | 0.240.20 | 0.210.16 | |
| INV | 0.260.14 | 0.250.14 | 0.020.03 | 0.030.05 | 0.010.02 | 0.040.06 | 0.030.04 | 0.020.02 | 0.030.04 | 0.030.03 | |
| DFF | 0.090.07 | 0.080.07 | 0.080.10 | 0.110.11 | 0.070.07 | 0.150.12 | 0.130.12 | 0.100.09 | 0.170.14 | 0.120.08 | |
| AMB | 0.750.13 | 0.760.12 | 0.950.05 | 0.930.07 | 0.960.04 | 0.910.08 | 0.930.06 | 0.940.06 | 0.920.07 | 0.910.08 | |
| SBJ | 0.320.23 | 0.300.23 | 0.130.09 | 0.140.11 | 0.120.08 | 0.130.12 | 0.120.09 | 0.110.09 | 0.110.09 | 0.100.09 | |
| SYN | 0.250.27 | 0.250.26 | 0.810.18 | 0.720.25 | 0.870.12 | 0.650.27 | 0.720.24 | 0.800.18 | 0.680.24 | 0.720.21 | |
| GRN | 0.350.22 | 0.350.22 | 0.790.15 | 0.710.20 | 0.820.11 | 0.660.21 | 0.710.19 | 0.760.16 | 0.670.19 | 0.690.17 | |
| SPM | 0.030.02 | 0.020.01 | 0.010.01 | 0.010.01 | 0.010.01 | 0.010.01 | 0.010.01 | 0.010.01 | 0.010.01 | 0.020.02 | |
| OTH | 0.010.01 | 0.010.01 | 0.000.00 | 0.000.00 | 0.000.00 | 0.000.00 | 0.000.00 | 0.000.00 | 0.000.00 | 0.010.01 |
III-C Clustering results
Now we show the clustering results in Table IV. We used -means to cluster the 3-d vectors of 214,354 visual questions into clusters. Note that many factors (e.g. initialization and number of clusters, chosen algorithms) affect the clustering result, but we will show that similar clustering results are obtained with different parameter settings in experiments. Here we use the simplest algorithm, and a reasonable number of clusters.
Each column of Table IV shows the statistics for each cluster. Clusters are numbered in ascending order of the entropy for the Q+I model. The top rows with ‘base model entropy’ show the entropy values for the three base models.
To find three levels of visual questions, we divide the clusters by the following simple rule. For each cluster,
-
•
if then it is level 1,
-
•
else
-
–
if then it is level 3,
-
–
otherwise level 2.
-
–
Column colors of Table IV indicate levels; level 1 (clusters 0 and 1) are in gray, level 2 in yellow (2 to 6), and level 3 (7, 8, and 9) in red.
Below we describe other rows of Table IV.
-
•
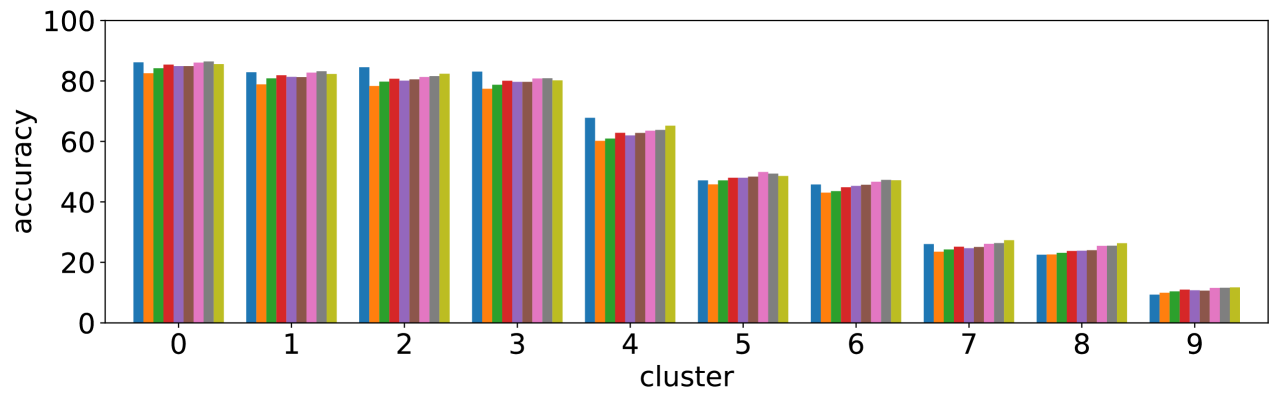
base model acc. Accuracy values of the three base models. Accuracy of Q+I model tends to decrease as Q+I entropy increases, which we will discuss later.
-
•
state-of-the-art entropy and accuracy Entropy and accuracy values of 9 state-of-the-art methods.
-
•
test set entropy Entropy values of the test set of VQA v2. We assign test visual questions to one of these clusters (we will discuss this later).
-
•
GT statistics Statistics of ground truth annotations. Row ‘entropy’ shows entropy values of ground truth annotations. Row ‘ave # ans’ shows the average number of unique answers per visual question. These two rows show how ground truth answers differ in each cluster.
Row ‘total’ shows total numbers of visual questions. Rows ‘yes/no’, ‘number’, and ‘other’ shows numbers of each type in that cluster. Rows ‘# agree’ and ‘# disagree’ show numbers of visual questions for which 10 answers agree (all are the same) and disagree (all are not the same), as in [9].
- •
III-D Discussion
III-D1 Entropy suggests accuracy.
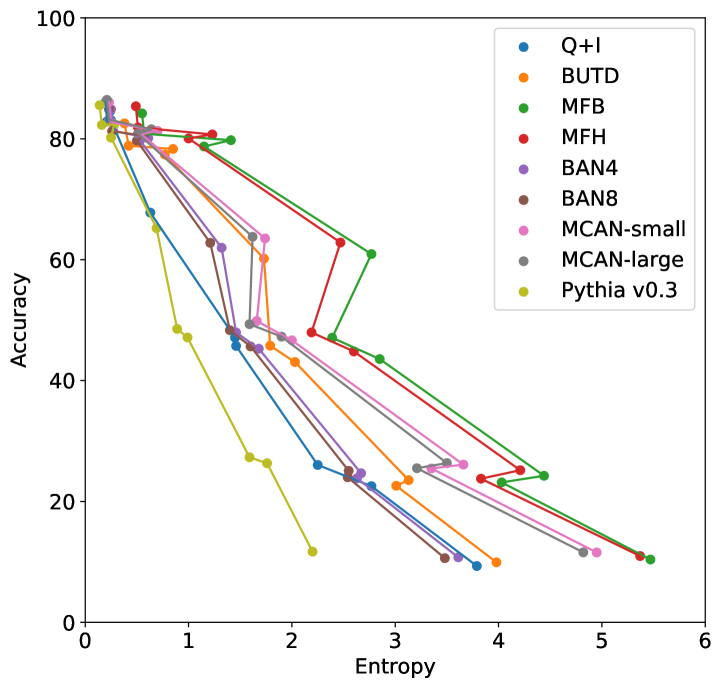
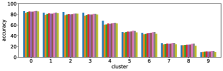
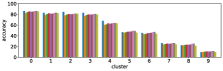
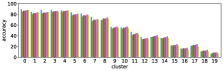
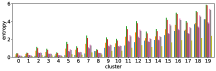
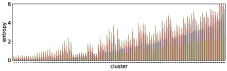
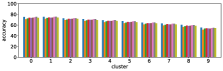
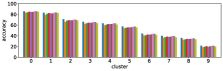
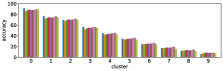
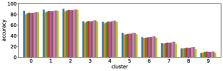
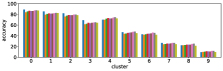
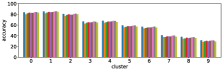
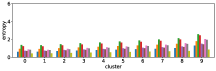
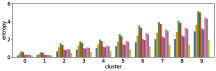
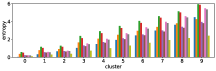
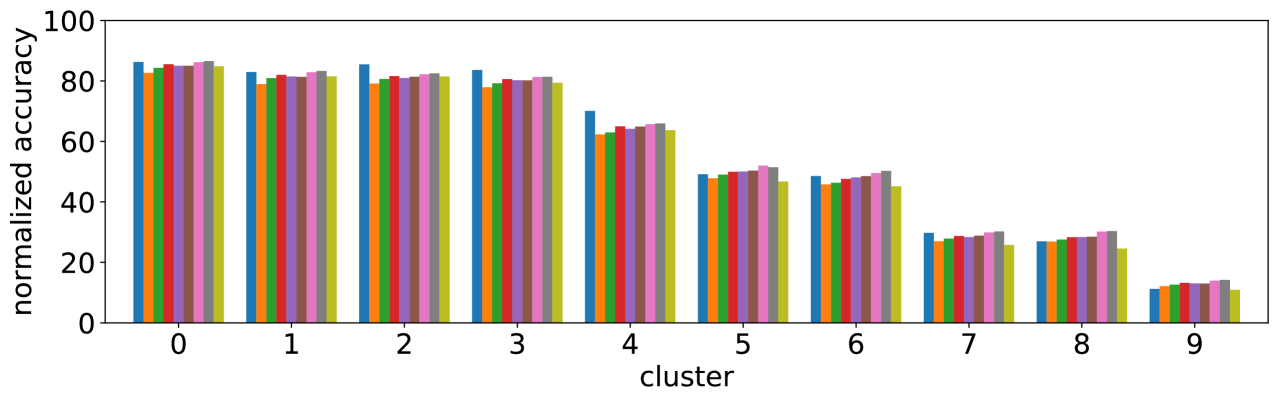
We performed the clustering by using the entropy values of the three models based on Pythia v0.1 [50, 51]. Using a different base model may lead to different clustering results, however the values of entropy and accuracy of different state-of-the-art models exhibit similar trends; entropy values increase while accuracy decreases from cluster 0 to 9, as shown in Figure 3. This suggests that clusters with large (or small) entropy values have low (high) accuracy, as shown in Figure 4, and this tells us that entropy values are an important cue for predicting accuracy.
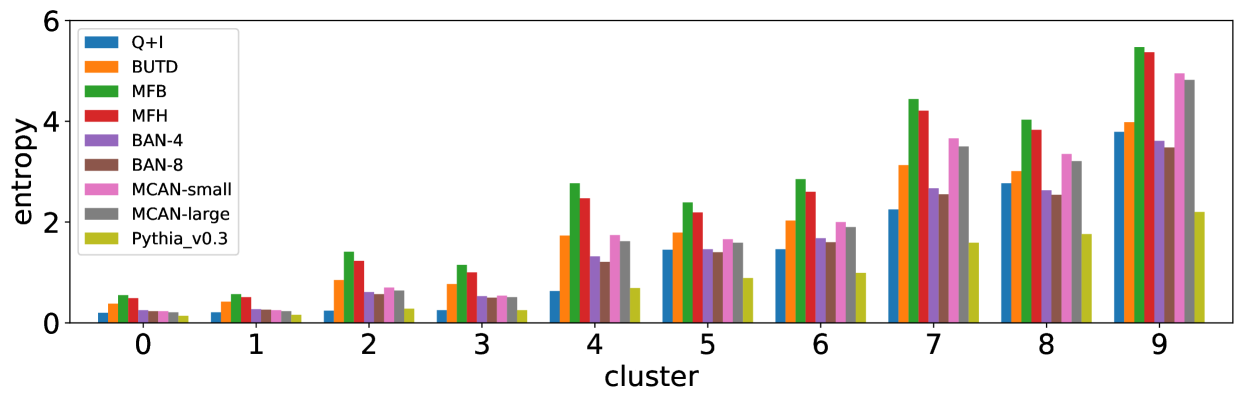
III-D2 Entropy is different from reasons to differ and question types.
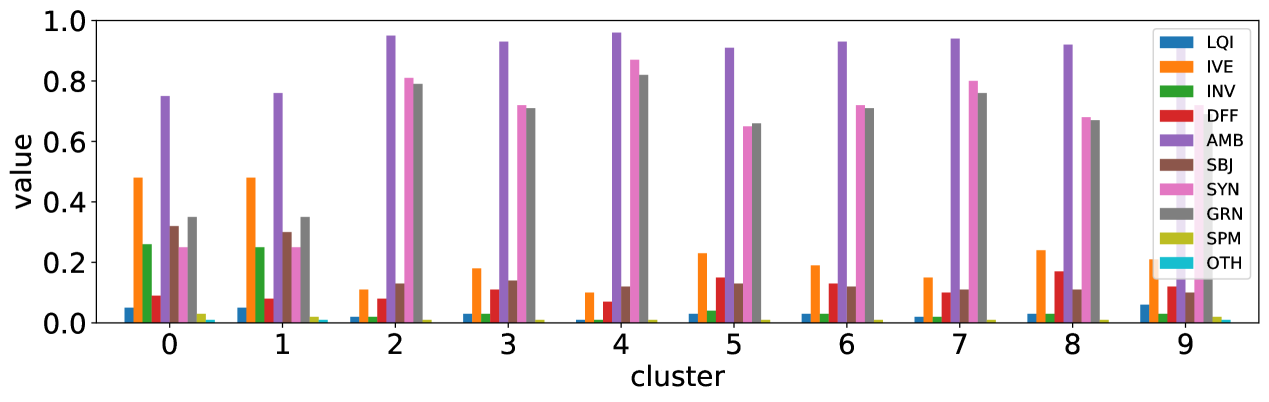
Most frequent reasons to differ shown in [9] are AMB, SYN, and GRN, but Figure 3 shows that predicted values of those reasons are not well correlated to the order of clusters. For question types, Number and Other types looks not related to these clusters. Therefore our approach using entropy captures different aspects of visual questions.
III-D3 Cluster 0 is easy, cluster 9 is hard.
Level 1 (clusters 0 and 1) are dominant, and covers 44% of the entire validation set, including 99% of Yes/No type. Low entropy values and few number of unique answers (row ‘ave # ans’) of these cluster can be explained by the fact that typical answers are either ‘Yes’ or ‘No’. Accuracy of Yes/No type is expected to be about 85% (Table II), and it is close to the accuracy for these clusters. In contrast, level 3 (clusters 7, 8, and 9) looks much more difficult to answer. In particular, accuracy values of cluster 9 are about 10% compared to over 80% of level 1. This is due to the fact that visual questions with disagreed answers gather in this level; GT entropy is about 1.3, with more than five unique answers. However, values of DFF, AMB, SYN and GRN of level 3 are not so different from level 2, which may suggest that the quality of visual questions is not the main reason for difficulty.
III-D4 Difficulty of the test set can be predicted.
This finding enables us to evaluate the difficulty of visual questions in the test set. To see this, we applied the same base models (that are already trained and used for clustering) to visual questions in the test set, and computed entropy values to assign each visual questions to one of the 9 clusters. Rows with ‘test set entropy’ in Table IV show the average entropy values of those test set visual questions. Assuming that the validation and test sets are similar in nature, we now are able to evaluate and predict the difficulty of test-set visual questions without computing accuracy. This is the most interesting result, and we have released a list [57]111 Clustering results are available online at https://github.com/tttamaki/vqd, in which we show lists of pairs of question IDs and clusters for both the validation and test sets of the VQA v2 dataset. that shows which visual questions in the train / val / test sets belong to which cluster. This would be extremely useful when developing a new model incorporating the difficulty of visual questions, and also when evaluating performances for different difficulty levels (not for different question types).
cluster 0
cluster 4
cluster 8
cluster 9
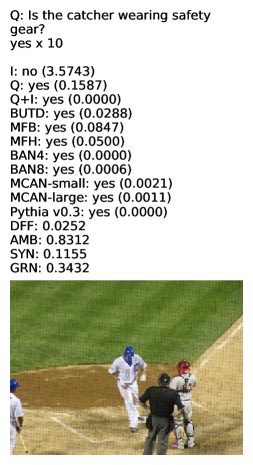
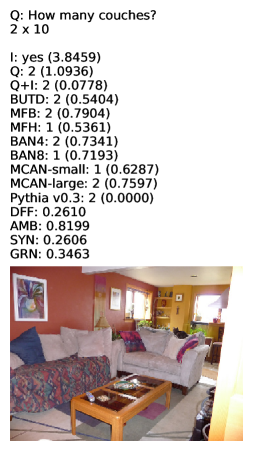
III-D5 Qualitative evaluation of cluster difficulty
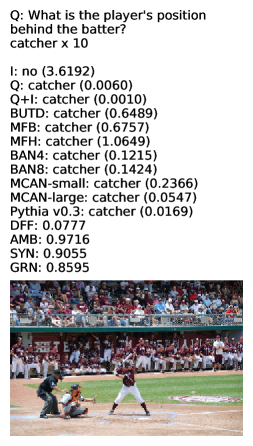
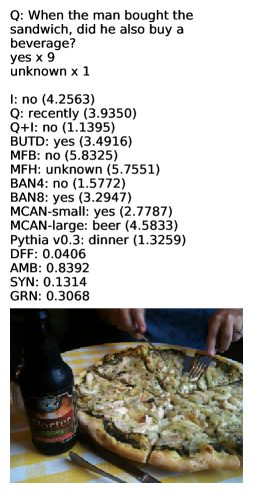
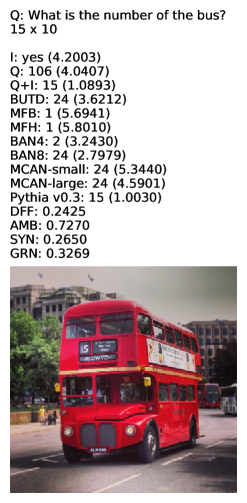
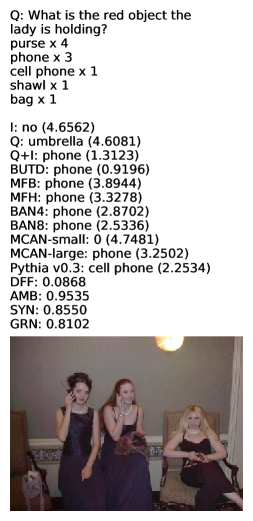
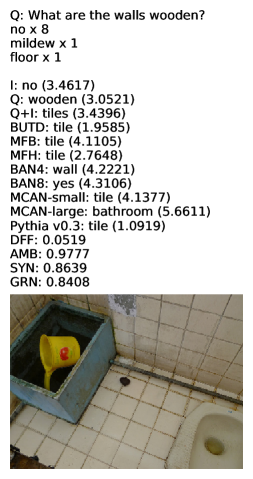
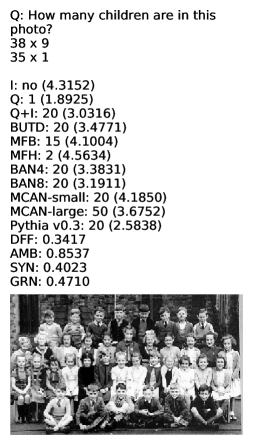
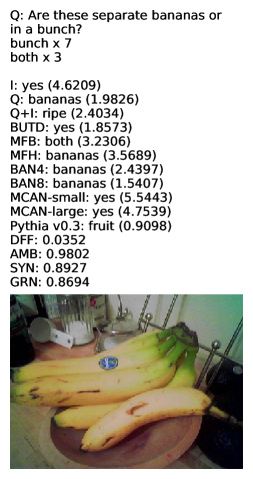
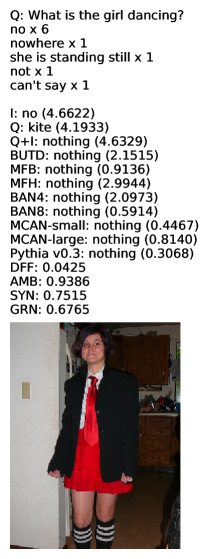
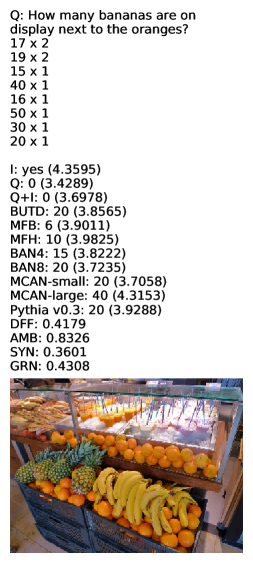
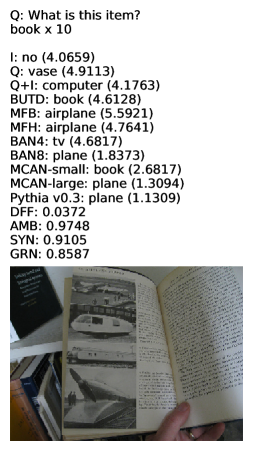
Figure 5 shows some examples of visual questions in each level (from cluster 0, 4, 8, and 9). Entropy values of different methods tend to be larger in cluster 9, and visual questions in cluster 9 seem to be more difficult than those in cluster 0. To answer easy questions like “Is the catcher wearing safety gear?” or “What is the player’s position behind the batter?” in cluster 0, images are not necessary and the Q model can correctly answer with low entropy. The question in cluster 9 at the bottom looks pretty difficult for the models to answer because of the ambiguity of the question (“What is this item?”) and of the image (containing the photos of vehicles on the page of the book) even when the human annotators agree on the single ground-truth annotation.
III-E Disagreement of predictions of different models
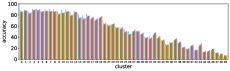
For difficult visual questions the number of unique answers is large, i.e. annotators highly disagree, while for easy questions numbers are small and they agree (5.39 for cluster 9, 1.72 for cluster 0). Now the following question arises; how much do different models (dis)agree, i.e. do they produce the same answer or different answers?
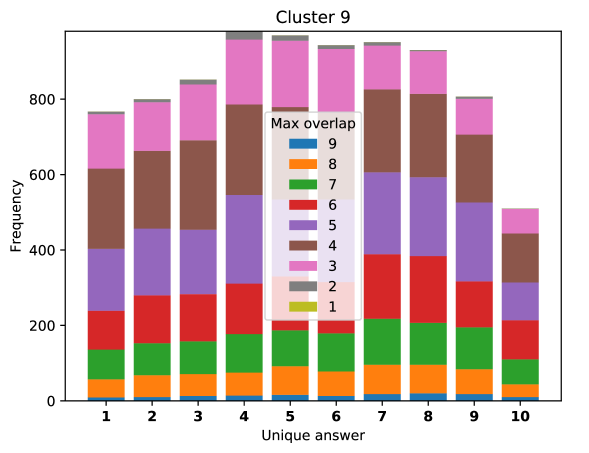
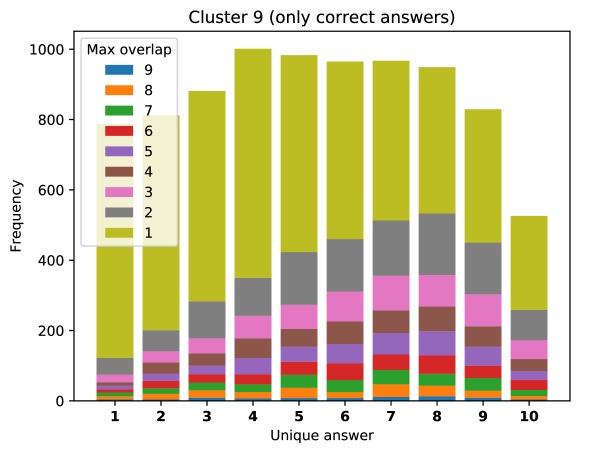
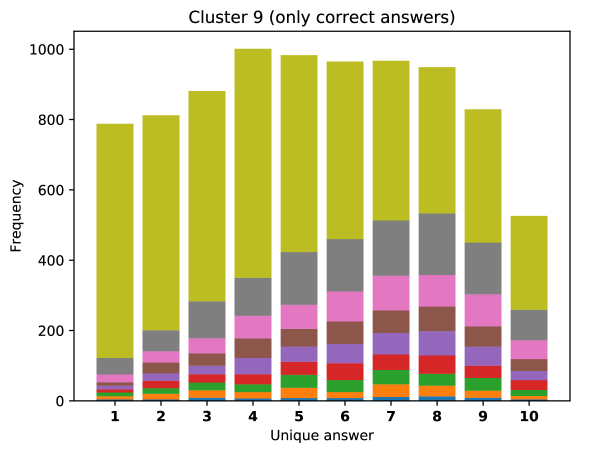
To see this, we define the overlap of model predictions. We have 9 models (BUTD, MFB, MFH, BAN-4/8, MCAN-small/large, Pythia v0.3 and v0.1 (Q+I)), and we define the “overlap” of the answers to be 9 when all models predict the same answer. For example, if we have two different answers to a certain question, each answer produced (supported) by respectively four and five models, then the answer overlaps are four and five, and we call the larger one a max overlap. Therefore, larger max overlap indicates a higher degree of agreement among the models. Figure 6 shows histograms of visual questions with different number of unique answers. The legend shows the details of max overlap. Figure 7 shows similar histograms but the max overlap is counted with correct model answers only.
For clusters 0 and 1, almost visual questions have one or two unique answers, and the models highly agree (max overlap of 9 is dominant). This is expected because most visual questions in these clusters are of Yes/No type, and models tend to agree by predicting either of two answers. Apparently clusters 2, 3, and 4 look similar; dominant max overlap is 9. This means that all of 9 models predict the same answer to almost half of visual questions even when annotators disagree to five different answers. In contrast, models predict different answers to visual questions of clusters 6 – 9 even when annotators agree and there is a single ground truth answer (this is the case in the middle of cluster 8 column in Figure 5). Filling this gap may be a promising research direction for the next generation VQA models.


IV Conclusions
We have presented a novel way of evaluating the difficulty of visual questions of the VQA v2 dataset. Our approach is surprisingly simple, using three base models (I, Q, Q+I), predicting answer distributions, and computing entropy values to perform clustering with a simple -means. Experimental results have shown that these clusters are strongly correlated with entropy and accuracy values of many models including state-of-the-art methods.
Our work can be used in many different ways. One example is to use our work to classify the difficulty of visual questions to switch different network branches, like in [15] which has a question-type classifier to use different branches. Another example is to apply a curriculum learning framework by training a model with easy visual questions first, then gradually using more difficult ones. Another possible direction would include judging if questions generated by VQA and visual dialog models are appropriate to ask. However, using our work as a component is not the only possible way, because our work provides additional insights into visual questions. For example, cluster 9 contains many visual questions that require reading text in the image, which is recently explored as a new task by TextVQA [20]. This cluster also has visual questions of different types of difficulty, therefore the results of our work have the potential to inspire more interesting new tasks that have never been explored. By providing the correspondences between clusters and visual questions in the test set as an indicator of difficulty [57], our approach explores a novel aspect of evaluating performances of VQA models, suggesting a promising direction for future development of a next generation of VQA models.
Additional Experiments
-A Further analysis
Here we give a more detailed analysis of the clustering results.
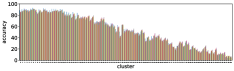
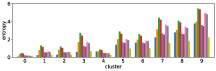
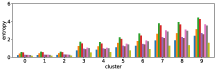
-A1 Robustness to clustering initialization
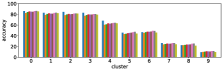
In section III-C, we argue that similar results are obtained while many factors including initialization affect the clustering result. Figures 8 and 9 show results corresponding to Figure 3, but repeated 5 more times with different initialization of the -means clustering algorithm: the k-means++ initialization scheme [58] for Figure 8, and random initialization for Figure 9.
These figures show that we obtain similar results even with different initializations of the -means algorithm. This demonstrates the robustness of our approach to the clustering initialization.


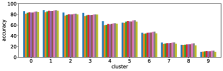


-A2 Robustness to the number of clusters
Figure 10 shows results corresponding to Figure 3, but with different number of clusters for the -means clustering. As stated before, the number of clusters affects the clustering result. However we can see in these figures that similar results are obtained with both fewer clusters and more clusters . This also demonstrate the robustness of our approach to the number of clusters.


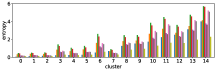
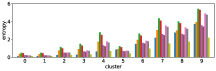
-A3 Effect of clustering with different features
Figure 11 shows results corresponding to Figure 3, but when using different features in the -means clustering algorithm. We use the entropy values of answer predictions obtained from three different models: I, Q, and Q+I. Therefore we can use different subsets of the three models for clustering.
The first three rows of Figure 11 show the clustering results obtained when using only one of the three models. The row (I) is obtained from the clustering result with the I model only, and so on. As expected, the results for the I model only show that there is little correlation between accuracy and the order of clusters, while the Q+I and Q models shows better correlations. The next three rows of Figure 11 show clustering results obtained when using two of the three models together. The row (I and Q+I) is obtained from the clustering result with the I and Q+I models, and so on. Again, the combinations with the Q model seems to affect the correlation.
The row (Q+I) exhibits the largest correlation, however this is due to the sample unbalance between clusters, as shown in Figure 12. In contrast, the combination (I, Q, and Q+I) has a better sample balance, i.e. samples are well distributed across clusters. Future work includes a more qualitative investigation of this issue.


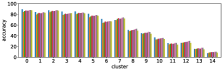
-A4 Normalization of accuracy
The clustering result (Figure 3) shows that large entropy leads to low accuracy. However this might be due to the disagreement of answers by annotators. As shown in Table IV, clusters with large entropy values tend to disagree, i.e., the entropy values and average number of unique answers of ground truth are larger.
The accuracy is defined by Eq. (2), and it is bounded above by the number of ground truth answers. If annotators disagree completely on a certain visual question, each unique answer is provided by one annotator, then the accuracy is at most 33%. This might cause an apparent reduction of accuracy for clusters with large entropy.
To remove this effect, we define a normalized version of accuracy as follows;
| (3) |
where is the the set of all possible answers. This becomes 100% for the case of complete disagreement if the predicted answer is one among 10 different ground truth answers.
Figure 13 shows results corresponding to Figure 3, and results with the normalized accuracy. As can be seen, the result for the normalized accuracy is very similar to that obtained with the original accuracy. Therefore we can conclude that the result is due to the nature of our approach, and not due to the effect of apparent reduction.
Acknowledgement
We would like to thank Yoshitaka Ushiku for his support as a mentor of the PRMU mentorship program.
References
- [1] Q. Wu, D. Teney, P. Wang, C. Shen, A. Dick, and A. van den Hengel, “Visual question answering: A survey of methods and datasets,” Computer Vision and Image Understanding, vol. 163, pp. 21 – 40, 2017, language in Vision. [Online]. Available: http://www.sciencedirect.com/science/article/pii/S1077314217300772
- [2] S. Antol, A. Agrawal, J. Lu, M. Mitchell, D. Batra, C. L. Zitnick, and D. Parikh, “VQA: Visual Question Answering,” in International Conference on Computer Vision (ICCV), 2015.
- [3] D. Gurari, Q. Li, A. J. Stangl, A. Guo, C. Lin, K. Grauman, J. Luo, and J. P. Bigham, “Vizwiz grand challenge: Answering visual questions from blind people,” in The IEEE Conference on Computer Vision and Pattern Recognition (CVPR), June 2018.
- [4] A. Das, S. Datta, G. Gkioxari, S. Lee, D. Parikh, and D. Batra, “Embodied Question Answering,” in Proceedings of the IEEE Conference on Computer Vision and Pattern Recognition (CVPR), 2018.
- [5] A. Das, S. Kottur, K. Gupta, A. Singh, D. Yadav, J. M. Moura, D. Parikh, and D. Batra, “Visual Dialog,” in Proceedings of the IEEE Conference on Computer Vision and Pattern Recognition (CVPR), 2017.
- [6] Y. Goyal, T. Khot, D. Summers-Stay, D. Batra, and D. Parikh, “Making the V in VQA matter: Elevating the role of image understanding in Visual Question Answering,” in Conference on Computer Vision and Pattern Recognition (CVPR), 2017.
- [7] J. P. Bigham, C. Jayant, H. Ji, G. Little, A. Miller, R. C. Miller, R. Miller, A. Tatarowicz, B. White, S. White, and T. Yeh, “Vizwiz: Nearly real-time answers to visual questions,” in Proceedings of the 23Nd Annual ACM Symposium on User Interface Software and Technology, ser. UIST ’10. New York, NY, USA: ACM, 2010, pp. 333–342. [Online]. Available: http://doi.acm.org/10.1145/1866029.1866080
- [8] D. Gurari and K. Grauman, “Crowdverge: Predicting if people will agree on the answer to a visual question,” in Proceedings of the 2017 CHI Conference on Human Factors in Computing Systems, ser. CHI ’17. New York, NY, USA: ACM, 2017, pp. 3511–3522. [Online]. Available: http://doi.acm.org/10.1145/3025453.3025781
- [9] N. Bhattacharya, Q. Li, and D. Gurari, “Why does a visual question have different answers?” in The IEEE International Conference on Computer Vision (ICCV), October 2019.
- [10] F. Daniel, P. Kucherbaev, C. Cappiello, B. Benatallah, and M. Allahbakhsh, “Quality control in crowdsourcing: A survey of quality attributes, assessment techniques, and assurance actions,” ACM Comput. Surv., vol. 51, no. 1, pp. 7:1–7:40, Jan. 2018. [Online]. Available: http://doi.acm.org/10.1145/3148148
- [11] G. Soberón, L. Aroyo, C. Welty, O. Inel, H. Lin, and M. Overmeen, “Measuring crowd truth: Disagreement metrics combined with worker behavior filters,” in Proceedings of the 1st International Conference on Crowdsourcing the Semantic Web - Volume 1030, ser. CrowdSem’13. Aachen, Germany, Germany: CEUR-WS.org, 2013, pp. 45–58. [Online]. Available: http://dl.acm.org/citation.cfm?id=2874376.2874381
- [12] J. Muhammadi and H. R. Rabiee, “Crowd computing: a survey,” CoRR, vol. abs/1301.2774, 2013. [Online]. Available: http://arxiv.org/abs/1301.2774
- [13] M. Malinowski, M. Rohrbach, and M. Fritz, “Ask your neurons: A neural-based approach to answering questions about images,” in The IEEE International Conference on Computer Vision (ICCV), December 2015.
- [14] C. Yang, K. Grauman, and D. Gurari, “Visual question answer diversity,” in Proceedings of the Sixth AAAI Conference on Human Computation and Crowdsourcing, HCOMP 2018, Zürich, Switzerland, July 5-8, 2018, 2018, pp. 184–192. [Online]. Available: https://aaai.org/ocs/index.php/HCOMP/HCOMP18/paper/view/17936
- [15] A. Agrawal, D. Batra, D. Parikh, and A. Kembhavi, “Don’t just assume; look and answer: Overcoming priors for visual question answering,” in The IEEE Conference on Computer Vision and Pattern Recognition (CVPR), June 2018.
- [16] Y. Goyal, A. Mohapatra, D. Parikh, and D. Batra, “Towards transparent ai systems: Interpreting visual question answering models,” in International Conference on Machine Learning (ICML) Workshop on Visualization for Deep Learning, 2016. [Online]. Available: https://icmlviz.github.io/icmlviz2016/assets/papers/22.pdf
- [17] A. Das, H. Agrawal, L. Zitnick, D. Parikh, and D. Batra, “Human attention in visual question answering: Do humans and deep networks look at the same regions?” in International Conference on Machine Learning (ICML) Workshop on Visualization for Deep Learning, 2016. [Online]. Available: https://icmlviz.github.io/icmlviz2016/assets/papers/17.pdf
- [18] C. Jing, Y. Wu, X. Zhang, Y. Jia, and Q. Wu, “Overcoming language priors in vqa via decomposed linguistic representations,” in Thirty-Fourth AAAI Conference on Artificial Intelligence, Feb 2020.
- [19] S. Ramakrishnan, A. Agrawal, and S. Lee, “Overcoming language priors in visual question answering with adversarial regularization,” in Advances in Neural Information Processing Systems 31, S. Bengio, H. Wallach, H. Larochelle, K. Grauman, N. Cesa-Bianchi, and R. Garnett, Eds. Curran Associates, Inc., 2018, pp. 1541–1551. [Online]. Available: http://papers.nips.cc/paper/7427-overcoming-language-priors-in-visual-question-answering-with-adversarial-regularization.pdf
- [20] A. Singh, V. Natarajan, M. Shah, Y. Jiang, X. Chen, D. Batra, D. Parikh, and M. Rohrbach, “Towards vqa models that can read,” in Proceedings of the IEEE Conference on Computer Vision and Pattern Recognition, 2019.
- [21] P. Wang, Q. Wu, C. Shen, A. R. Dick, and A. van den Hengel, “FVQA: fact-based visual question answering,” IEEE Trans. Pattern Anal. Mach. Intell., vol. 40, no. 10, pp. 2413–2427, 2018. [Online]. Available: https://doi.org/10.1109/TPAMI.2017.2754246
- [22] K. Marino, M. Rastegari, A. Farhadi, and R. Mottaghi, “Ok-vqa: A visual question answering benchmark requiring external knowledge,” in The IEEE Conference on Computer Vision and Pattern Recognition (CVPR), June 2019.
- [23] A. K. Singh, A. Mishra, S. Shekhar, and A. Chakraborty, “From strings to things: Knowledge-enabled vqa model that can read and reason,” in The IEEE International Conference on Computer Vision (ICCV), October 2019.
- [24] N. Garcia, M. Otani, C. Chu, and Y. Nakashima, “Knowit vqa: Answering knowledge-based questions about videos,” in Thirty-Fourth AAAI Conference on Artificial Intelligence, Feb 2020.
- [25] N. Mostafazadeh, I. Misra, J. Devlin, M. Mitchell, X. He, and L. Vanderwende, “Generating natural questions about an image,” in Proceedings of the 54th Annual Meeting of the Association for Computational Linguistics (Volume 1: Long Papers). Berlin, Germany: Association for Computational Linguistics, Aug. 2016, pp. 1802–1813. [Online]. Available: https://www.aclweb.org/anthology/P16-1170
- [26] Y. Li, N. Duan, B. Zhou, X. Chu, W. Ouyang, X. Wang, and M. Zhou, “Visual question generation as dual task of visual question answering,” in The IEEE Conference on Computer Vision and Pattern Recognition (CVPR), June 2018.
- [27] U. Jain, S. Lazebnik, and A. G. Schwing, “Two can play this game: Visual dialog with discriminative question generation and answering,” in The IEEE Conference on Computer Vision and Pattern Recognition (CVPR), June 2018.
- [28] T. Shen, A. Kar, and S. Fidler, “Learning to caption images through a lifetime by asking questions,” in The IEEE International Conference on Computer Vision (ICCV), October 2019.
- [29] Y. Zhu, O. Groth, M. Bernstein, and L. Fei-Fei, “Visual7W: Grounded Question Answering in Images,” in IEEE Conference on Computer Vision and Pattern Recognition, 2016.
- [30] L. Yu, E. Park, A. C. Berg, and T. L. Berg, “Visual madlibs: Fill in the blank description generation and question answering,” in The IEEE International Conference on Computer Vision (ICCV), December 2015.
- [31] J. Johnson, B. Hariharan, L. van der Maaten, L. Fei-Fei, C. Lawrence Zitnick, and R. Girshick, “Clevr: A diagnostic dataset for compositional language and elementary visual reasoning,” in The IEEE Conference on Computer Vision and Pattern Recognition (CVPR), July 2017.
- [32] M. Ren, R. Kiros, and R. Zemel, “Exploring models and data for image question answering,” in Advances in Neural Information Processing Systems 28, C. Cortes, N. D. Lawrence, D. D. Lee, M. Sugiyama, and R. Garnett, Eds. Curran Associates, Inc., 2015, pp. 2953–2961. [Online]. Available: http://papers.nips.cc/paper/5640-exploring-models-and-data-for-image-question-answering.pdf
- [33] K. Kafle and C. Kanan, “An analysis of visual question answering algorithms,” in ICCV, 2017.
- [34] R. Krishna, Y. Zhu, O. Groth, J. Johnson, K. Hata, J. Kravitz, S. Chen, Y. Kalantidis, L.-J. Li, D. A. Shamma, M. Bernstein, and L. Fei-Fei, “Visual genome: Connecting language and vision using crowdsourced dense image annotations,” in CoRR, 2016. [Online]. Available: https://arxiv.org/abs/1602.07332
- [35] H. Gao, J. Mao, J. Zhou, Z. Huang, L. Wang, and W. Xu, “Are you talking to a machine? dataset and methods for multilingual image question,” in Advances in Neural Information Processing Systems 28, C. Cortes, N. D. Lawrence, D. D. Lee, M. Sugiyama, and R. Garnett, Eds. Curran Associates, Inc., 2015, pp. 2296–2304. [Online]. Available: http://papers.nips.cc/paper/5641-are-you-talking-to-a-machine-dataset-and-methods-for-multilingual-image-question.pdf
- [36] Z. Yu, J. Yu, C. Xiang, J. Fan, and D. Tao, “Beyond bilinear: Generalized multimodal factorized high-order pooling for visual question answering,” IEEE Transactions on Neural Networks and Learning Systems, vol. 29, no. 12, pp. 5947–5959, 2018.
- [37] H. Nam, J.-W. Ha, and J. Kim, “Dual attention networks for multimodal reasoning and matching,” in The IEEE Conference on Computer Vision and Pattern Recognition (CVPR), July 2017.
- [38] H. Xu and K. Saenko, “Ask, attend and answer: Exploring question-guided spatial attention for visual question answering,” in Computer Vision – ECCV 2016, B. Leibe, J. Matas, N. Sebe, and M. Welling, Eds. Cham: Springer International Publishing, 2016, pp. 451–466.
- [39] D.-K. Nguyen and T. Okatani, “Improved fusion of visual and language representations by dense symmetric co-attention for visual question answering,” in The IEEE Conference on Computer Vision and Pattern Recognition (CVPR), June 2018.
- [40] J.-H. Kim, J. Jun, and B.-T. Zhang, “Bilinear attention networks,” in Advances in Neural Information Processing Systems 31, S. Bengio, H. Wallach, H. Larochelle, K. Grauman, N. Cesa-Bianchi, and R. Garnett, Eds. Curran Associates, Inc., 2018, pp. 1564–1574. [Online]. Available: http://papers.nips.cc/paper/7429-bilinear-attention-networks.pdf
- [41] Z. Yu, J. Yu, Y. Cui, D. Tao, and Q. Tian, “Deep modular co-attention networks for visual question answering,” in The IEEE Conference on Computer Vision and Pattern Recognition (CVPR), June 2019.
- [42] L. Chen, X. Yan, J. Xiao, H. Zhang, S. Pu, and Y. Zhuang, “Counterfactual samples synthesizing for robust visual question answering,” in IEEE/CVF Conference on Computer Vision and Pattern Recognition (CVPR), June 2020.
- [43] X. Wang, Y. Liu, C. Shen, C. C. Ng, C. Luo, L. Jin, C. S. Chan, A. v. d. Hengel, and L. Wang, “On the general value of evidence, and bilingual scene-text visual question answering,” in IEEE/CVF Conference on Computer Vision and Pattern Recognition (CVPR), June 2020.
- [44] V. Agarwal, R. Shetty, and M. Fritz, “Towards causal vqa: Revealing and reducing spurious correlations by invariant and covariant semantic editing,” in IEEE/CVF Conference on Computer Vision and Pattern Recognition (CVPR), June 2020.
- [45] B. N. Patro, Anupriy, and V. P. Namboodiri, “Explanation vs attention: A two-player game to obtain attention for vqa,” in Thirty-Fourth AAAI Conference on Artificial Intelligence, Feb 2020.
- [46] D. Teney, P. Anderson, X. He, and A. van den Hengel, “Tips and tricks for visual question answering: Learnings from the 2017 challenge,” in The IEEE Conference on Computer Vision and Pattern Recognition (CVPR), June 2018.
- [47] X. Wang and A. Gupta, “Unsupervised learning of visual representations using videos,” in The IEEE International Conference on Computer Vision (ICCV), December 2015.
- [48] A. Shrivastava, A. Gupta, and R. Girshick, “Training region-based object detectors with online hard example mining,” in The IEEE Conference on Computer Vision and Pattern Recognition (CVPR), June 2016.
- [49] P. Wang and N. Vasconcelos, “Towards realistic predictors,” in The European Conference on Computer Vision (ECCV), September 2018.
- [50] Y. Jiang, V. Natarajan, X. Chen, M. Rohrbach, D. Batra, and D. Parikh, “Pythia v0.1: the winning entry to the VQA challenge 2018,” CoRR, vol. abs/1807.09956, 2018. [Online]. Available: http://arxiv.org/abs/1807.09956
- [51] A. Singh, V. Natarajan, Y. Jiang, X. Chen, M. Shah, M. Rohrbach, D. Batra, and D. Parikh, “Pythia-a platform for vision & language research,” in SysML Workshop, NeurIPS, vol. 2018, 2018.
- [52] P. Anderson, X. He, C. Buehler, D. Teney, M. Johnson, S. Gould, and L. Zhang, “Bottom-up and top-down attention for image captioning and visual question answering,” in The IEEE Conference on Computer Vision and Pattern Recognition (CVPR), June 2018.
- [53] J. Lu, D. Batra, D. Parikh, and S. Lee, “Vilbert: Pretraining task-agnostic visiolinguistic representations for vision-and-language tasks,” arXiv preprint arXiv:1908.02265, 2019.
- [54] A. Fukui, D. H. Park, D. Yang, A. Rohrbach, T. Darrell, and M. Rohrbach, “Multimodal compact bilinear pooling for visual question answering and visual grounding,” in Proceedings of the 2016 Conference on Empirical Methods in Natural Language Processing. Austin, Texas: Association for Computational Linguistics, Nov. 2016, pp. 457–468. [Online]. Available: https://www.aclweb.org/anthology/D16-1044
- [55] J. Lu, J. Yang, D. Batra, and D. Parikh, “Hierarchical question-image co-attention for visual question answering,” in Advances in Neural Information Processing Systems 29, D. D. Lee, M. Sugiyama, U. V. Luxburg, I. Guyon, and R. Garnett, Eds. Curran Associates, Inc., 2016, pp. 289–297. [Online]. Available: http://papers.nips.cc/paper/6202-hierarchical-question-image-co-attention-for-visual-question-answering.pdf
- [56] Z. Yu, J. Yu, J. Fan, and D. Tao, “Multi-modal factorized bilinear pooling with co-attention learning for visual question answering,” in The IEEE International Conference on Computer Vision (ICCV), Oct 2017.
- [57] T. Tamaki, “Visual Question Difficulty (VQD),” https://github.com/tttamaki/vqd/, March 2020, doi:10.5281/zenodo.3725534.
- [58] D. Arthur and S. Vassilvitskii, “K-means++: The advantages of careful seeding,” in Proceedings of the Eighteenth Annual ACM-SIAM Symposium on Discrete Algorithms, ser. SODA ’07. USA: Society for Industrial and Applied Mathematics, 2007, p. 1027–1035.
![[Uncaptioned image]](https://cdn.awesomepapers.org/papers/3df6307c-f4e6-40cb-8f54-c8eaea345ba0/Terao.jpg) |
Kento Terao received his B.E. and M.S. degrees in information engineering from Hiroshima University, Japan, in 2018 and 2020, respectively. His research interests include visual question answering and generation. |
![[Uncaptioned image]](https://cdn.awesomepapers.org/papers/3df6307c-f4e6-40cb-8f54-c8eaea345ba0/Tamaki.jpg) |
Toru Tamaki received his B.E., M.S., and Ph.D. degrees in information engineering from Nagoya University, Japan, in 1996, 1998 and 2001, respectively. After being an assistant professor at Niigata University, Japan, from 2001 to 2005, he is currently an associate professor at the Department of Information Engineering, Graduate School of Engineering, Hiroshima University, Japan. He was an associate researcher at ESIEE Paris, France, in 2015. His research interests include computer vision, image recognition, and machine learning. |
![[Uncaptioned image]](https://cdn.awesomepapers.org/papers/3df6307c-f4e6-40cb-8f54-c8eaea345ba0/Raytchev.jpg) |
Bisser Raytchev received his Ph.D. in Informatics from Tsukuba University, Japan in 2000. After being a research associate at NTT Communication Science Labs and AIST, he is presently an associate professor in the Department of Information Engineering, Hiroshima University, Japan. His current research interests include machine learning, computer vision, natural language processing and brain-inspired computing. |
![[Uncaptioned image]](https://cdn.awesomepapers.org/papers/3df6307c-f4e6-40cb-8f54-c8eaea345ba0/Kaneda.jpg) |
Kazufumi Kaneda is a professor in the Department of Information Engineering, Hiroshima University, Japan. He joined Hiroshima University in 1986. He was a visiting researcher in the Engineering Computer Graphics laboratory at Brigham Young University in 1991. Kaneda received the B.E., M.E., and D.E. in 1982, 1984 and 1991, respectively, from Hiroshima University. His research interests include computer graphics, scientific visualization, and image processing. |
![[Uncaptioned image]](https://cdn.awesomepapers.org/papers/3df6307c-f4e6-40cb-8f54-c8eaea345ba0/Satoh.jpg) |
Shin’ichi Satoh received the B.E. degree in electronics engineering and the M.E. and Ph.D. degrees in information engineering from the University of Tokyo, Tokyo, Japan, in 1987, 1989, and 1992, respectively. He was a Visiting Scientist with the Robotics Institute, Carnegie Mellon University, Pittsburgh, PA, USA, from 1995 to 1997. He has been a Full Professor with the National Institute of Informatics, Tokyo, Japan, since 2004. His current research interests include image processing, video content analysis, and multimedia databases. |