An Exploratory Study on Visual Exploration
of Model Simulations by Multiple Types of Experts
Abstract.
Experts in different domains rely increasingly on simulation models of complex processes to reach insights, make decisions, and plan future projects. These models are often used to study possible trade-offs, as experts try to optimise multiple conflicting objectives in a single investigation. Understanding all the model intricacies, however, is challenging for a single domain expert. We propose a simple approach to support multiple experts when exploring complex model results. First, we reduce the model exploration space, then present the results on a shared interactive surface, in the form of a scatterplot matrix and linked views. To explore how multiple experts analyse trade-offs using this setup, we carried out an observational study focusing on the link between expertise and insight generation during the analysis process. Our results reveal the different exploration strategies and multi-storyline approaches that domain experts adopt during trade-off analysis, and inform our recommendations for collaborative model exploration systems.
1. Introduction
As our knowledge of complex processes increases, to conduct their work domain experts rely often on the use of models, i.e., abstract representations of entities and relationships within a specific domain or process. They have to manipulate these sometimes complex models for their daily work to reach insights, make decisions, and plan future projects. For example, agronomic engineers who want to propose robust wheat fertilisation strategies to farmers, need to account for the wheat growth process and how it is affected by soil and weather conditions. To do this, they manipulate existing wheat growth models (Brisson et al., 1998; Jeuffroy and Recous, 1999) that help them explore how, for example, a late fertilisation impacts wheat yield and quality, and whether the outcome changes depending on weather conditions. To effectively manipulate such models, domain experts currently face three key challenges pertaining to: the multiple competing objectives experts have to handle, the complex exploration space they need to navigate through, and the multiple expertise required for model understanding.
First, domain experts have to deal with trade-offs. Their work often attempts to reconcile multiple competing objectives in a single investigation (Sedlmair et al., 2014). For instance, agronomic engineers look for fertalisation strategies that on the one hand maximise yield, and on the other hand reduce the amount of supplied fertilisers, and the nitrogen loss (Ravier et al., 2018; Cui et al., 2010).
Second, domain experts often resort to model simulations to explore trade-offs that can generate complex outcomes. The results of such simulations are huge numerical data files which are difficult to explore manually. Yet, finding robust solutions cannot be done automatically, since resolving conflicts between multiple criteria necessitates subjective human judgement (Sedlmair et al., 2014). For example, agronomic engineers use their expertise to specify the acceptable threshold for wheat quality, and how much delay farmers would tolerate before they can supply fertilisers.
Third, understanding the model intricacies is challenging, even for domain experts. Such models are often written by third parties (modelling experts or other domain experts), and require extensive technical knowledge to understand. This challenge can be amplified when domain experts are only specialists in part of the underlying process. For example, one agronomic engineer may be an expert in fertilisation strategies for one environment, but does not fully understand the impact of climate on other geographical regions. Given the complexity of the modelled process, the model intricacies and the exploration space, it is rare for a single domain expert to fully comprehend all those aspects in depth.
Previous work with domain experts from agronomy (Boukhelifa et al., 2017b), highlights the lack of accessible setups and visual support tools to manipulate complex models and trade-off spaces. This observation may well apply to other domains where complex data and model spaces are analysed (Boukhelifa et al., 2017a). Before building such support tools, we need to understand how domain experts explore models, including their trade-off spaces.
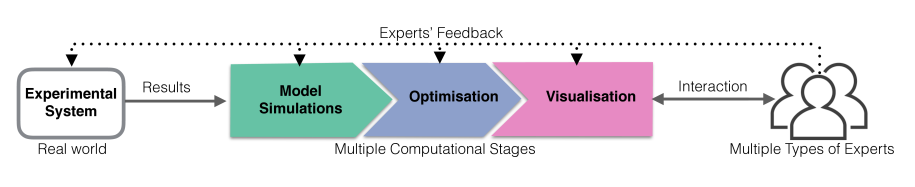
We propose a simple setup for model exploration, and a user study that adopts it, in order to better understand how multiple domain experts explore complex models. Our user study is based on two model use-cases (Mouret et al., 2015; Jeuffroy and Recous, 1999). Each use-case consists of two case studies of real scenarios explored by experts. Our method (Figure 1) consists of first conducting a Multi-objective Optimisation (MO) to reduce the model exploration space. This results in a multi-dimensional Pareto Front, which is explored visually using a scatterplot matrix (SPLOM) and linked 2D views on a shared interactive surface (Figure 2). In each use-case, we recruited participants with different expertise, covering the study domain, the numerical model, the simulation and optimisation, and the Pareto front visualization. Such a setup ensures that the various types of insights and expertise are aligned, and facilitates the validation of the findings from different perspectives (Chuang et al., 2012).
We contribute: (1) A simple setup that facilitates the visual exploration and validation of complex models by synchronising expertise from the study domain, modelling, optimisation and visualization. (2) An observational study using the setup, that inspects the role of expertise in insight generation during model-exploration and trade-off analysis. Our results revealed iterative analysis approaches with branching scenarios. We identified analysis scenarios where multiple types of experts examine together new and refined research questions and hypotheses (new, refine, alternative, compare), and other scenarios where they learn to appropriate the tool and setup (initial), and attempt to recap and establish common ground (storytelling). And (3) design recommendations for collaborative model exploration systems.
2. Related Work
The nature of sensemaking activities and the cognitive processes involved have been the subject of established work (Pirolli and Card, 2005; Klein et al., 2007), with recent studies focusing on how groups establish common ground (Clark and Brennan, 1991; Convertino et al., 2008; Willett et al., 2011; Gergle et al., 2013), uncover hidden knowledge (Convertino et al., 2009; Goyal and Fussell, 2016), and engage with large analyses (Feinberg, 2017; Kery et al., 2018; Passi and Jackson, 2017, 2018; Pine and Liboiron, 2015). In terms of general sensemaking, the data-frame model (Klein et al., 2007) describes several key macrocogintive processes relevant to our own investigation, including connecting data to a frame (an explanation reflecting person’s compiled experience), reframing, elaborating, questioning and comparing frames. The more recent work detail additional behavioural and analytical processes observed in collaborative settings. Our work is orthogonal, focusing on the role of expertise. In terms of analysis methods, our work is similar to (Guo et al., 2016) who performed an insight-based user study to understand how analysts reach insight during visual exploration. Our focus, however, is on collaborative model exploration, in particular for trade-off analysis.
2.1. Insight and Expertise
Insight is considered the goal of visualization (Card, 1999). However, there is no consensus on the exact meaning of the term. North (North, 2006) focuses on the key characteristics of insight, which are complexity, depth, quality, unexpectedness and relevance. In contrast, Chang et al. (Chang et al., 2009) distinguish spontaneous insight from the insight traditionally described in visualization, which they describe is about knowledge-building and model-confirmation, and where schematic structures, such as a mental model, are important to find patterns as well as to infer them. Furthermore, Pousman et al. (Pousman et al., 2007) explore the notion of multiple types of insights for a broad range of user groups and describe analytic, awareness, social and reflective insights. Considering insight as a process rather than the end result, Yi et al. (Yi et al., 2008) describe four key processes of how people reach insight: provide overview, adjust, detect pattern, and match mental model.
We follow Saraiya et al.’s (Saraiya et al., 2005) definition of insight as “an individual observation about the data by the participant, a unit of discovery”. The insights discussed in this paper are the result of confronting single or multiple expertise with data and model artefacts. In terms of key characteristics, similar to Kounios et al. (Kounios and Beeman, 2014), we consider insight any deep realisation, whether it happens suddenly or not.
Another type of knowledge that we are interested in in this study is expertise. Expertise is broadly defined as highly-specialised domain-specific knowledge (Chi et al., 2014). It can be in the form of tacit knowledge, defined as knowledge that cannot be explicitly stated or transferred to other people (Polanyi, 2009); or it can be more declarative or procedural. This type of expertise can be articulated linguistically (Farrington-Darby and Wilson, 2006) and, thus, may be captured using think-aloud protocols, interviews and questionnaires.
Glaser and Chi (Chi et al., 2014) describe key characteristics of experts across domains. For instance, experts typically take a long time analysing a problem qualitatively before attempting to solve it. During this incubation period, they try to comprehend the situation, build a mental presentation of its core elements, and review the problem from different angles before attempting to implement a solution (Paige, 1966; Skovholt et al., 2004).
We are interested in insight generation during collaborative model exploration and the role of explicit expertise in this context. We consider expertise the background knowledge that allows domain experts to reach new and deeper insights from interacting with the model representation.
2.2. Model Exploration
Model exploration is an iterative process of discovery and refinement, which consists of examining the entities and relationships that underpin models. It can be carried out by the model builders themselves (model producers), or by the problem owners who use such models to study a specific domain or process (model consumers). The exploration can be manual, automatic or semi-automatic. Manual exploration consists of experimenting with different input parameters and any constraints to launch model simulations. Often this is a trial and error process (Sedlmair et al., 2014). Automatic exploration relies on algorithms, such as from genetic or evolutionary computation, to systematically explore the model search space. Semi-automatic approaches take into account human feedback to steer the exploration. The outcome of model exploration is often insight that informs model design and implementation, or improves our understanding of the modelled phenomena.
Our aim is to understand how experts explore model parameter spaces in the presence of conflicting criteria. To the best of our knowledge, there are no user studies documenting how experts explore simulation model trade-off spaces using a collaborative setup that unites model consumers (study domain experts) and producers (modelling experts).
2.3. Trade-off Analysis and Pareto Optimality
We call trade-off analysis the type of analysis users perform to reach optimal decisions in the presence of multiple conflicting model objectives. Conflicting objectives, or criteria, are typical when exploring alternative options in many domains including agronomy. Cost is typically one of the main criteria (e.g., financial and environmental cost of supplying fertilisers), together with some measures of desired quantity or quality (e.g., wheat yield and protein content). An approach to identify “good” solutions to multiple objective problems is Pareto optimality (López Jaimes and Coello Coello, 2009; Kung et al., 1975). This technique produces a diverse set of compromise points between conflicting objectives. Within these points, there exists a set of non-dominated points called the Pareto Front (PF) (Kung et al., 1975), where no objective can be improved without sacrificing at least one other objective. During trade-off analysis, decision makers select which PF solutions work best according to their expertise and preferences.
Visualizing and exploring the PF is an important step in multi-criteria decision making (Tušar and Filipič, 2015). However, representing this set for more than three objectives is challenging (Tušar and Filipič, 2015; Ibrahim et al., 2016; Boukhelifa and Lutton, 2018). Tušar and Filipič (Tušar and Filipič, 2015) provide a comprehensive review of visualization techniques for Pareto front approximations in evolutionary MO, including among others scatterplot matrices, parallel coordinates, principal component analysis, and their own technique called prosection.
The scatterplot matrix technique shows all the bivariate projections of the solution space, presented in a table. This is considered to be an intuitive approach (Tušar and Filipič, 2015), albeit not very scalable since decision makers cannot see all dominance relationships at once. In our study we consider small multi-objective problems, of up to eight objectives, and we use a large display to overcome the problem of screen space.
3. Exploration Approach and Setup
To support multiple experts explore complex models, we combine: data pre-processing, a visualization tool running on a physical setup, and a coverage of multiple expertise.
Data Preprocessing.
The types of complex models we are dealing with are often explored through simulations. Depending on their research questions, experts may run hundreds or even thousands such simulations, by altering the input parameters, resulting in possibly thousands of alternative simulation results that they wish to explore. Visualising the relationships between input and output parameters could help experts make sense of their data, but visually exploring such large datasets can be daunting.
In an attempt to make the problem more tractable and easier to visualise, we rely on the observation that experts are often interested in reconciling multiple competing objectives (Sedlmair et al., 2014). We adopt a pre-processing step of calculating the Pareto front (Kung et al., 1975) of the simulation results, i.e., identify the list of non-dominated data points (simulations) that are possible solutions to the MO problem. The criteria to optimise are specified a-priori by the domain experts. To generate the Pareto front data, we used the state-of-the-art algorithm in MO optimisation NSGA-II (Deb et al., 2002) when we had access to the model source code (wine use-case). In the absence of the latter, we used a classical MO algorithm (Woodruff and Herman, 2013) as a simple filter applied to the simulation files data (wheat use-case).
Visualization Platform and Physical Setup
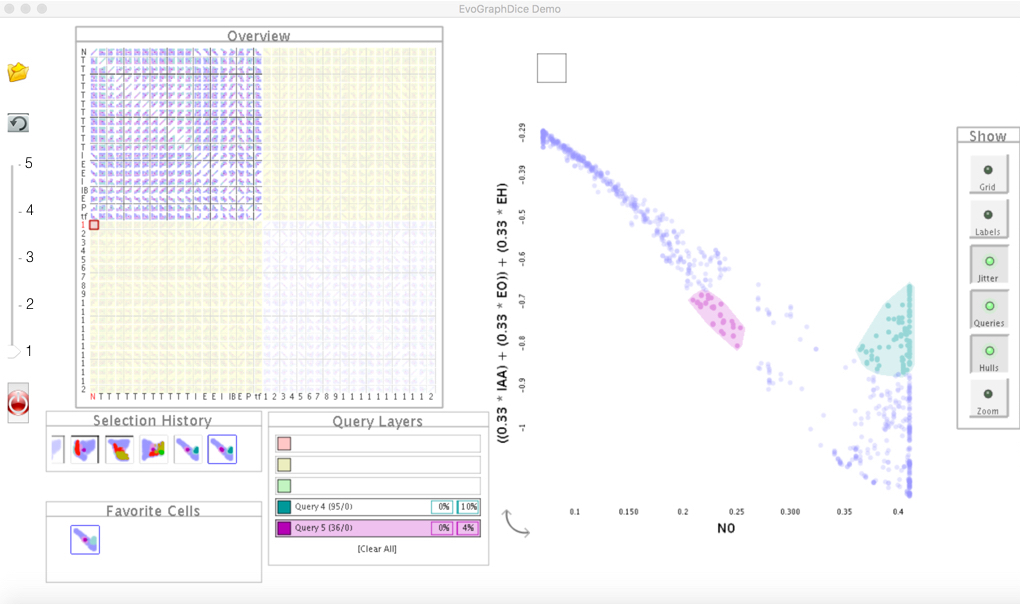
To visualise the Pareto front data points, we used a SPOLM-based tool (Elmqvist et al., 2008; Boukhelifa et al., 2013) that has been successfully used to explore multi-dimensional data. Scatterplot visulizations are often used to show relationships between two dimensions or characterise distributions of data points (Rensink and Baldridge, 2010; Dimara et al., 2018), and thus are appropriate for visualising relationships between objectives (to show trade-offs). Our tool has a SPLOM, and allows multiple query selections (differentiated by colour) to help experts narrow their search space to important parameters (Tušar and Filipič, 2015). The system also provides a bookmark history of past query selections and a means to store “favourite” views and queries. Finally, experts can enter new combined dimensions manually through a mathematical formula field, or to evolve them automatically. Previous work has shown that allowing experts to test new dimensions is important to the exploration of model trade-offs (Boukhelifa et al., 2013). Given that we are targeting a joint exploration between multiple experts, we provide a physical setup that could foster collaboration (Isenberg et al., 2013). As such, we instrument a room with a shared touch-enabled display that host the main visualization.
Expertise Diversity and Stages.
From our experience in the domains of agronomy and food process engineering, there are three types of expertise that appear at multiple stages in research related to complex processes (Perrot et al., 2016). Domain expertise usually comes first and informs the next stage, the modelling process. Modelling expertise comes next, and communication between experts of these two stages can be tight, especially when models are first developed. It is also common for optimisation expertise to follow, for example, for parameter estimation and tunning (Motta and Pappalardo, 2013). Optimisation experts often have to work closely with model builders and domain experts to understand model input and output, and to specify pertinent optimisation criteria and constraints. This three-way collaboration is iterative, and currently appears to be carried out in an ad-hoc asynchronous manner. Importantly, a single expert rarely understands all stages (Table 1).
Our approach interjects another stage of expertise, that of interactive visualization. By bringing the four expertise together in a synchronous fashion, we hope that our experts will not only gain insights that can generate new research on the biological processes, but also help form hypotheses about the modelling, optimisation and visualization processes.
4. Study Design
We conducted an observational study to understand how multiple types of experts explore models using the SPLOM-based visualization tool described in section 3, when they are considering multi-criteria trade-offs. The goal of the study was to investigate the following research questions:
-
[Q1]
what strategies domain experts adopt to explore trade-offs during model exploration.
-
[Q2]
how insight is reached during trade-off analysis.
-
[Q3]
how domain experts interpret findings from the visualization through model abstraction and optimisation.
-
[Q4]
what role the different expertise play in this context.
4.1. Participants
Expertise.
We had 12 participants (five female) including four co-authors of this paper (optimisation and visualization experts). The mean age was 44.5 years. In terms of expertise overlap, most participants had double expertise (8 participants), in particular domain-model expertise (5 participants) due to long term usage of the model (mean 4.6 years). One participant had three types of expertise domain-model-optimisation (Table 1). Domain expertise ranged from 3–30 years (mean 14.4), 1–14 years for the models (mean 4.2), and 2–10 years for optimisation (mean 5.4). Apart from the visualization and optimisation experts (co-authors of this paper), only one domain expert had prior experience with the tool used in the study. All were researchers with titles such as lecturer, professor, permanent researcher or research engineer. One participant was a final year PhD student.
Recruitment.
Participants were recruited from an agronomy research centre in INRA and collaborating institutions. The recruitment procedure drew on previous collaborations between the authors and the different participants, or between participants. However, these collaborations had not previously united all of the expertise covered in this study.
| P# | Field | UC | Domain | Model | Opti | Vis |
|---|---|---|---|---|---|---|
| 1 | Microbiological engineering | 1 | ||||
| 2 | Bioprocess engineering | 1 | ||||
| 3 | Physicochemistry | 1 | ||||
| 4 | Microbiological engineering | 1 | ||||
| 5 | Bioprocess engineering | 1 | ||||
| 6 | Oenology | 1 | ||||
| 7 | Process engineering | 1 | ||||
| 8 | Agronomy | 2 | ||||
| 9 | Food engineering | 2 | ||||
| 10 | Optimisation | 1, 2 | ||||
| 11 | Optimisation | 1, 2 | ||||
| 12 | Visualization | 1, 2 |
4.2. Study Procedure and Apparatus
Prior to the study, an optimisation expert held a brief interview with domain and model experts to discuss the objectives they want to optimise and the parameters they would like to explore. They then calculated the Pareto fronts. The actual study was carried out in two sessions, that we call use-cases based on the research area of the domain and model experts. In the first use-case, a wine fermentation model was explored, and in the second a wheat-crop model. Each use-case was run in two parts (a and b), on two different days, that we refer to as case studies. Each part lasted on average 123 minutes, and a different Pareto front for the same model was explored. We made sure all types of expertise were present. There was no overlap of participants between the two use-cases, other than the visualization and optimisation expertise.
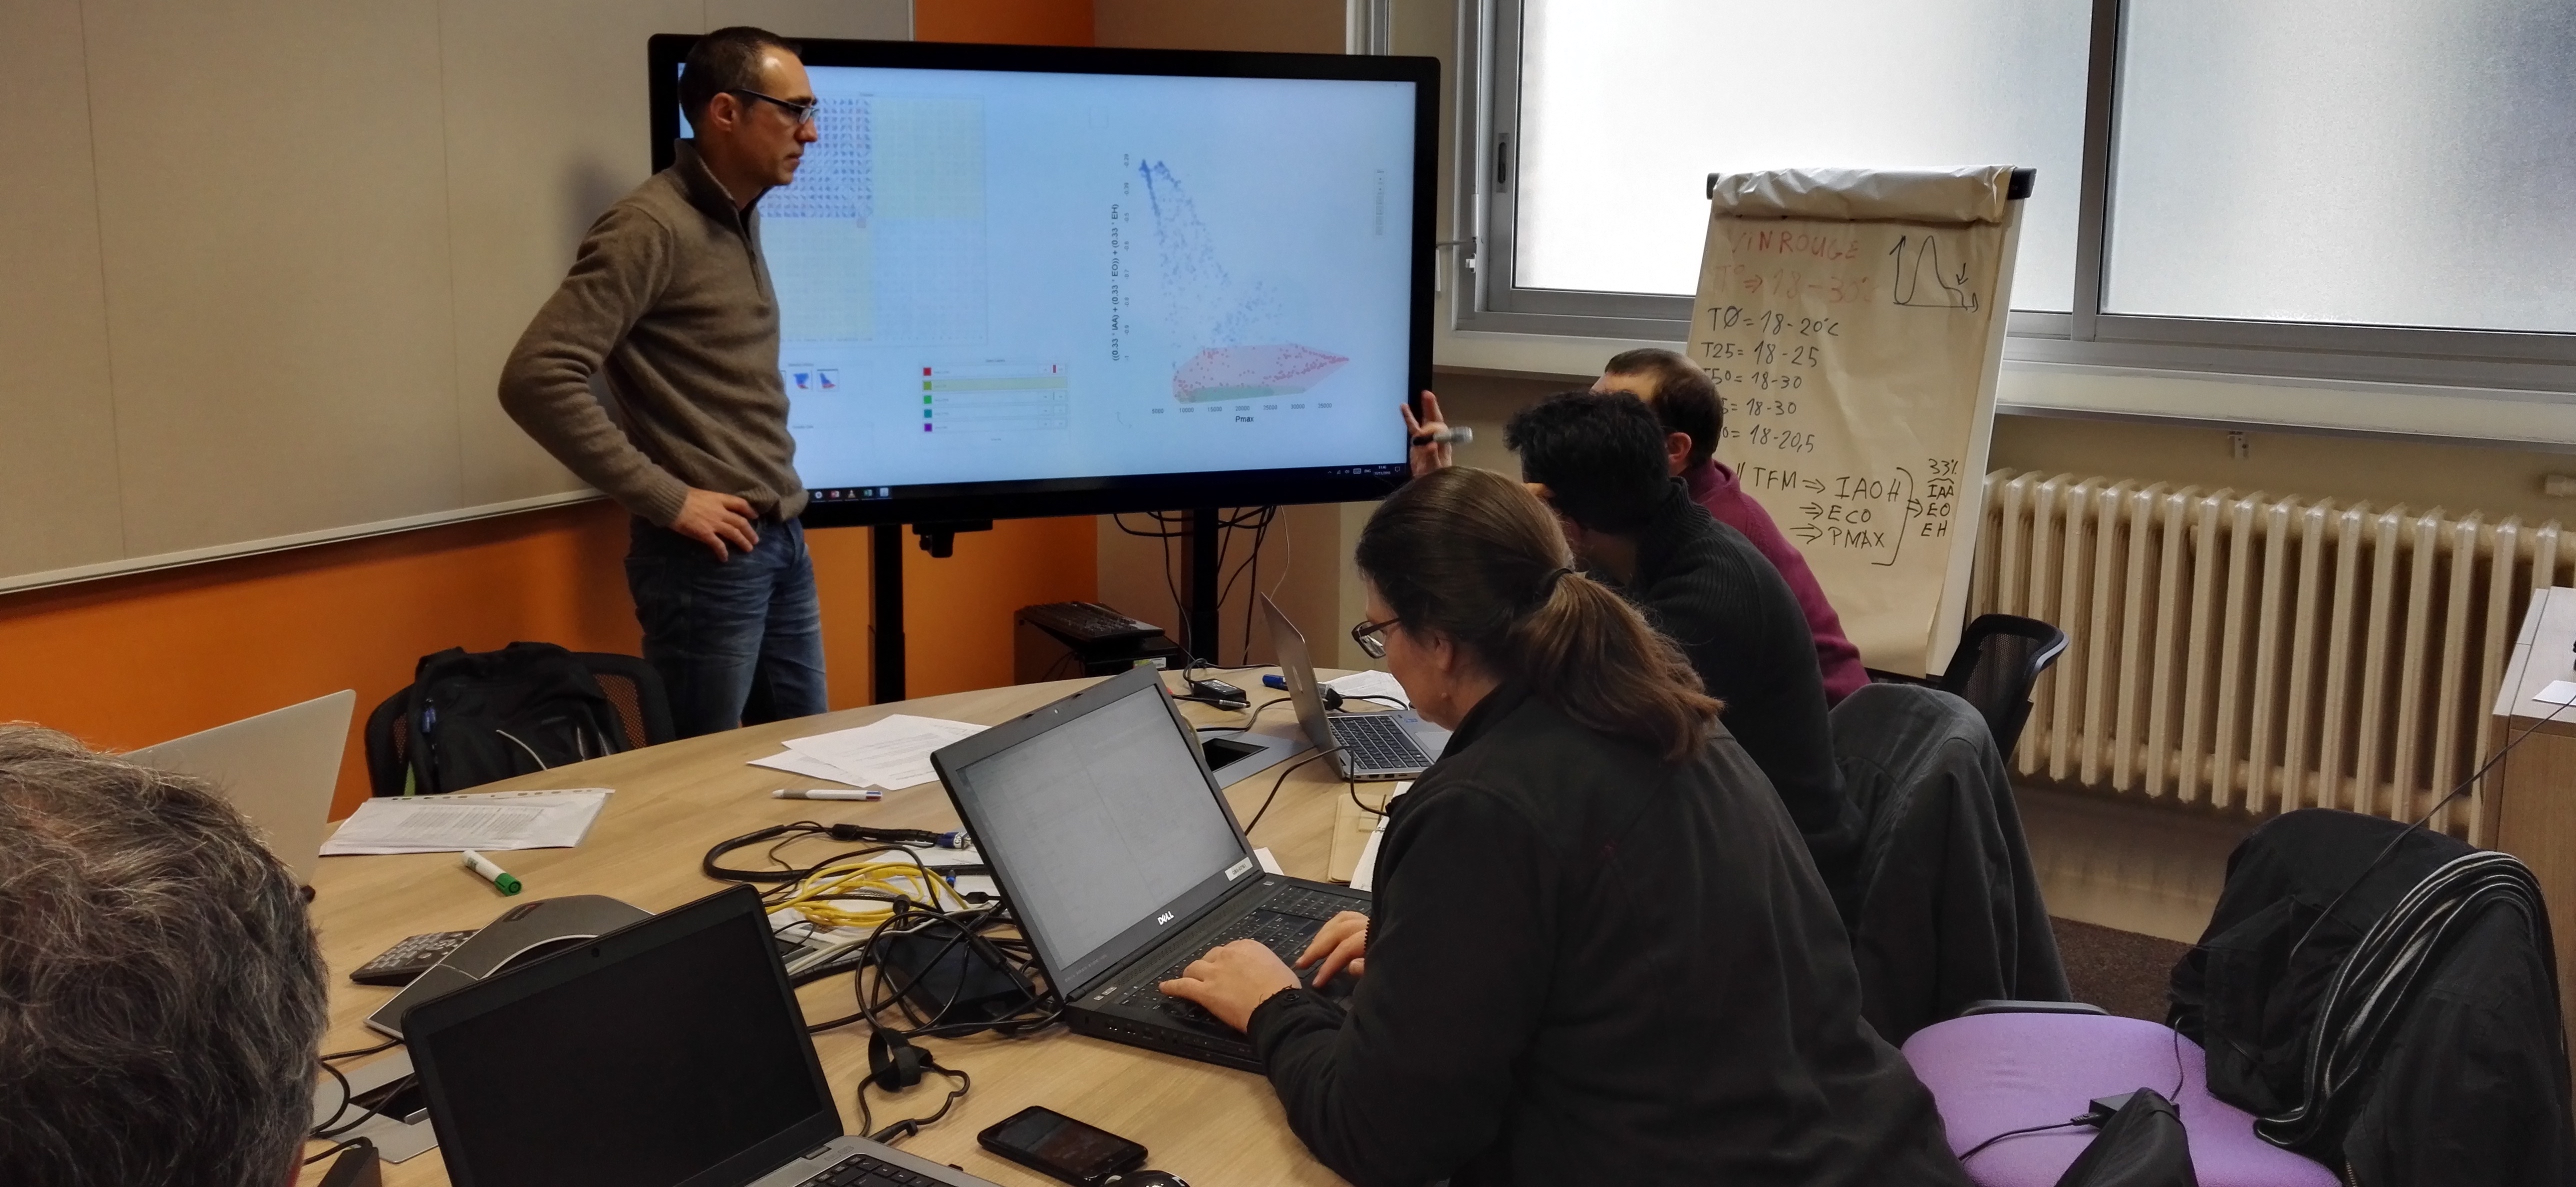
Participants were seated around a touch-enabled surface, and a flip-chart was available in case they wanted to take any notes outside the tool. Participants were asked to bring their own laptops, where we installed the same exploration software in order for them to perform a training task (Figure 2). The study took place in one research institute hosting a 3M Multi-Touch, 65” UHD-4K display.
At the beginning of each use-case we introduced the tool, then we asked participants to perform a training task (Boukhelifa et al., 2013). The next part of the study consisted of an open exploration task using a Pareto front dataset that was prepared beforehand. Participants were encouraged to re-discover what they knew about their data before searching for new insights (Boukhelifa et al., 2013).
We asked participants to think aloud and verbalise their thoughts. A study facilitator was present to answer experts’ questions and discuss their findings. In some occasions, the facilitator asked participants to explain the insights they found and to clarify whether these were new or confirmations of known findings. The sessions were video recorded and user interactions with the visualization tool were logged. After the study, participants filled in a short questionnaire to collect demographic information, and to self-assess their own expertise (using a 5-point Likert scale, and number of years in practice). We considered participants experts if they selected “3” or above as their expertise score.
4.3. Models and Pareto Fronts Datasets
In both use-cases, we used an optimisation algorithm to create a Pareto front that combines objectives (dimensions to optimise) and other parameters11111. In the visualization tool both objectives and parameters are simple data dimensions. (Table 2). Domain experts in the first use-case sought to maximise wine aroma (three esters), and minimise undesired compounds (higher alcohols) and the energy required to control the fermentation in red (CS1a) and white (CS1b) wine. In the first case study of the wheat use-case (CS2a), domain experts searched for interesting wheat crop fertilisation strategies that maximise yield, protein content and minimise nitrogen loss to the environment. A second Pareto front was generated in the last case study (CS2b) as domain experts wanted this time to find fertilisation strategies that maximise yield and minimise nitrogen dose and loss. We note that the results of CS2a helped create the new Pareto front for the subsequent case study (CS2b), as domain experts identified new research questions that take into account a new set of objectives.
4.4. Data Collection and Video Coding Events Identified
The data we collected consists of 494 minutes of video recordings, log files, and observational notes. Video annotation was carried out using an annotation software (chronoviz.com) in two main iterative passes. In the first pass, two authors independently watched one hour of CS1a, and using an initial coding scheme, coded the video as a sequence of discrete events. The two evaluators then met to compare codes and resolve conflicts and inconsistencies. In the second phase, two evaluator used this scheme to annotate the rest of the videos. After coding each video, the two evaluators met to discuss annotation codes and resolve any new conflicts. The inter-rater reliability scores for the four case studies video coding were: 77.19%, 88.63%, 86.36%, and 87.09%.
Events.
A coded event is characterised by a start time, type, actor, and object. The type of the event was assigned from an initial annotation scheme related to our research questions, and agreed upon prior to coding. It had three coarse categories: Human-Human Interaction, Insight, and Expertise. An event is further characterised by an actor, referring to the type of expertise used by the participant who triggered the event: i.e. domain, model, optimisation or visualization expertise (Table 1). By event object, we mean the point of focus of the event. Each event is assigned to a single category type, and is associated with a single actor and object.
The final annotation scheme contains six main categories:
-
•
Human-Human Interaction (HHI), 31.59%: discussions between participants about the event objects listed below.
-
•
Human-Computer Interaction (HCI), 41.32%: user interactions with the tool. We also coded whether a dimension is aggregated and whether it was an optimisation objective.
-
•
Human-Paper Interaction (HPI), 2.56%: events where participants wrote down notes during the exploration.
-
•
Insight, 13.84%: a surprising or unexpected finding about the objects below, including new research questions and hypothesis (11.35% of all insights). We also distinguish between new (80.78%) and update (19.22%) insights.
-
•
Expertise, 9.76%: explicitly expressed knowledge related to the domain, model, optimisation or visualization.
-
•
Action, 0.9%: plans that go beyond the current exploration, e.g., plans to carry out a new biological experiments.
Three of the main categories (Human-Human Interaction, Insight and Expertise), operate on the following seven objects:
-
•
Alignment, 6.23%: how well or not the observed patterns or findings relate to, or align with, existing knowledge in the domain, the model, the optimisation and visualization.
-
•
Correlation, 11.44%: relationships or dependencies between data dimensions.
-
•
Criteria, 21.09%: specification of data dimensions or combination of dimensions to use as a search criteria, to better answer a research question. Search criteria were created in the visualization tool using coloured lasso selections.
-
•
Dimension, 6.45%: events related to data dimensions, e.g., weights of combined dimensions and threshold values.
-
•
Exploration Method, 19.57%: strategy used to explore the data or the model expressed in a non-technical way.
-
•
Tool, 17.35%: technical details related to the tool.
-
•
Trajectory, 17.84%: exploration of the trajectory of one or more parameters/objectives, and their temporal evolution.
Scenarios.
While coding, we noticed that the exploration was structured in what appears to be linked mini-stories, often with logical transitions. In a follow-up coding pass, we marked the beginning of new scenarios, and their transition objects (inter-rater reliability = 94.44%). We categorised the 70 identified scenarios into six types:
-
•
Initial, 4/70: preliminary exploration, often with the aim to explain or verify the dimensions of the Pareto front data set, and to try out the tool functionalities.
-
•
New, 17/70: exploration that attempts to answer a new research question or hypothesis that is different from the previous scenario.
-
•
Refine, 30/70: refinement from a previous research question or hypothesis, e.g., modifying existing search criteria.
-
•
Compare, 7/70: contrasting current and previous scenarios, e.g., in terms of generated insights.
-
•
Alternative, 3/70: branching out from a previous research question or hypothesis to explore an alternative exploration path, e.g., focusing on different exploration objects.
-
•
Storytelling, 9/70: re-cap scenarios to share findings, interpret results and summarise the exploration steps.
In total, we generated 3307 events, 1686 for the first use-case and 1621 for the second use-case. We identified 70 scenarios, 39 in the first use-case and 31 in the second. The mean duration of a scenario is 7 minutes (min=1m, max= 25m), and contains on average 47 events (min=5, max=133).
5. Analysis of Video Segments
Our analysis is based on 70 trade-off exploration scenarios we identified during data collection. We carried out three types of analysis to answer our research questions, focusing on patterns and strategies of trade-off exploration [Q1], insight generation [Q2], and the role of expertise in this context, in particular for the alignment of findings [Q3,Q4]. We also provide a qualitative overview of participants’ subjective feedback on the exploration pipeline and the visualization tool.
5.1. Scenarios and Trade-off exploration [Q1]
5.1.1. Method
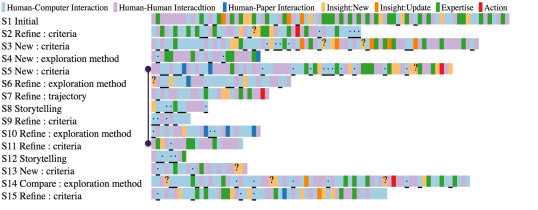
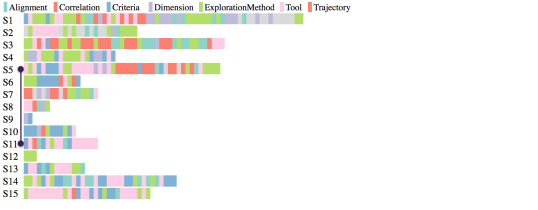
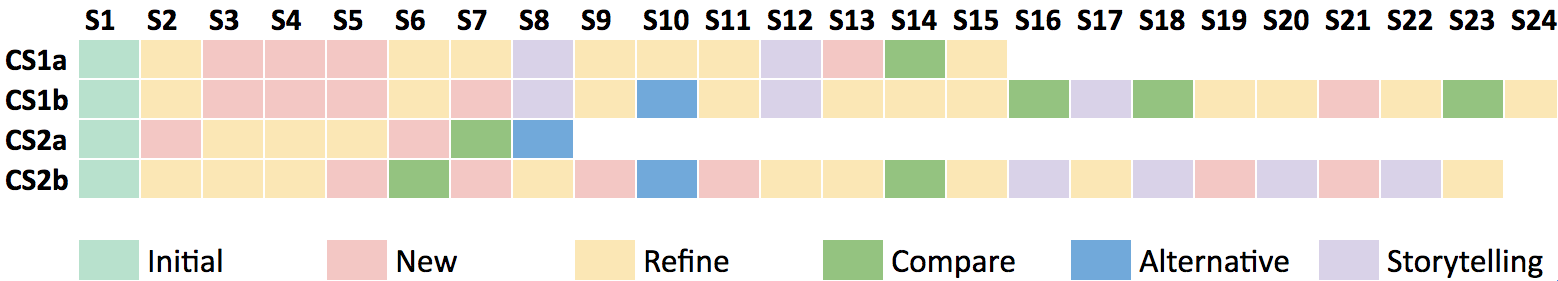
To analyse our results we took a top down approach. We first looked at scenarios and how they relate to the exploration. We created a visualization of scenario sequences per case study session (Figure 4), where each coloured chip corresponds to one identified scenario. The duration of the scenario is not encoded. To analyse the details of the scenarios themselves, we created two interactive visualizations of event sequences. In the first visualization, coloured chips correspond to an event category type (Figure 3-left), and in the second, to an exploration object type (Figure 3-right). Each chip line (annotation line), corresponds to one scenario. Scenarios are ordered chronologically, from top to bottom.
5.1.2. Overall Exploration and Collaboration Patterns
The visual analysis of scenarios in Figure 4 allowed us to make three main observations on the exploration patterns:
All study sessions start with an initial scenario where experts appropriate the visualization tool to explore their own datasets. Here, they spend time analysing the problem qualitatively, building a mental map of the situation (Chi et al., 2014), before selecting an optimal solution from a set of alternatives.
We looked at frequency and order of scenario types. Refine and New are the most common types of scenarios (43% and 24% scenarios respectively), and they occur at any time during the exploration. They both can follow as well as precede any other scenario type, except for the initial scenarios. This probably implies that the iterative nature of trade-off exploration is primarily due to the interleaving of new and refined hypotheses and research questions.
It is interesting to note the difference between the two use-cases at the early stages of exploration (between ). There appears to be more exploration for the first use-case illustrated by the contiguous blocks of new scenarios (CS1a and CS1b), in contrast to the juxtaposed refine scenarios in the second use-case (CS2a and CS2b), denoting more exploitation behaviour. These two facets of exploration were also observed in previous exploratory visualization studies (Boukhelifa et al., 2013), and may correspond to how many research questions and directions participants had at the outset of the exploration. Additionally, the number of participants in the first use-case was higher, which might have led to the generation of many, perhaps diverging, hypotheses regarding the exploration objects. In the second use-case, there were less participants which may explain the more focused exploration.
The longer the exploration session, the more storytelling scenarios there are. Storytelling helps experts recap their findings before they continue their exploration. With more experts participating in the exploration (CS1a, CS1b), recaps are done periodically, presumably to build common ground (Carroll et al., 2006) and ensure that everyone is on the same page. In smaller groups (CS2a, CS2b), recaps are concentrated at the end of the session.
We noticed that some scenarios reference earlier parts of the exploration, in a branch-out fashion. As a result, we augmented the category and object annotation visualizations with jump-lines linking the two scenarios in question. Back referencing scenarios exist in our dataset but they are hard to extract. We show in Figure 3 one instance where this occurs, to illustrate the iterative and non-linear nature of trade-off exploration and sense-making (Pirolli and Card, 2005).
When it comes to the setup, although we used a multi-touch interactive surface throughout the study, predominantly a single domain expert led most of the interaction in each case study session. The rest of the participants discussed seated or standing, but refrained from interacting. This finding is supported by other studies on collaboration around interactive displays (Rogers and Lindley, 2004; Tong et al., 2017). We note that although most participants did not interact directly with the display, they were however actively involved in the exploration. For example, they proposed new research questions, requested to see particular views or to refine existing criteria. We also observed at least two instances in UC1 where domain experts explored the Pareto front in their own laptops.
5.1.3. Complexity of Analysis Scenarios
The exploration scenarios identified vary in complexity, which we characterise with two measures: number of events and scenario duration.
In terms of average number of events per scenario type, Compare scenarios had the most number of events (M:74, SD:51), followed by Alternative (M:68, SD:59), Initial (M:59, SD:22), New (M:47, SD:28), Refine (M:44, SD:26), and finally Storytelling (M:26, SD:32). With the exception of Initial and Storytelling scenarios, overall the average time spent on each scenario type (in minutes) appears to be related to the average number of events in that scenario type: Compare (M:10.28m, SD:6.75), Alternative (M:9m, SD:8.1), Storytelling (M:7.33m, SD:8.15), New (M:6.58m, SD:5), Initial (M:6.25m, SD:3.59), and Refine (M:5.9m, SD:3.74). Indeed we found that scenario duration and event count were strongly correlated (Pearson’s r(68) = 0.77, p 0.001). Thus, in the next sections, to facilitate comparison between scenarios, we use scenario duration to normalise our results when reporting findings per and across scenario type (i.e., report frequency of events per minute).
We note that Compare and Alternative scenarios (10/70 scenarios), although rare, appear to be more demanding than the rest, based on our two complexity measures with on average more events and longer durations.
5.1.4. Search-Space Exploration Strategies
Another way to characterise trade-off exploration strategies is to look at the types of scatterplots experts viewed. We delineate these strategies based on two orthogonal dimension properties: the granularity of the projection axis for the viewed dimensions (single or aggregated), and dimension importance.
Dimension Granularity: Although the SPLOM-based approach used in this study favours 2-by-2 viewing of dimensions, experts consulted views having single dimension axes as much as they did for views having combined dimensions (50% of views). However, the use of combined dimensions varied across the four case studies (CS1a=11.62%, CS1b=73.51%, session CS2a=8.37%, CS2b=6.48%). This is probably related to experts’ research questions, and how far they reached in exploring the initial 2-by-2 search space. In the first use-case, domain experts made extensive use of combined dimensions (in 34/39 scenarios), in particular in CS1b. Indeed, a wine fermentation recipe can be described as a linear combination of ratios of the various constituent aromas. In the second use-case, experts preferred to explore fertalisation trajectories two steps at a time before aggregating.
We note that experts rarely consulted views where both axes show combined dimensions (2.97% of viewed plots). This finding confirms results from a previous study (Boukhelifa et al., 2013), where domain experts prefer plotting aggregated dimensions against the original ones, to ground new insights. Moreover, experts never created nor consulted views with combined dimensions in the initial exploration stages, rather, they explored the original search space before attempting to aggregate.
Dimension Importance: Most of the time, experts viewed scatterplots with at least one axis having one or more objectives (63.10% of viewed plots). Overall, this indicates the importance of objectives in trade-off exploration, to make sure that subsequent data selections and filtering are optimal. However, this viewing rate varied per case study session (CS1a=80.86%, CS1b=99.31%, CS2a=40.81%, CS2b=12.36%). The choice of consulted dimension type (objective or parameter) likely varies depending on the research questions experts want to explore, and the chosen exploration strategy.
From our study notes and the storytelling scenarios, we observed that in the first use-case, experts predominantly used the objective space to drive the exploration. This strategy consists of first aggregating important objectives and then exploring the remaining dimensions in relation to that. An inverse strategy, used in the second use-case, consists of first finding ideal values for some parameters, and occasionally checking where this selection lies in the objectives space, resulting in adjustments to the parameter values.
In the presence of multiple objectives and parameters, experts created numerous criteria that they appear to prioritise. For instance, in the wine model use-case: “you start with the most important [aroma criteria], you select large, and then using your secondary criteria [cost criteria] you refine the selections”) (P5). Regardless of whether the exploration is guided by the objectives or by the parameters of the model, experts reached insights (CS1a=56, CS1b=159, CS2a=87, CS2b=156 times) and aligned findings (CS1a=37, CS1b=23, CS2a=23, CS2b=32 times), indicating that both exploration strategies are valid.
5.2. How Insight is Reached and Validated [Q2]
We analysed how insight is reached during trade-off analysis, by looking at the scenarios and the objects of those insights, as well as the sequence of events that led to the insight.
Insights by Scenario and Object Types: Insights reached during the exploration sessions were mostly related to trajectories (42.57%) and correlations (25.32%). This can be explained by the nature of the datasets explored in this study and the types of research questions our experts were interested in. Initial scenarios generated more insights (M:2.45, SD:1.92) (re-discovery of known findings), followed by Refine (M:1.59, SD:1.06) and Compare (M:1.56, SD:1.08), then New (M:1.11, SD:0.53), Alternative (M:1, SD:0.28) and finally Storytelling (M:0.34, SD:0.16).
The few insights reached in the Storytelling scenarios are mostly about the exploration method (43.75%). This type of insight came from comparing methods experts previously used to analyse model simulation results (e.g., statistical analysis, experts decision rules), and the visual exploration proposed in this study. Not surprisingly, more than any other scenario type, a third of storytelling insights were in the form of a research question or a hypothesis. These types of insights were overall less common, and varied between 9.09% and 13.59% of insights per scenario type.
Insights and Event Sequences: To extract event sequence patterns, we removed repeated consecutive event categories from the annotation data. For instance, an event sequence HCI-HHI-HHI-HPI becomes HCI-HHI-HPI. We then counted the occurrences of each two subsequent events, and normalised each count by the maximum frequency value. The results are shown in the transition matrix in Figure 5.
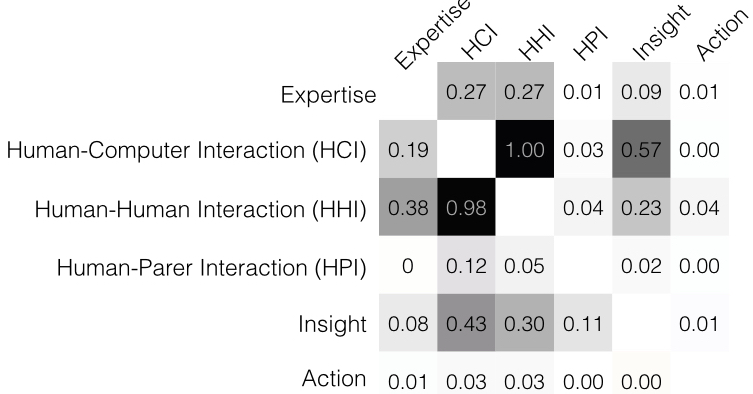
We found that the most frequent event sequences were HCI-HHI and HHI-HCI. Indeed, participants discussed their intentions, thoughts and findings as they interacted with our tool. Surprisingly, the least frequent sequences related to the insight category (excluding Action and HPI) were Expertise-Insight (and vice versa). Rarely insight came just from articulating expertise. Rather, insight was most frequently reached after HCI or HHI events, whereas expertise was most frequently followed by HCI or HHI (equally).
5.3. Expertise [Q3,Q4]
We illustrate through participants’ quotes222All participants’ quotes are translated from French. how expertise plays an important role during model exploration, particularly in: (i) identifying outliers and discrepancies, (ii) informing various types of decisions, and (iii) validating insights.
(P8), for instance, was able to quickly identify and explain an outlier, where wheat yield was unusually high: “I think it is a point for one year where there was a very favourable climate at the end of the cycle”. On the other hand, she expressed uncertainty with respect to model predictions of a certain variable: “I do not trust the protein content level, wheat at 27% of protein content, it is not something we see everyday!”.
Domain expertise helped inform various types of decisions such as which dimensions to aggregate in a search criteria and which to exclude: “then there is EAOH, and the famous higher alcohol which are precursors, which we need to have the least possible amount of, because it serves nothing from an aromatic point of view.” (P5). Similarly for (P8): “in fact TP [protein content] does not need to be here [as objective], I just don’t want it to be less than 11.5 … for me personally losses [one objective] is more important than the other objectives”.
A deeper validation of insights is reached when multiple expertise are synchronised. Typically, observations in one part of the exploration framework, often the visualization, are aligned with existing expertise about the remaining steps of the exploration pipeline. For example, a correlation insight was found in the first use-case where two objectives (EH and EO) appear to be highly correlated. One optimisation expert raised a warning about this finding: “from the optimisation point of view they are correlated, but afterwards, we do not know” (P7). A modelling expert then confirmed that the observed correlation between the two objectives also exists in the model, and thus adding to the validity of this finding: “because these are the combinations I have found in order to reduce the model” (P1). Finally, a domain expert adds that this correlation also exists in the physical sense: “besides being correlated in the Pareto front and the model, EH and EO are also correlated in the metabolic sense” (P5). The same expert expressed the added value of the visualization in realising the nature of this correlation: “This [the correlation] we already have in the model, we see it experimentally, but here in the Pareto front it is a disaster … You do not have a simple correlation between an alcohol and its ester” (P5).
5.4. Subjective User Feedback
1. Reasoning about the world through multiple abstractions: Our participants liked the visual style of model exploration and how the framework helped generate complex new insights: “we made a first exploration filter that made it possible to arrive at this decision tree, it’s not negligible” (P9). Participants appreciated the ability to explore alternatives within an already optimised space. For example, the wine experts found two distinct fermentation strategies that led to the same aromatic composition through different temperature management strategies: “this is very interesting …, my aim is not necessarily to reach the max of aromas, either I use 0.4 which is my max, or use 0.2-0.25. The result product is the same even though the nitrogen quantity is different” (P5).
However, there were some issues related to the interpretation of the visualizations: “it is strange that I do not have other points [for that year], ah no, because it is already optimised” (P8). Another domain expert added: “what is not clear from me is … we reason in relation to what we know in terms of what is correlated to what, but here in the Pareto front, there could be things that are very correlated, which may not be correlated [in reality or in the model]. This could be disturbing in terms of reasoning” (P4). This participant suggested overlaying the Pareto front points on the simulation data as a reminder that these are optimised points.
2. Using SPLOM-based tools to explore model trade-offs: We identified four main areas where the exploration tool may be improved based on participants comments and interactions. (1) our tool lacked ways to import search criteria to other exploration sessions. (2) The text based dimension editor and detailed lasso selection were difficult to operate on the tactile surface. (3) Although a history of past selections and current queries are provided in our tool, participants often felt lost during the exploration: “what was the basis of the reflection here? In fact, we seem to go faster than we have time to note down” (P6). Our participants resorted to note-taking and storytelling to overcome this issue, but this was not sufficient. (4) The different components of our exploration framework are currently not linked dynamically. Adding new objectives requires the optimisation procedure to be launched off-line, the results are then uploaded to the visualization tool.
6. Discussion and Summary of Findings
To the best of our knowledge, there are no other studies that looked at collaborative model exploration in real-world settings. In terms of results, we found similar processes to those described in general sensemaking literature (Klein et al., 2007; Pirolli and Card, 2005). Our contribution here, however, is in identifying why these processes tend to occur (e.g., storytelling to recap), and when they occur (e.g., storytelling periodically for large groups, or at the end of big chunks of exploration for smaller groups). Alignment is a particular process to model exploration, also described in (Chuang et al., 2012). However, our work considers more complex models, multiple computational stages and co-located expertise. We discuss next seven key findings from our study, relating them to our initial research questions, and comment on the applicability of our methods to other domains:
1. Exploration as Multiple Linked Analysis Scenarios [Q1] We observed that exploration is split into mini-exploration scenarios. Trade-off analysis starts with a preliminary exploration often leading to a focused research question. The remainder of the exploration is characterised by the non-linear interleaving of new and refined hypotheses and research questions (Pirolli and Card, 2005), operating on a variety of exploration objects. Those scenarios denote a shift in the research questions and hypotheses set out by experts, which often result in change of focus in the model or data space. A parallel can be drawn between our approach and the data-frame model described in (Klein et al., 2007). For instance, their “reframing” maps to our new scenario, and “elaborating the frame” to our refine scenario. In our case, however, re-framing revealed itself to happen specifically when participants shift their research questions and hypotheses. Furthermore, we provide a more fine grained analysis of the exploration, by crossing high level categories of interest (e.g., insight, expertise), with exploration objects (correlation, exploration method).
2. Heterogeneous Analysis Scenarios [Q1] Analysis scenarios vary in length and complexity. Most of the exploration relates to refining research questions. Scenarios where experts actively compared or followed alternative exploration paths were rare, tended to be longer and had more interaction events. While the absolute length of scenarios differs, their duration and event count were strongly correlated.
3. Storytelling as a Grounding Process [Q1,Q3] Participants engaged in the storytelling of their past exploration (Riche et al., 2018; Tong et al., 2018), both in terms of gained knowledge, and the processes used to reveal the various insights (Clark and Brennan, 1991; Convertino et al., 2008). This grounding phenomena helps groups with multiple expertise to establish a basis for working together across differences, and makes the sensemaking process through model and algorithmic abstractions more transparent (Goyal and Fussell, 2016; Passi and Jackson, 2017). In our study, storytelling scenarios are mostly discussion-based, but happen likely for different purposes. Large groups re-cap periodically to bring everyone up to speed. For smaller groups, storytelling tends to occur towards the end of the exploration, to summarise and prepare for the next session.
4. Two Key Strategies for Trade-off Analysis [Q1] Domain experts create multiple search criteria that they then prioritise. Objective dimensions are important to guide the exploration when used in the initial search criteria, or to validate parameter criteria choices and selections a posteriori. The first strategy seems more appropriate for model exploration scenarios where there are known or hypothesised connections between primary and secondary dimensions, or when analysts are very familiar with the space, and so they are more likely to experiment. The second case seems more appropriate for under-explored models when experts are still trying to understand the model behaviour. In both cases, however, insight is reached, making both exploration strategies valid.
5. The Importance of Aggregating Dimensions [Q1] Our analysis of the search space exploration strategies showed the importance of aggregating dimensions. SPLOM-based tools project data two dimensions at a time, whereas our participants were examining trade-offs between at least five objectives. The degree to which experts used dimension aggregation varied between sessions depending on their knowledge about the non-aggregated search space.
6. Multiple Pathways to Insight [Q2] Our interactive model exploration framework allowed the generation of new insights and the confirmation of old findings. Similar to the tasks described by Yi et al. (Yi et al., 2008), our participants provided re-caps of their exploration (provide overview), continuously refined their exploration (adjust), discovered interesting relationships between data dimensions (detect pattern), and aligned different types of findings (mental model). We found that insight is reached in all scenario types including initial ones, and is often in the form of new surprising findings. In the context of our study, those insights were mostly about trajectories and correlations. An unexpected finding was that insights can also be reached during storytelling, mostly about expanding previous discussions and forming hypotheses and actions for future biological experiments. This highlights the importance of supporting storytelling in model exploration.
7. The Indirect Link Between Expertise and Insight [Q2,4] Expertise appears to lead to insight and also to follow from it (e.g., to explain and validate findings), although in both cases not directly but with interleaving discussions and human-computer interaction events. Expertise was important in identifying outliers and discrepancies, informing various types of decisions (related to both analysis findings and exploration method), and validating insights. In our study, synchronising multiple expertise seems to provide deeper insights and validation of findings, and increase model understanding and confidence in the results, although more studies are needed to confirm our intuitions.
6.0.1. 8. Broader Applicability
Our hypothesis-centred approach to characterise our exploration scenarios is well suited to how our domain experts conduct their research in agronomy. However, the approach can generalise to any domain with large input and output simulation spaces that considers trade-offs (e.g., finance, urban planning), and where the human investigation relies on what-if scenarios (e.g., intelligence analysis). Furthermore, our coded exploration objects (with the exception of “tool” that is SPLOM specific) apply to general data exploration with multiple expertise and can be a basis for future analysis. Finally, our model exploration framework can use any multi-dimensional visualization tool.
7. Recommendations for Design
Collaborative frameworks such as ours resembles participatory design approaches, where the presence of multiple expertise may improve the collective understanding of the modelled processes (Boukhelifa et al., 2017a). The importance of involving different types of expertise during model-based exploration for decision making, and having people who can speak the language of multiple experts, has also been documented (Simon et al., 2015). Improving model understanding may have societal implications such as encouraging model-driven debate and discussions (Von Korff et al., 2010). Our study findings, and participants’ subjective feedback (indicated below by ), suggest several ways that collaborative model exploration may be enhanced to better support sensemaking during trade-off analysis:
Methodology: The think-aloud protocol used in this study allowed us to observe knowledge articulated by our participants, either as new findings (insight), or existing knowledge (expertise). Other methods for externalising or articulating hidden knowledge needs to be investigated (McCurdy et al., 2018), particularly for collaborative settings. The externalised knowledge may then be exploited to augment the underlying data and models (Baudrit et al., 2010). More generally, however, the distinction between expertise and insight may inform the design of knowledge-assisted visual analytics tools, and can help refine insight-based evaluation of visualization systems.
Making Sense of the Exploration Process: During the storytelling scenarios we identified, participants relied mostly on their own memory, the notes they took and the bookmark facility of our SPLOM tool, to reflect and share their own understanding of the main insights found (section 6.3). However, they reported that this was not sufficient to make accurate reflections about their exploration processes (subsection 5.4). Better support for sensemaking of the exploration process itself is needed, in particular, to reveal the hypothesis-driven approach experts took during their analyses (section 6.1). This can be achieved by providing ways to visualise the exploration history and to mark scenario stops and transitions, particularly for scenario comparison or alternatives (section 6.2), and by allowing experts to record exploration values and the different types of insights reached (section 6.6).
Trade-off Exploration Tools & Setups: We recommend that trade-off analysis tools should: (a) Support the creation of multiple search criteria, and help users keep track of their provenance and priority over time (section 6.4); (b) Allow dimension aggregation, and default combined dimensions, such as the results of principal component analysis (section 6.5); (c) Allow the dynamic regeneration of Pareto fronts; and (d) Allow multiple linked exploration setups, where people can create private instances and explore alternatives individually, before sharing results with others (section 5.Q1).
8. Study Limitations
Our study focuses on biological applications, although we believe many of our findings generalise to other domains. We acknowledge four main limitations of our study. First, it is hard to realise a collaborative setup that unites multiple types of expertise, or to repeat the process in a distributed fashion. The two use-cases happened at eight-months interval because we needed to prepare the different stages of the pipeline. Second, although experts reached insights during their exploration, it is hard to validate those findings from the biological sense. Those insights, however, allowed them to prepare new research questions and future experiments. Third, given that we are working with real experts and their problems, we did not control for expertise. Our method does not rely on expertise overlap. However, we noticed that our experts had gained new types of expertise over time, e.g., a domain expert became model expert after working with the model over a number of years. In the absence of expertise overlap and previous collaborations, we expect longer exploration sessions to introduce the various expertise and establish common ground. Fourth, in terms of screen size, the large screen facilitates the display of high-dimensional datasets for groups of experts. If a smaller size screen is used, the visualization tool would need to allow for workspace awareness, and may lead to different results.
9. Conclusions
We presented a multi-stage model exploration framework that unites multiple expertise, and a user study that adopts it. The focus of the study was on model-trade-off exploration, and on the link between insight and expertise during trade-off analysis. Our findings highlight a rich multi-storyline approach experts adopt during exploration, where they constructively combine diverse expertise to resolve conflicts between competing objectives, and reach new insights. More work is needed to better understand collective as well as individual experts’ role in generating insight in the different analysis sub-scenarios identified in our work (such as compare or storytelling), and how the different experts interact with the tool. These studies can help improve our understanding of the role of human expertise and its interplay with visual analytics in building common ground and externalising hidden knowledge.
References
- (1)
- Baudrit et al. (2010) Cédric Baudrit, Mariette Sicard, Pierre-Henri Wuillemin, and Nathalie Perrot. 2010. Towards a global modelling of the Camembert-type cheese ripening process by coupling heterogeneous knowledge with dynamic Bayesian networks. Journal of Food Engineering 98, 3 (2010), 283–293. https://doi.org/10.1016/j.jfoodeng.2009.12.012
- Boukhelifa et al. (2013) Nadia Boukhelifa, Waldo Cancino, Anastasia Bezerianos, and Evelyne Lutton. 2013. Evolutionary Visual Exploration: Evaluation with Expert Users. In Proceedings of the Eurographics Conference on Visualization. The Eurographs Association, 31–40. https://doi.org/10.1111/cgf.12090
- Boukhelifa and Lutton (2018) Nadia Boukhelifa and Evelyne Lutton. 2018. Guest editorial: Special issue on genetic programming, evolutionary computation and visualization. Genetic Programming and Evolvable Machines 19, 3 (2018), 313–315. https://doi.org/10.1007/s10710-018-9333-4
- Boukhelifa et al. (2017a) Nadia Boukhelifa, Marc-Emmanuel Perrin, Samuel Huron, and James Eagan. 2017a. How Data Workers Cope with Uncertainty: A Task Characterisation Study. In Proceedings of the ACM Conference on Human Factors in Computing Systems. ACM, 3645–3656. https://doi.org/10.1145/3025453.3025738
- Boukhelifa et al. (2017b) Nadia Boukhelifa, Alberto Tonda, Ioan-Cristian Trelea, Nathalie Perrot, and Evelyne Lutton. 2017b. Interactive knowledge integration in modelling for food sustainability: challenges and prospects. In ACM CHI Workshop on Designing Sustainable Food Systems.
- Brisson et al. (1998) Nadine Brisson, Bruno Mary, Dominique Ripoche, Marie Hélène Jeuffroy, Françoise Ruget, Bernard Nicoullaud, Philippe Gate, Florence Devienne-Barret, Rodrigo Antonioletti, Carolyne Durr, Guy Richard, Nicolas Beaudoin, Sylvie Recous, Xavier Tayot, Daniel Plenet, Pierre Cellier, Jean-Marie Machet, Jean Marc Meynard, and Richard Delécolle. 1998. STICS: a generic model for the simulation of crops and their water and nitrogen balances. I. Theory and parameterization applied to wheat and corn. Agronomie 18, 5-6 (1998), 311–346. https://doi.org/10.1051/agro:19980501
- Card (1999) Mackinlay Card. 1999. Readings in information visualization: using vision to think. Morgan Kaufmann.
- Carroll et al. (2006) John M. Carroll, Mary Beth Rosson, Gregorio Convertino, and Craig H. Ganoe. 2006. Awareness and teamwork in computer-supported collaborations. Interacting with Computers 18, 1 (2006), 21–46. https://doi.org/10.1016/j.intcom.2005.05.005
- Chang et al. (2009) Remco Chang, Caroline Ziemkiewicz, Tera Marie Green, and William Ribarsky. 2009. Defining insight for visual analytics. IEEE Computer Graphics and Applications 29, 2 (2009), 14–17. https://doi.org/10.1109/MCG.2009.22
- Chi et al. (2014) Michelene TH Chi, Robert Glaser, and Marshall J Farr. 2014. The nature of expertise. Psychology Press.
- Chuang et al. (2012) Jason Chuang, Daniel Ramage, Christopher Manning, and Jeffrey Heer. 2012. Interpretation and trust: Designing model-driven visualizations for text analysis. In Proceedings of the ACM Conference on Human Factors in Computing Systems. ACM, 443–452. https://doi.org/10.1145/2207676.2207738
- Clark and Brennan (1991) Herbert H. Clark and Susan E. Brennan. 1991. Grounding in Communication. In Perspectives on Socially Shared Cognition. American Psychological Association, 127–149.
- Convertino et al. (2008) Gregorio Convertino, Helena M Mentis, Mary Beth Rosson, John M Carroll, Aleksandra Slavkovic, and Craig H Ganoe. 2008. Articulating common ground in cooperative work: content and process. In Proceedings of the ACM Conference on Human Factors in Computing Systems. ACM, 1637–1646. https://doi.org/10.1145/1357054.1357310
- Convertino et al. (2009) Gregorio Convertino, Helena M. Mentis, Mary Beth Rosson, Aleksandra Slavkovic, and John M. Carroll. 2009. Supporting Content and Process Common Ground in Computer-supported Teamwork. In Proceedings of the ACM Conference on Human Factors in Computing Systems. ACM, 2339–2348. https://doi.org/10.1145/1518701.1519059
- Cui et al. (2010) Zhenling Cui, Fusuo Zhang, Xinping Chen, Zhengxia Dou, and Junliang Li. 2010. In-season nitrogen management strategy for winter wheat: Maximizing yields, minimizing environmental impact in an over-fertilization context. Field Crops Research 116, 1-2 (2010), 140–146.
- Deb et al. (2002) Kalyanmoy Deb, Amrit Pratap, Sameer Agarwal, and TAMT Meyarivan. 2002. A fast and elitist multiobjective genetic algorithm: NSGA-II. IEEE Transactions on Evolutionary Computation 6, 2 (2002), 182–197. https://doi.org/10.1109/4235.996017
- Dimara et al. (2018) Evanthia Dimara, Anastasia Bezerianos, and Pierre Dragicevic. 2018. Conceptual and Methodological Issues in Evaluating Multidimensional Visualizations for Decision Support. IEEE Transactions on Visualization and Computer Graphics 24, 1 (2018), 749–759. https://doi.org/10.1109/TVCG.2017.2745138
- Elmqvist et al. (2008) Niklas Elmqvist, Pierre Dragicevic, and Jean-Daniel Fekete. 2008. Rolling the dice: Multidimensional visual exploration using scatterplot matrix navigation. IEEE Transactions on Visualization and Computer Graphics 14, 6 (2008), 1539–1148. https://doi.org/10.1109/TVCG.2008.153
- Farrington-Darby and Wilson (2006) Trudi Farrington-Darby and John R Wilson. 2006. The nature of expertise: A review. Applied ergonomics 37, 1 (2006), 17–32.
- Feinberg (2017) Melanie Feinberg. 2017. A Design Perspective on Data. In Proceedings of the ACM Conference on Human Factors in Computing Systems. ACM, 2952–2963. https://doi.org/10.1145/3025453.3025837
- Gergle et al. (2013) Darren Gergle, Robert E Kraut, and Susan R Fussell. 2013. Using visual information for grounding and awareness in collaborative tasks. Human–Computer Interaction 28, 1 (2013), 1–39. https://doi.org/10.1080/07370024.2012.678246
- Goyal and Fussell (2016) Nitesh Goyal and Susan R Fussell. 2016. Effects of sensemaking translucence on distributed collaborative analysis. In Proceedings of the ACM Conference on Computer-Supported Cooperative Work & Social Computing. ACM, 288–302. https://doi.org/10.1145/2818048.2820071
- Guo et al. (2016) Hua Guo, Steven R Gomez, Caroline Ziemkiewicz, and David H Laidlaw. 2016. A case study using visualization interaction logs and insight metrics to understand how analysts arrive at insights. IEEE Transactions on Visualization and Computer Graphics 22, 1 (2016), 51–60. https://doi.org/10.1109/TVCG.2015.2467613
- Ibrahim et al. (2016) Amin Ibrahim, Shahryar Rahnamayan, Miguel Vargas Martin, and Kalyanmoy Deb. 2016. 3D-RadVis: visualization of pareto front in many-objective optimization. In IEEE Congress on Evolutionary Computation. IEEE, 736–745. https://doi.org/10.1109/CEC.2016.7743865
- Isenberg et al. (2013) Petra Isenberg, Tobias Isenberg, Tobias Hesselmann, Bongshin Lee, Ulrich Von Zadow, and Anthony Tang. 2013. Data visualization on interactive surfaces: A research agenda. IEEE Computer Graphics and Applications 33, 2 (2013), 16–24. https://doi.org/10.1109/MCG.2013.24
- Jeuffroy and Recous (1999) Marie-Hélène Jeuffroy and Sylvie Recous. 1999. Azodyn: a simple model simulating the date of nitrogen deficiency for decision support in wheat fertilization. European Journal of Agronomy 10, 2 (1999), 129–144. https://doi.org/10.1016/S1161-0301(98)00059-8
- Kery et al. (2018) Mary Beth Kery, Marissa Radensky, Mahima Arya, Bonnie E. John, and Brad A. Myers. 2018. The Story in the Notebook: Exploratory Data Science Using a Literate Programming Tool. In Proceedings of the ACM Conference on Human Factors in Computing Systems. ACM, 174. https://doi.org/10.1145/3173574.3173748
- Klein et al. (2007) Gary Klein, Jennifer K Phillips, Erica L Rall, and Deborah A Peluso. 2007. A data-frame theory of sensemaking. In Expertise out of context: Proceedings of the International Conference on Naturalistic Decision Making. New York, NY, USA: Lawrence Erlbaum, 113–155.
- Kounios and Beeman (2014) John Kounios and Mark Beeman. 2014. The cognitive neuroscience of insight. Annual Review of Psychology 65, 1 (2014), 71–93. https://doi.org/10.1146/annurev-psych-010213-115154
- Kung et al. (1975) Hsiang-Tsung Kung, Fabrizio Luccio, and Franco P Preparata. 1975. On finding the maxima of a set of vectors. J. ACM 22, 4 (1975), 469–476. https://doi.org/10.1145/321906.321910
- López Jaimes and Coello Coello (2009) Antonio López Jaimes and Carlos A. Coello Coello. 2009. Some Techniques to Deal with Many-objective Problems. In Proceedings of the Genetic and Evolutionary Computation Conference: Late Breaking Papers. ACM, 2693–2696. https://doi.org/10.1145/1570256.1570386
- McCurdy et al. (2018) Nina McCurdy, Julie Gerdes, and Miriah Meyer. 2018. A Framework for Externalizing Implicit Error Using Visualization. IEEE Transactions on Visualization and Computer Graphics 25, 1 (2018), 925–935. https://doi.org/10.1109/TVCG.2018.2864913
- Motta and Pappalardo (2013) Santo Motta and Francesco Pappalardo. 2013. Mathematical modeling of biological systems. Briefings in Bioinformatics 14, 4 (2013), 411–422. https://doi.org/10.1093/bib/bbs061
- Mouret et al. (2015) Jean-Roch Mouret, Vincent Farines, Jean-Marie Sablayrolles, and Ioan-Cristian Trelea. 2015. Prediction of the production kinetics of the main fermentative aromas in winemaking fermentations. Biochemical Engineering Journal 103 (2015), 211–218. https://doi.org/10.1016/j.bej.2015.07.017
- North (2006) Chris North. 2006. Toward measuring visualization insight. IEEE Computer Graphics and Applications 26, 3 (2006), 6–9. https://doi.org/10.1109/MCG.2006.70
- Paige (1966) Jeffery M Paige. 1966. Cognitive processes in solving algebra word problems. Problem Solving (1966).
- Passi and Jackson (2017) Samir Passi and Steven Jackson. 2017. Data Vision: Learning to See Through Algorithmic Abstraction. In Proceedings of the ACM Conference on Computer Supported Cooperative Work and Social Computing. ACM, 2436–2447. https://doi.org/10.1145/2998181.2998331
- Passi and Jackson (2018) Samir Passi and Steven J. Jackson. 2018. Trust in Data Science: Collaboration, Translation, and Accountability in Corporate Data Science Projects. Proceedings of the ACM on Human-Computer Int. 2, CSCW, Article 136 (Nov. 2018), 28 pages. https://doi.org/10.1145/3274405
- Perrot et al. (2016) Nathalie Perrot, Hugo De Vries, Evelyne Lutton, Harald GJ Van Mil, Mechthild Donner, Alberto Tonda, Sophie Martin, Isabelle Alvarez, Paul Bourgine, Erik Van Der Linden, et al. 2016. Some remarks on computational approaches towards sustainable complex agri-food systems. Trends in Food Science & Technology 48 (2016), 88–101. https://doi.org/10.1016/j.tifs.2015.10.003
- Pine and Liboiron (2015) Kathleen H. Pine and Max Liboiron. 2015. The Politics of Measurement and Action. In Proceedings of the ACM Conference on Human Factors in Computing Systems. ACM, 3147–3156. https://doi.org/10.1145/2702123.2702298
- Pirolli and Card (2005) Peter Pirolli and Stuart Card. 2005. The sensemaking process and leverage points for analyst technology as identified through cognitive task analysis. In Proceedings of International Conference on Intelligence Analysis, Vol. 5. 2–4.
- Polanyi (2009) Michael Polanyi. 2009. The tacit dimension. University of Chicago press.
- Pousman et al. (2007) Zachary Pousman, John Stasko, and Michael Mateas. 2007. Casual Information Visualization: Depictions of Data in Everyday Life. IEEE Transactions on Visualization and Computer Graphics 13, 6 (Nov. 2007), 1145–1152. https://doi.org/10.1109/TVCG.2007.70541
- Ravier et al. (2018) Clémence Ravier, Marie-Hélène Jeuffroy, Philippe Gate, Jean-Pierre Cohan, and Jean-Marc Meynard. 2018. Combining user involvement with innovative design to develop a radical new method for managing N fertilization. Nutrient Cycling in Agroecosystems 110, 1 (2018), 117–134.
- Rensink and Baldridge (2010) Ronald A Rensink and Gideon Baldridge. 2010. The perception of correlation in scatterplots. In Computer Graphics Forum, Vol. 29. Wiley Online Library, 1203–1210. https://doi.org/10.1111/j.1467-8659.2009.01694.x
- Riche et al. (2018) Nathalie Henry Riche, Christophe Hurter, Nicholas Diakopoulos, and Sheelagh Carpendale. 2018. Data-driven Storytelling. CRC Press.
- Rogers and Lindley (2004) Yvonne Rogers and Siân Lindley. 2004. Collaborating Around Vertical and Horizontal Large Interactive Displays: Which Way Is Best? 16, 6 (2004), 1133–1152. https://doi.org/10.1016/j.intcom.2004.07.008
- Saraiya et al. (2005) Purvi Saraiya, Chris North, and Karen Duca. 2005. An insight-based methodology for evaluating bioinformatics visualizations. IEEE Transactions on Visualization and Computer Graphics 11, 4 (2005), 443–456. https://doi.org/10.1109/TVCG.2005.53
- Sedlmair et al. (2014) Michael Sedlmair, Christoph Heinzl, Stefan Bruckner, Harald Piringer, and Torsten Möller. 2014. Visual parameter space analysis: A conceptual framework. IEEE Transactions on Visualization and Computer Graphics 20, 12 (2014), 2161–2170. https://doi.org/10.1109/TVCG.2014.2346321
- Simon et al. (2015) Svenja Simon, Sebastian Mittelstädt, Daniel A Keim, and Michael Sedlmair. 2015. Bridging the gap of domain and visualization experts with a Liaison. In Eurographics Conference on Visualization, Vol. 2015. The Eurographics Association. https://doi.org/10.2312/eurovisshort.20151137
- Skovholt et al. (2004) T Skovholt, Matthew Hanson, Len Jennings, and Tabitha Grier. 2004. A brief history of expertise. Master therapists: Exploring expertise in therapy and counseling (2004), 1–15.
- Tong et al. (2018) Chao Tong, Richard Roberts, Rita Borgo, Sean Walton, Robert S Laramee, Kodzo Wegba, Aidong Lu, Yun Wang, Huamin Qu, Qiong Luo, et al. 2018. Storytelling and Visualization: An Extended Survey. Information 9, 3 (2018), 65. https://doi.org/10.3390/info9030065
- Tong et al. (2017) Lili Tong, Aurélien Tabard, Sébastien George, and Audrey Serna. 2017. Horizontal vs. Vertical: How the Orientation of a Large Interactive Surface Impacts Collaboration in Multi-Surface Environments. In IFIP Conference on Human-Computer Interaction. Springer, 202–222. https://doi.org/10.1007/978-3-319-67687-6_14
- Tušar and Filipič (2015) Tea Tušar and Bogdan Filipič. 2015. Visualization of Pareto front approximations in evolutionary multiobjective optimization: A critical review and the prosection method. IEEE Transactions on Evolutionary Computation 19, 2 (2015), 225–245. https://doi.org/10.1109/TEVC.2014.2313407
- Von Korff et al. (2010) Yorck Von Korff, Patrick d’Aquino, Katherine A Daniell, and Rianne Bijlsma. 2010. Designing participation processes for water management and beyond. Ecology and society 15, 3 (2010).
- Willett et al. (2011) Wesley Willett, Jeffrey Heer, Joseph Hellerstein, and Maneesh Agrawala. 2011. CommentSpace: structured support for collaborative visual analysis. In Proceedings of the ACM conference on Human Factors in Computing Systems. ACM, 3131–3140. https://doi.org/10.1145/1978942.1979407
- Woodruff and Herman (2013) Matthew Woodruff and Jon Herman. 2013. pareto.py: a sorting routine. https://github.com/matthewjwoodruff/pareto.py.
- Yi et al. (2008) Ji Soo Yi, Youn-ah Kang, John T Stasko, and Julie A Jacko. 2008. Understanding and characterizing insights: how do people gain insights using information visualization?. In Proceedings of the ACM Workshop on BEyond Time and Errors. ACM, ACM, 4. https://doi.org/10.1145/1377966.1377971