Analyzing admissions metrics as predictors of graduate GPA and whether graduate GPA mediates PhD completion
Abstract
An analysis of 1,955 physics graduate students from 19 PhD programs shows that undergraduate grade point average predicts graduate grades and PhD completion more effectively than GRE scores. Students’ undergraduate GPA (UGPA) and GRE Physics (GRE-P) scores are small but statistically significant predictors of graduate course grades, while GRE quantitative and GRE verbal scores are not. We also find that males and females score equally well in their graduate coursework despite a statistically significant 18 percentile point gap in median GRE-P scores between genders. A counterfactual mediation analysis demonstrates that among admission metrics tested only UGPA is a significant predictor of overall PhD completion, and that UGPA predicts PhD completion indirectly through graduate grades. Thus UGPA measures traits linked to graduate course grades, which in turn predict graduate completion. Although GRE-P scores are not significantly associated with PhD completion, our results suggest that any predictive effect they may have are also linked indirectly through graduate GPA. Overall our results indicate that among commonly used quantitative admissions metrics, UGPA offers the most insight into two important measures of graduate school success, while posing fewer concerns for equitable admissions practices.
I Introduction
As physics graduate admission committees across the country consider eliminating GRE scores from consideration when evaluating applicants [1, 2], it is important to continue examining the GRE’s ability to predict success in graduate school in order for programs to make informed policy choices. Although GRE scores are among the numeric metrics that best predict admission into U.S. graduate programs [3, 4], there are significant disparities in typical GRE performance between students of different demographic backgrounds [5]. Combined with the fact that Physics remains one of the least diverse of all the STEM fields [6], the prospect that GRE tests limit the ability of certain students to enter graduate school has led researchers to begin questioning the utility of GRE exam scores in the graduate admissions process in comparison to other quantitative metrics such as undergraduate GPA (UGPA) [1, 7, 8]. Among some of the findings in this body of work are indications that earning high marks on the GRE Physics (GRE-P) test fails to help students “stand out” to admissions committees who would have overlooked them due to an otherwise weak application [8], and that typical physics PhD admissions criteria such as the GRE-P exam fail to predict PhD completion despite limiting access to graduate school for underrepresented groups [1].
Yet overall PhD completion is only one measure of “success” in graduate school. Graduate faculty often cite high grades, graduation in a reasonable amount of time, and finding a job after graduation as indications of successful graduate students [9]. It is therefore crucial for admissions committees understand how these other measures of success are related to common quantitative admissions metrics as well. In particular, studying the role of graduate grade point average (GGPA) is important for both historical and practical reasons. Among physics graduate students, positive relationships between GRE-P scores, first-year graduate grades, and cumulative graduate grades have traditionally been touted as evidence for the exam’s utility in evaluating applicants [10, 11]. Several other studies [12, 13, 14, 15] suggest that a number of common admissions metrics are correlated with GGPA as well. At a practical level, gaining a better understanding of which factors best predict graduate grades is valuable due to the fact that performance in graduate classes can influence whether students will ultimately complete a PhD. For instance, programs may institute GPA requirements that prevent students from continuing study if their course grades do not meet certain criteria.
Predictive validity analyses of GRE scores across all STEM disciplines consistently find that scores on the GRE Quantitative (GRE-Q) and Verbal (GRE-V) tests are more effective predictors of graduate grades than PhD completion [12, 13]. For instance, recent studies on PhD admissions in the biomedical field found that students’ GRE-Q and GRE-V scores are poor predictors of PhD completion, but are more associated with first-semester and cumulative graduate school grades [14, 15]. In contrast, studies cited by the Educational Testing Service (ETS) such as the meta-analysis of GRE predictive validity by Kuncel et al. [11] show a positive correlation between GRE subject scores, graduate grades, and PhD completion. Kuncel et al. find that GRE subject tests show larger correlations with GGPA than GRE-Q, GRE-V, or UGPA, which they attribute to the subject-specific knowledge that the GRE subject tests are purported to measure. Still, GRE-Q and GRE-V scores, which the authors presume to be broad measures of cognitive ability, are shown to only moderately correlate with GGPA but do not significantly correlate with PhD completion. Kuncel et al. also find undergraduate grade point average (UGPA) correlates with GGPA but not completion.
Despite voluminous research on the efficacy of quantitative admissions metrics in predicting graduate success, there remains a dearth of studies specifically examining these metrics in the context of physics graduate education. No current study elucidates the relationships between undergraduate grades, GRE scores, and physics graduate grades. Moreover, studies such as [1] do not incorporate graduate grades into models of PhD completion despite its theoretical and structural importance on the road to graduate success. This paper aims to fill these gaps in the current literature.
The primary goal of this paper is to extend the analysis of Miller et al. [1], using the same data set to examine the correlations of common quantitative admissions statistics with graduate physics GPA, as well as the role that graduate GPA plays in predicting whether a student completes their PhD program. Whereas [1] did not utilize information on student graduate course performance, this paper incorporates graduate GPA into several models in order to determine whether commonly used admissions metrics predict PhD completion of US students directly, or indirectly via graduate GPA; a discussion of the theoretical motivation for why graduate grades may mediate the relationship between admissions metrics and PhD completion is offered in Section II. Hence, while the analysis presented in Miller et al. [1] was primarily focused on simply identifying the measures that best correlated with PhD completion, this analysis explores questions regarding both how and why those correlations occurred.
Exploring whether graduate GPA mediates the relationship between common admissions metrics and PhD completion affords us the opportunity to employ statistical methods from the literature on causal inference [16, 17, 18, 19, 20, 21, 22, 23]. In doing so we lay out methods of calculating the direct and indirect effects of common admissions metrics on PhD completion, as well as the assumptions needed for those effects to have a causal interpretation. This approach allows us to gain useful information from the present analysis, while careful examination of the assumptions required for causal interpretation will help guide future studies.
Use of statistical methods developed in the causal inference literature allows us to build on the findings in [24] by incorporating the ranking of a student’s PhD program along a mediating pathway to completion rather than as a covariate in regression analysis. We also present models with various combinations of GRE-P and GRE-Q scores to show that variance inflation due to collinearity is minimal, and is therefore not a concern. These analyses are included in the Supplemental Material.
We seek to answer two primary research questions in this paper:
-
1.
How do commonly used admissions metrics and demographic factors relate to physics graduate GPA?
-
2.
What role does graduate GPA play in predicting PhD completion, and do quantitative admissions metrics predict PhD completion indirectly through graduate GPA?
To answer these questions, we begin by exploring the relationships between variables using bivariate correlations. We then examine the unique predictive effects of different admission metrics on graduate GPA using a multiple linear regression model. These results lay the groundwork for a mediation analysis, which is used to examine the role that graduate GPA plays in PhD completion by breaking down effects into direct and indirect components. All of the primary analyses are performed using data on US physics graduate students, with a review of equivalent analyses for international students included in the Supplemental Materials.
II Background and Motivation
Before outlining the quantitative methods employed in this analysis, we briefly describe the student performance metrics used in this study and the broad individual student characteristics they help to measure. We discuss the underlying constructs hypothesized by the GRE Quantitative, Verbal, and subject tests, as well as undergraduate and graduate grades, and several external factors that influence these scores. The GRE Analytical Writing test is not included since it is not used enough in physics graduate admissions to warrant investigation. This section serves as a theoretical motivation for the models of PhD completion analyzed in this study.
The GRE is a series of standardized tests designed to help admissions committees predict future academic success of students coming from different backgrounds [25, 26]. While the GRE-Q assesses basic concepts of arithmetic, algebra, geometry, and data analysis, the GRE-V assesses reading comprehension skills and verbal and analytical reasoning skills. These tests are specifically constructed to measure “basic developed abilities relevant to performance in graduate studies” [27]. In their meta-analysis of GRE predictive validity, Kuncel et al. frame the GRE-Q and GRE-V as most related to declarative and procedural knowledge and suggest that they are best described as measures of general cognitive ability [11]. In contrast, the GRE subject tests “assess acquired knowledge specific to a field of study” [25], indicating that the GRE subject tests are ostensibly a direct measure of a student’s knowledge of a particular area of study. Indeed, admissions committees often interpret high GRE subject scores as strong evidence of a student’s discipline-specific knowledge [9]. Other research suggests that higher scores on standardized subject tests could also reflect greater student interest in that subject area [28].
The individual characteristics measured by a student’s undergraduate grades include both academic knowledge and a collection of noncognitive factors [29]. Much research exists on the meaning and value of grades, particularly at the K-12 level, and a review [30] of the past century of grading research finds that grades assess a multidimensional construct comprising academic knowledge, engagement (including motivation and interest), and persistence. Consistently over the past 100 years only about 25% of variance in grades is attributable to academic knowledge as measured by standardized tests [31], with recent research suggesting that much of the unexplained variance is represented by a student’s ability to negotiate the “social processes” of school [32]. We therefore regard UGPA as broadly measuring student academic achievement across a wide range of subjects in addition to several aspects of noncognitive traits such as motivation, interest, and work habits. However, we also recognize the limitations inherent in compressing students’ college academic performance into a single number, including the loss of information pertaining to student growth over time and time to degree completion.
We conceptualize graduate GPA similarly, treating it as a measure of subject-specific academic knowledge as well as other non-academic characteristics. In addition to the broad research on grades described above, research specifically addressing the factors leading to graduate success supports this interpretation of GGPA. Interviews conducted with over 100 graduate school faculty reveal that graduate success, which they define as a student’s ability to earn high graduate grades and eventually complete their degree in a timely manner, is largely dependent on noncognitive characteristics [9]. Interviewees deemed motivation, work ethic, maturity, and organizational skills as crucial to student success in graduate school. In a separate review of noncognitive predictors pertaining to graduate success, graduate GPA is specifically linked to a variety of personality (e.g. extroversion and conscientiousness) and attitudinal factors (e.g. motivation, self-efficacy, and interests) [33]. Indeed, the authors of the review characterize graduate grades as a complex composite of many of the cognitive and noncognitive factors related to graduate school success.
These conceptions of grades and GRE scores compel us to hypothesize that graduate GPA mediates the relationship between common quantitative admissions metrics and PhD completion. As a construct measuring subject-specific knowledge and several noncognitive characteristics, we expect UGPA and GRE-P to most strongly link to GGPA. Despite the drawbacks of cumulative UGPA (such as grade inflation and masking of individual growth), we expect UGPA to be associated with graduate course performance since it captures aspects of both academic and some non-academic characteristics. We also expect GRE-P scores to be related to graduate grades due to their requirement of specific physics knowledge. Finally, while we expect GRE-Q may have a small predictive effect on GGPA as a general cognitive measure, we do not necessarily expect a similar relationship for GRE-V as its content is generally disparate from physics curricula.
On both a theoretical and structural level we expect graduate grades to predict PhD completion. Graduate GPA may offer insight into a student’s mastery of advanced physics concepts as well as their personality and attitudes. All of these contribute to successful physics PhD completion, but likely vary in importance depending on choice of research area [33]. Structurally, a satisfactory performance in graduate courses is implicit on the path to completing a PhD. For example, GGPA requirements can act as thresholds for being allowed to continue studying in a PhD program. Poor course performance may negatively influence personal factors (e.g., self-efficacy, identity), limit access to research opportunities (e.g., repeating classes, ease of finding a research lab), or may indicate a lack of preparation for research, all of which could hinder PhD completion. It is also more temporally proximal to PhD completion than the other metrics included in the study.
Lastly, we note that although this discussion has focused on students’ individual traits that may predict success in graduate school, there are undoubtedly a number of external factors that can influence student attrition. Socioeconomic factors, mental health, family responsibilities, work duties, external job prospects, and departmental culture are all variables that would play a role in a comprehensive model of graduate school persistence [9, 34, 35, 36, 37, 38]. These uncollected pieces of information may act as “confounding” variables that can bias results, and we discuss their influence on the present study in Section V.2.
III Method
III.1 Data
Student level data for both this study and [1] was requested from physics departments that awarded more than 10 PhD’s per year for students who matriculated between 2000 and 2010, including information on undergraduate GPA (UGPA), GRE-Q, GRE-V, GRE-P, and graduate GPA (GGPA). Data collected also included the final disposition of students (PhD earned or not), start and finish years, and demographic information. GPA data is analyzed on a 4.0 scale while GRE scores are on the percentile scale.
We received data from 27 programs (approximately a 42% response rate), which spanned a broad range of National Research Council (NRC) rankings. The sample used in [1] consisted of all students in 21 programs for which start year was available. Given that the median time to degree across physics PhD programs is 6 years, some students who started before 2010 were still active at the time of data collection in 2016. The probability of not completing the physics PhD has an exponential time dependence with a time constant of 1.8 years. Thus, students who have been in their programs for three time constants have only a 5% chance of not completing. These students were thus categorized as completers in this study.
These data covered 3962 students. Of this subset, two programs did not report GGPA data for their students. Hence, the sample for this study excludes these students, thereby reducing the sample size to 3406 students across 19 programs. This corresponds to approximately 11% of matriculants to all U.S. physics PhD programs during the years studied.
| US | Non-US | Total | |
|---|---|---|---|
| Male | 1638 | 1164 | 2802 |
| Female | 317 | 287 | 604 |
| Total | 1955 | 1451 | 3406 |
Among the sample of US students, 16% are women (). Although the authors generally advocate for a nuanced treatment of gender in physics education research and recognize the deficits associated with treating gender as a fixed binary variable [42], the present data set spans the years 2000 to 2010 during which the data collected by programs only allowed for the binary option of male/female. Hence, we must treat gender as a dichotomous variable in this analysis.
The racial composition of the dataset is 61.6% White, 1.3% Black, 2.1% Hispanic, 0.2% Native American, 3.5% Asian, 1.0% multiple or other races, and 30.2% undisclosed. Excluding the cases for which race was unavailable, the sample is thus roughly representative of annual PhD production in U.S. physics for gender, race, and citizenship [43]. We include race as a covariate in each analysis presented; however small , particularly for Black, Hispanic, Native American, and Asian students, often precludes useful interpretation of the results pertaining to these subsets.
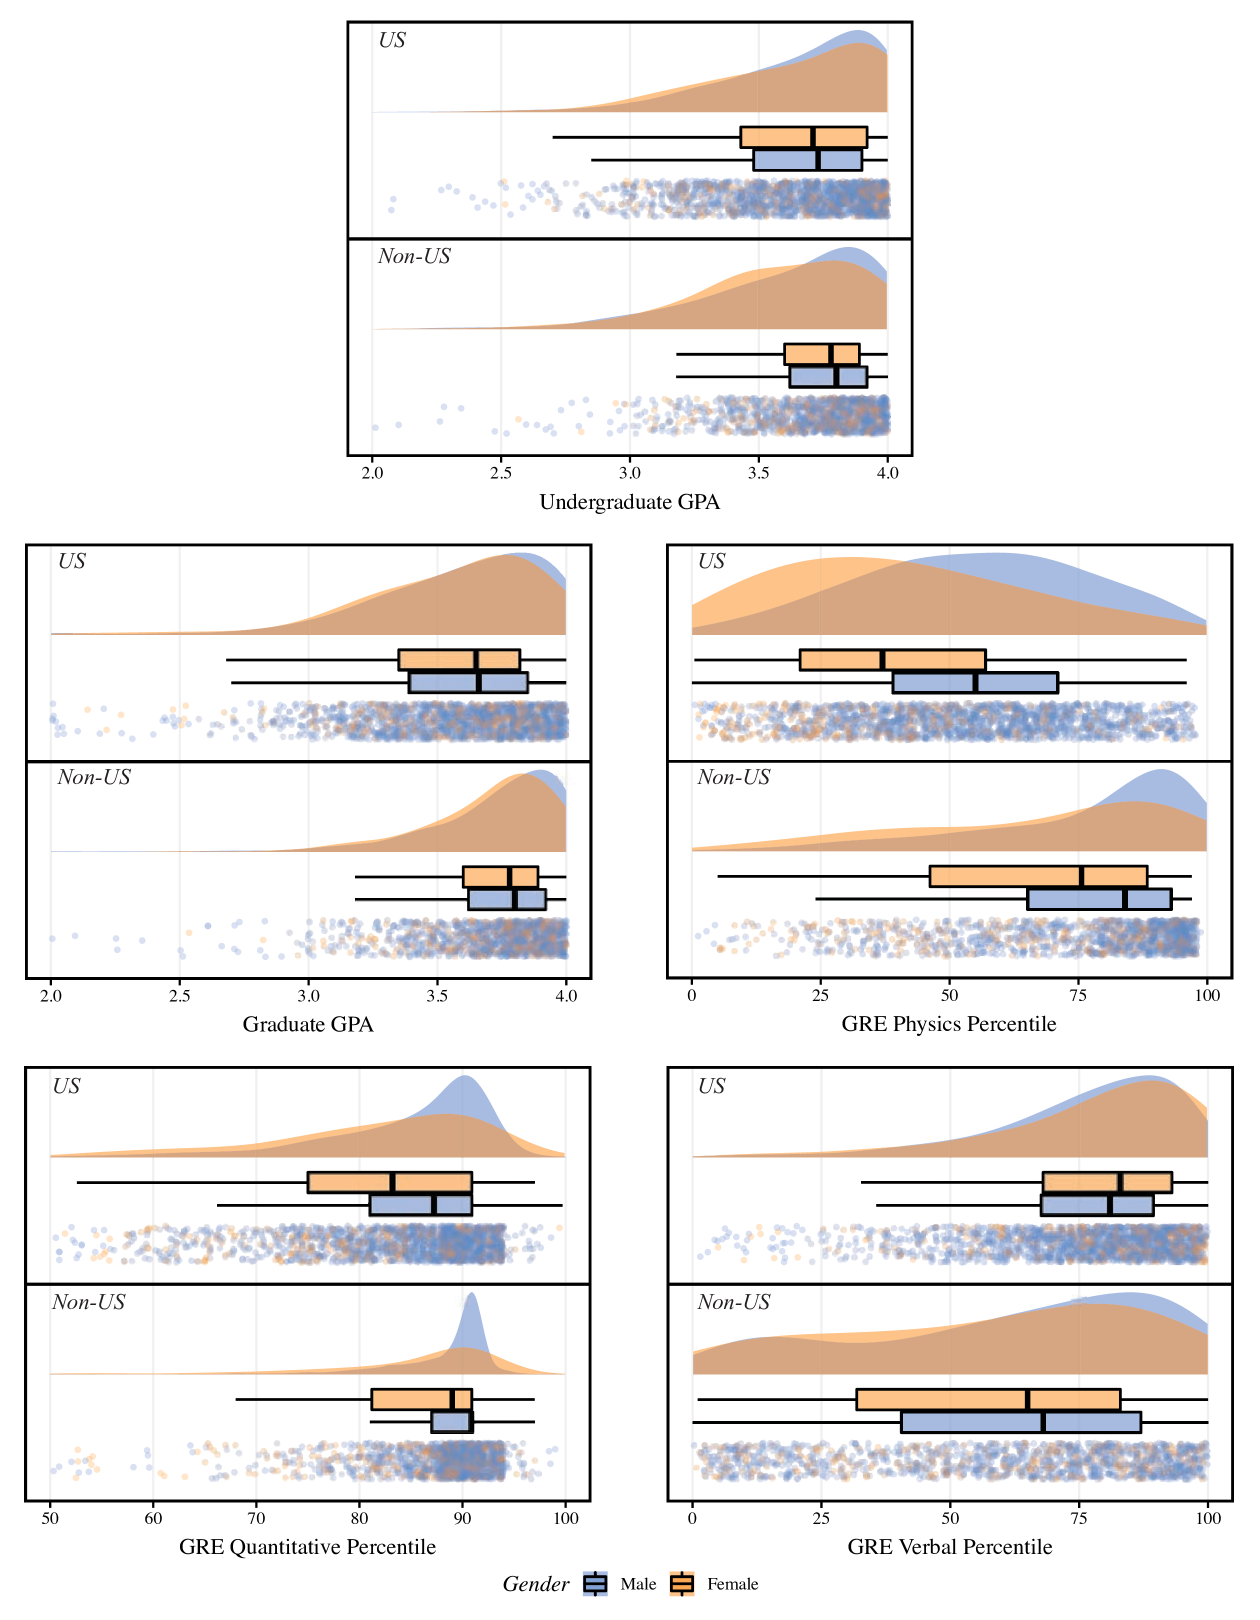
In order to focus on issues of diversity and inclusion associated most strongly with US applicants, we use only the subset of data from domestic graduate students. This decision is further motivated by research suggesting that it is difficult for admission committees to directly compare scores earned by US and international students, indicating that separate analyses are appropriate [9]. Using the subset of students who are from the US reduces the total sample size for the study to . A cursory visualization of the variables in the data set, as shown in Figure 1, shows that the distributions of scores for US and Non-US students are markedly different, which further justifies separate analyses of these two student populations.
Examining the distributions of scores in Figure 1, the presence of non-normality is evident in nearly all of the variables. Each of the continuous variables in the dataset fail the Shapiro-Wilk test of normality at the level of .05. However, these tests are often of limited usefulness; in general distributions with skewness or kurtosis likely indicate that they violate any assumption of normality [44]. For this dataset, the GGPA distribution skewness and kurtosis , indicating severe non-normality. The GRE-Q distribution also falls into the problematic range ( and ). Ceiling effects are also present, since many students earned 4.0 grade point averages or earned the maximum score on the GRE examinations.
The data collection process was limited to gathering only cumulative graduate GPA rather than first-year graduate grades, which were not recorded by some programs. Thus, depending on whether a student persisted in a program, their graduate GPA may be based on many courses while others are based on only a few courses. The data set is also necessarily subject to range restriction, since data on student performance in graduate school is automatically limited to include only students who were accepted to undertake graduate study. We cannot know how students who were not accepted into graduate school would have performed had they been accepted. Range restriction may act to attenuate the strength of observed effects in subsequent analyses [45].
Although not used in a majority of this study, we briefly explore the role of the doctoral programs’ NRC ranking in PhD completion [46]. Since the NRC only gives confidence intervals for program rank, we created a ranking for this study by averaging the 5 and 95% confidence bounds for the NRC regression-based ranking (NRC-R) and rounded this up to the nearest five to protect the confidentiality of participating programs. This led to a ranking range of 5 to 105. We divided the programs into terciles of approximately equal number of records, and categorized as Tier 1 (highest ranked, NRC-R 20), Tier 2 (25 NRC-R 55), and Tier 3 (NRC-R 55).
Multiple imputation (predictive mean matching) is used to impute missing UGPA and GRE-P scores. Predictive mean matching is used due to the non-normality of the data. 160 students do not have data for either UGPA or GRE-P, while 400 are missing only UGPA and 263 are missing only GRE-P. All multiple imputation is conducted using the mice package in R [47]. 20 imputed data sets are used for each analysis. For consistency, incomplete variables are imputed using the same imputation model used in [1], in which the imputation model utilizes all other variables in the data set aside from graduate GPA and PhD completion. The model utilizes GRE-Q, GRE-V, program tier, gender, and race, as well as complete cases of UGPA and GRE-P. Although the imputation approach presented here is theoretically sound, we also present a comparison of several different models of data imputation in the Supplemental Materials.
III.2 Methods to explore the role of graduate grades
The goal of this section is twofold. First, we seek to gain a cursory look at how graduate GPA is related to common admissions metrics. In doing this, we also wish to determine whether it is reasonable that admissions metrics could indirectly predict completion through graduate GPA. This section presents a series of analyses meant to elucidate the relationships between standard admissions metrics, students’ GGPA, and students’ final disposition. To make our analysis maximally accessible to readers of different statistical backgrounds, we describe here in detail the methods used in this section.
Bivariate correlation coefficients provide information about the level of association between two variables, and are therefore a useful starting point for analysis. We construct a correlation matrix (see Table 2) for all variables in the sample using Pearson correlation coefficients, which are equivalent to the standardized slope coefficients for a linear model predicting from . These are given by
| (1) |
for any two continuous variables and . Calculating gives us a first glance at the relationships between the continuous variables UGPA, GGPA, GRE-P, GRE-Q, and GRE-V.
When the variable is treated as dichotomous (e.g., gender in this data set), Eq. (1) reduces to the point-biserial correlation coefficient ,
| (2) |
where and are the means of the continuous variable for the two groups 1 and 0, and are the proportions of data belonging to these two groups, and is the standard deviation for the variable. Like the Pearson coefficient, the quantity ranges from -1 to 1 and indicates the strength of association between two variables. Conveniently, a significance test for the point-biserial correlation is identical to performing an independent t-test on the data [48]. Thus, the point-biserial correlation coefficient yields information about whether two group means are statistically different. For instance, the point-biserial correlation tests whether the GGPA of male students are statistically different from those of female students (we find that GGPAs are not significantly different by gender, see Table 2).
When and are both dichotomous, the Pearson coefficient reduces to the phi coefficient,
| (3) |
where is the chi-squared statistic for a 2x2 contingency table and is the total number of observations in the data. The phi coefficient also ranges from -1 to 1 and indicates the strength of association between two binary variables. This quantity allows us to examine whether final disposition is significantly associated with gender (we find that the association between gender and final disposition just meets the threshold for statistical significance (, ), likely due to the large sample size of our data, but the very small phi coefficient indicates that the practical strength of this relationship is negligible [49]).
To characterize how GGPA and other numerical predictors vary across program tier, we conduct several one-way analysis of variance (ANOVA) tests using program tier as the independent variable. ANOVA tests allow us to determine whether there are significant differences between different groups, such as students in different program tiers. These tests produce an F-statistic, which is interpreted as the ratio of between-group variability to within-group variability. Thus, higher values of F indicate that between-group variability is large compared to within-group variability, which is unlikely if the group means all have a similar value.
Lastly we present the results of a multiple regression analysis in which we regress GGPA on common admissions metrics and demographic factors. Regression allows us to examine the unique predictive effects of these predictors.
The classical linear regression model is written mathematically for an outcome variable as
| (4) |
where , the number of observations in the data, and represents the number of predictors in the model. Error terms are assumed to be independent and normally distributed with mean 0 and standard deviation . is the vector of regression coefficients that minimizes the sum of squared errors
| (5) |
for the given data. The regression coefficients can be interpreted as the difference in the outcome variable , on average, when comparing two groups of units that differ by 1 in one predictor while keeping all the other predictors the same.
We report both unstandardized and standardized versions of the regression coefficients. Unstandardized coefficients are the result of regression analysis using the original, unscaled variables. Thus, the unstandardized regression coefficients represent the predicted average change in the outcome variable when the corresponding predictor is changed by one unit. This allows for a straightforward interpretation since the variables are not scaled, but does not yield insight into the relative predictive strengths of the independent variables since they are scaled differently. Standardized regression coefficients result from regression analyses using continuous variables that have been mean-centered and divided by their standard deviation, resulting in variables with variances equal to 1. Thus standardized regression coefficients represent the average number of standard deviations changed in the outcome variable when a predictor variable is increased by one standard deviation. By calculating the standardized coefficients, we exchange a simple interpretation of score change for an interpretation of which variables have the greatest effect on the dependent variable.
III.3 Mediation analysis methods
Using mediation analysis we seek to answer the question of whether graduate GPA mediates the predictive ability of common admissions metrics on PhD completion. Whereas analyses such as logistic regression [1] yield information about whether independent variables such as UGPA and GRE-P affect final disposition of a graduate student, they do not offer insight into the explanation of why and how UGPA, GRE-P, and other admissions metrics affect completion. Mediation analysis is one technique that allows us to probe the underlying process by which some variables influence others [19, 20, 21, 22, 23].
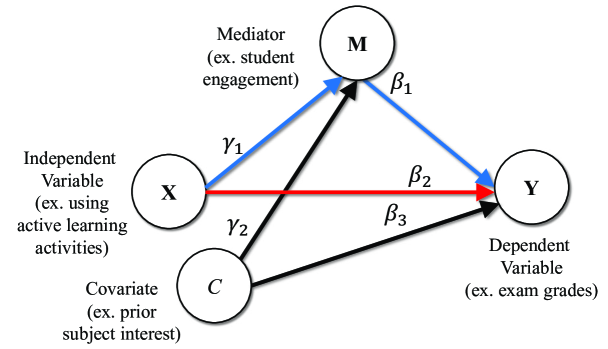
Figure 2 graphically depicts a prototypical mediation model, where , and represent the model’s independent, dependent, and mediating variables. represents a covariate. As a hypothetical example, let’s say that previous research has shown a positive relationship between the use of active learning activities in physics class and student exam grades. Researchers might hypothesize that this relationship is actually due to a third mediating variable, student engagement. Using active learning activities in class may cause students to become more engaged with the material, making their subsequent exam grades increase. Engagement is a mediating variable in this case. Meanwhile, since students who are already interested in physics could be predisposed to being more engaged and performing better on exams, the researcher might take students’ prior physics interest into account by including it as a covariate in their analyses.
In this section, we wish to discern whether graduate GPA mediates the relationship between common admissions metrics and students’ likelihood of completing graduate school. In practice, mediation analysis is done by simultaneously estimating a set of regression equations [50]. The goal is to partition the total effect of the independent variable on the dependent variable into two parts: the direct effect of on and the indirect effect of on through the mediating variable . For the simple example given above, the set of regression equations to be solved are:
| (6) |
| (7) |
Traditional mediation literature [51, 52] defines the direct effect of on as the coefficient and the indirect effect of on as the product of coefficients , corresponding to the products of the path coefficients along the mediated path shown in Figure 2. Statistically significant values of indicate that the relationship between and is mediated by . This method demonstrates the general intuitive ideas underlying mediation analysis, but is subject to several important limitations. Foremost among the limitations associated with traditional mediation analysis is that its applicability to model categorical variables (e.g., binary outcomes) and nonlinearities is not well defined, as these situations preclude the use of sums and products of coefficients [53, 19, 54]. The difficulties associated with binary outcomes are therefore problematic for a model predicting final disposition, a binary outcome. Furthermore, traditional mediation models leave the causal interpretation of their results ambiguous [55].
Recent work in the field of causal inference [16, 17, 18] has formalized and generalized mediation analysis to resolve these limitations, allowing for categorical outcomes while also clarifying that under certain conditions the results may be interpreted causally. In this framework, often called the “potential outcomes” framework, the traditional product-of-coefficients mediation analysis is a special case for which the mediator and outcome variables are both continuous, while the functional forms of the direct and indirect effects for other situations become more complicated [50].
For the primary analysis of this paper, we calculate the direct and indirect effects defined by the potential outcomes framework for the case of a continuous independent variable (UGPA, GRE-P, and GRE-Q), a continuous mediator (GGPA), and a dichotomous outcome (final disposition). The simultaneous regression equations to be calculated are still Eqs. (6) and (7), except the binary is replaced with , a continuous unobserved latent variable which represents the observed binary variable. Once estimated, the direct and indirect effects reduce to simple differences in probability of completing a PhD between students across different values of the independent variables. Mathematically, the effects for a change in the independent variable from a value to at a particular value of the control are given by
| (8) |
| (9) |
where represents the normal cumulative distribution function and is given by
| (10) |
and is
| (11) |
Note that these expressions are all still simply combinations of the coefficients from the regression equations (6) and (7). Thus, the potential outcomes framework allows us to calculate the total predicted change in probability of completing a PhD due to an independent variable and decompose it into that variable’s indirect effect on final disposition through GGPA as well as its direct effect (see Figure 4).
Using this mediation framework can help to give powerful insights into nuanced relationships between the variables in an observational study [56]. However, giving a truly causal interpretation to the results of this mediation analysis requires a set of strong assumptions to be met, and in practice it can be difficult for any observational study fully meet these conditions [57]. Hence, we try to avoid making explicitly causal claims in our discussion of the results. We discuss the assumptions needed for a causal interpretation as well as the robustness of the current study to violations of those assumptions in Section V.2.
Mediation analyses were conducted using the mediation package in R [58]. Checks for the consistency of results across different computational approaches were done by performing duplicate mediation analyses in the R package medflex [59] as well as the statistical software Mplus [60].
| Measure (M + SD) | UGPA | GRE-Q | GRE-V | GRE-P | GGPA | Final Disp. | Gender |
|---|---|---|---|---|---|---|---|
| UGPA (3.6 0.3) | – | (0.25, 0.35) | (0.12, 0.22) | (0.26, 0.37) | (0.24, 0.33) | (0.10, 0.20) | (-0.11, 0.01) |
| GRE-Q (83.3 10.4) | 0.30 | – | (0.30, 0.37) | (0.47, 0.54) | (0.13, 0.22) | (0.10, 0.18) | (-0.16, -0.07) |
| GRE-V (76.3 18.7) | 0.17 | 0.33 | – | (0.23, 0.32) | (0.06, 0.15) | (0.02, 0.10) | (-0.02, 0.07) |
| GRE-P (52.9 23.2) | 0.31 | 0.51 | 0.28 | – | (0.18, 0.27) | (0.10, 0.19) | (-0.33, -0.24) |
| GGPA (3.5 0.5) | 0.29 | 0.18 | 0.10 | 0.22 | – | (0.39, 0.46) | (-0.06, 0.03) |
| Final Disp. | 0.15 | 0.15 | 0.06 | 0.14 | 0.43 | – | (-0.09, -0.01) |
| Gender | -0.05 | -0.11 | 0.03 | -0.30 | -0.01 | -0.05 | – |
IV Results
IV.1 Results of exploring the role of graduate grades
Correlations An initial question related to predicting a student’s final disposition is whether UGPA, GRE scores, and GGPA are reliably correlated with a student’s final outcome. We are also interested in the strength of association between GGPA, UGPA, and GRE scores, as this information yields insight into whether GGPA could serve as a mediating variable in predicting final disposition. Table 2 contains the bivariate correlations (Pearson, point-biserial, and phi) between each pair of measures for the sample in the lower diagonal. The 95% confidence intervals are reported in the upper diagonal. Confidence intervals that do not include a value of zero indicate that the correlation is statistically significant. The means and standard deviations of the continuous variables are presented in the table’s first column (GPA data is analyzed on a 4.0 scale while GRE scores are on the percentile scale).
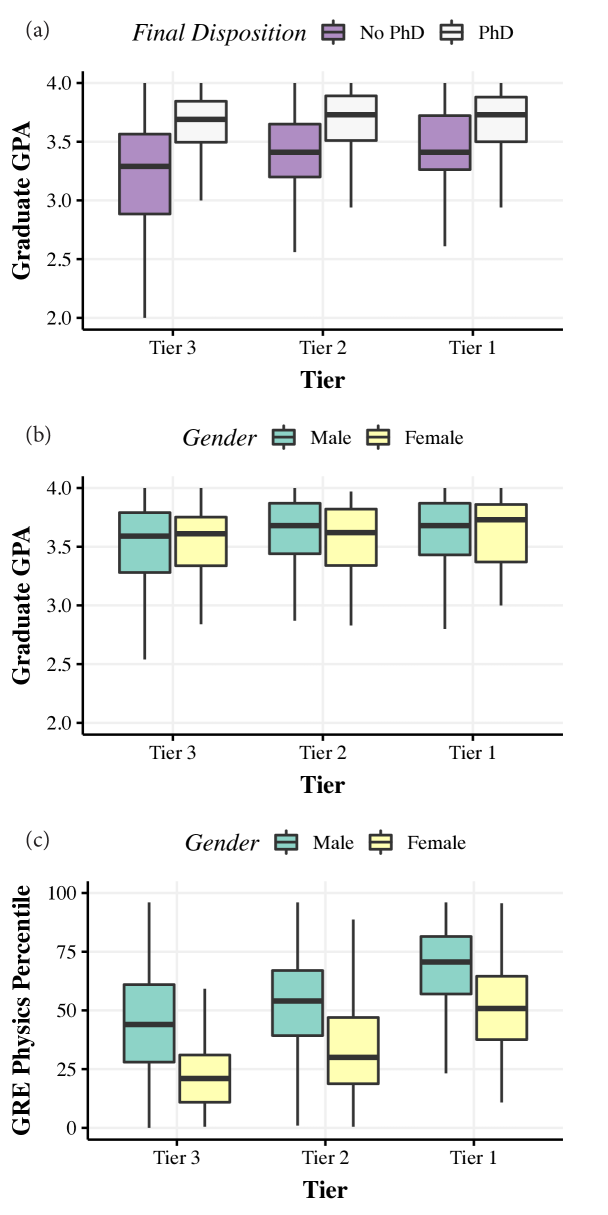
Inspection of Table 2 reveals that GGPA is the predictor most strongly correlated with final disposition (). This value is statistically significant () and positive, meaning that students with higher GGPA are more likely to finish their PhD program successfully. This trend is visually apparent in Figure 3(a), which shows boxplots of GGPA grouped by PhD completers and non-completers. We also observe that UGPA (, ), GRE-Q (, ), and GRE-P (, ) are all positively correlated with GGPA, albeit weakly, meaning that students with higher scores in these metrics tend to earn higher GGPAs. Taken together, the observation that higher UGPA and GRE scores positively correlate to GGPA, which in turn correlate with a student’s likelihood of completion, implies that GGPA might play an important role in mediating the influence of these admissions metrics on PhD completion.
The lack of a statistically significant correlation between gender and GGPA indicates that the disparity in scores on the GRE-P between males and females does not manifest itself in subsequent GGPA performance. Indeed, there is no statistical difference between average GGPA for males and females (, , equivalent to a non-significant independent -test), as demonstrated in Figure 3(b). Yet there exists a statistically significant difference between males and females in GRE-P performance in our data (, , equivalent to a statistically significant independent -test). Thus GGPA does not differ between genders despite the known performance gap between males and females on the GRE-P exam. Furthermore, the phi coefficient measuring the association between gender and PhD completion is negligible despite barely meeting the threshold of statistical significance (, ).
Still, the bivariate correlations shown in Table 2 do not control for possible relationships between the variables of interest. For instance, the moderate correlation between GRE-Q and GRE-P (, ) indicates that there may be a spurious relationship between one of these variables and GGPA. In addition, we observe low but statistically significant correlations between UGPA and GRE-P (, ), GRE-Q (, ), and GRE-V (, ). This is expected, as UGPA likely contains some information regarding the specific aspects of students’ aptitudes tested by GRE exams. These results motivate the use of multiple regression analysis later in this section in order to disentangle the unique effects of each independent variable on GGPA. That analysis reveals that when we isolate the unique predictive effects of each variable in the regression model, UGPA and GRE-P remain significant but weak predictors of GGPA, while GRE-Q does not retain statistical significance.
Similarly, although UGPA (, ), GRE-P (, ) and GRE-Q (, ) are positively correlated with PhD completion, the magnitudes of these correlations are very weak and do not account for other parameters that may be associated with completion. Multivariate approaches allows us to isolate how individual metrics relate to PhD completion, which we explore in the mediation analysis presented in Section IV.2. Consistent with previous studies of PhD completion using multivariate approaches [1], we find that when accounting for other parameters, only UGPA remains a statistically significant predictor of completion.
Results of one-way independent ANOVA tests show that the main effect of program tier on GGPA is significant, , , which reflects the upward trend in GGPA from Tier 3 to Tier 1 and 2 programs. A Tukey post hoc test reveals that the GGPA was significantly higher for students at Tier 2 (, , ) and Tier 1 (, , ) institutions than those at Tier 3 institutions (, ). There was no statistically significant difference between the Tier 1 and Tier 2 groups ().
Multiple Regression To disentangle the unique effects of each predictor on GGPA we conduct a multiple linear regression analysis. Multiple linear regression allows us to simultaneously fit many independent variables to measure each of their relative effects on a single dependent variable, GGPA. Analyzing the raw coefficients fitted by the regression analysis yields insight into the predicted change in GGPA due to changes in one variable while holding all others constant. Standardized coefficients allow for a comparison of the relative effect sizes of the independent variables.
Our model includes all available GRE scores (GRE-P, GRE-Q, and GRE-V) as well as UGPA in order to examine the unique predictive effects of each measure. We considered the possibility that including both GRE-P and GRE-Q in the same model would raise collinearity concerns, but find these concerns unfounded. The bivariate correlation () between the two is not high enough to warrant genuine concern [61, 62]; furthermore, the variance inflation factor (VIF) for every imputed dataset’s regression model was below 1.75, well below the commonly cited threshold of 10. Hence, we deem the model posed in the study as most appropriate to answer the research questions raised in this study (further discussion regarding collinearity concerns in the data is available in the Supplemental Material).
| Multiple Regression Results (*, **) | ||||||||
|---|---|---|---|---|---|---|---|---|
| Dependent Variable - GGPA | ||||||||
|
|
|
||||||
| [] Intercept | 1.92** (0.15) | -0.06 | ||||||
| [] UGPA | 0.35** (0.04) | 0.24** | ||||||
| [] GRE-P | ** () | 0.15** | ||||||
| [] GRE-Q | () | 0.03 | ||||||
| [] GRE-V | () | 0.01 | ||||||
| Black | -0.11 (0.09) | -0.23 | ||||||
| Hispanic | -0.01 (0.07) | -0.02 | ||||||
| Native Am. | 0.01 (0.23) | 0.03 | ||||||
| Asian | -0.02 (0.06) | -0.05 | ||||||
| Other | -0.24* (0.11) | -0.51* | ||||||
| Undisclosed | 0.07** (0.02) | 0.15** | ||||||
| Gender | 0.06* (0.03) | 0.13* | ||||||
| N | 1955 | |||||||
| Adjusted R-Squared | 0.11 | |||||||
The results obtained in our analysis are summarized in Table IV.1. Significant predictive effects at the 95% threshold were found for the numerical metrics UGPA (, , ) and GRE-P (, , ). Students with higher UGPA and GRE-P scores therefore tend to receive higher GGPAs. Among statistically significant predictors, the highest standardized coefficient is UGPA, which is larger than the GRE-P coefficient by approximately 50%.
The regression model predicts that for a 0.10 score increase in UGPA, GGPA is expected to increase on average by 0.035 points, holding all other predictors fixed. Meanwhile, a 10 percentile increase in GRE-P score is associated with a 0.031 point increase in GGPA on average, again holding other predictors fixed.
A significant predictive effects was found for gender (, , ). The positive coefficient indicates that if a female student and male student have the same admissions scores, the female student would earn a higher grades in her graduate classes. We include race as a parameter in the analysis as a categorical variable, though all groups except White had small (the most students in the dataset identified as White, , while the fewest identified as Native American, ). None of the race categories were statistically significant parameters except “Other.”
Notably the GRE-Q coefficient is not statistically significant, suggesting that it has little predictive effect on graduate course performance. Yet in [1], GRE-Q was seen to link to overall completion. This observation, along with those made above regarding the predictive effects of UGPA and GRE-P on GGPA, motivate the mediation analysis in the following section. Some predictors, namely GRE-Q, may link more directly to PhD completion, while others such as UGPA and GRE-P may indirectly predict completion through their effect on GGPA, which itself links to completion.
IV.2 Mediation analysis results
|
||||||||||||
|---|---|---|---|---|---|---|---|---|---|---|---|---|
|
|
|
|
|||||||||
| UGPA |
|
|
|
|||||||||
| GRE-P |
|
|
|
|||||||||
| GRE-Q |
|
|
|
|||||||||
Having demonstrated that graduate GPA (GGPA) is correlated with several quantitative admissions metrics of interest as well as final PhD completion, we now turn to the results of a mediation analysis to determine the extent to which GGPA mediates the relationship between these variables. As described previously, these results yield insight into whether better performance in undergraduate coursework and on GRE examinations increase a student’s likelihood of completing a PhD program directly or indirectly via GGPA. Over the course of performing these analyses we explored numerous mediation models using different combinations of covariates (e.g. gender and race) to explore their effect on the results. For instance, we probed the effects of including these variables as moderators in the analysis to account for varying predictive effects among different demographics. However, results were consistent regardless of how these covariates were included in the model.
We perform a separate mediation analysis for each predictor variable (UGPA, GRE-P, and GRE-Q). For each analysis, we begin by calculating the direct and indirect effects of each metric on PhD completion using Eqs. (8) and (9). We also calculate the total effect, which is the sum of the direct and indirect effects. The total effect is comparable to the result one would obtain by using logistic regression to predict changes in probability of PhD completion as was done in Miller et al. [1].
This procedure requires us to choose both a control and treatment value for the admissions metrics, since the output of the mediation analysis is the predicted difference in probability of PhD completion if a student who earned the control score had earned the treatment score instead.
Table 4 shows the results of a mediation analysis in which we calculate the predicted change in probability of PhD completion if a student had earned a 3.90 undergraduate GPA rather than a 3.46 undergraduate GPA. This change corresponds to a shift from the 25th to 75th percentile of undergraduate GPAs in our data. We observe that the predicted total effect of this change is to increase the student’s overall probability of PhD completion by 6.0% (). That effect is entirely attributable to the indirect effect of UGPA on PhD completion through graduate GPA, since the direct effect is estimated to be -0.1% and is not statistically significant (), while the indirect effect is estimated to be 6.0% and is statistically significant (). Meanwhile, mediation analysis using GRE-P as the predictor variable estimates that due to a change from the 25th to 75th percentile of GRE-P scores among students in this study, the probability of PhD completion increases by 3.7% (this change corresponds to a shift in GRE-P percentile ranking from 35 to 71 among the overall physics test-taking population). This result just misses the threshold of statistical significance (). However, any effect that may be associated with a higher GRE-P score is attributable to the indirect effect of GRE-P on GGPA, which is estimated to be 4.2% and is statistically significant (). For a change in GRE-Q score from the 25th to 75th percentile of scores among students in this study (a change in GRE-Q percentile ranking from 79 to 91 among the overall physics test-taking population), the direct (2.4%, ) and indirect (0.9%, ) predictive effects on PhD completion are not statistically significant. Their sum, the total effect, estimates an increase in PhD completion probability of 3.4%, and like the total effect of GRE-P also just misses the threshold for statistical significance ().
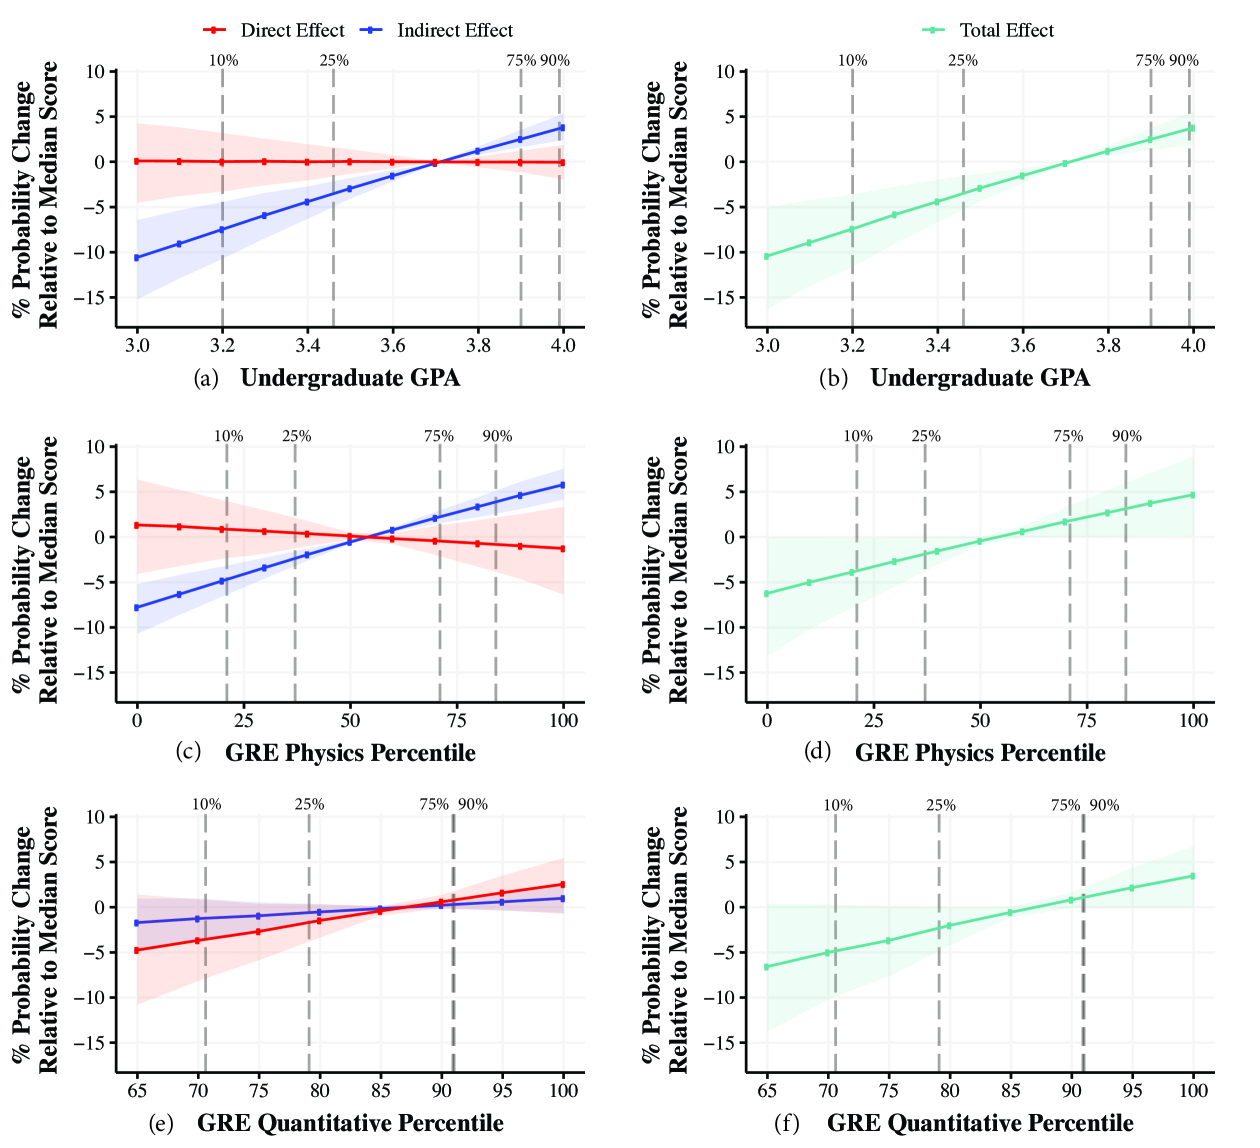
To examine how the predicted probability of PhD completion changes over a broad range of UGPA and GRE scores, we repeat this single mediation analysis for a range of treatment values, as suggested in [22]. We opt to choose our data’s median values as the baseline control value of each metric, then compute the direct and indirect effects for a variety of treatment values with respect to this baseline. The result is a plot of predicted PhD completion probability change as each score is varied. Figure 4 graphically summarizes the results of the mediation analysis. Figures 4a), c), and e) display the results of the three separate analyses predicting PhD completion probability changes relative to the median value of each independent variable. Points on each plot represent individual calculations of probability change relative to each admission metric’s median value. Hence, the median value of the -axis variable is clearly shown on the plot as the point where the direct (red) and indirect effect (blue) lines intersect, corresponding to a total probability change of 0%.
| Current Study | Previous Study (Ref. [1]) | |||||||||||||||||
|
|
|
|
|
||||||||||||||
| [] UGPA | 0.060 () | 6.0% | 0.60 () | 3.6% | ||||||||||||||
| GRE-P | 0.037 () | 3.7% | () | 3.1% | ||||||||||||||
| [] GRE-Q | 0.034 () | 3.4% | () | 2.1% | ||||||||||||||
Percent probability changes due to direct effects of each admissions metric on PhD completion are shown in red, while indirect effects on PhD completion transmitted through GGPA are shown in blue. Plots of the total effect of each variable on PhD completion probability, which is the sum of the direct and indirect effects, are shown in Figures 4b), d), and f). The shaded ribbons around the lines representing the best-estimates of probability change show the 95% confidence interval. Hence, if this shaded region contains the line , the effect is not statistically significant at the level.
In agreement with the results of the example analysis shown in Table 4, the total predictive effect of UGPA on PhD completion is statistically significant while the total effects of GRE-P and GRE-Q do not reach the threshold for statistical significance, indicated by the error bands that encompass the line (Figures 4d and f). Still, as suggested by the result in the Total Effect column of Table 4 for GRE-P () and GRE-Q (), these effects are close to reaching statistical significance; for reference, each point in Figure 4d) the GRE-P confidence ribbon surpasses the line by less than 0.5%. Thus these results provide some evidence that scoring more highly on the GRE-P and GRE-Q are positively associated with higher rates of completion, although the effects are not statistically significant.
Also consistent with the results of the example analysis shown in Table 4 the results of the three mediation analyses indicate that predictive effects of UGPA and GRE-P on a student’s PhD completion are entirely mediated by GGPA, defined by the fact that the indirect effect of these admissions metrics are statistically significant across all magnitudes of score change while their direct effects are not. These indirect effects are shown in Figure 4 by the blue lines in the UGPA and GRE-P plots, whose error ribbons do not contain the line . The interpretation of this result is that UGPA effectively predicts a student’s GGPA, which in turn predicts PhD completion. Similarly, any increase in PhD completion probability associated with increases in GRE-P scores are a result of the indirect effect through graduate GPA, although the total effect is not statistically significant.
With regard to GRE-Q, given the weak relationship between GRE-Q and GGPA revealed by the multiple regression analysis in Section IV.1, it is unsurprising that the indirect effect shown in blue on Figure 4 is nearly zero. Indeed, as indicated by the earlier results in Table 4 any predictive effect from GRE-Q on completion appears to stem from the direct effect of GRE-Q on PhD completion, although the direct effect does not achieve statistical significance at the level.
Lastly, despite using different statistical methods and omitting program tier as a predictor in our model, we observe that the results obtained in this study are qualitatively consistent with those reported by Miller et al. [1]. Table IV.2 shows a comparison of the total effects predicted by the mediation model presented here with the results of the logistic regression model presented in [1], again using as an example the predicted changes in probability of PhD completion due to shifts from the 25th to 75th percentile in score for the different admissions metrics. In both analyses, the predictive effects associated with changes in UGPA are statistically significant and are the largest in magnitude among the tested metrics. Effects associated with changes in GRE-P scores are not statistically significant at the level in either model but are close ( in this study and in [1]). The only minor inconsistency between the two analyses is revealed in the results of the GRE-Q models. Whereas in [1] the predictive effect of GRE-Q on completion was barely significant (), it is not statistically significant here (). However, as demonstrated in Table IV.2, effects associated with GRE-Q are not strong in either model and both are very close to the threshold for statistical significance, indicating that the two results are still approximately consistent.
V Discussion
V.1 Interpretation of Results
The results presented in Section IV.2 give new insight into how admissions committees may contextualize the use of quantitative admissions metrics. Clearly, no existing metric provides unassailable evidence that a student will complete their graduate program. However, among the imperfect quantitative admissions metrics commonly used by admissions committees, the consistent message from this work and others is that undergraduate GPA offers the most promising insight into whether physics graduate students will earn a PhD. Moreover, there is no significant difference between male and female applicants’ UGPAs as there is for the GRE-P, meaning that its use in ranking applicants is less likely to skew diversity of admitted students.
As demonstrated by the multiple regression analyses in Section IV.1, UGPA is most strongly associated with graduate course performance among the variables tested. In some ways this is an expected result: UGPA, the metric that directly measures a student’s in-class performance, is most effective at predicting future in-class performance in graduate school. Still, UGPA would seem to vary greatly depending on the student’s particular undergraduate institution while a standardized exam like the GRE-P is consistent across all students. It is possible that UGPA may also be signaling socio-emotional skills such as achievement orientation and conscientiousness, which are known to predict high levels of performance both in and out of the classroom [63, 64, 65, 66]. These sorts of socio-emotional skills are also shown in the relevant research literature to lack the race, gender, and culture of origin gaps that are found on many standardized tests [67, 68, 69].
While previous work showed that UGPA was an effective predictor of PhD completion, mediation analysis demonstrates that relationship is entirely transmitted through UGPA’s ability to predict GGPA. Thus, although UGPA is the best predictor of a student’s final disposition, our analysis indicates that it is not a direct measure of PhD completion. Rather, the observed relationship between undergraduate grades and completion is explained by the intervening variable GGPA. Regarding the magnitude of the observed effects, we see that changes in score from the 25th to 75th percentile in UGPA (3.46 to 3.90) are associated with an 6% increase in completion probability. Changes across a broader range of UGPAs from the 10th to 90th percentile (3.2 to 3.98), the mediation model predicts an 11% increase in PhD completion probability.
Multiple regression and mediation analyses also yield improved insight into the information provided by GRE-P. Consistent with prior published work by ETS [11, 10], regression analysis reveals that GRE-P is an effective predictor of graduate grades. However, the effect associated with UGPA is approximately 50% larger than the effect associated with GRE-P. Regarding the relationship between GRE-P scores and PhD completion, any association between GRE-P performance and PhD completion is entirely mediated by graduate course performance, similar to UGPA. This particular indirect effect indicates that a student who scores more highly on the GRE-P is more likely to perform better in graduate school courses, which may slightly improve their probability of graduation (although the total effect of GRE-P is not statistically significant). However, this indirect effect is still smaller than the indirect effect associated with UGPA, as illustrated in Figure 4.
Notably, despite the existence of a large gender gap in GRE-P scores (the median GRE-P percentile for females is 35 and 57 for males), male and female graduate students earn nearly indistinguishable graduate grades (Figure 3). Moreover, there is no practical relationship between gender and PhD completion (Table 2). We have also done a preliminary analysis of this same data examining the relation between gender and time to PhD completion, and found that no statistically significant difference exists in the time it takes for male and female physics graduate students to complete doctoral degrees. The disparity in GRE-P scores between male and female test takers is therefore anomalous, as it does not appear to be related to differences in ability or level of preparation and is not reflected in subsequent graduate performance.
Results of multiple regression and mediation analyses that show GRE-Q is not strongly associated with increased graduate course performance are unsurprising given the GRE-Q’s task relevance is lower than subject tests and undergraduate grades. Indeed, in its Guide to the Use of Scores[25], ETS describes the GRE-Q as testing “high school mathematics and statistics at a level that is generally no higher than a second course in algebra; it does not include trigonometry, calculus or other higher-level mathematics.” As shown in Table 4, the association between GRE-Q scores and PhD completion just misses the threshold of statistical significance (). Combined with previous studies in which this weak association was statistically significant [1], evidence suggests a weak relationship between GRE-Q scores and completion.
Both direct and indirect effects of GRE-Q on completion were not statistically significant and therefore we cannot discern with certainty which small effect is more important. Considering the case of a possible direct effect between GRE-Q and completion, the low task relevance makes it unlikely that GRE-Q is a measure of research competence or perseverance. One hypothesis is that socioeconomic status (SES) could be confounding the relationship between GRE-Q, an exam consisting of high school level mathematics questions, and PhD completion. Students with lower SES may have fewer opportunities academically and may perform worse on a standardized exam like the GRE-Q. Indeed, it is estimated that roughly 20% of variance in standardized test scores can be explained by SES [70] In general, previous research [71] indicates that SES impacts whether students possess the proper resources to support them should financial, health or other external circumstances make it difficult to complete. Moreover, doctoral students from lower social classes are more likely to experience a lower sense of belonging in graduate school, often due to the residual financial burdens that are not mitigated by graduate stipends [72]. Reduced sense of belonging in graduate school drives lower interest in pursuing advanced careers in the field, and ultimately a lower likelihood of completing a PhD.
V.2 Limitations and future research
V.2.1 Assumptions in Causal Mediation Analysis
The causal effect framework laid out in Section III.3 requires several assumptions to be satisfied in order for effect estimates to be properly identified. All of the assumptions underlying causal mediation analysis refer to “confounding variables,” which are variables that influence two other variables simultaneously, thereby causing a spurious association between them. In this section we discuss whether it is plausible that our study has satisfied these assumptions, as well as suggestions for future researchers seeking to perform similar analyses.
Although the assumptions prescribed by causal mediation analysis may be stated in multiple ways [73, 74], we describe them in the manner presented by [19], who condenses them into four requirements. These assumptions, displayed graphically in Figure 5, are that there exists (1) no unmeasured treatment-outcome confounders, (2) no unmeasured mediator-outcome confounders, (3) no unmeasured treatment-mediator confounders, and (4) no mediator-outcome confounder affected by the treatment.
The final assumption is equivalent to assuming that there is not an alternative mediating variable for which we have not accounted [73]. Concerns about this assumption are handled using methods for multiple mediators, discussed in detail in the Supplemental Material.
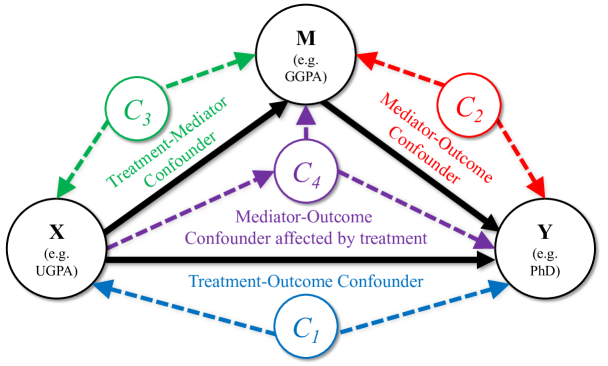
Assumptions 1-3 require us to be sure we have included all variables that could be confounding the relationships between (UGPA, GRE-P or GRE-Q), (PhD completion), and (GGPA) in our regression models. These are shown graphically by variables , , and in Figure 5. Some of the variables may influence more than one of , , and , or may influence each other, so categorization into , , and is not exclusive. Accounting for variables and correspond to assumptions normally made in observational studies to calculate total effects [75], while accounting for variables labeled is important specifically for the estimation of direct and indirect effects.
V.2.2 Sensitivity Analysis for Violation of Assumptions
Unfortunately, as is the case in any regression analysis, whether these assumptions are met is not testable; however, there exist several ways to probe the robustness of our findings under certain violations. In particular, sensitivity analyses have been developed [22, 19] to determine how strong a confounding effect between the mediator and the outcome would have to be in order to make statistically significant effects become no longer significant.
We perform such sensitivity analyses on each of the imputed data sets used in the single mediator models presented in Section IV.2 to assess their robustness. We then report the results of the sensitivity analyses averaged across the imputed datasets.
Let and represent the proportions of original variances explained by the unobserved confounder for the mediator GGPA and the outcome PhD completion, respectively. The result of a sensitivity analysis is a single value representing the product that identifies the amount of original variance in the mediator and outcome that the confounder would have to explain in order to make the observed effect vanish. Hence, the sensitivity analysis results in a family of solutions for which the equation is satisfied.
Our sensitivity analysis reveals that for a confounder to explain enough variance to make the indirect effect of UGPA on GGPA vanish, the product would have to be, on average, 0.072 (standard deviation = 0.006). For context, the variables included in the mediation models presented here, as a group, are able to explain 11% of variance in the GGPA outcome (); for PhD completion, .
Comparing these values to those required to satisfy the equation , we see that a mediator-outcome confounder would have to be a better predictor of both GGPA and PhD completion than any quantity included in the model so far. For instance, suppose a mediator-outcome confounder satisfied the equation , sufficient to nullify the indirect effect of UGPA on completion. The relationship between the confounder and GGPA () would be larger than all other variables combined in the model. The link between the confounder and PhD completion () would be larger than all other variables combined in the model as well.
Since the values of and must be so high relative to the rest of the variables in our model to nullify the indirect effect of UGPA on PhD completion, this result appears to be fairly robust.
Results of sensitivity analyses on the indirect effect of GRE-P on PhD completion were similarly robust: for a confounder to explain enough variance to make the indirect of GRE-P on GGPA vanish, the product on average would have to be 0.069 (standard deviation = 0.001). This is essentially the same as the analyses on the robustness of the UGPA result, so its interpretation is the same as above.
More details regarding the sensitivity analyses performed, including contour plots of products for which indirect effects of UGPA and GRE-P vanish, are available in the Supplemental Material.
V.2.3 Conceptualizing possible unmeasured confounders
Thoroughly considering variables that could conceivably act as confounders in Figure 5 would benefit future researchers studying graduate admissions. Non-quantitative aspects of a student’s admission credentials such as letters of recommendation and prior research experience may be associated with PhD completion, and could represent several variables in the diagram. For example, prior research experience could act as a mediator-outcome confounder, labeled in Figure 5. A student with more research experiences prior to entering graduate school may be more likely to complete a PhD than a student with fewer research experiences, since they have already become familiar with the expectations associated with scientific research and have already demonstrated the motivation to pursue it independently. More research experience may also translate to better graduate course performance, particularly if graduate courses are well-aligned with the goal of preparing students for future research.
As discussed earlier, information on student socioeconomic status could be useful as well. We also see SES as potentially representing several confounding relationships. For instance, it could act as a treatment-outcome confounder, influencing both GRE scores and PhD completion. It is estimated that roughly 20% of variance in standardized test scores can be explained by SES [70], so SES could be influencing performance on tests such as the GRE-Q and GRE-P. Students with lower SES may have fewer resources to support them should financial, external circumstances arise that make it difficult for them to complete their PhD [71, 35]. Including data on these and other possible confounders would bolster causal claims in future analyses. Furthermore, our current models only explain a small amount of the overall variance in the outcome variable, and many other factors are surely at play.
Lastly, although graduate course performance and PhD completion represent some aspects of graduate school success (as evidenced by their inclusion in GRE validation studies), they are certainly crude metrics. Future work should explore other outcomes as well, including success measures such as research productivity, job attainment, or graduate student satisfaction.
VI Conclusions
Using data visualization, regression analyses, and mediation analyses, we investigated the role that graduate GPA plays on a physics graduate student’s path to PhD completion. We aimed to answer two primary research questions: 1) How do commonly used admissions metrics and demographic factors relate to physics graduate GPA?, and 2) What role does graduate GPA play in predicting PhD completion, and does it mediate the influence of these other predictor variables on PhD completion? Broadly, we find that across the dynamic range of scores in the data, undergraduate GPA was a better predictor of both graduate GPA and final disposition than GRE scores.
Regarding the first research question of how various admissions metrics and demographic factors relate to physics graduate GPA, we see that significant but weak predictive effects at the 95% threshold were found for the numerical metrics undergraduate GPA (, , ) and GRE Physics (, , ); GRE Quantitative and Verbal scores are not significantly associated with graduate GPA. The regression model predicts that for a 0.10 score increase in undergraduate GPA, a student’s graduate GPA is expected to increase on average by 0.035 points, holding all other predictors fixed. Meanwhile, a 10 percentile increase in GRE Physics score is associated with a 0.031 point increase in graduate GPA on average, again holding other predictors fixed. For comparison, a change in UGPA from the 25th to 75th percentile of scores in our data predicts a 0.15 point increase in graduate GPA, whereas a change in GRE-P from the 25th to 75th percentile of scores in our data predicts a 0.11 increase in graduate GPA.
We also observe that the graduate GPAs are not statistically different between males and females. Hence, the statistically significant gap in performance by gender on the GRE Physics exam (within our data the median GRE Physics percentile for females is 35 and 57 for males) does not carry over to subsequent graduate course performance. The large difference in performance is unexplained, yet is potentially problematic for promoting diversity in physics graduate school. Multiple regression analysis did not reveal race to be a statistically significant predictor of graduate GPA, but unfortunately it is difficult to properly interpret relationships between race and graduate grades due to a small . Small sample size precludes useful interpretation of the results pertaining to Black, Hispanic, Native American, and Asian students.
As to the second research question of whether graduate GPA mediates the influence of these other predictor variables on PhD completion, we find that UGPA predicts PhD completion indirectly through graduate grades. Only UGPA is a statistically significant predictor of overall PhD completion (a change in UGPA from the 25th to 75th percentile of scores in our data predicts a 6% increase in PhD completion probability, ), and that effect is entirely attributable to the indirect effect of UGPA on PhD completion through graduate GPA. The indirect effect associated with UGPA on PhD completion was statistically significant across all magnitudes of score changes, while the direct effect was not (see Figure 4). Thus UGPA effectively predicts graduate course performance, which is then associated with degree completion. The association between GRE-P scores and PhD completion is not statistically significant (a change in GRE-P from the 25th to 75th percentile of scores in our data predicts a 3.7% increase in PhD completion probability, ). However, like UGPA, the indirect effect associated with increases in GRE-P score was also statistically significant across all magnitudes of score change, meaning that any predictive effect that GRE-P score may have is therefore also linked indirectly through graduate GPA.
Although these models explain some of the variance in student outcomes (the variables included in the mediation models, as a group, explain 11% of variance in graduate GPA (); for PhD completion, ), much of the variation lies in factors outside the models, in both unmeasured student characteristics prior to admission and unmeasured aspects of the graduate student experience.
No standardized test measures the research and project management skills it takes to successfully complete a multi-year research project, yet those are the skills that are so highly valued in PhD graduates. The GRE-P utilizes two-minute theoretical physics problems to ascertain aspects of students’ physics knowledge, but it neglects the broad range of computational and experimental skills used in contemporary physics research. Because undergraduate GPA reflects a mix of courses that include theory, experiment, computation, and in some cases research projects, it could be a more useful measure of research-relevant skills. However, our result that UGPA only indirectly predicts PhD completion seems to indicate those research-relevant skills are not a major part of the overall UGPA. Identifying a broader set of applicant characteristics that predict graduate student outcomes is essential.
By better understanding and improving graduate education, we have the opportunity to meet societal goals of a highly-skilled advanced STEM workforce that reflects the diversity of our society. While adjusting admissions practices may offer some improvements by adjusting which students are allowed to undertake graduate study, such efforts do nothing to improve the graduate student experience and train graduate students more effectively for STEM careers. The potential for innovation and improvement within graduate education is large and is the area deserving substantial increased attention for education research and programmatic implementation. While our study gives admissions committees greater insight into how and why various quantitative scores link to completion, our discussion of the limitations also points to areas where future researchers can build. We encourage the continued study of not only the physics graduate admissions process, but also the ongoing experience of students in PhD programs, how they are taught, mentored, and supported through their growth as individuals within a larger scientific community.
Acknowledgements.
The authors are pleased to acknowledge valuable discussions with Nicholas Young, Julie Posselt, and Rachel Silvestrini. This work was supported by NSF grants 1633275 and 1834516.References
- Miller et al. [2019] C. W. Miller, B. M. Zwickl, J. R. Posselt, R. T. Silvestrini, and T. Hodapp, Typical physics Ph.D. admissions criteria limit access to underrepresented groups but fail to predict doctoral completion, Science Advances 5, eaat7550 (2019).
- gre [2021] GRE requirements & admissions fees for US/Canadian Astronomy & Physics Programs, Available at https://docs.google.com/spreadsheets/d/19UhYToXOPZkZ3CM469ru3Uwk4584CmzZyAVVwQJJcyc/edit#gid=0 (2021).
- Attiyeh and Attiyeh [1997] G. Attiyeh and R. Attiyeh, Testing for Bias in Graduate School Admissions, The Journal of Human Resources 32, 524 (1997).
- Posselt et al. [2019] J. R. Posselt, T. E. Hernandez, G. L. Cochran, and C. W. Miller, Metrics first, diversity later? making the short list and getting admitted to physics phd programs, Journal of Women and Minorities in Science and Engineering 25 (2019).
- Miller and Stassun [2014] C. Miller and K. Stassun, A test that fails, Nature 510, 303 (2014).
- noa [2021a] NSF - Science and Engineering Doctorates: (SED Interactive), Available at https://www.nsf.gov/statistics/2016/nsf16300/digest/ (2021a).
- Levesque et al. [2015] E. M. Levesque, R. Bezanson, and G. R. Tremblay, Physics GRE Scores of Prize Postdoctoral Fellows in Astronomy (2015), arXiv:1512.03709 [physics.ed-ph] .
- Young and Caballero [2021] N. T. Young and M. D. Caballero, Physics Graduate Record Exam does not help applicants “stand out”, Physical Review Physics Education Research 17, 010144 (2021).
- Walpole et al. [2002] M. Walpole, N. W. Burton, K. Kanyi, and A. Jackenthal, Selecting successful graduate students: in-depth interviews with GRE users, ETS Research Report Series 2002, 10.1002/j.2333-8504.2002.tb01875.x (2002).
- Schneider and Briel [1990] L. M. Schneider and J. B. Briel, Validity of the GRE: 1988-1989 Summary Report, Tech. Rep. (1990).
- Kuncel et al. [2001] N. R. Kuncel, S. A. Hezlett, and D. S. Ones, A comprehensive meta-analysis of the predictive validity of the graduate record examinations: implications for graduate student selection and performance., Psychological bulletin 127, 162 (2001).
- Petersen et al. [2018] S. L. Petersen, E. S. Erenrich, D. L. Levine, J. Vigoreaux, and K. Gile, Multi-institutional study of GRE scores as predictors of STEM PhD degree completion: GRE gets a low mark, PloS one 13, e0206570 (2018).
- Kuncel et al. [2010] N. R. Kuncel, S. Wee, L. Serafin, and S. A. Hezlett, The validity of the Graduate Record Examination for master’s and doctoral programs: A meta-analytic investigation, Educational and Psychological Measurement 70, 340 (2010).
- Hall et al. [2017] J. D. Hall, A. B. O’Connell, and J. G. Cook, Predictors of student productivity in biomedical graduate school applications, PLoS One 12, e0169121 (2017).
- Moneta-Koehler et al. [2017] L. Moneta-Koehler, A. M. Brown, K. A. Petrie, B. J. Evans, and R. Chalkley, The limitations of the GRE in predicting success in biomedical graduate school, PloS one 12, e0166742 (2017).
- Robins and Greenland [1992] J. M. Robins and S. Greenland, Identifiability and Exchangeability for Direct and Indirect Effects, Epidemiology 3, 143 (1992), publisher: Lippincott Williams & Wilkins.
- Pearl [2000] J. Pearl, Causality: Models, Reasoning, and Inference (Cambridge University Press, 2000).
- Pearl [2001] J. Pearl, Direct and indirect effects, in Proceedings of the Seventeenth conference on Uncertainty in artificial intelligence, UAI ‘01 (Morgan Kaufmann Publishers Inc., San Francisco, CA, USA, 2001) pp. 411–420.
- VanderWeele [2015] T. VanderWeele, Explanation in Causal Inference: Methods for Mediation and Interaction (Oxford University Press, 2015).
- Hayes [2013] A. F. Hayes, Introduction to Mediation, Moderation, and Conditional Process Analysis: A Regression-Based Approach (Guilford Press, 2013).
- Pearl [2012] J. Pearl, The causal mediation formula - a guide to the assessment of pathways and mechanisms, Prevention Science: The Official Journal of the Society for Prevention Research 13, 426 (2012).
- Imai et al. [2010] K. Imai, L. Keele, and D. Tingley, A general approach to causal mediation analysis., Psychological Methods 15, 309 (2010).
- Valeri and Vanderweele [2013] L. Valeri and T. J. Vanderweele, Mediation analysis allowing for exposure-mediator interactions and causal interpretation: theoretical assumptions and implementation with SAS and SPSS macros, Psychological Methods 18, 137 (2013).
- Miller et al. [2020] C. W. Miller, B. M. Zwickl, J. R. Posselt, R. T. Silvestrini, and T. Hodapp, Response to comment on “Typical physics Ph.D. admissions criteria limit access to underrepresented groups but fail to predict doctoral completion”, Science Advances 6, 10.1126/sciadv.aba4647 (2020).
- ets [2021] GRE Guide to the Use of Scores, Available at https://www.ets.ord/gre/guide (2021).
- Wendler and Bridgeman [2014] C. Wendler and B. Bridgeman, The Research Foundation for the GRE Revised General Test: A Compendium of Studies (2014).
- Briel et al. [1993] J. Briel, K. O’Neill, and J. Scheuneman, GRE Technical Manual (Educational Testing Service, Princeton, NJ, 1993).
- Willingham et al. [2002] W. W. Willingham, J. M. Pollack, and C. Lewis, Grades and Test Scores: Accounting for Observed Differences, Journal of Educational Measurement 39, 1 (2002).
- Bowers [2016] A. J. Bowers, What do Teacher Assigned Grades Measure? A one page research summary (2016).
- Brookhart et al. [2016] S. M. Brookhart, T. R. Guskey, A. J. Bowers, J. H. McMillan, J. K. Smith, L. F. Smith, M. T. Stevens, and M. E. Welsh, A Century of Grading Research: Meaning and Value in the Most Common Educational Measure, Review of Educational Research 86, 803 (2016).
- Bowers [2011] A. J. Bowers, What’s in a grade? The multidimensional nature of what teacher-assigned grades assess in high school, Educational Research and Evaluation 17, 141 (2011).
- Bowers [2009] A. J. Bowers, Reconsidering grades as data for decision making: more than just academic knowledge, Journal of Educational Administration 47, 609 (2009).
- Kyllonen et al. [2011] P. C. Kyllonen, A. M. Walters, and J. C. Kaufman, The role of noncognitive constructs and other background variables in graduate education, ETS Research Report Series 2011, i (2011).
- Owens et al. [2020a] L. M. Owens, K. Shar, B. M. Zwickl, and C. W. Miller, Student Deficits vs. Sense of Belonging: Exploring Faculty and Student Perspectives on Retention in Physics Graduate Programs (2020a).
- Owens et al. [2018] L. M. Owens, B. Zwickl, S. Franklin, and C. Miller, Misaligned Visions for Improving Graduate Diversity: Student Characteristics vs. Systemic/Cultural Factors, in Physics Education Research Conference 2018, PER Conference (Washington, DC, 2018).
- Gardner [2008] S. K. Gardner, Fitting the mold of graduate school: A qualitative study of socialization in doctoral education, Innovative Higher Education 33, 125 (2008).
- Lovitts [2002] B. E. Lovitts, Leaving the ivory tower: The causes and consequences of departure from doctoral study (Rowman & Littlefield Publishers, 2002).
- National Academies of Sciences, Engineering, and Medicine and others [2018] National Academies of Sciences, Engineering, and Medicine and others, Graduate STEM education for the 21st century (National Academies Press, 2018).
- Allen et al. [2019] M. Allen, D. Poggiali, K. Whitaker, T. R. Marshall, and R. A. Kievit, Raincloud plots: a multi-platform tool for robust data visualization, Wellcome Open Research 4, 63 (2019).
- Wickham [2016] H. Wickham, ggplot2: Elegant Graphics for Data Analysis (Springer-Verlag New York, 2016).
- [41] K. Desiraju, RPubs - ggplot theme for publication ready figures, Available at https://rpubs.com/Koundy/71792.
- Traxler et al. [2016] A. L. Traxler, X. C. Cid, J. Blue, and R. Barthelemy, Enriching gender in physics education research: A binary past and a complex future, Physical Review Physics Education Research 12, 020114 (2016).
- noa [2021b] U.S. Department of Education, Institute of Education Sciences, National Center for Education Statistics, Integrated Postsecondary System (IPEDS), Available at https://nces.ed.gov/ipeds/ (2021b).
- Kline [2015] R. B. Kline, Principles and Practice of Structural Equation Modeling, 4th ed. (Guilford Publications, United States, 2015).
- Small [2017] A. R. Small, Range restriction, admissions criteria, and correlation studies of standardized tests (2017), arXiv:1709.02895 [physics.ed-ph] .
- National Research Council [2011] National Research Council, A data-based assessment of research doctorate programs in the United States (National Research Council, 2011).
- van Buuren and Groothuis-Oudshoorn [2011] S. van Buuren and K. Groothuis-Oudshoorn, mice: Multivariate Imputation by Chained Equations in R, Journal of Statistical Software 45, 1 (2011).
- Field et al. [2012] A. Field, J. Miles, and Z. Field, Discovering Statistics Using R, 1st ed. (SAGE Publications Ltd, London; Thousand Oaks, Calif, 2012).
- Scott Jones [2021] J. Scott Jones, Learn to Use the Phi Coefficient Measure and Test in R With Data From the Welsh Health Survey (Teaching Dataset) (London, 2021).
- Muthén et al. [2016] B. O. Muthén, L. K. Muthén, and T. Asparouhov, Regression and Mediation Analysis Using Mplus (Muthén & Muthén, 2016).
- Baron and Kenny [1986] R. M. Baron and D. A. Kenny, The moderator–mediator variable distinction in social psychological research: Conceptual, strategic, and statistical considerations, Journal of Personality and Social Psychology 51, 1173 (1986).
- MacKinnon [2008] D. P. MacKinnon, Introduction to Statistical Mediation Analysis (Routledge, 2008).
- MacKinnon et al. [2007] D. P. MacKinnon, C. M. Lockwood, C. H. Brown, W. Wang, and J. M. Hoffman, The intermediate endpoint effect in logistic and probit regression, Clinical Trials (London, England) 4, 499 (2007).
- Hoyle [2012] R. H. Hoyle, Handbook of Structural Equation Modeling (Guilford Press, 2012).
- Sobel [2008] M. E. Sobel, Identification of Causal Parameters in Randomized Studies With Mediating Variables, Journal of Educational and Behavioral Statistics 33, 230 (2008).
- Imai et al. [2011] K. Imai, L. Keele, D. Tingley, and T. Yamamoto, Unpacking the Black Box of Causality: Learning about Causal Mechanisms from Experimental and Observational Studies, American Political Science Review 105, 765 (2011).
- Muthén [2011] B. Muthén, Applications of causally defined direct and indirect effects in mediation analysis using SEM in Mplus (2011).
- Tingley et al. [2014] D. Tingley, T. Yamamoto, K. Hirose, L. Keele, and K. Imai, mediation: R package for Causal Mediation Analysis, Journal of Statistical Software 59, 1 (2014).
- Steen et al. [2017] J. Steen, T. Loeys, B. Moerkerke, and S. Vansteelandt, medflex: An R package for Flexible Mediation Analysis using Natural Effect Models, Journal of Statistical Software 76, 1 (2017).
- Muthén and Muthén [2009] L. Muthén and B. Muthén, Mplus, Statistical analysis with latent variables. User’s guide 8.4 (2009).
- Dormann et al. [2013] C. F. Dormann, J. Elith, S. Bacher, C. Buchmann, G. Carl, G. Carré, J. R. G. Marquéz, B. Gruber, B. Lafourcade, P. J. Leitão, T. Münkemüller, C. McClean, P. E. Osborne, B. Reineking, B. Schröder, A. K. Skidmore, D. Zurell, and S. Lautenbach, Collinearity: a review of methods to deal with it and a simulation study evaluating their performance, Ecography 36, 27 (2013).
- Vatcheva et al. [2016] K. P. Vatcheva, M. Lee, J. B. McCormick, and M. H. Rahbar, Multicollinearity in Regression Analyses Conducted in Epidemiologic Studies, Epidemiology (Sunnyvale, Calif.) 6, 10.4172/2161-1165.1000227 (2016).
- Schmidt and Hunter [1998] F. L. Schmidt and J. E. Hunter, The validity and utility of selection methods in personnel psychology: Practical and theoretical implications of 85 years of research findings., Psychological bulletin 124, 262 (1998).
- Shultz and Zedeck [2012] M. M. Shultz and S. Zedeck, Admission to law school: New measures, Educational Psychologist 47, 51 (2012).
- Lievens and Sackett [2012] F. Lievens and P. R. Sackett, The validity of interpersonal skills assessment via situational judgment tests for predicting academic success and job performance., Journal of Applied Psychology 97, 460 (2012).
- Victoroff and Boyatzis [2013] K. Z. Victoroff and R. E. Boyatzis, What is the relationship between emotional intelligence and dental student clinical performance?, Journal of dental education 77, 416 (2013).
- Oswald and Hough [2011] F. L. Oswald and L. M. Hough, Personality and its assessment in organizations: Theoretical and empirical developments. (American Psychological Association, 2011).
- Feingold [1994] A. Feingold, Gender differences in personality: a meta-analysis., Psychological bulletin 116, 429 (1994).
- Emmerling et al. [2012] R. Emmerling, R. E. Boyatzis, and R. J. Emmerling, Emotional and social intelligence competencies: cross cultural implications, Cross Cultural Management: An International Journal (2012).
- Sackett et al. [2012] P. R. Sackett, N. R. Kuncel, A. S. Beatty, J. L. Rigdon, W. Shen, and T. B. Kiger, The Role of Socioeconomic Status in SAT-Grade Relationships and in College Admissions Decisions:, Psychological Science 10.1177/0956797612438732 (2012), publisher: SAGE PublicationsSage CA: Los Angeles, CA.
- Owens et al. [2020b] L. Owens, B. Zwickl, S. Franklin, and C. Miller, Physics GRE Requirements Create Uneven Playing Field for Graduate Applicants (2020) pp. 382–387.
- Ostrove et al. [2011] J. M. Ostrove, A. J. Stewart, and N. L. Curtin, Social class and belonging: Implications for graduate students’ career aspirations, The Journal of Higher Education 82, 748 (2011).
- Imai and Yamamoto [2013] K. Imai and T. Yamamoto, Identification and Sensitivity Analysis for Multiple Causal Mechanisms: Revisiting Evidence from Framing Experiments, Political Analysis 21, 141 (2013).
- Pearl [2014] J. Pearl, Interpretation and identification of causal mediation, Psychological methods 19, 459 (2014).
- VanderWeele [2016] T. J. VanderWeele, Mediation Analysis: A Practitioner’s Guide, Annual Review of Public Health 37, 17 (2016).