Analyzing Impact of Data Reduction Techniques on Visualization for AMR Applications Using AMReX Framework
Abstract.
Today’s scientific simulations generate exceptionally large volumes of data, challenging the capacities of available I/O bandwidth and storage space. This necessitates a substantial reduction in data volume, for which error-bounded lossy compression has emerged as a highly effective strategy. A crucial metric for assessing the efficacy of lossy compression is visualization. Despite extensive research on the impact of compression on visualization, there is a notable gap in the literature concerning the effects of compression on the visualization of Adaptive Mesh Refinement (AMR) data. AMR has proven to be a potent solution for addressing the rising computational intensity and the explosive growth in data volume that requires storage and transmission. However, the hierarchical and multi-resolution characteristics of AMR data introduce unique challenges to its visualization, and these challenges are further compounded when data compression comes into play. This article delves into the intricacies of how data compression influences and introduces novel challenges to the visualization of AMR data.
1. Introduction
In recent years, there has been a significant surge in both the scale and expense associated with scientific simulations. To mitigate this, numerous high-performance computing (HPC) simulation packages, such as AMReX (Zhang et al., 2019) and Athena++ (Stone et al., 2020), have incorporated Adaptive Mesh Refinement (AMR) as a strategy to reduce computational demands while preserving or even enhancing the accuracy of simulation outcomes. Unlike conventional uniform mesh methods, which maintain a consistent resolution across the entire simulation domain, AMR provides a more resource-efficient alternative by dynamically modifying the resolution, concentrating higher resolution in key areas, and thereby optimizing computational resources and storage requirements.
While AMR data can diminish the size of the output data, the reduction may not be significant enough for scientific simulations, leading to elevated I/O and storage costs. For instance, an AMR simulation with a resolution of (i.e., mesh points at the coarse level and at the fine level) could produce up to 8 TB of data for a single snapshot with all data fields dumped; this translates to a necessity for 1 PB of disk storage, assuming the simulation is conducted in an ensemble of five times with 25 snapshots dumped per simulation, a common practice.
To address this, data compression methods can be employed alongside AMR techniques to further minimize I/O and storage expenses. However, traditional lossless compression methods are only marginally effective in compressing the vast volumes of data generated by scientific simulations, typically achieving a maximum compression ratio of 2. As an alternative, a new wave of error-bounded lossy compression techniques, such as SZ (Tao et al., 2017a; Di and Cappello, 2016a; Liang et al., 2018), ZFP (Lindstrom, 2014), MGARD (Ainsworth et al., 2018), and their GPU versions (Tian et al., 2020, 2021; cuZFP, 2023), have gained popularity in the scientific community (Di and Cappello, 2016a; Tao et al., 2017a; Lindstrom, 2014; Liang et al., 2018; Lu et al., 2018; Luo et al., 2019; Tao et al., 2019; Cappello et al., 2019; Jin et al., 2020; Grosset et al., 2020; Jin et al., 2022; Baker et al., 2019)
While lossy compression has the ability to significantly decrease the I/O and storage costs linked with AMR simulations, research on its application in AMR simulations is sparse. Recently, two studies were conducted with the aim of developing efficient lossy compression techniques for AMR datasets. Luo et al. (Luo et al., 2021) proposed zMesh, a technique that rearranges AMR data across varying refinement levels into a 1D array to leverage data redundancy. However, compressing data into a 1D array with zMesh restricts the use of higher-dimension compression, leading to a loss of spatial information and data locality in higher-dimension data. On the other hand, Wang et al. (Wang et al., 2022b) developed TAC, a technique intended to improve zMesh’s compression quality through adaptive 3D compression. Although zMesh and TAC offer offline compression solutions for AMR data, they did not delve into in-situ compression, which could notably reduce the I/O cost. To bridge this gap, Wang et al. further introduced AMRIC (Wang et al., 2023), an in situ AMR compression framework, subsequently minimizing both I/O costs and enhancing compression quality for AMR applications.
Despite the existence of various AMR data compression solutions, none of the studies have comprehensively examined the impact of lossy compression on the visualization of AMR data. While there are studies that analyze the effects of data compression on non-AMR data visualization (Wang et al., 2022a), the visualization of AMR data is more complex due to its hierarchical structure.

Specifically, the original (non-compressed) AMR data presents distinctive challenges when using basic visualization methods, particularly at the intersections of different grids with varying resolutions. For instance, as illustrated in Figure 1(a), the traditional re-sampling method leads to cracks between different AMR levels. However, there are advanced AMR visualization solutions designed to address this issue. For example, utilizing a dual-cell approach with switching cells can mend the cracks between different AMR levels, as depicted in Figure 1(c). A comprehensive explanation of the re-sampling and dual-cell methods will be provided in Sections 2.3 and 2.4, respectively.
To gain a deeper insight into how compression influences AMR data visualization methods, this study:
-
•
Apply data compression on both basic (re-sampling) and advanced (dual-cell) AMR data visualization methods, illustrating that advanced AMR visualization methods are incompatible with, and negatively impacted by, data compression compared to basic AMR visualization methods
-
•
Analyze and provide a preliminary rationale for why advanced AMR visualization methods diminish the quality of decompressed data visualization relative to basic AMR visualization methods.
2. Background And Motivation
In this section, we first provide background information on lossy compression techniques as they pertain to scientific data, followed by an introduction to AMR methods and the structure of AMR data. Subsequently, we discuss a common challenge faced when visualizing original, uncompressed AMR data and delve into existing solutions that have been developed to address this issue.
2.1. Lossy Compression for Scientific Data
Lossy compression is a widely used data reduction technique that attains high compression ratios by forfeiting some non-essential information in the reconstructed data. This method is often preferred over lossless compression, particularly for continuous floating-point data, as it typically yields significantly higher compression ratios. The effectiveness of lossy compression is generally assessed using three primary metrics: compression ratio, data distortion, and compression throughput. The compression ratio is the ratio between the original and compressed data sizes, data distortion evaluates the quality of the reconstructed data in comparison to the original data using metrics like structural similarity index measure (SSIM), and compression throughput denotes the volume of data that can be compressed by the compressor within a specified time frame.
In recent times, there has been a surge in the development of high-accuracy lossy compressors specifically designed for scientific floating-point data, such as SZ (Di and Cappello, 2016a; Tao et al., 2017a; Liang et al., 2018) and ZFP (Lindstrom, 2014). SZ is a prediction-based compressor, while ZFP is a transform-based compressor. Both are tailored to compress scientific floating-point data and offer a precise error-controlling mechanism based on user specifications. For instance, in the error-bounded mode, users must specify a type of error-bound, like absolute error bound, and a bound value. The compressor then ensures that the discrepancies between the original and reconstructed data do not surpass the specified error bound.
In this study, we used the SZ lossy compressor framework due to its superior compression ratio and modular structure. Moreover, the SZ framework comprises various algorithms to meet diverse user requirements. For instance, SZ with Lorenzo predictor (Tao et al., 2017b) delivers high compression throughput, whereas SZ with spline interpolation (Liang et al., 2022) yields a high compression ratio, especially for large error bounds. Generally, there are three crucial stages in prediction-based lossy compression, such as SZ. Initially, each data point’s value is predicted based on its neighboring points using an optimal prediction method. Next, the difference between the actual and predicted values is quantized based on the user-defined error bound. Lastly, customized Huffman coding and lossless compression are employed to achieve high compression ratios.
Previous studies have examined the impact of lossy compression on reconstructed data quality and subsequent analysis, offering recommendations for setting compression configurations for specific applications (Jin et al., 2020, 2021; Liang et al., 2022, 2018; Tao et al., 2017b; Di and Cappello, 2016b; Jin et al., 2022). Additionally, a past study investigated the influence of lossy compression on the volume rendering of non-AMR cosmology data (Wang et al., 2022a).
However, there has been no comprehensive study on the impact of lossy compression on AMR data visualization. Hence, this paper undertakes a thorough investigation of how, and explains why, various types of lossy compression affect different AMR data visualization methods
2.2. AMR Methods and AMR Data
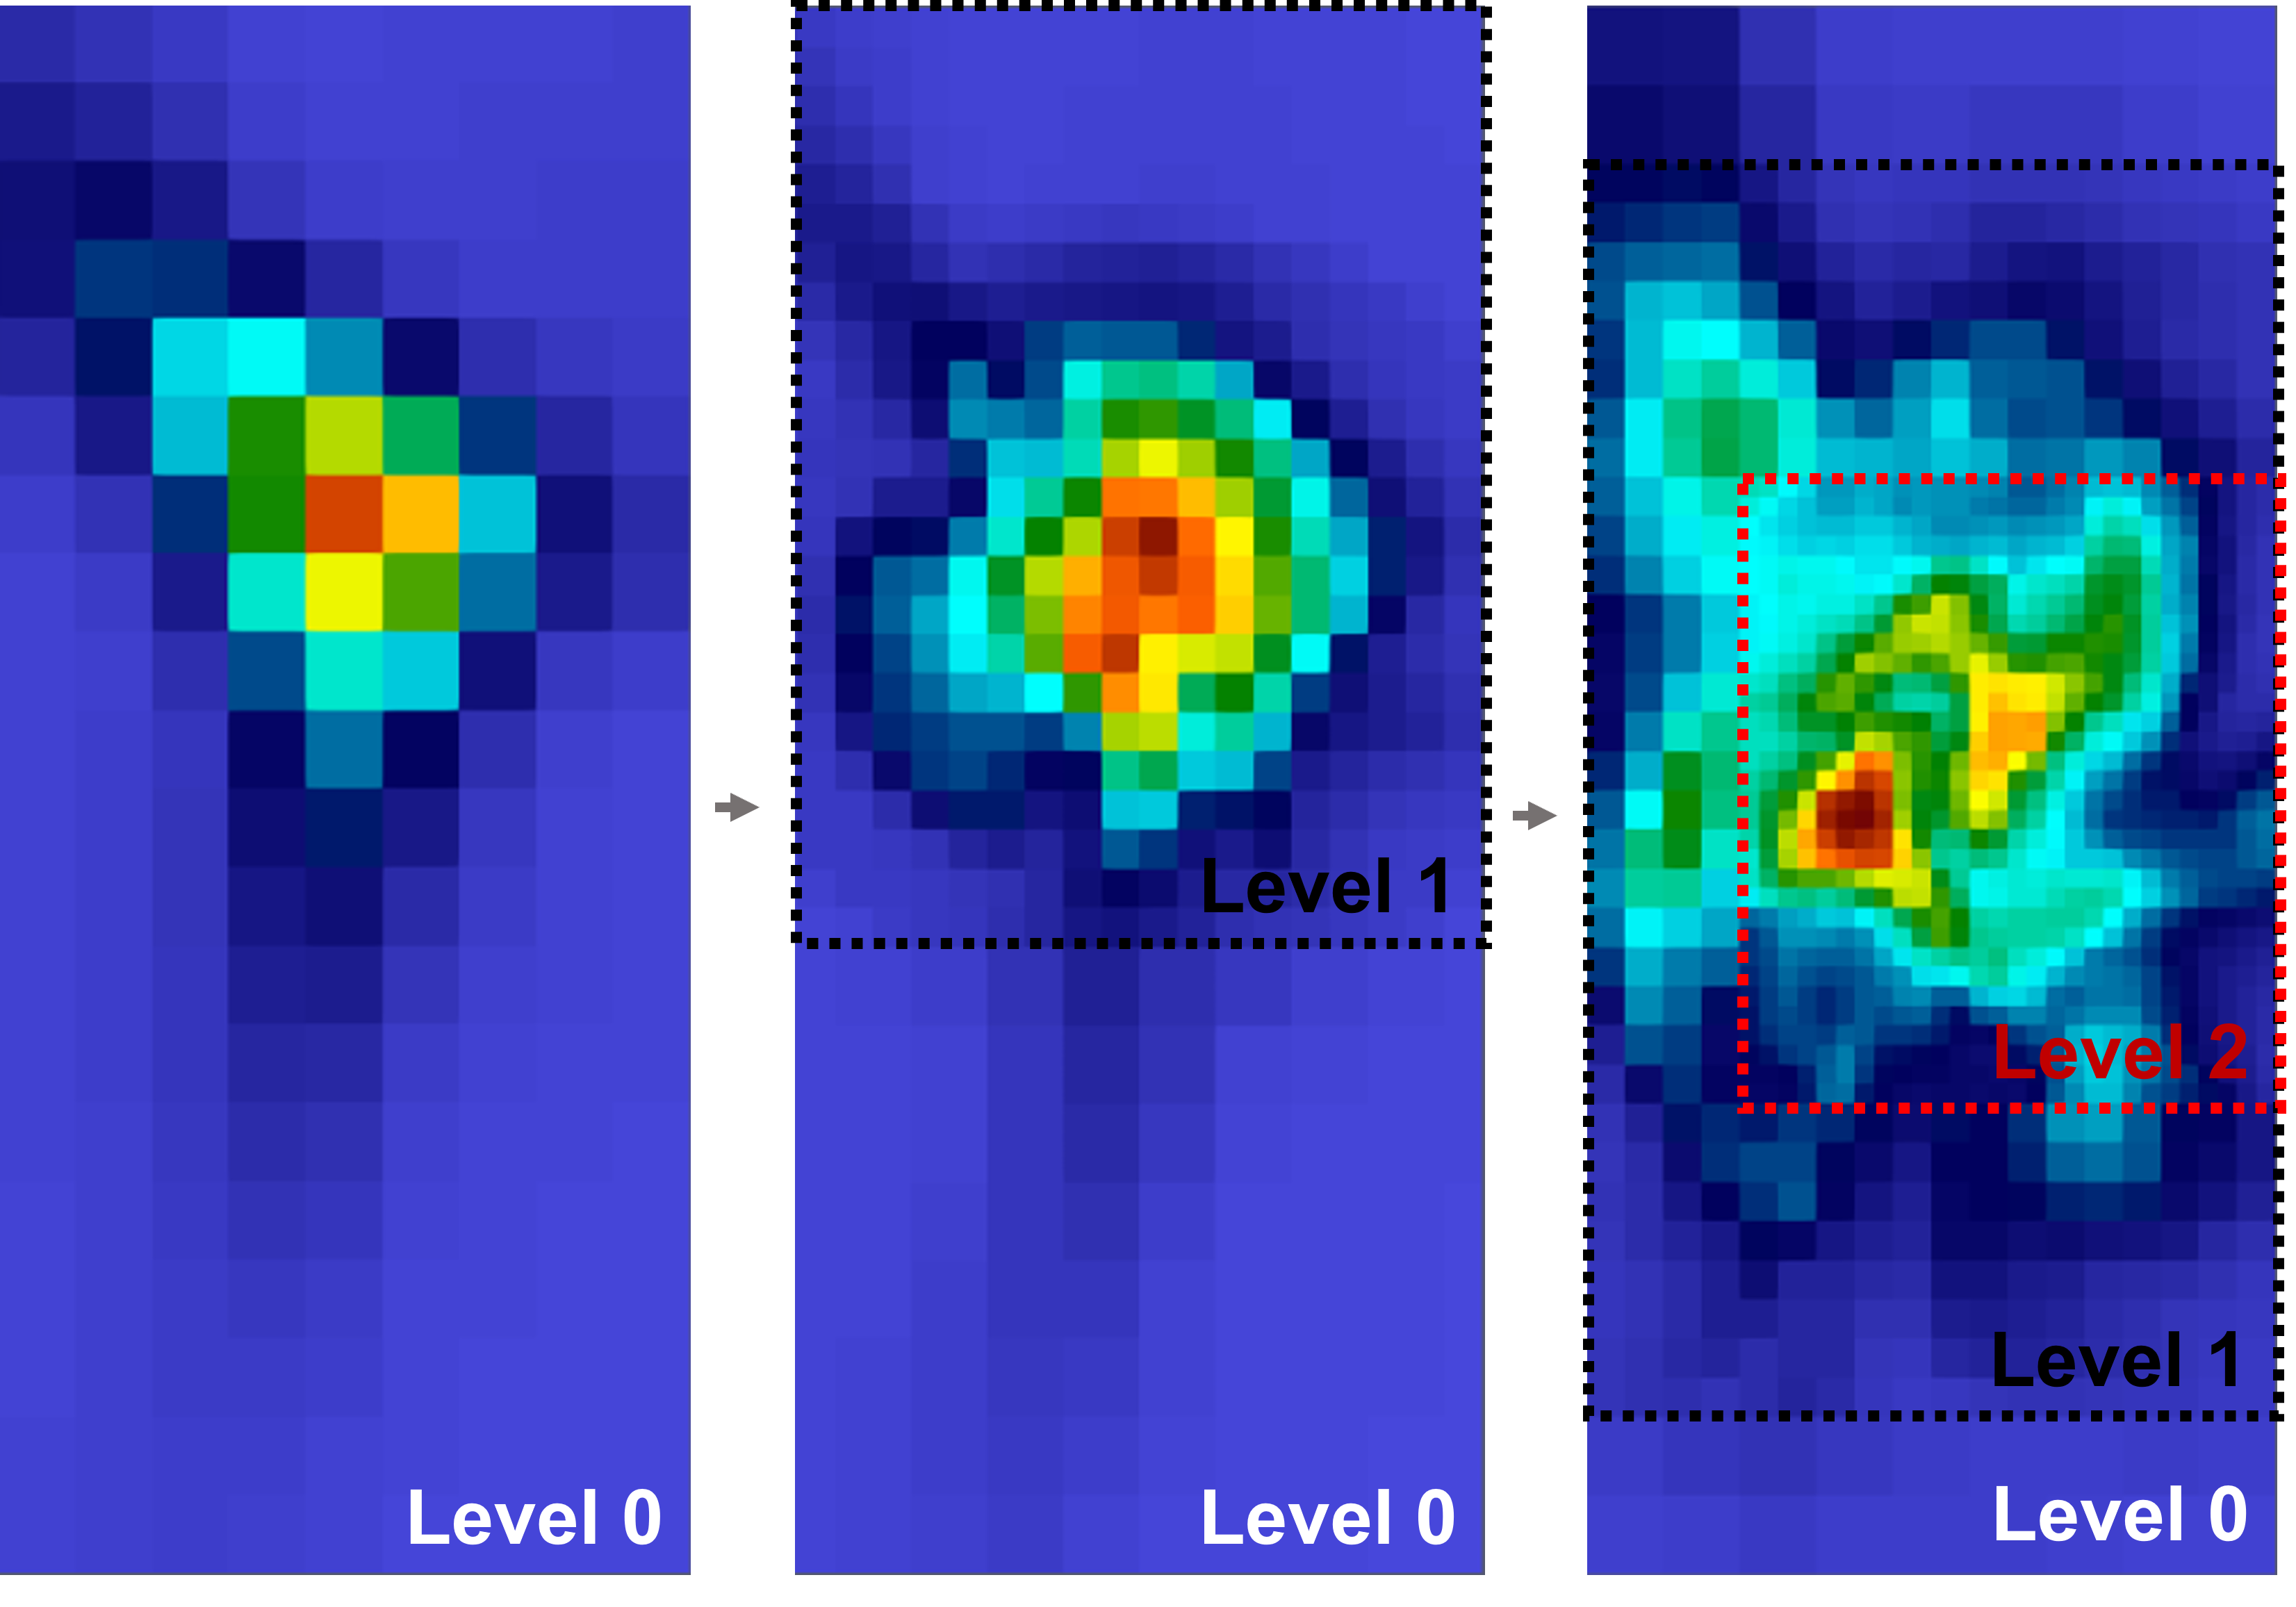
AMR is a method that customizes the precision of a solution by utilizing a non-uniform grid, thereby enabling computational and storage efficiency without sacrificing the required accuracy. In AMR applications, the mesh or spatial resolution is modified according to the refinement level needed for the simulation. This entails employing a finer mesh in areas of higher importance or interest and a coarser mesh in less significant regions. During an AMR simulation, meshes are refined based on specific refinement criteria, such as refining a block when its norm of the gradients or maximum value surpasses a threshold, as depicted in Figure 2. By dynamically adjusting the mesh resolution to meet the simulation’s demands, AMR efficiently balances computational efficiency and solution accuracy, making it a potent approach for various scientific simulations.
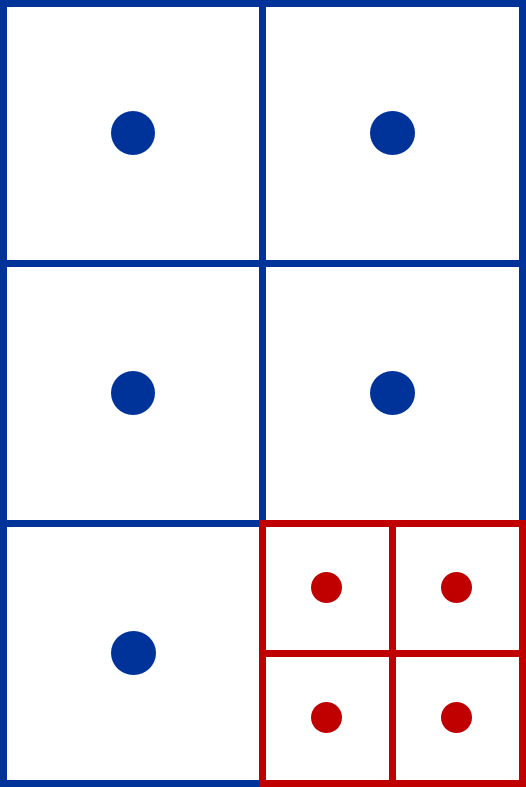
AMR application-generated data is intrinsically hierarchical, with each AMR level having different resolutions. Generally, the data for each level is stored separately, for instance, in distinct HDF5 datasets (groups). For example, Figure 3 (left) shows a basic two-level patch-based AMR dataset in the file structure, where ”0” denotes the coarse level (low resolution), and ”1” represents the fine level (high resolution). When users require AMR data for post-analysis, they typically transform the data from different levels into a uniform resolution. In the provided example, the coarse-level data would be up-sampled and merged with the fine-level data, omitting the redundant coarse data point ”0D,” as shown in Figure 3 (right). This approach can also be used to visualize AMR data without requiring specific AMR visualization tool kits.
Two primary methods exist for representing AMR data: patch-based AMR and tree-based AMR (Wang et al., 2020). The fundamental difference between these techniques lies in their treatment of data redundancy across various refinement levels. Patch-based AMR retains redundant data at the coarse level, as it stores data blocks to be refined at the next level within the current level, simplifying the computation involved in the refinement process. On the other hand, tree-based AMR arranges grids on tree leaves, eliminating redundant data across levels. However, tree-based AMR data can be more challenging for post-analysis and visualization compared to patch-based AMR data (Harel et al., 2017). In this study, we concentrate on the state-of-the-art patch-based AMR framework, AMReX.
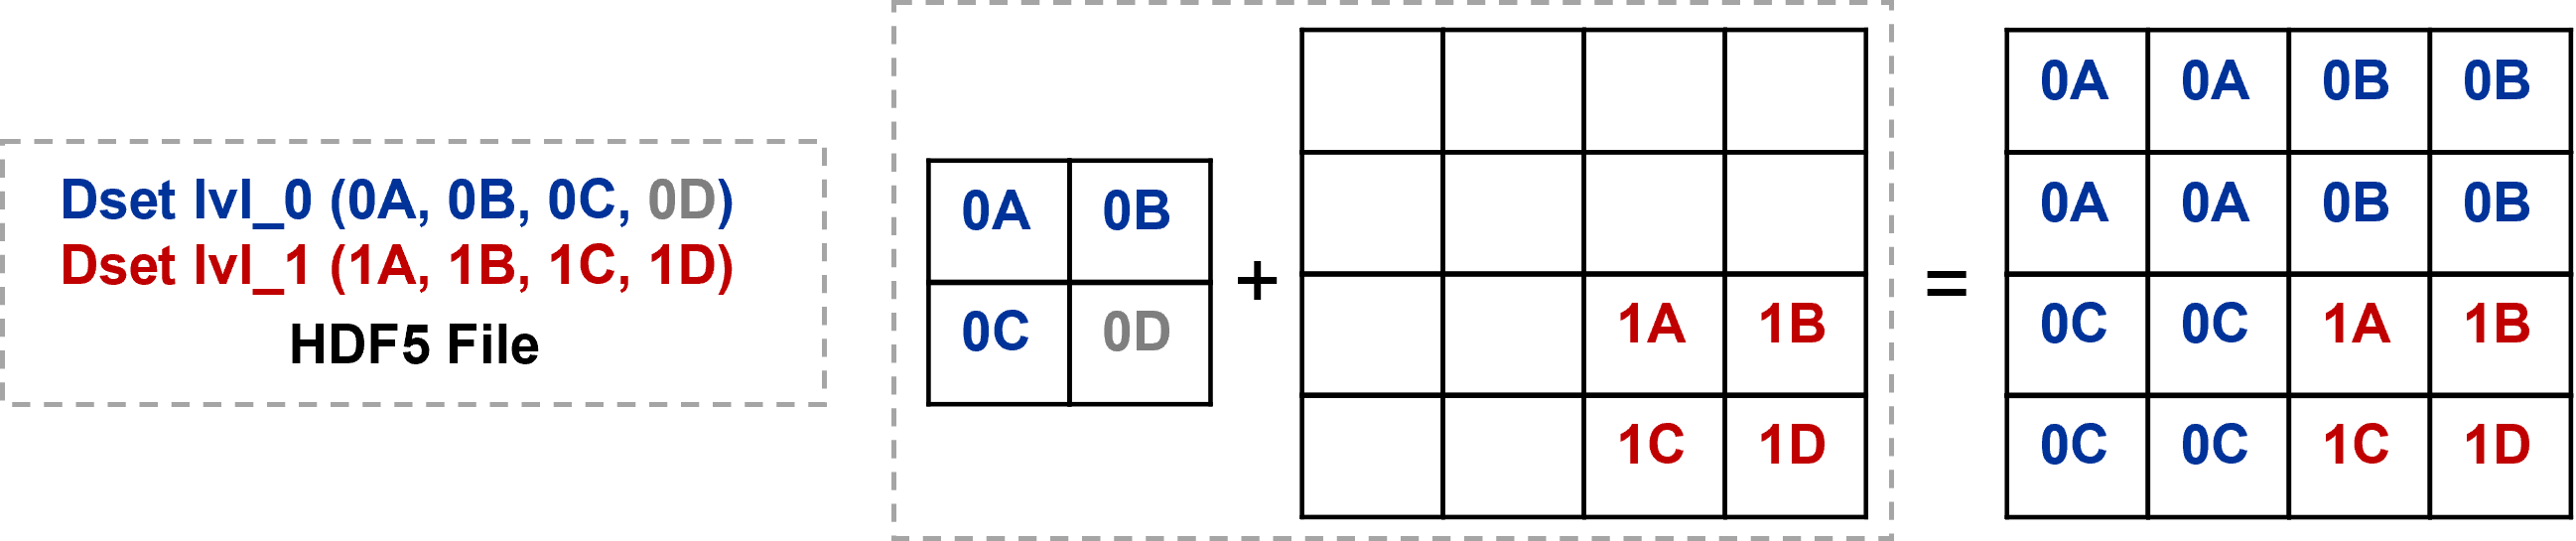
It’s important to highlight that in AMReX (patch-based AMR), the redundant data from the coarser levels is frequently not used during post-analysis and visualization, as illustrated in Figure 3 (the coarse point ”0D” is not utilized). Hence, one can omit this redundant data during the compression process to enhance the compression ratio.
2.3. Isosurface, Re-sampling and Marching cubes
An isosurface represents a three-dimensional surface consisting of points that share a constant value, such as pressure, temperature, velocity, or density, within a spatial volume. This visualization technique is commonly employed in scientific research, medical imaging, and other fields requiring the analysis of volumetric data. In iso-surface visualization, it’s standard to first (1) transition from cell-centered to vertex-centered data via re-sampling and then (2) implement the Marching Cubes algorithm.
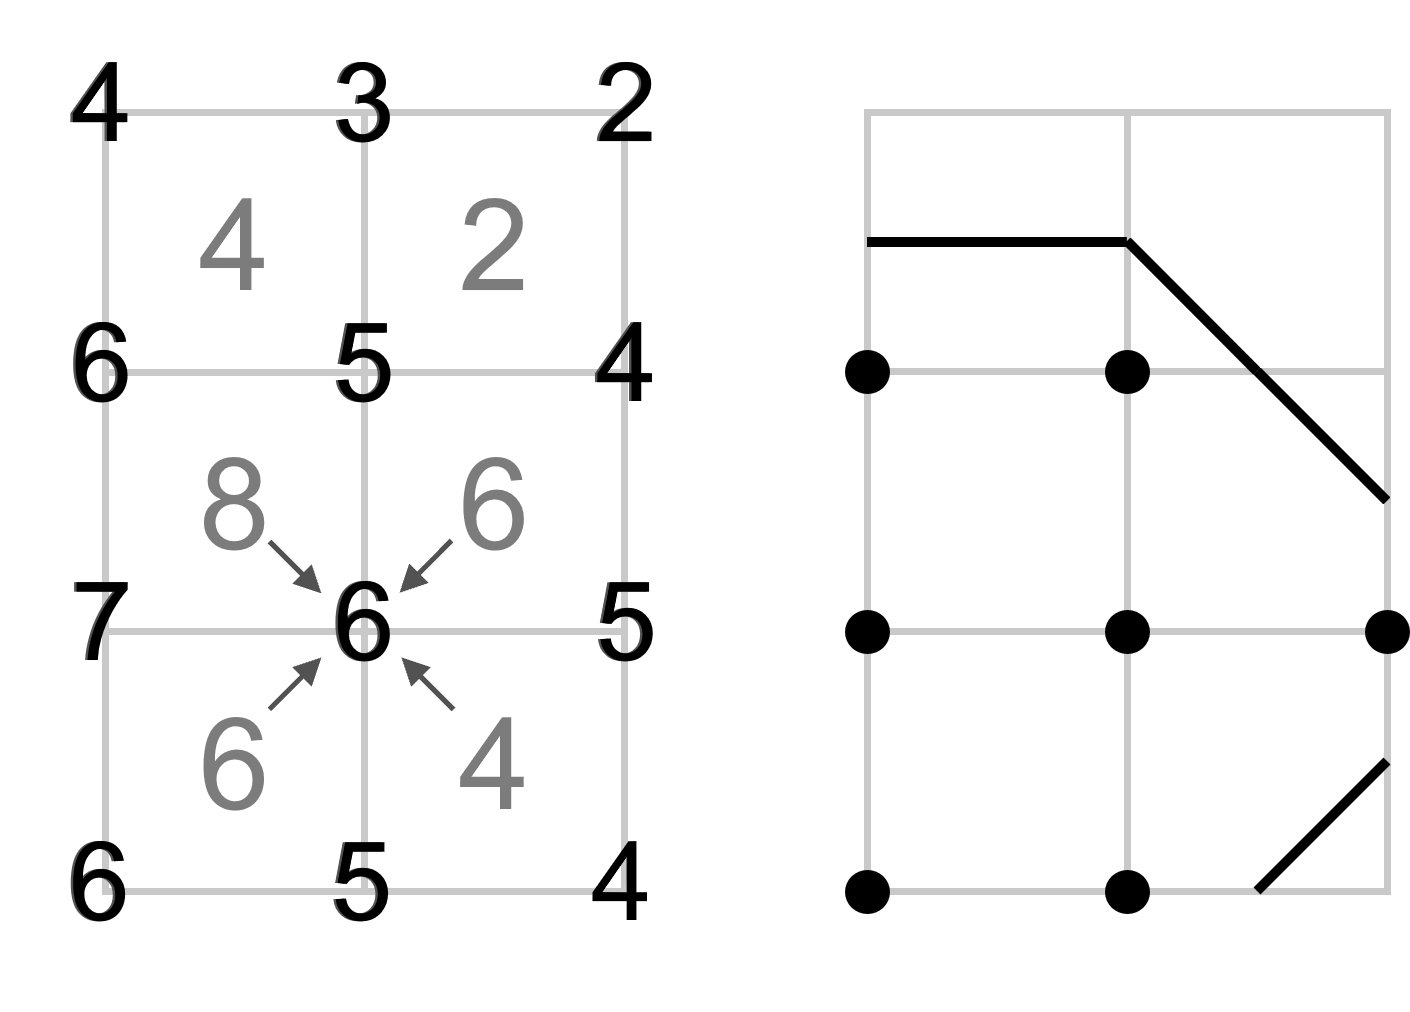
The re-sampling essentially ”diffuses” the data value from the cell to its vertex using either bi-linear or tri-linear interpolation, contingent on the data’s dimensionality. Figure 4 (left) illustrates that during this process, a vertex’s value is derived from its adjacent cell’s value. For example, the 6 in the middle column was calculated using its neighbor cell (i.e., 8, 6, 6, and 4). Post-interpolation, each dimension of the vertex data size will increase by one relative to the original cell-centered data.
The Marching Cubes algorithm (Lorensen and Cline, 1987) is a foundational method for extracting iso-surfaces or iso-contours from 3D or 2D datasets. It sequentially constructs the iso-surface or contour, examining each data cube in light of varying node configurations. Given a designated iso value, a node might either surpass or not achieve this threshold. This duality results in two possible configurations per node. Consequently, a 3D cube with 8 nodes has 256 unique configurations (i.e. ), while a 2D square with 4 nodes offers 16 (i.e. ). Figure 4 (right) provides a 2D example of an iso-contour whose value is equal to five.

2.4. Basic AMR visualization and challenge
One common challenge in AMR data visualization is the appearance of artifacts/cracks between various AMR levels when visualizing iso-surfaces, as depicted in Figure 1(a). These discrepancies arise because re-sampled vertex-centered data lead to conflicts between AMR levels, specifically, dangling nodes. This conflict results in discontinuities or cracks in the iso-surfaces or contours generated by the marching cube algorithms, as demonstrated in Figure 5 and 6 as examples.
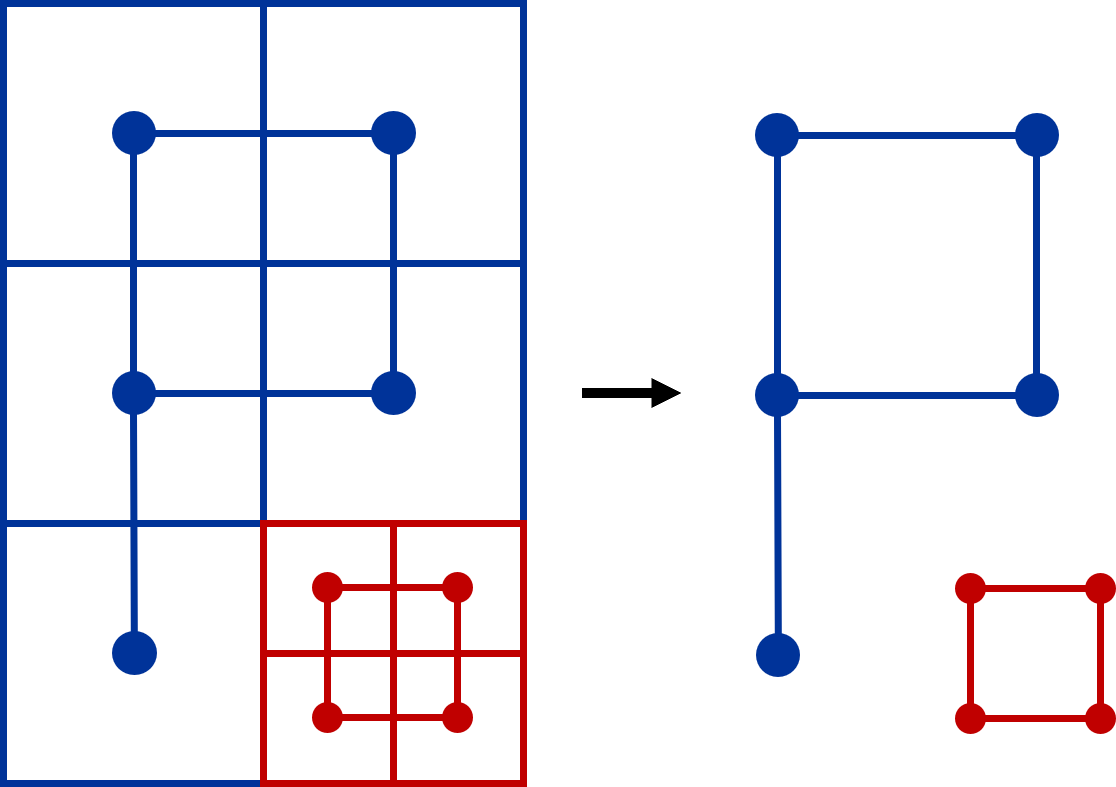
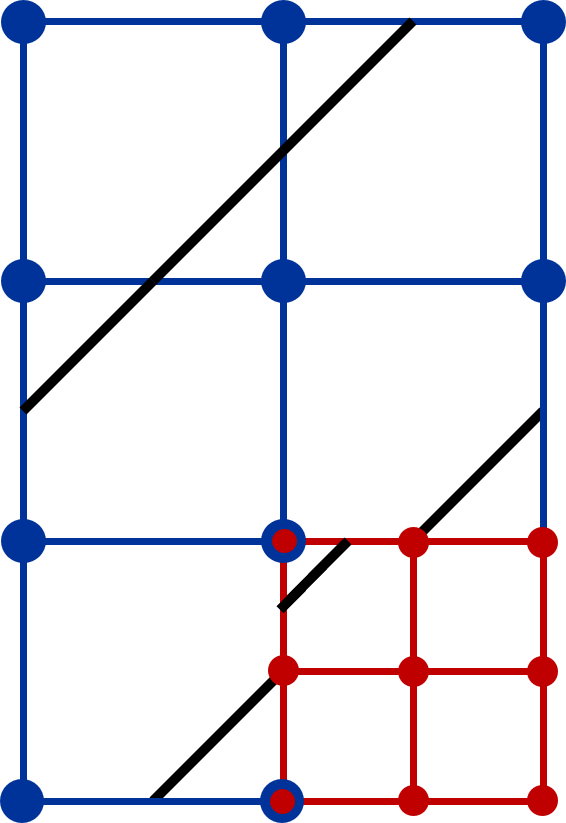
A standard approach to bridging these cracks across AMR levels is the adoption of dual-cell geometry (Weber et al., 2001). Instead of re-sampling, this method constructs a grid by connecting cell centers, as illustrated in the 2D example in Figure 7. Using the original data values, the dual method mitigates the issues of conflicts between AMR levels, like dangling nodes. However, it does introduce a new challenge: gaps between hierarchy levels, as evidenced in Figure 1(b). A 2D example of the gap is further shown on the left side of Figure 8.
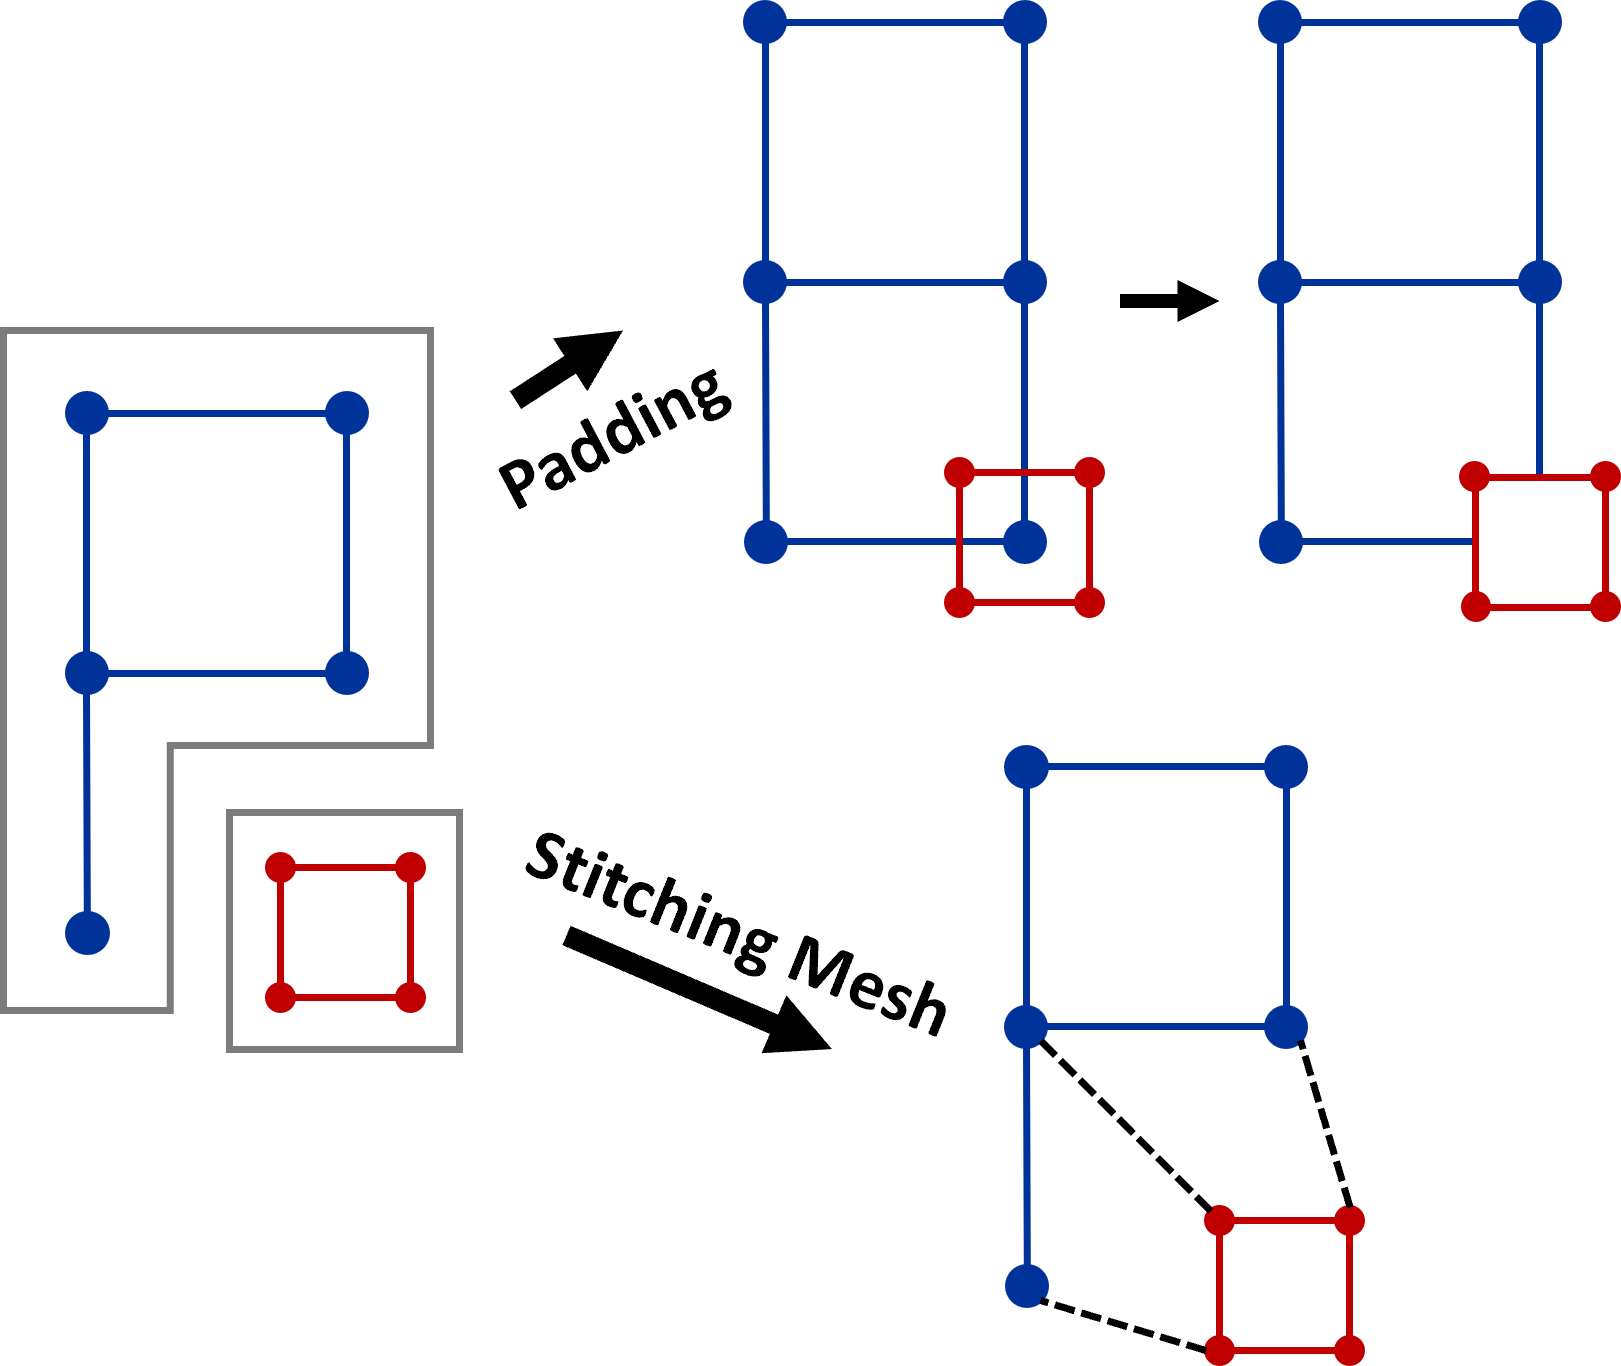
Addressing this, one might employ the stitching cells algorithm mentioned in (Weber et al., 2001), which utilizes stitching cells to construct an unstructured geometry across AMR levels, effectively filling the gap. This is demonstrated in the 2D sample in the lower part of Figure 8. An alternative solution capitalizes on the existing overlap between AMR levels, especially in patch-based AMR as discussed in Section 2.2. The redundant coarse data, such as the 0D data point illustrated in Figure 3, can be used to bridge the gap as shown in the upper part of Figure 8. With either the stitching cells approach or the incorporation of redundant coarse data, gaps between AMR levels are eliminated, as seen in Figure 1(c). Importantly, both methods will fix the cracks that appear in Figure 1(a) with re-sampling.
3. Methodology
3.1. Experiment overview
In this study, we concentrate on the iso-surface visualization of compressed AMR data, as it poses greater challenges compared to other visualization techniques, such as volume rendering and slicing. Additionally, iso-surfaces are highly sensitive to errors and can be significantly affected by compression errors. This sensitivity serves as a useful lens through which we can gain a deeper understanding of the impact of compression on the data.
We conducted the visualization of the AMR iso-surface on data compressed using two distinct compression algorithms. Additionally, we utilized two different AMR applications, details of which will be elaborated in the subsequent paragraphs. Furthermore, we employed two different AMR iso-surface visualization techniques: the conventional resampling method coupled with marching cubes, and the advanced dual-cell method, also paired with marching cubes. This latter method is capable of fixing the cracks between different levels.
Except for the visualization quality, we will report quantitative metrics including the compression ratio, structural similarity index measure (SSIM), and peak signal-to-noise ratio (PSNR).
3.2. AMR applications
| Runs | #AMR Levels |
|
|
||||
|---|---|---|---|---|---|---|---|
| WarpX | 2 | 128×128×1024, 256×256×2048 | 91.4%, 8.6% | ||||
| Nyx | 2 | 256×256×256, 512×512×512 | 59.3%, 40.7% |

Our evaluation primarily focuses on two AMR applications developed by the AMReX framework (Zhang et al., 2019): Nyx cosmology simulation (NYX simulation, 2019) and the WarpX (Fedeli et al., 2022) electromagnetic and electrostatic Particle-In-Cell (PIC) simulation.
Nyx is a cutting-edge cosmology code that employs AMReX and combines compressible hydrodynamic equations on a grid with a particle representation of dark matter. Nyx generates six fields, including baryon density, dark matter density, temperature, and velocities in the , , and directions. WarpX is a highly parallel and optimized code that utilizes AMReX, runs on GPUs and multi-core CPUs, and features load-balancing capabilities. WarpX can scale up to the world’s largest supercomputer and was the recipient of the 2022 ACM Gordon Bell Prize (Oak Ridge Leadership Computing Facility, 2023).
We chose these two applications because the data generated by them is very different and thus more representative. Data generated by WarpX is more smooth while the data produced by Nyx appears irregular. The specifics of our test dataset are presented in Table 1. In the WarpX application, the grid sizes across levels transition from coarse to fine, featuring dimensions of and , and corresponding data densities of 91.4% and 8.6%, respectively. Conversely, for the Nyx application, the grid sizes are and , associated with data densities of 40.7% and 59.3%, respectively.
3.3. Compression Algorithms
This work is based on two distinct SZ compression algorithms, namely the SZ-L/R, which employs the Lorenzo and linear regression predictors as delineated in (Liang et al., 2018), and the SZ-Interp, which utilizes the spline interpolation approach as discussed in (Zhao et al., 2021), as mentioned in Section 2. The SZ-L/R algorithm commences by partitioning the entire input data into 666 blocks, followed by the independent application of either the Lorenzo predictor or high-dimensional linear regression on each individual block. Conversely, the SZ-Interp algorithm conducts interpolation across all three dimensions of the entire dataset.
A key distinction between SZ-L/R and SZ-Interp is that the former is block-based whereas the latter is global. Specifically, the SZ-L/R algorithm divides data into blocks prior to compression, whereas the SZ-Interp algorithm applies global interpolation across the entire dataset. This leads to a notable difference in terms of visualization; the block-based nature of SZ-L/R tends to produce ”block-wise” artifacts, as opposed to SZ-Interp. However, by prioritizing local features via block-wise prediction, the SZ-L/R algorithm demonstrates better performance on unsmooth and irregular datasets like Nyx, which will be demonstrated in detail in Section 4.
Additionally, the block-based structure of SZ-L/R confers advantages in terms of cache locality and facilitates random access support. This means that it is possible to partially visualize the data as needed, which helps conserve time and memory footprint since there is no data dependency between individual blocks.
4. Experiment Results
4.1. WarpX
| Application | WarpX | Nyx | |||||
| Error Bound | 1E-04 | 1E-03 | 1E-02 | 1E-04 | 1E-03 | 1E-02 | |
| SZ-L/R | CR | 23.7 | 31.4 | 42.3 | 14.6 | 28.6 | 61.9 |
| PSNR | 96.34 | 77.72 | 60.70 | 102.51 | 90.33 | 81.09 | |
| SSIM | 0.999 999 8 | 0.999 986 | 0.999 60 | 0.999 999 9 | 0.999 998 8 | 0.999 989 | |
| R-SSIM | 2.20E-07 | 1.38E-05 | 4.01E-4 | 6.87E-08 | 1.20E-06 | 1.14E-05 | |
| SZ-Itp | CR | 32.4 | 45.1 | 52.6 | 15.8 | 34.7 | 77.9 |
| PSNR | 96.57 | 78.24 | 60.38 | 103.11 | 86.63 | 72.94 | |
| SSIM | 0.999 999 5 | 0.999 955 | 0.997 23 | 0.999 999 9 | 0.999 993 7 | 0.999 722 | |
| R-SSIM | 5.19E-07 | 4.50E-05 | 2.77E-03 | 7.21E-08 | 6.25E-06 | 2.78E-04 | |
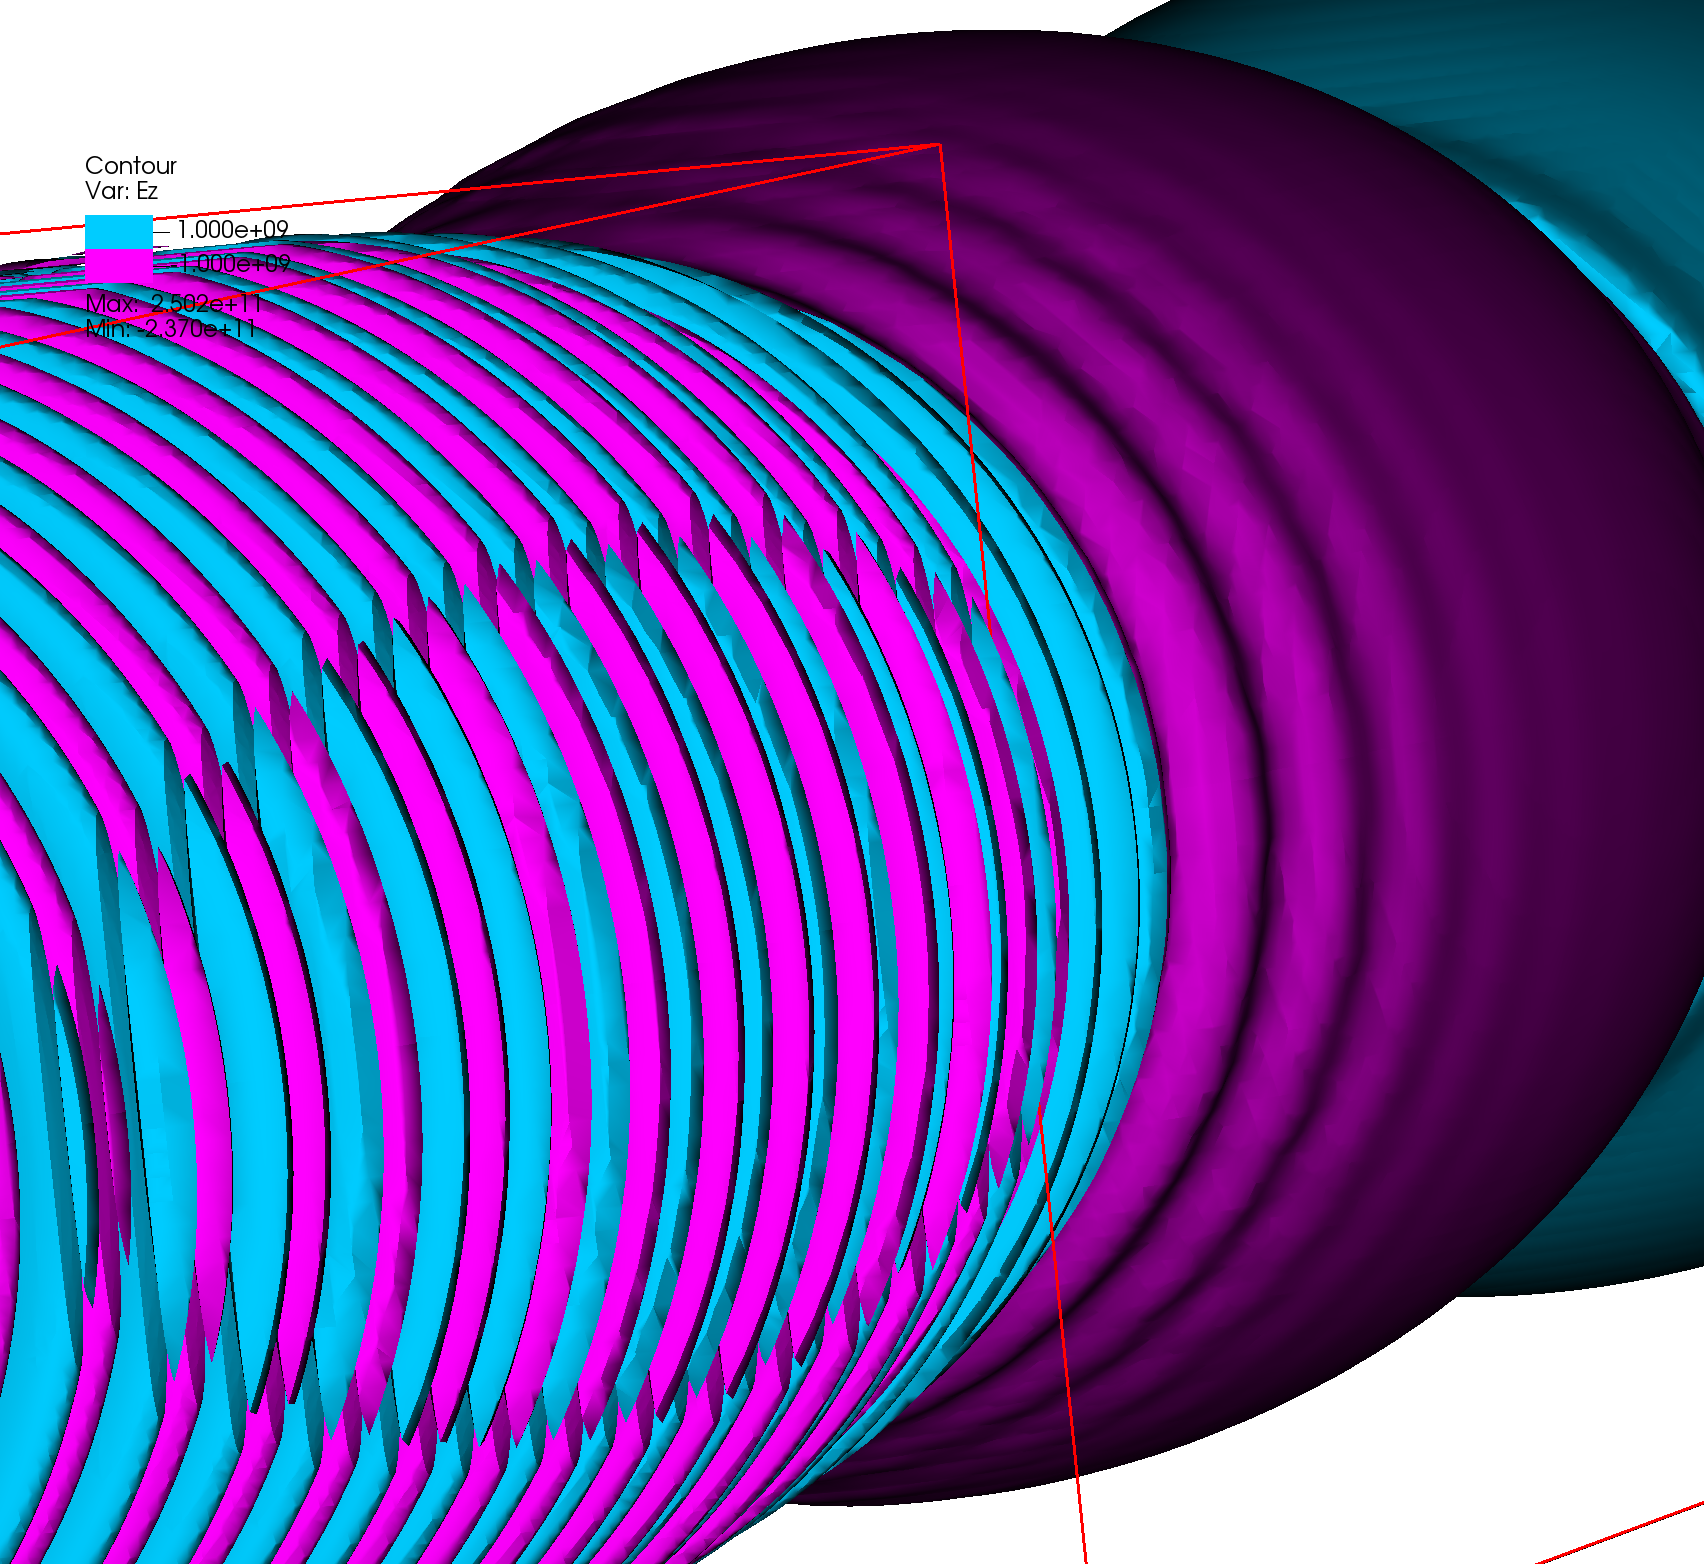
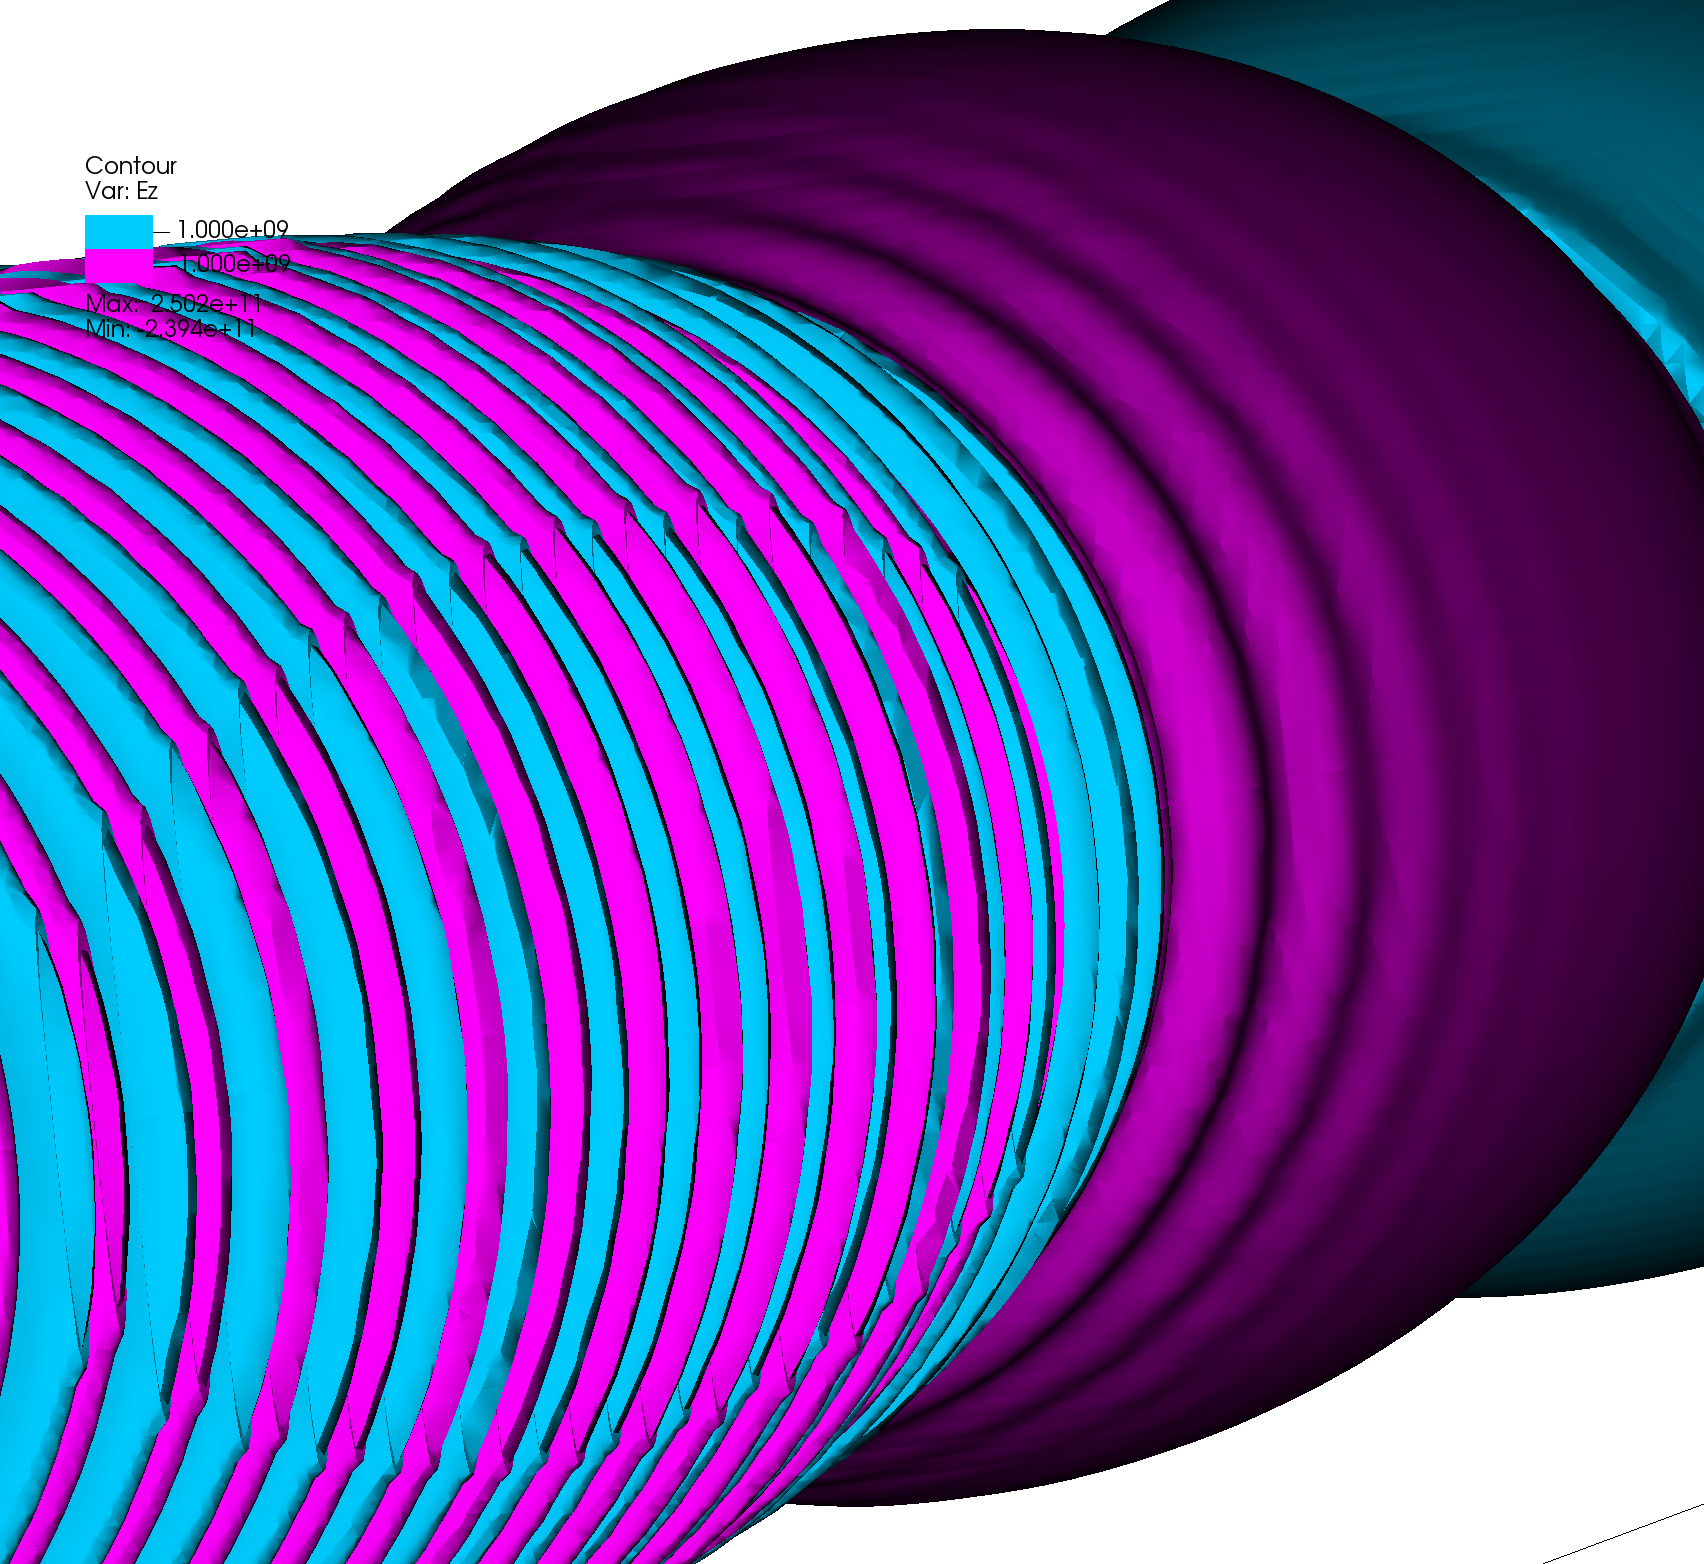
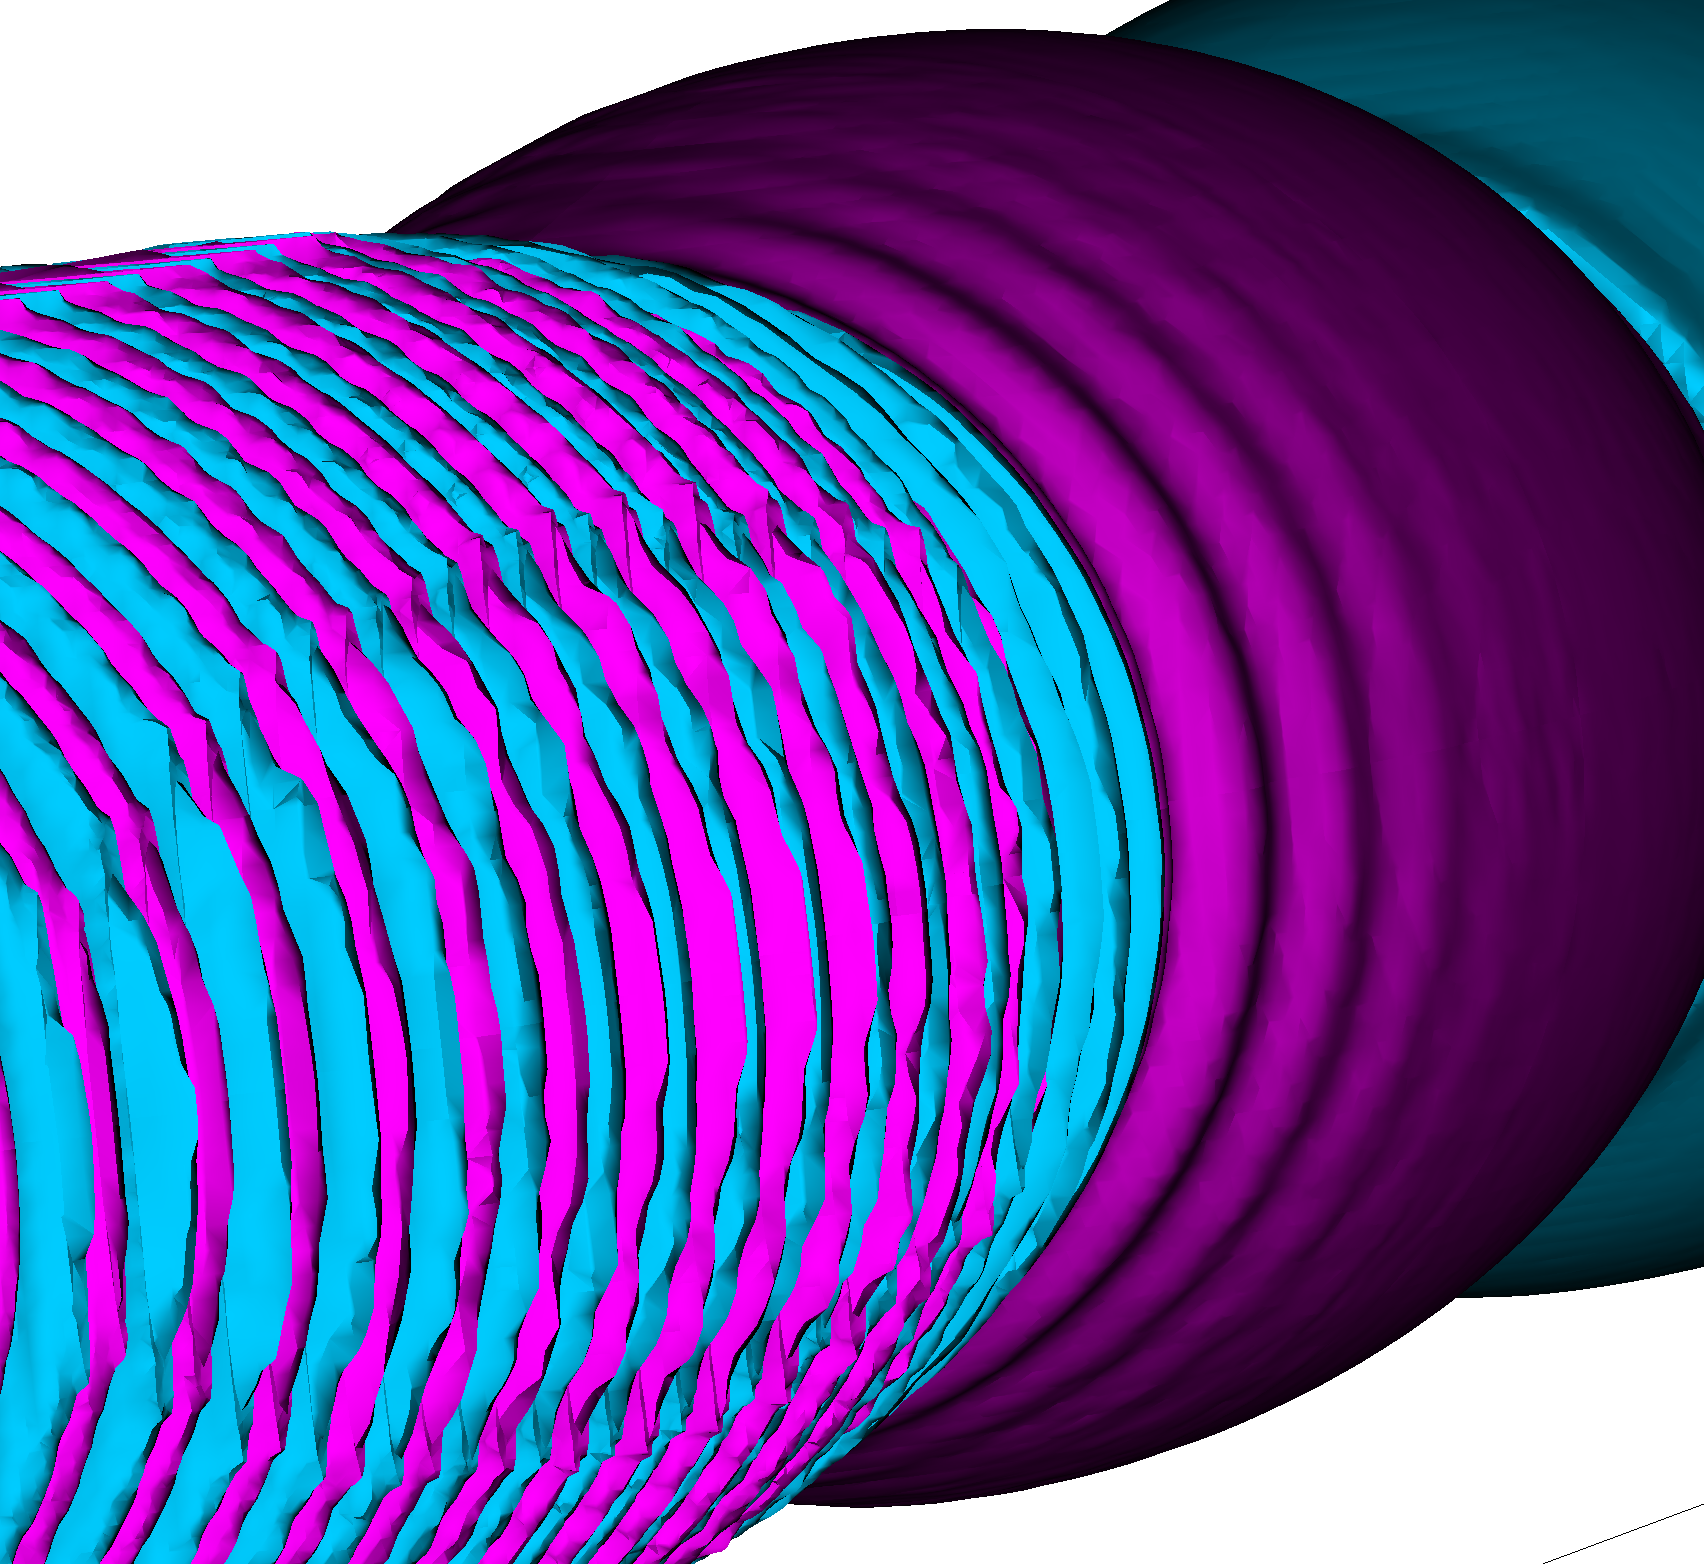
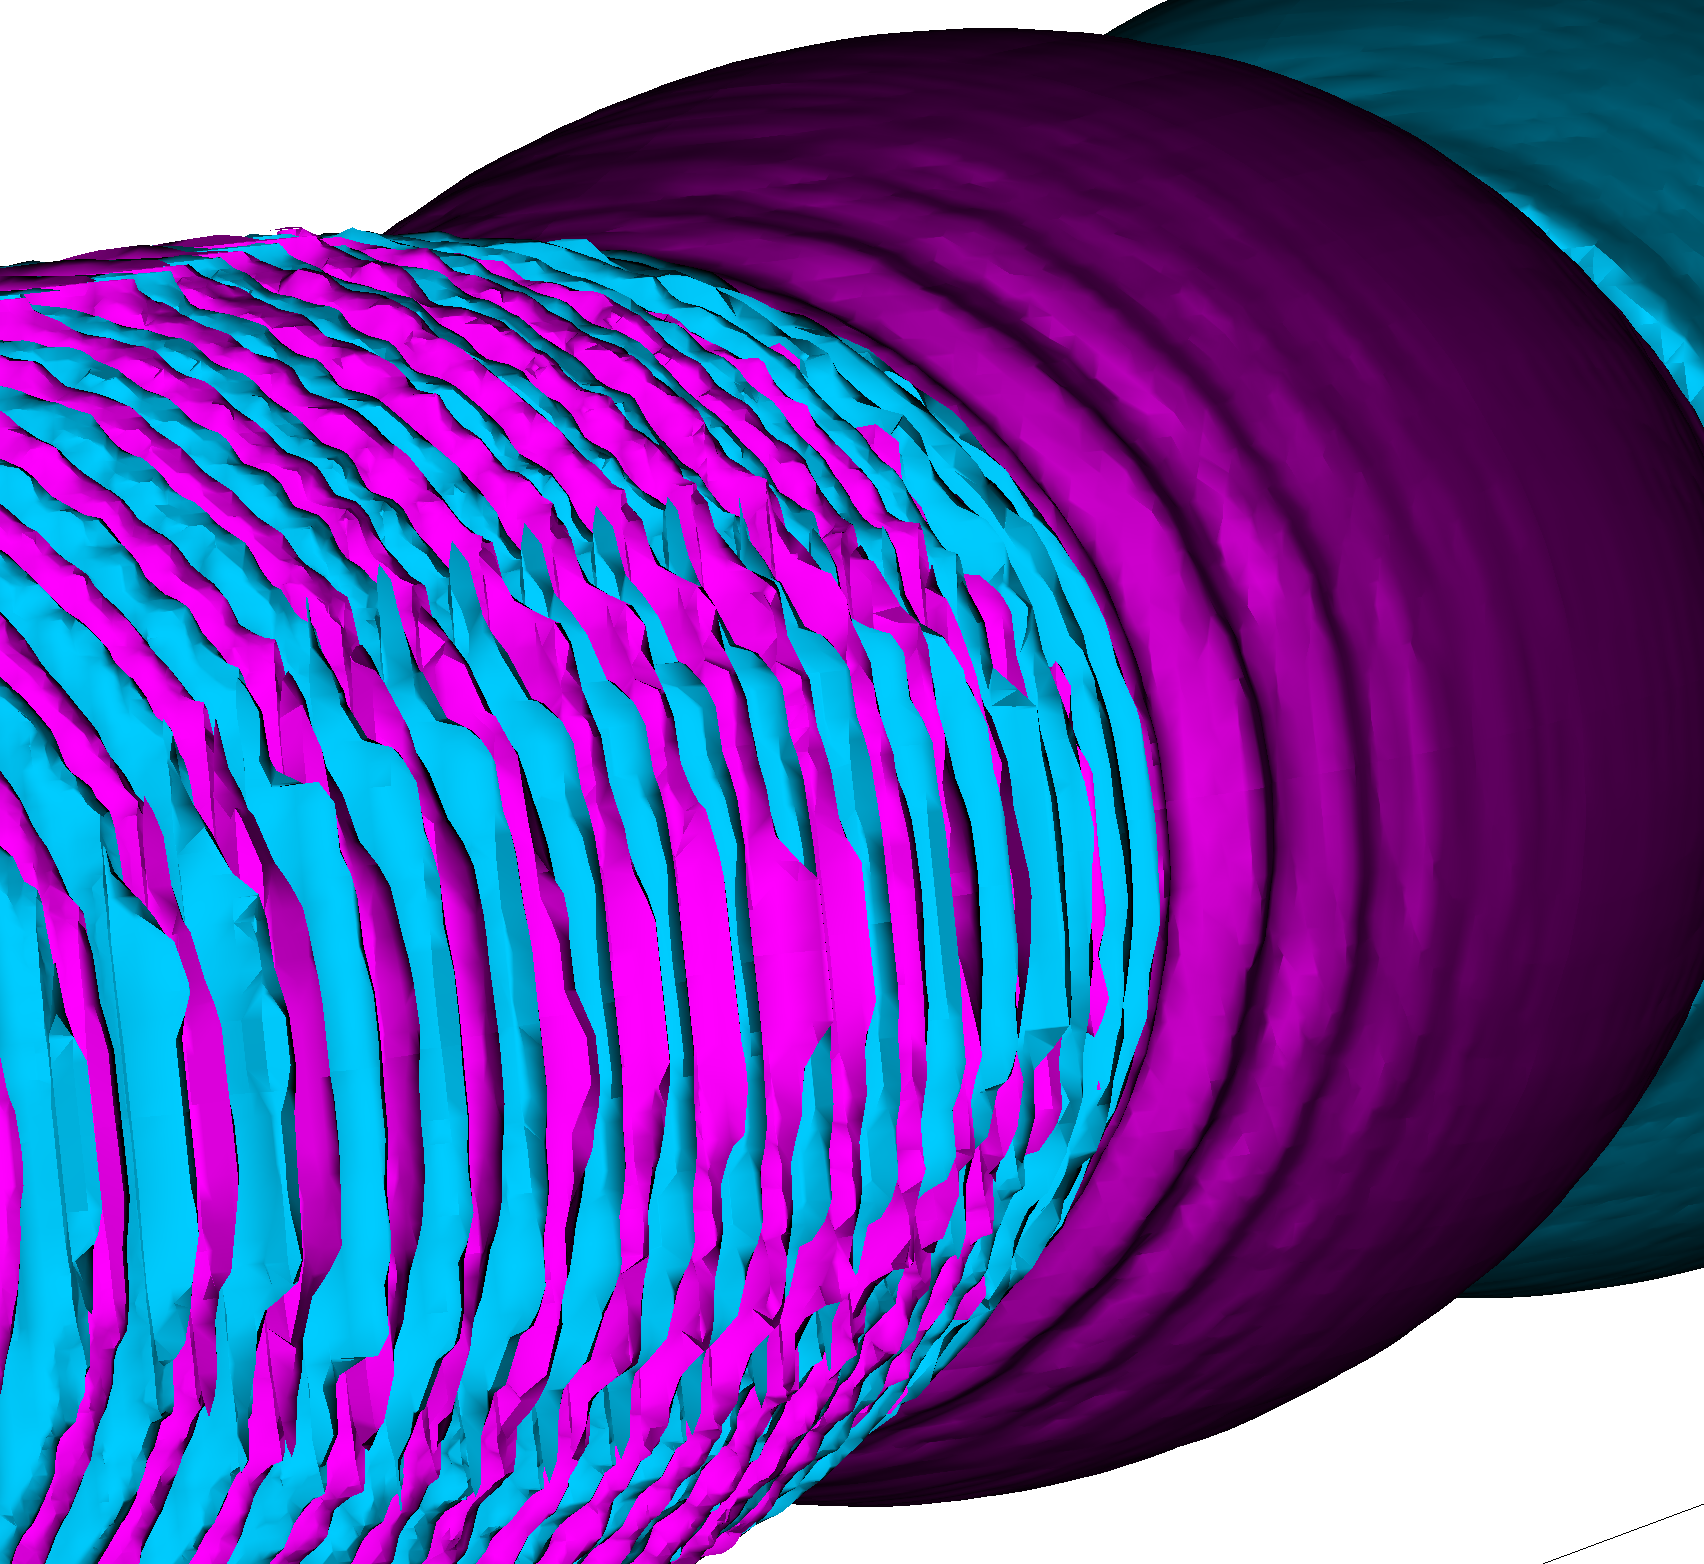
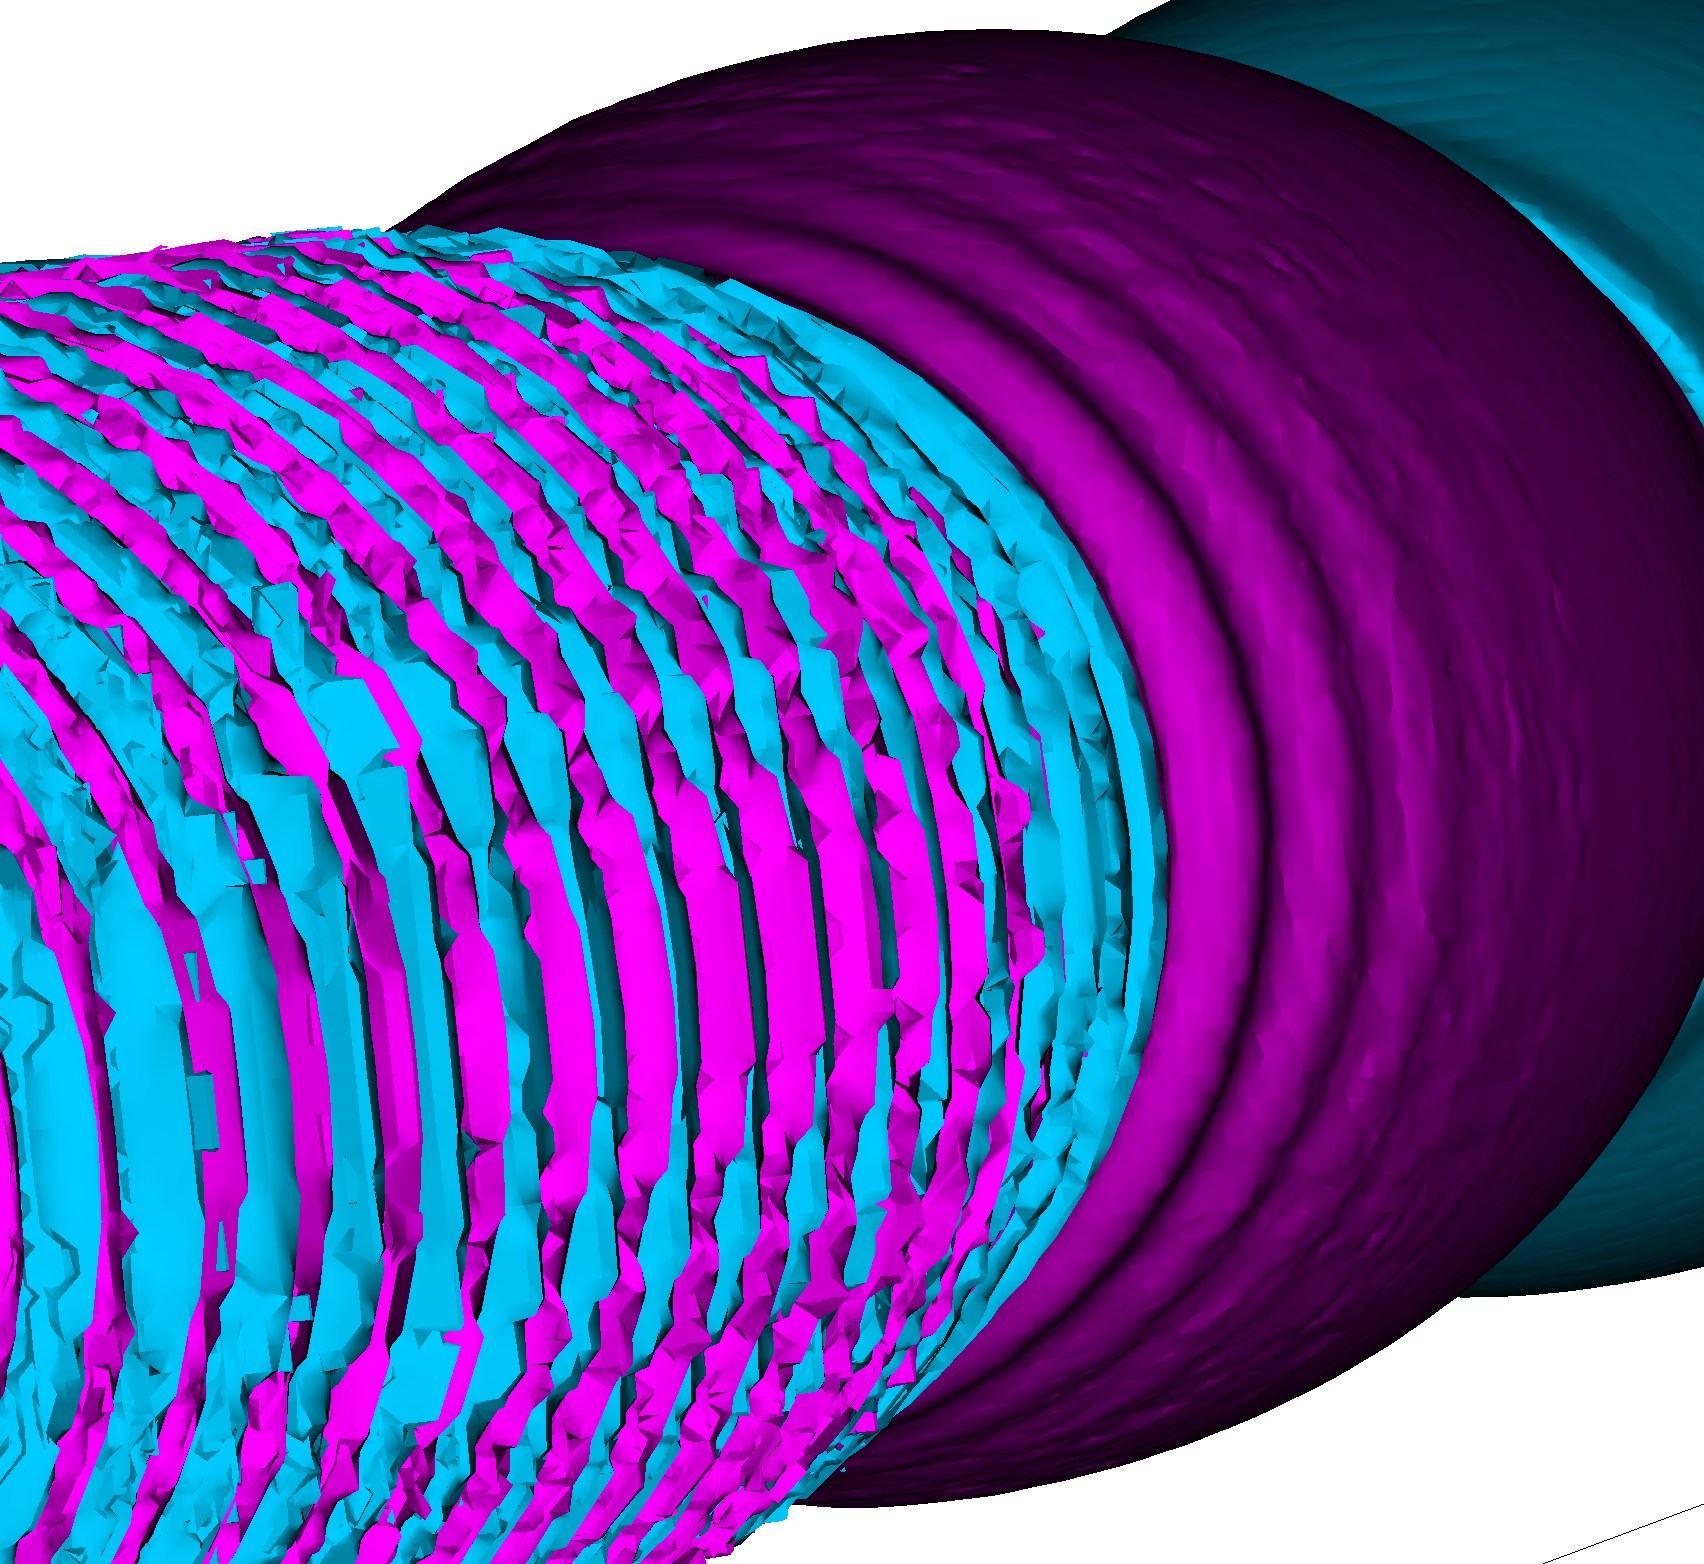
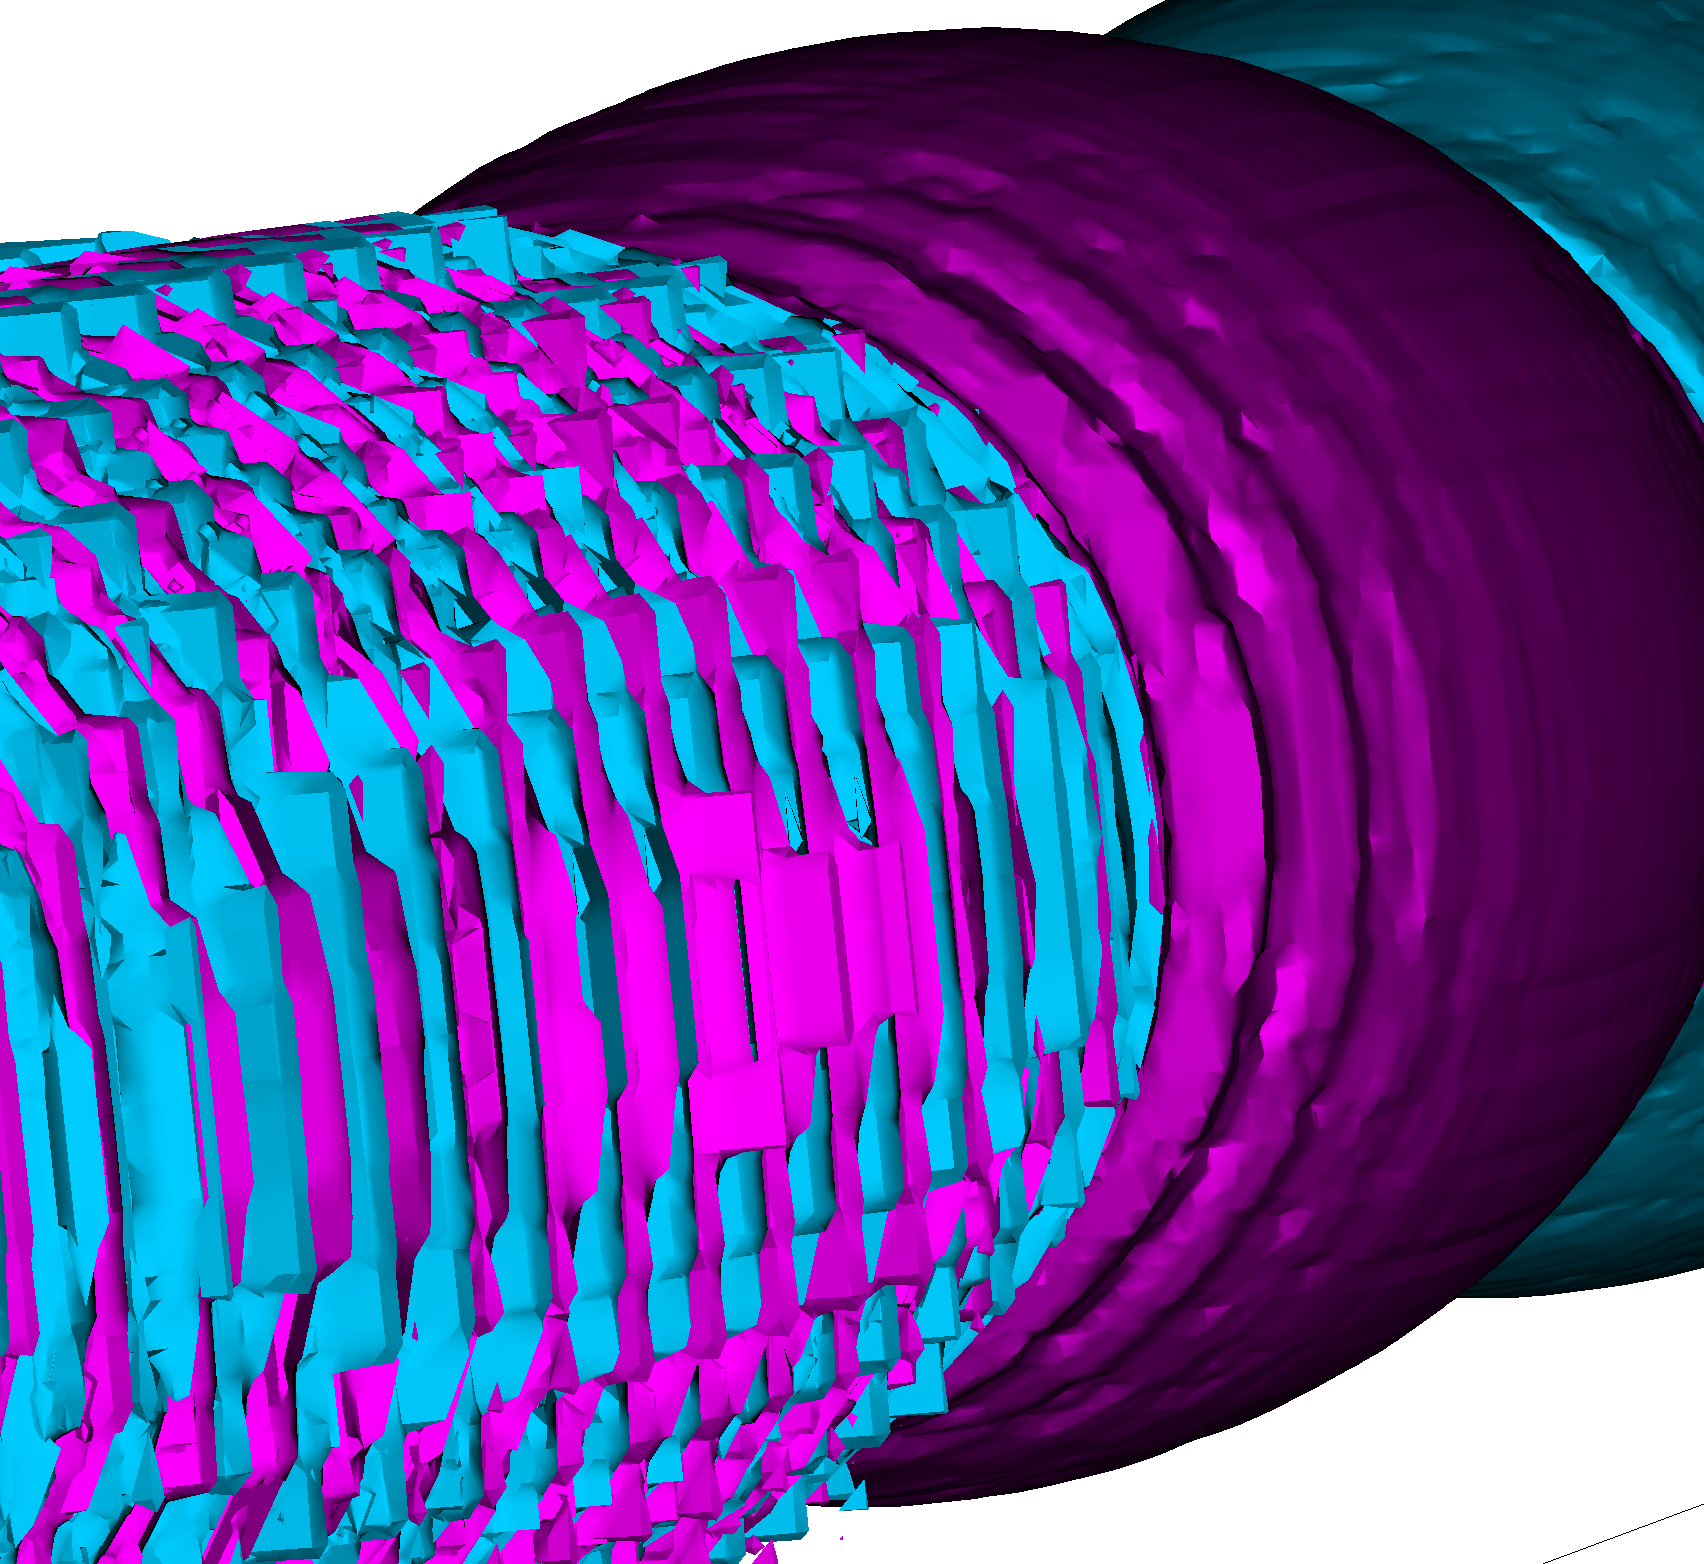
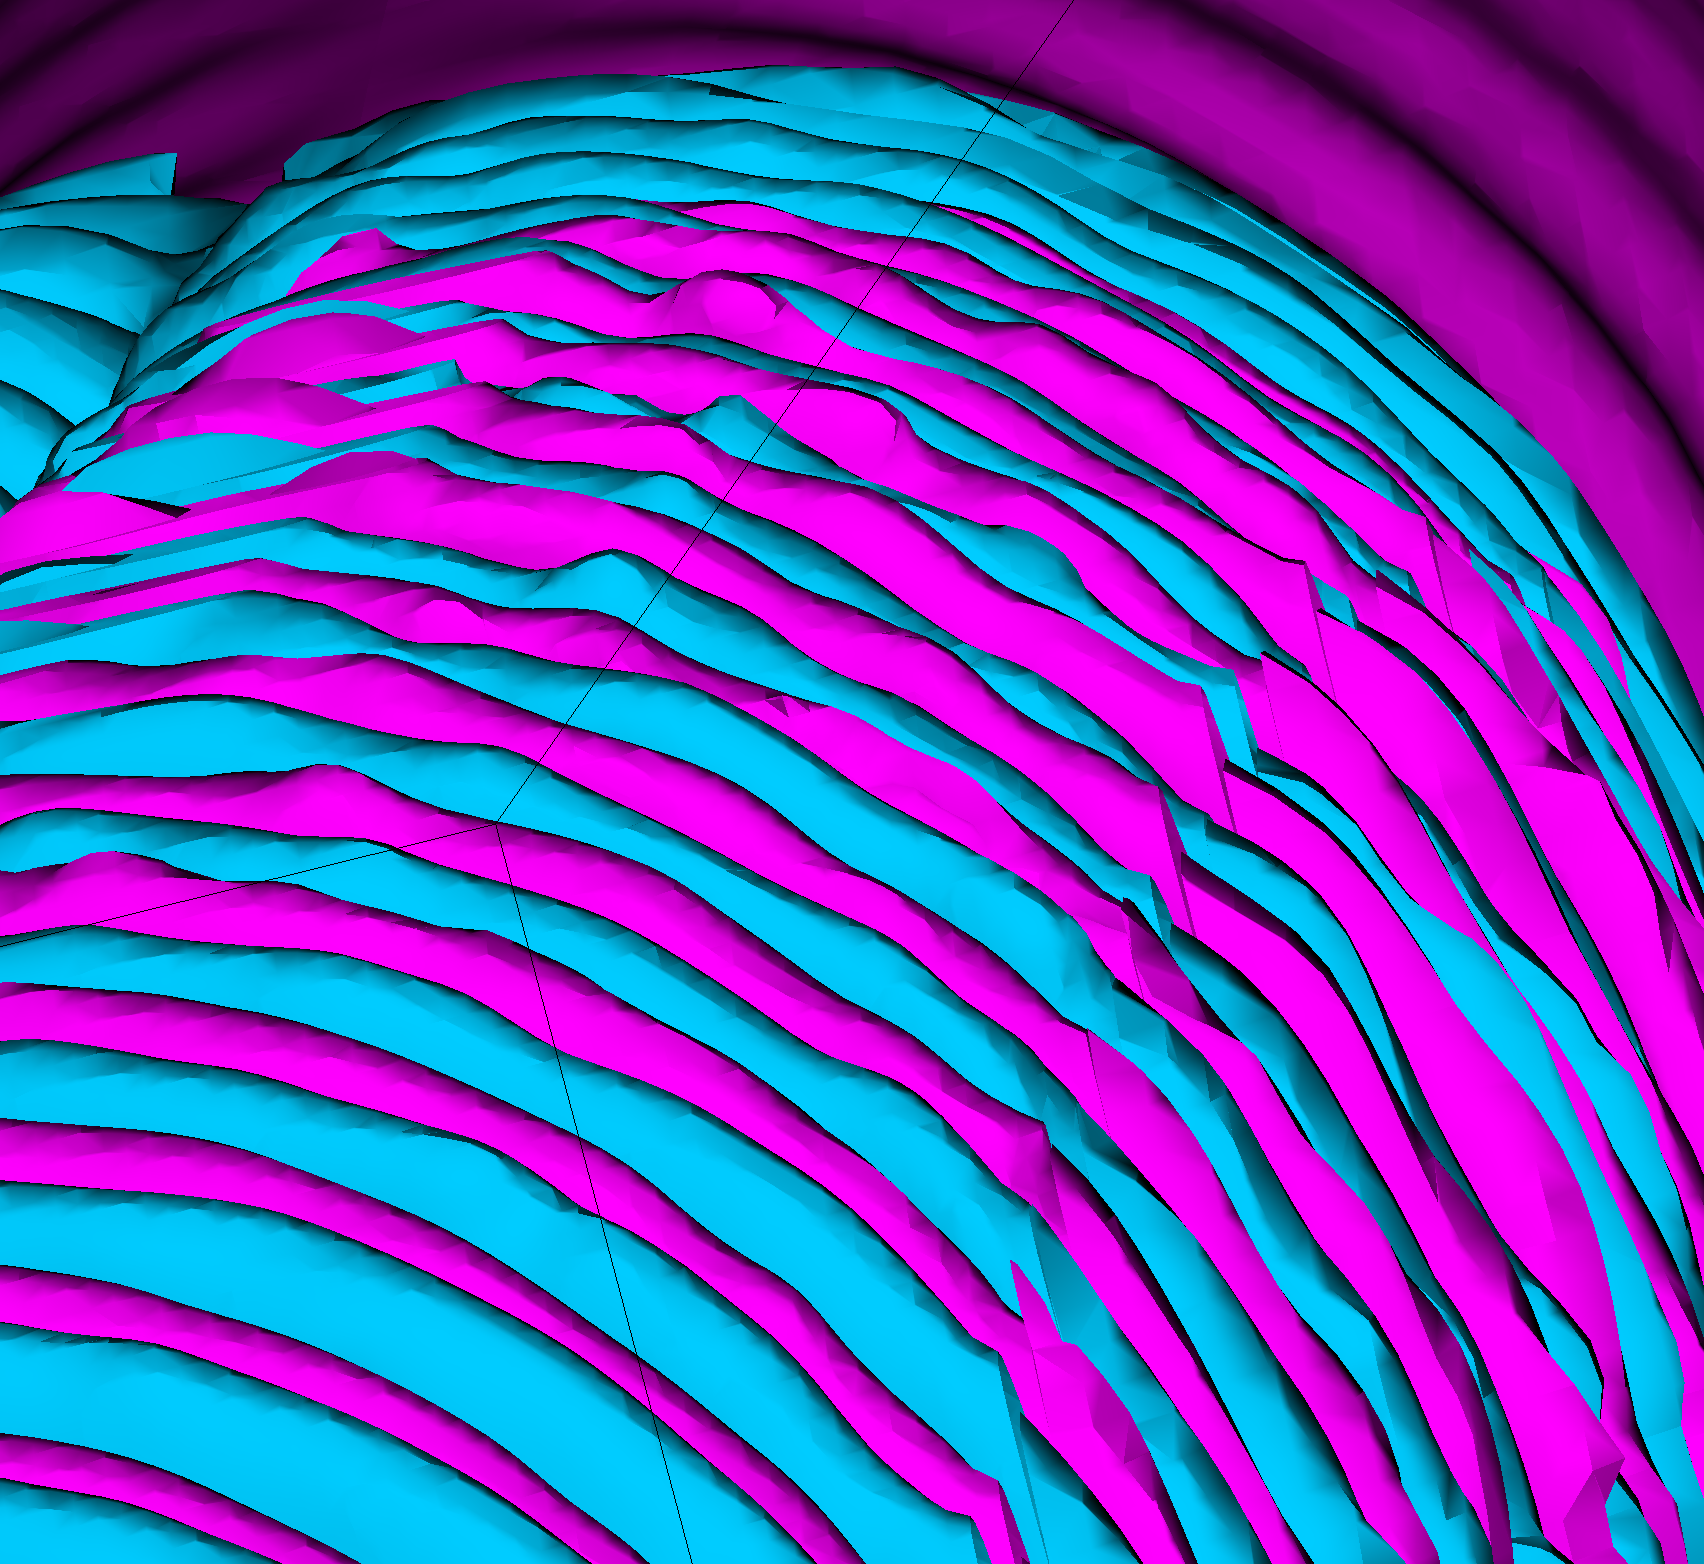
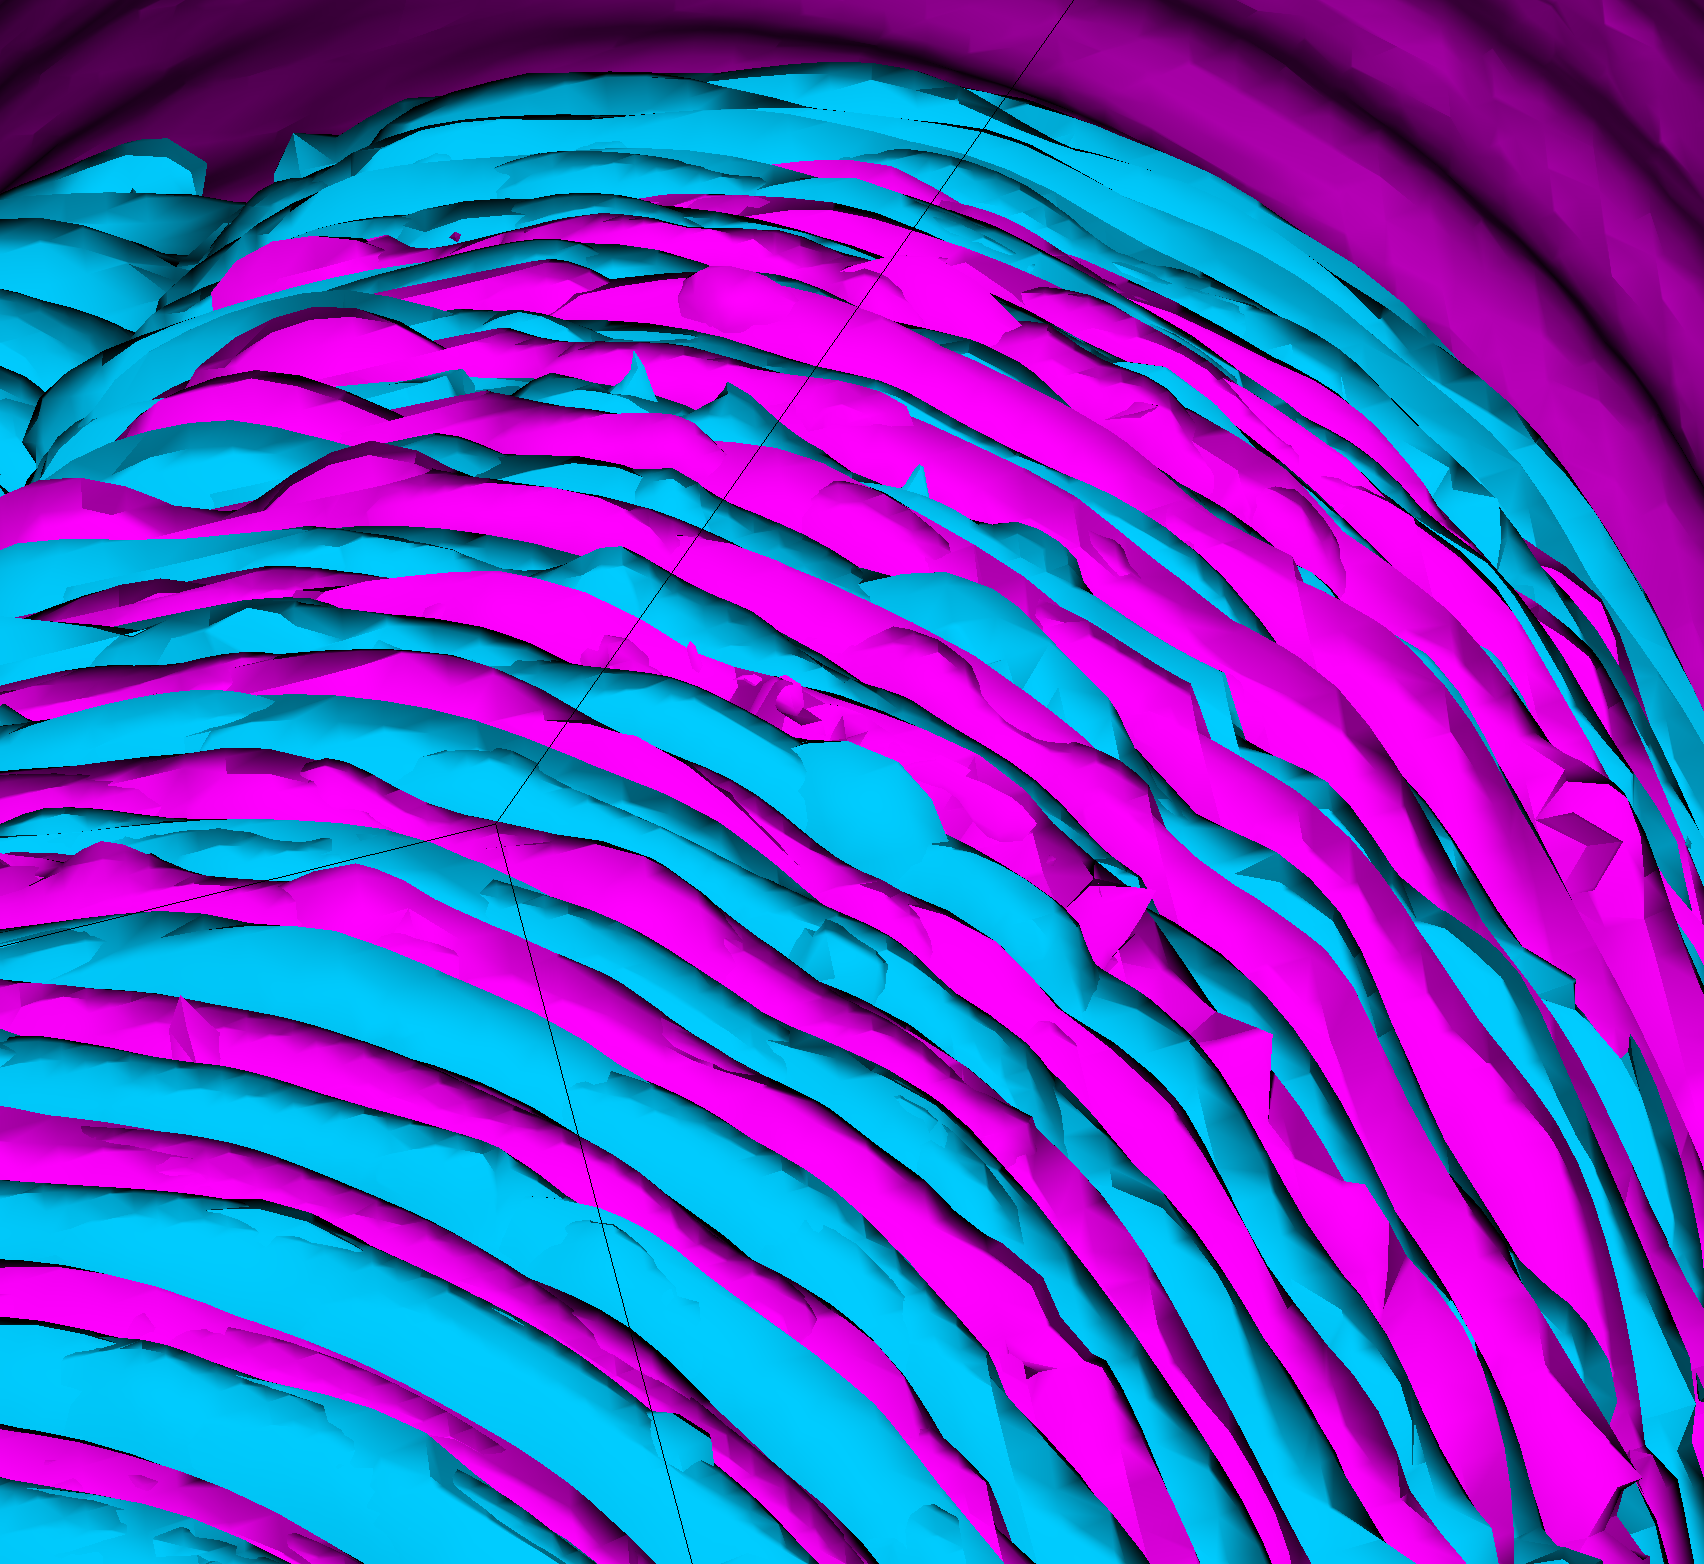
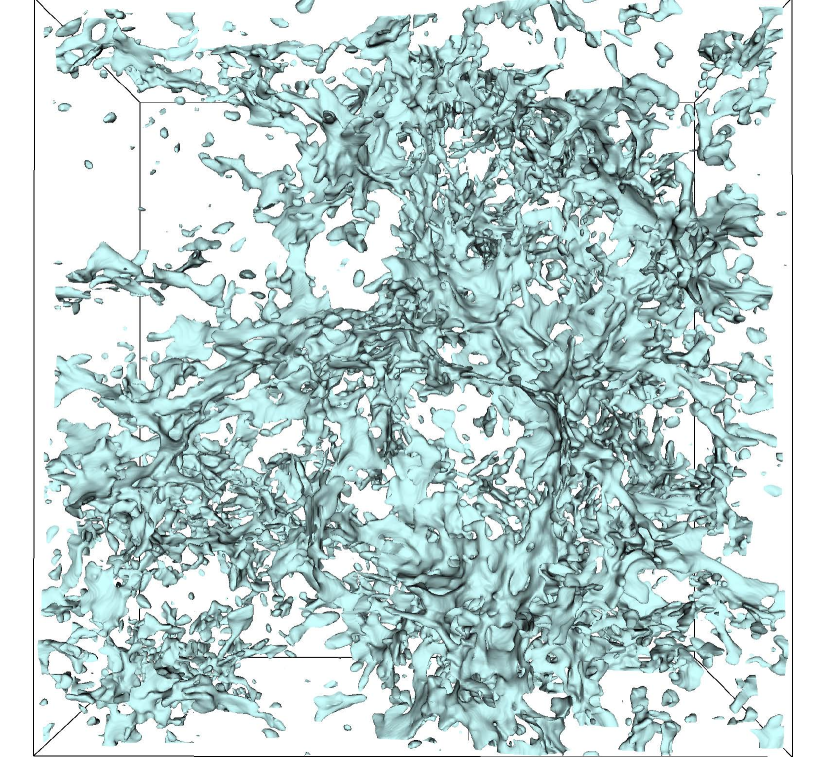
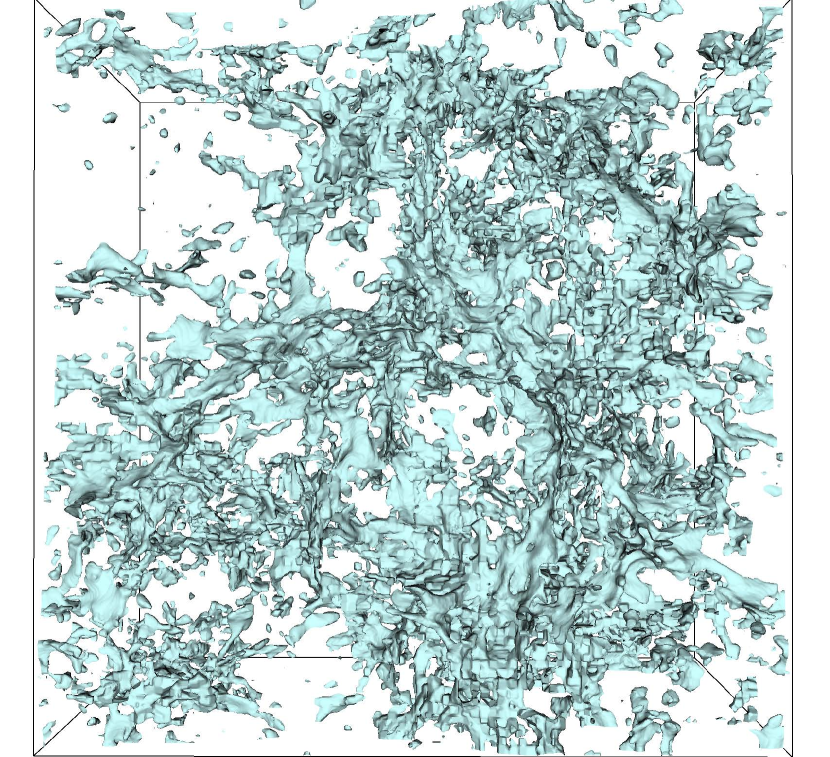
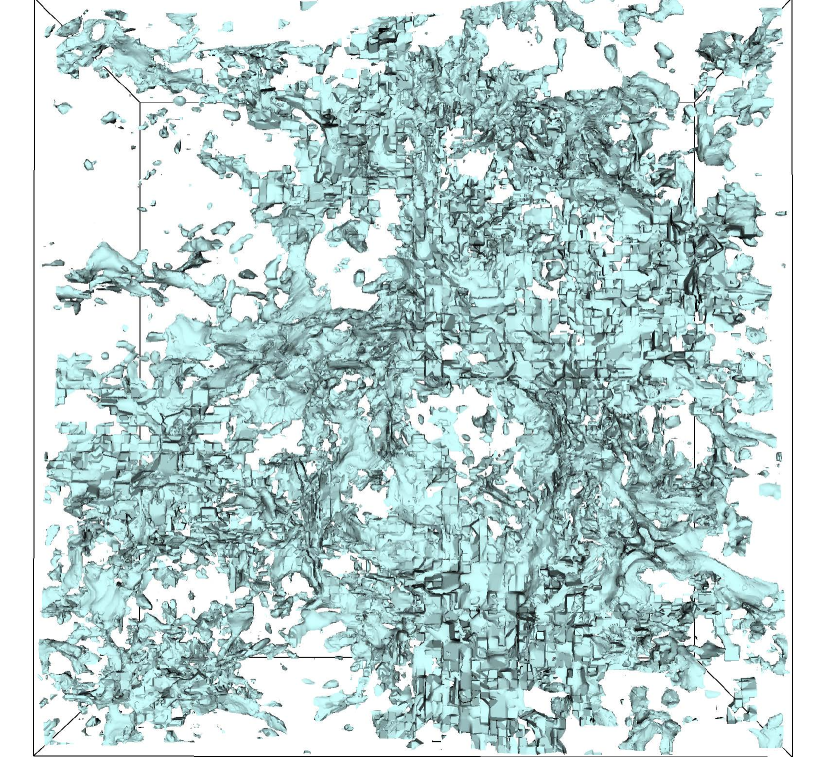
We first evaluated the WarpX simulation. As shown in Figure 9, the SZ-L/R compression algorithm was applied with different relative error bound ranges from 1E-4 to 1E-2 for both the re-sampling and dual-cell methods. Clearly, the larger the error bound, the worse the visual quality of the data. As mentioned in Section 1, the conventional re-sampling method results in a crack between different AMR levels, visible in all the decompressed data in Figures 9(a), 9(b), and 9(c).
As also noted in Section 1, these cracks can be remedied using the dual-cell method, as demonstrated in Figures 9(d), 9(e), and 9(f). However, Figures 9(d), 9(e), and 9(f) show that although the dual-cell method can fix the cracks between different AMR levels, it significantly affects the visual quality of the decompressed data compared to the re-sampling as shown in Figures 9(d), 9(e), and 9(f). Specifically, the dual-cell method amplifies the compression artifact of the data, especially when the error bound is relatively larger, as shown in Figure 9(f), where the block-wise artifact is greatly emphasized. These block-wise artifacts are due to the block-wise nature of the SZ-L/R compression algorithm, as mentioned in Section 3.3.
The negative impact of the dual-cell method on the decompressed data is even noticeable when the error bound is relatively small. For instance, in Figure 9(a), using the re-sampling method with a relative error bound of 1E-4, the visual quality of the decompressed data remains (almost) lossless compared to using the re-sampling method on the original data in Figure 1(a). However, as shown in Figure 9(d), when using the dual-cell method with a relative error bound of 1E-4, there is noticeable visual distortion in the decompressed data compared to the original data using the dual-cell method in Figure 1(c).
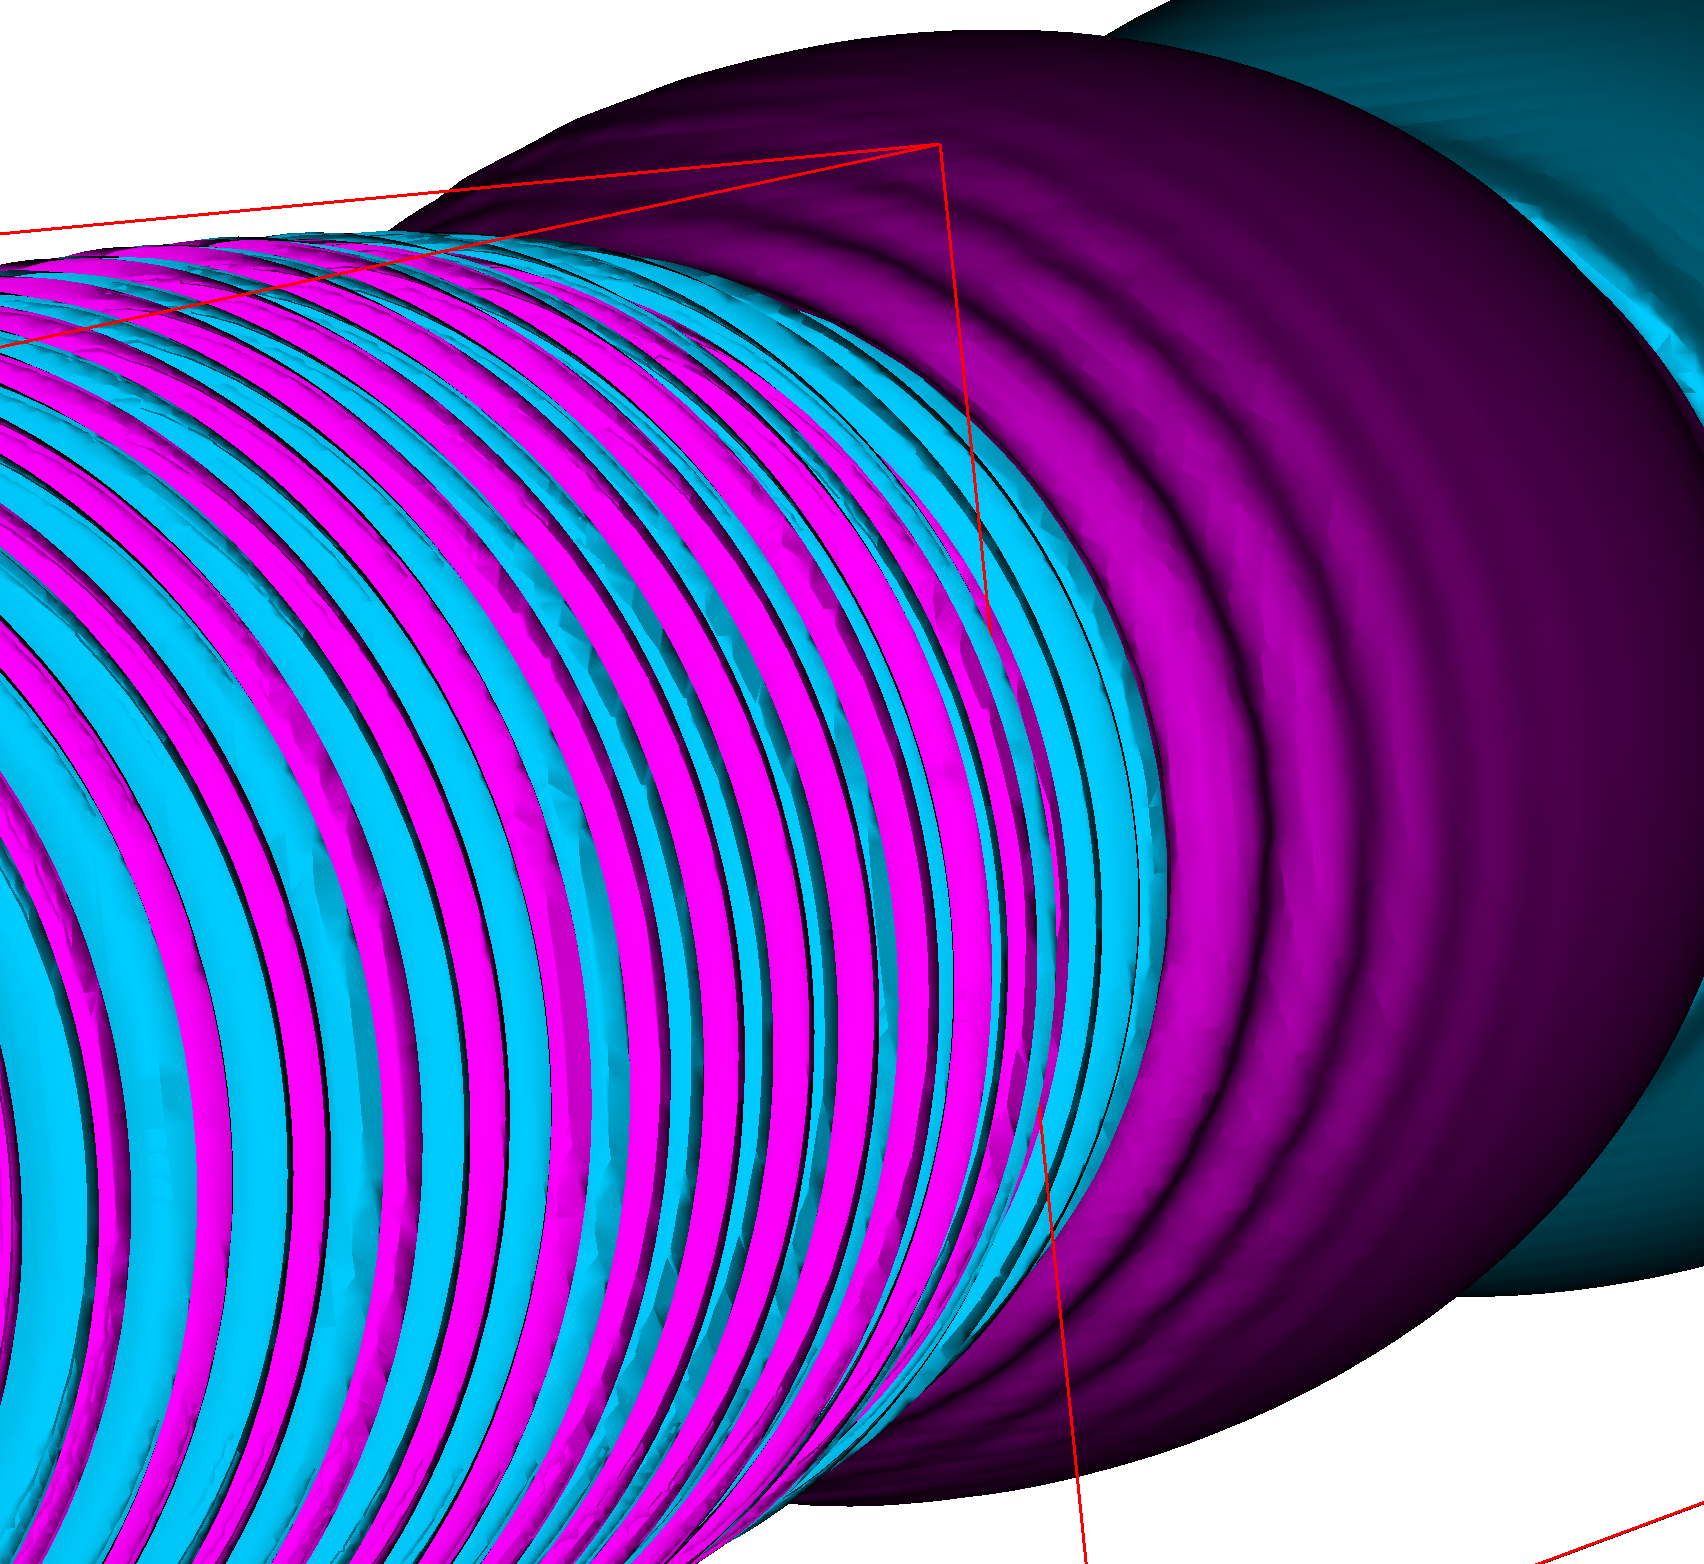
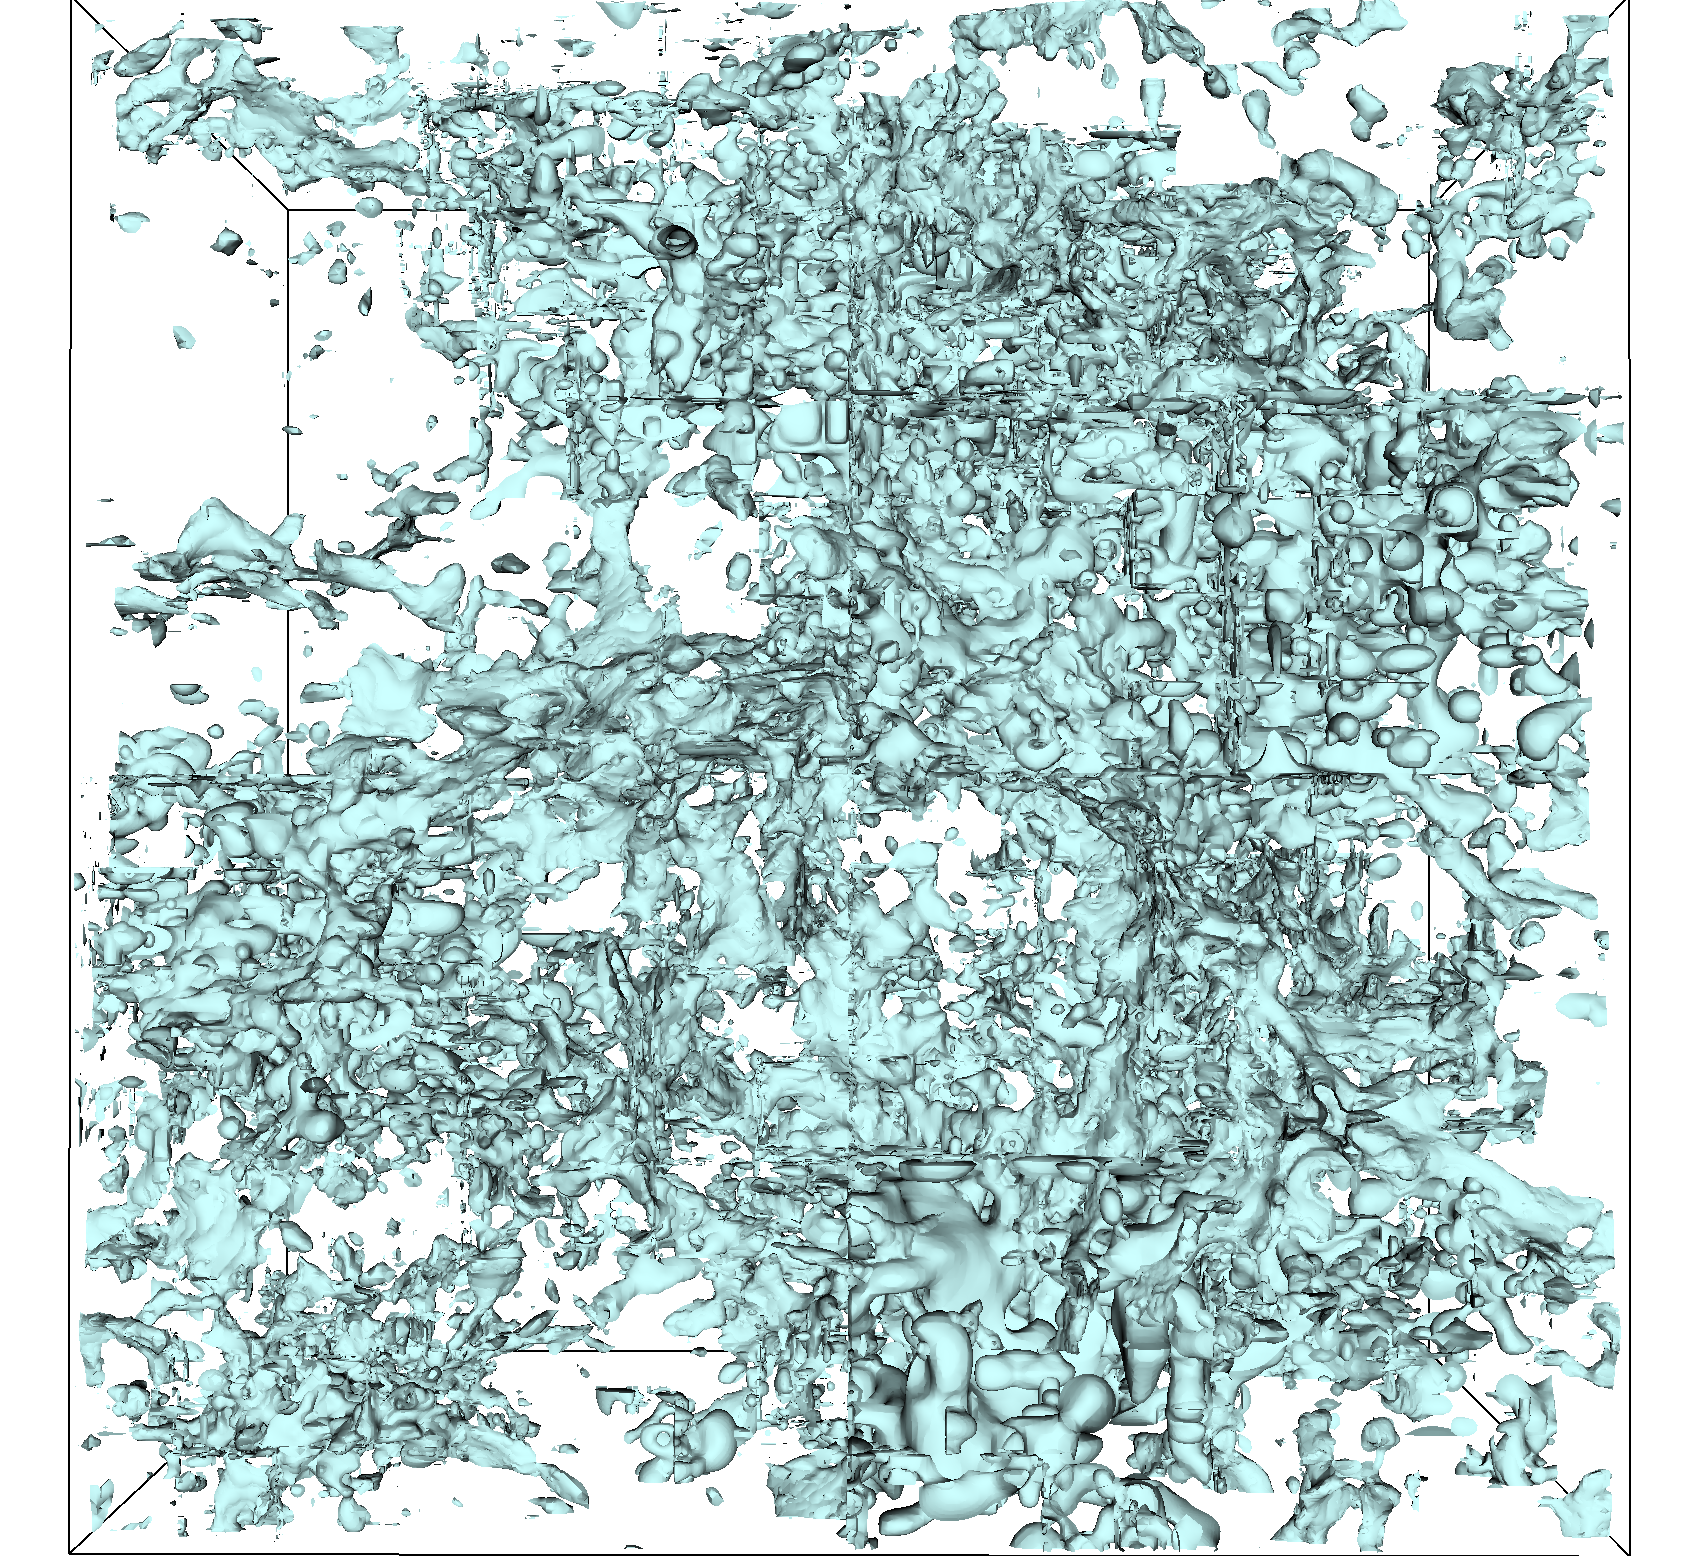
For SZ-Interp, it is evident that the dual-cell method could still affect the visual quality compared to re-sampling, as shown in Figure 10. There are more bump artifacts when using the dual-cell method in Figure 10(b) compared to re-sampling (Figure 10(a))
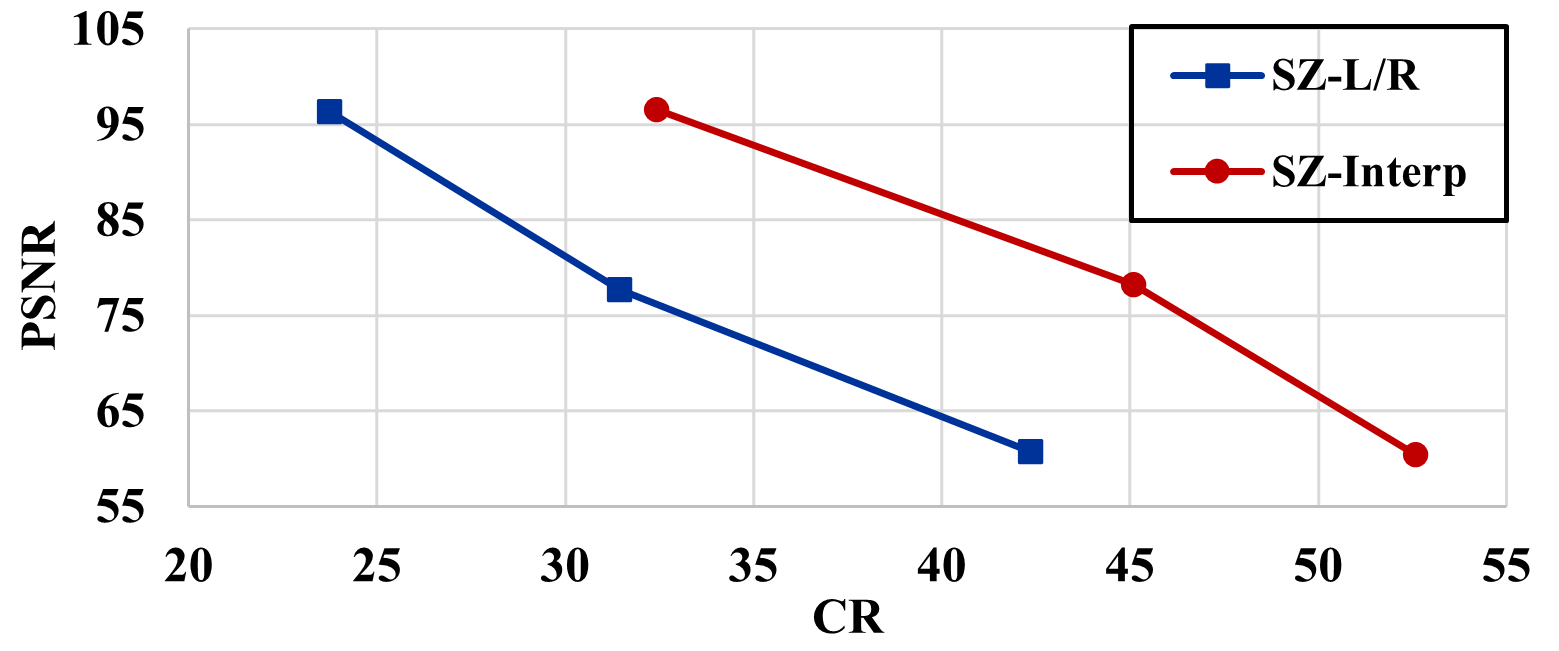
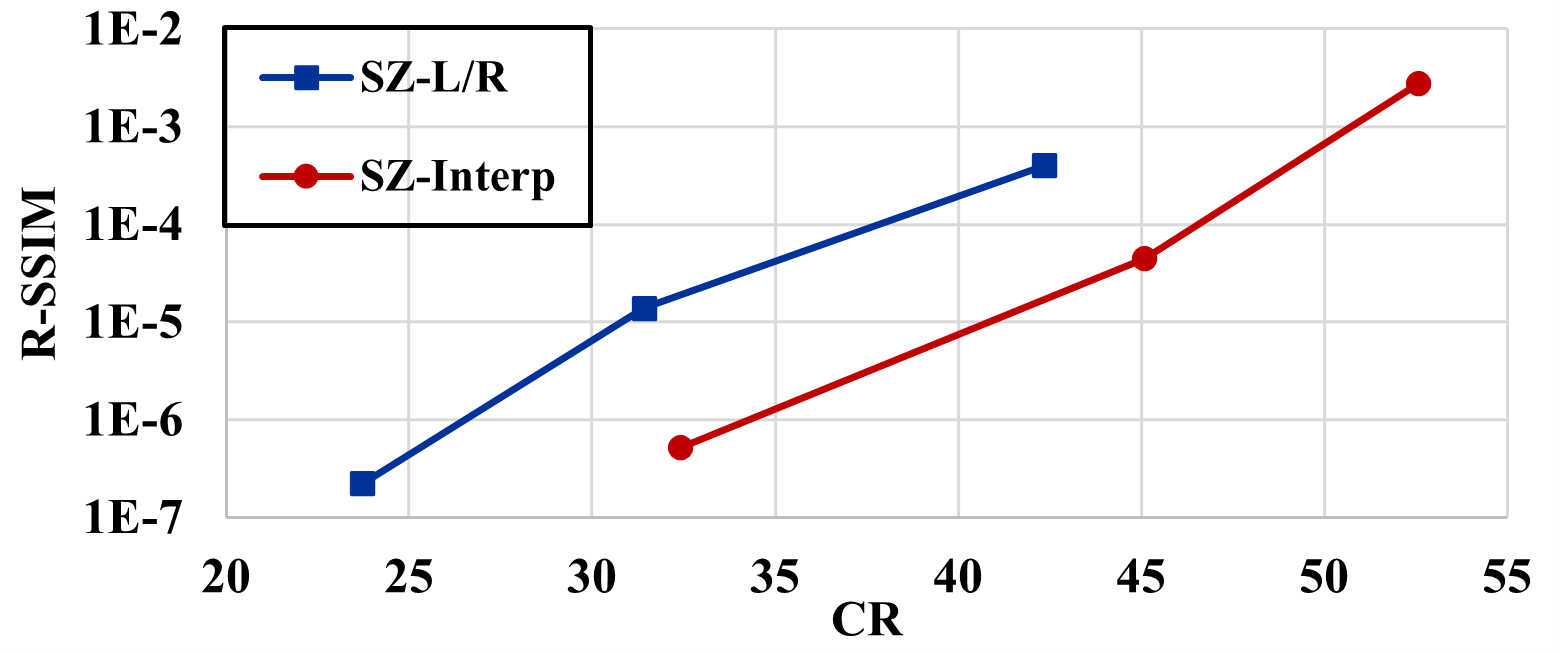
Quantitative metrics
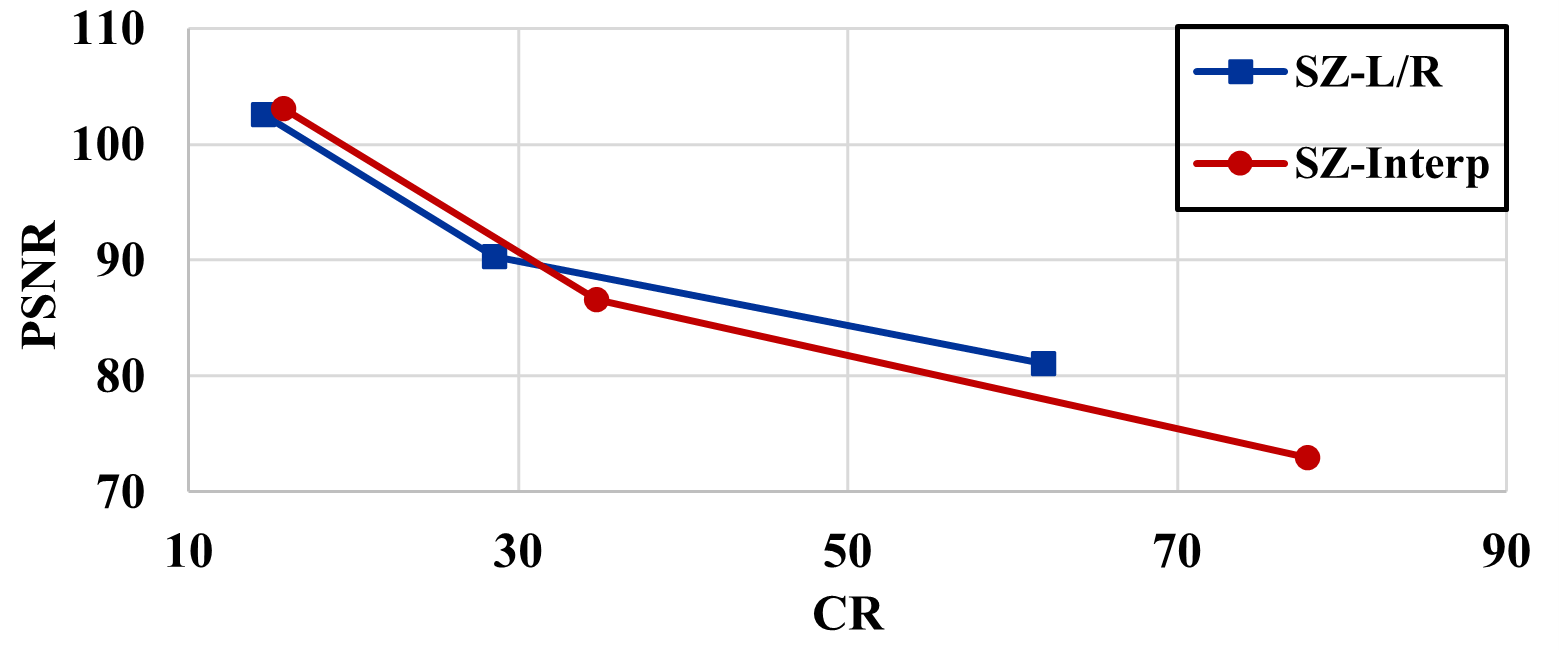
The detailed quantitative metrics are displayed in Table 2. Additionally, as illustrated in Figure 12(a) and 12(b), it is evident that SZ-Interp results in better rate-distortion performance in terms of both SSIM and PSNR. This can be primarily attributed to the smooth nature of the data generated by WarpX, which is conducive for the global interpolation predictor of SZ-Interp to perform optimally. It is important to note, however, that the SSIM does not provide an intuitive representation in this context because the relative SSIM difference between different error configurations is too small (e.g., 0.999,999,8 for eb=1E-4 vs 0.999,60 for eb=1E-2), despite there being a noticeable difference in the actual visual quality (as can be observed in Figure 9(d) and Figure 9(f)). Therefore, we propose the use of the reverse SSIM (denoted as R-SSIM):
| (1) |
In our scenario, the R-SSIM proves to be a more intuitive metric compared to the SSIM, as it more accurately reflects the differences across various cases. As can be seen from Figure 9 and Table 2, the R-SSIM is intuitive and highly related to the image quality.
4.2. Nyx
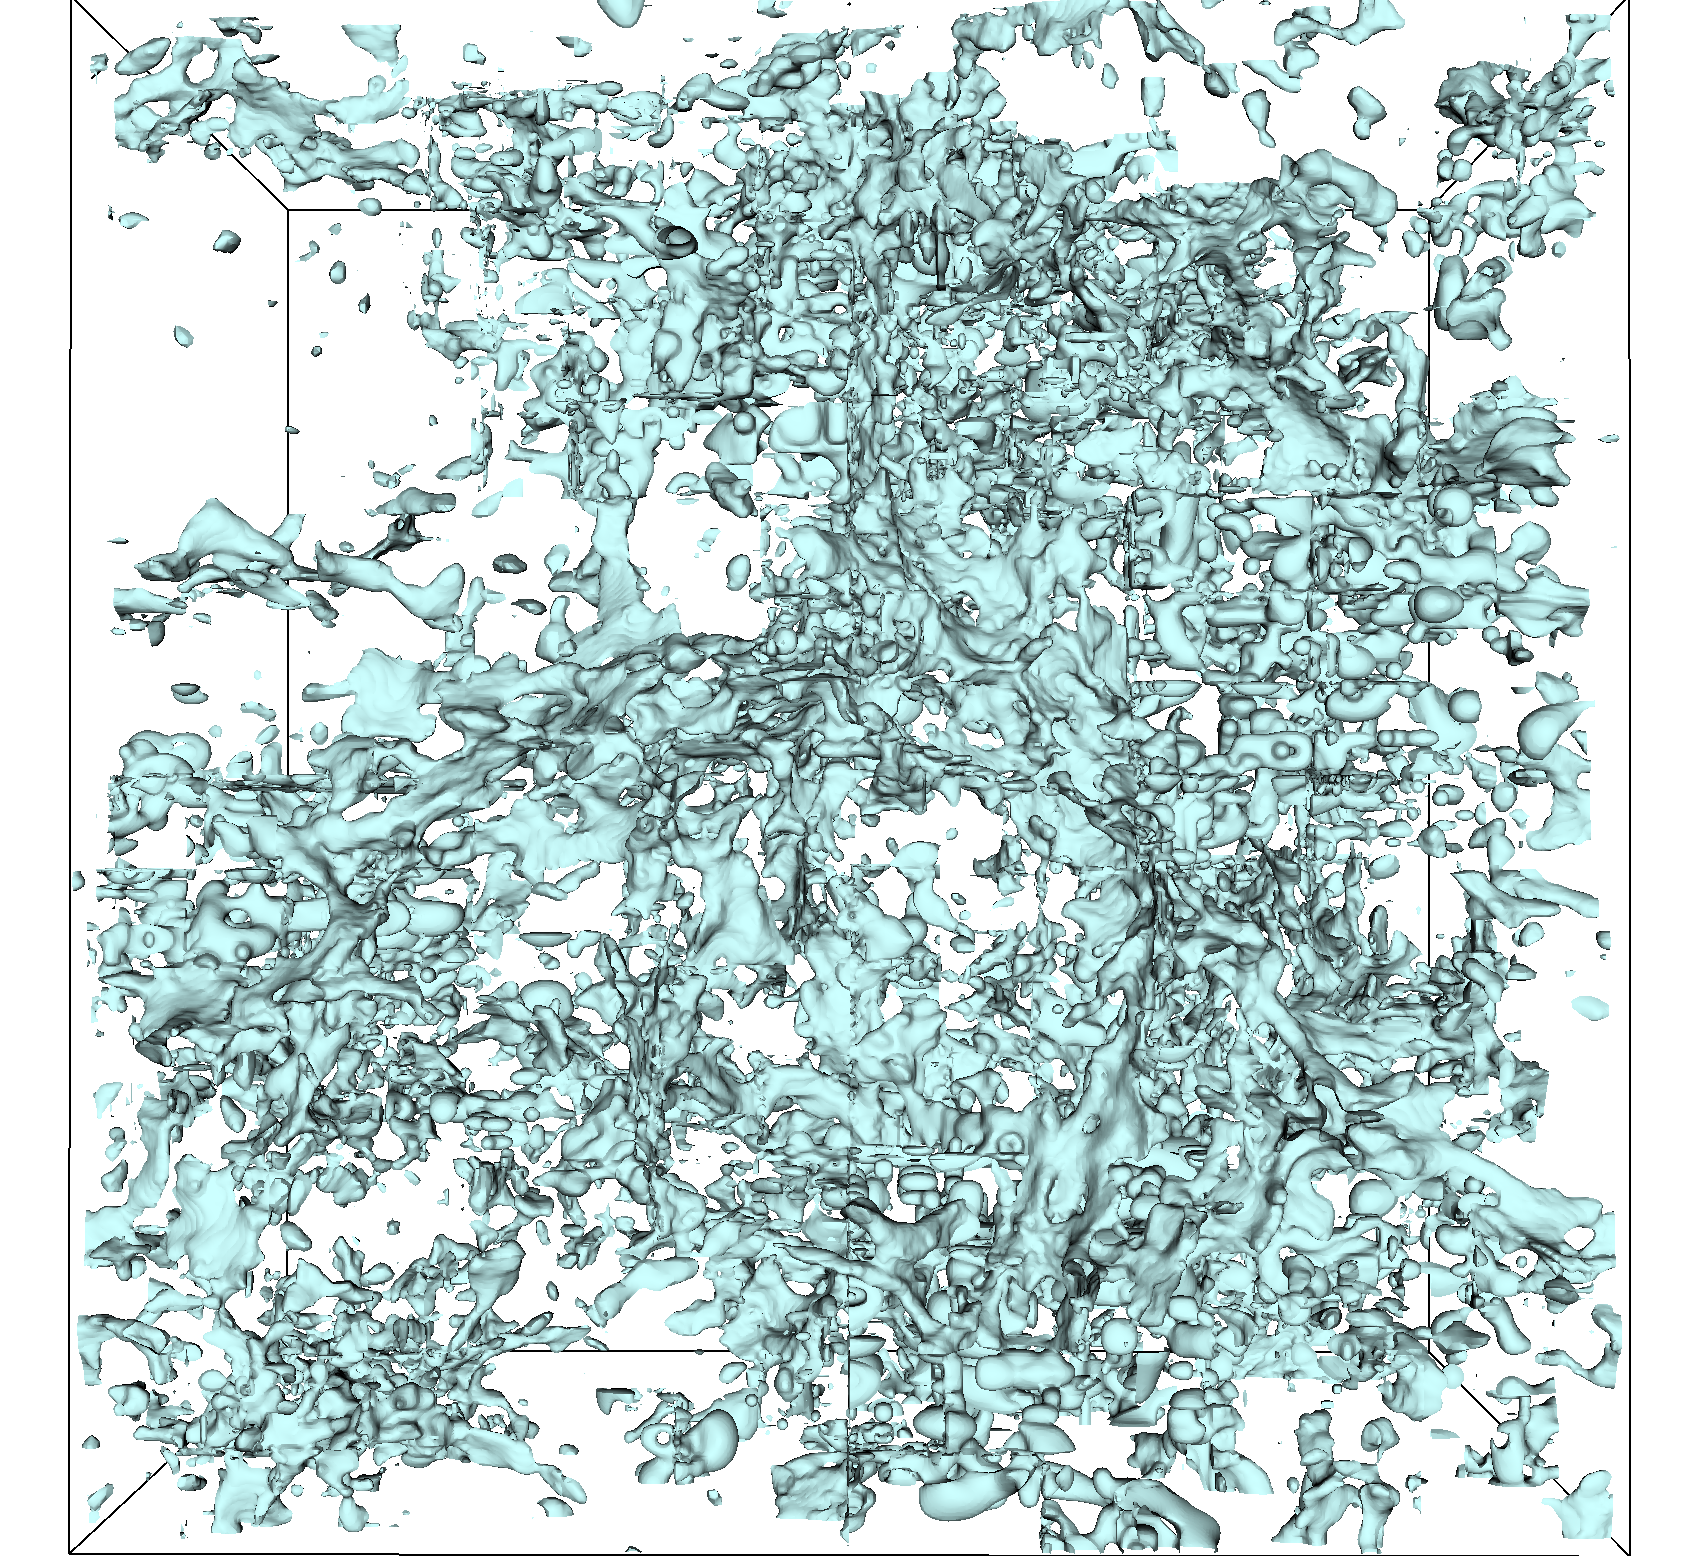
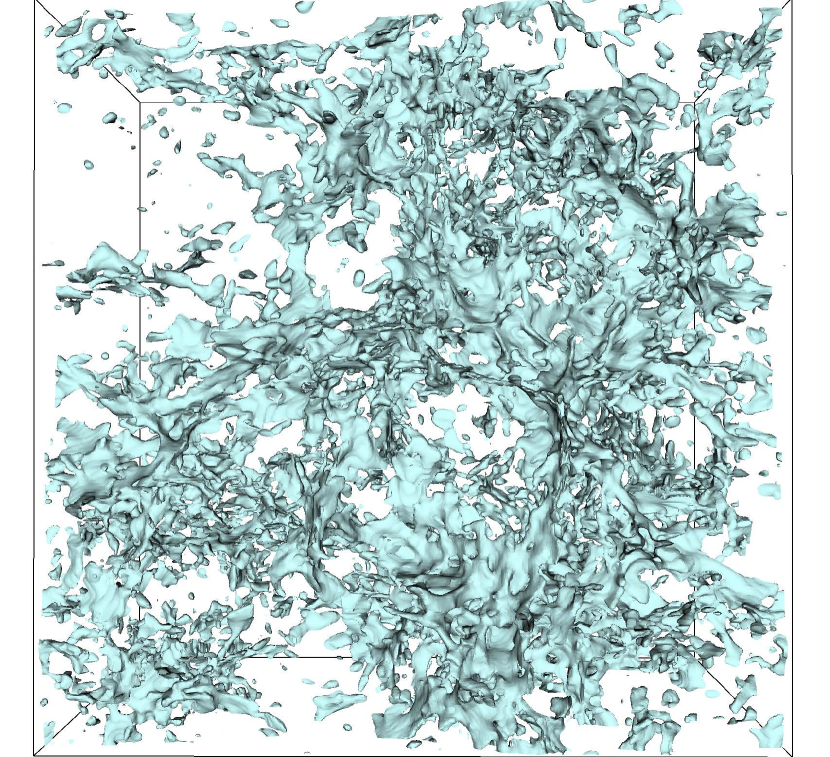
We then evaluated using the Nyx simulation. As depicted in Figure 11, we visualized the original data and decompressed data generated by SZ-L/R as well as SZ-Interp for both the re-sampling (Figure 11(a), 11(b), and 11(c)) and dual-cell methods (Figure 11(d), 11(e), and 11(f)). It is still evident that the dual-cell method diminishes the visual quality of the compressed AMR data for both SZ-L/R and SZ-Interp.
Specifically, when comparing with the original data for SZ-L/R, the dual-cell method, as shown in Figure 11(e), results in more severe block-wise artifacts in the lower mid part of the figure, while the block-wise artifact is less obvious using re-sampling, as can be seen in Figure 11(b). For SZ-Interp, as depicted in the lower mid part of Figure 11(f), using the dual-cell method leads to more fault geometry compared to re-sampling in Figure 11(c).
Another interesting observation is that although SZ-L/R leads to block-wise artifacts, it yields better visualization quality compared to SZ-Interp. As illustrated in Figures 11(c) and 11(f), although the decompressed data from SZ-Interp is smooth, it can greatly distort the original data structure in areas with complex geometry (e.g., the lower mid part). On the other hand, the block-wise nature of SZ-L/R can help it better capture the complex local patterns/information of the data, leading to better compression and visual quality on the complex and irregular Nyx dataset.
Quantitative metrics
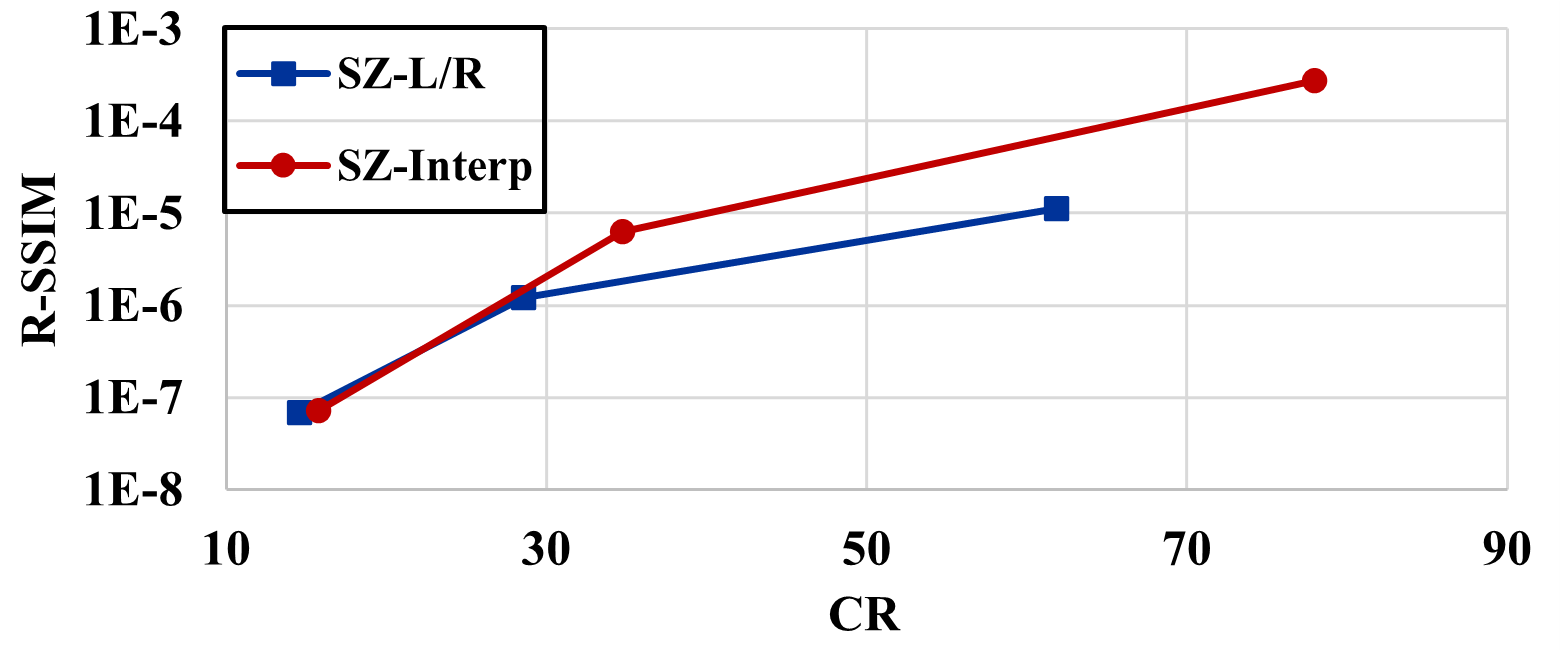
The detailed quantitative metrics are shown in Table 2. As shown in Figure 13(a) and 13(b), for the Nyx dataset, SZ-Interp does not exhibit a superior performance in rate-distortion compared to SZ-L/R. In fact, SZ-L/R even outperforms in terms of R-SSIM (a lower R-SSIM means a higher SSIM). This observation aligns with our previous finding that the block-based predictor of SZ-L/R is more adept at capturing local patterns within the Nyx data.
4.3. Discussion
Intuitively, compared to the dual-cell method, the higher iso-surface visualization quality of compressed data with the re-sampling seems to be attributed to the increased resolution of the dataset through interpolation during re-sampling, as discussed in Section 2.3. This interpolation results in a smoother iso-surface. However, for a larger dataset, the resolution advantage of interpolation is relatively minimal. For a dataset with dimensions of , the advantage can be quantified as . Given that our AMR dataset has a maximum fine level size of , the interpolation during re-sampling only yields a higher resolution. This minor advantage explains the visual similarities between the original uncompressed data visualized using dual-cell and re-sampling methods, as depicted in Figures 1(a) and 1(c) for WarpX and Figure 11(a) and 11(d) for Nyx, except for the cracks between AMR levels. However, this marginal increase in resolution does not account for the significant negative impact of the dual-cell method on compressed data.
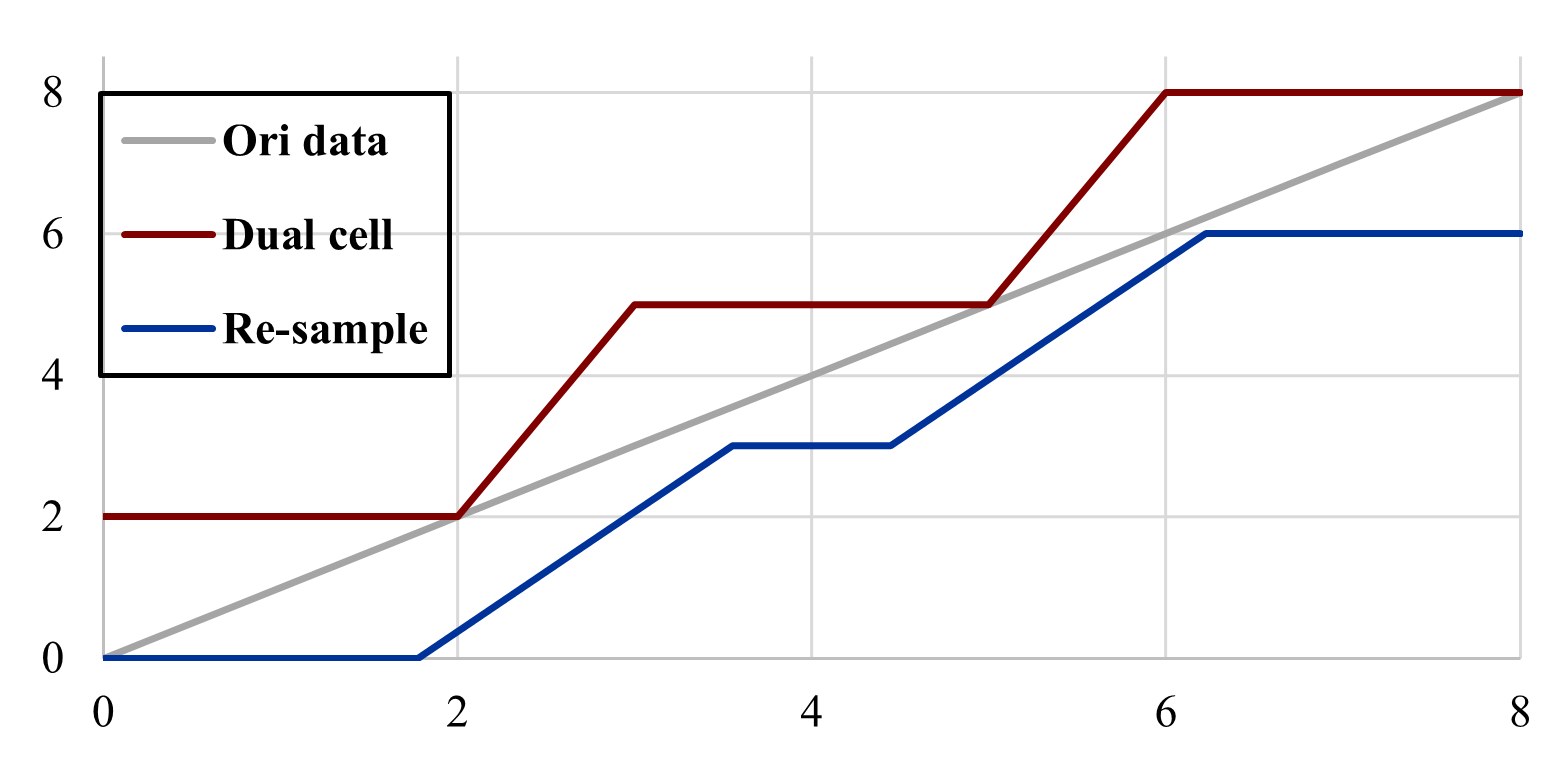
Our understanding is that the significant visual contrast between dual-cell and re-sampling methods on decompressed data arises because interpolation can reduce compression artifacts, especially the blocking artifacts of SZ-L/R. Figure 14 illustrates this with a 1D example. Suppose the original data is represented by the gray curve “012345678” and the decompressed data from SZ-L/R is “111//444//777”, with “111”, “444”, and “777” indicating block-wise artifacts from the compression (shown as the red curve). Re-sampling and interpolation transform the decompressed data into “111//2.5//44//5.5//777” where “2.5” and “5.5” are interpolated values that mitigate the block artifacts (represented by the blue curve).
5. Conclusion and Future Work
In conclusion, the article examines the impact of data compression on Adaptive Mesh Refinement (AMR) data visualization, a subject that has not been thoroughly explored in previous research. While error-bounded lossy compression is identified as a crucial solution to manage the vast amounts of data generated by scientific simulations, its impact on AMR data, which is particularly challenging to visualize due to its hierarchical and multi-resolution nature, is not well understood. The article aims to fill this knowledge gap by investigating how data compression not only affects but also introduces new challenges to AMR data visualization, thus contributing to a more comprehensive understanding of AMR data visualization with compression.
Acknowledgements.
This work has been authored by employees of Triad National Security, LLC, which operates Los Alamos National Laboratory under Contract No. 89233218CNA000001 with the U.S. Department of Energy (DOE) and the National Nuclear Security Administration (NNSA). This research was supported by the Exascale Computing Project (ECP), Project Number: 17-SC-20-SC, a collaborative effort of the DOE SC and NNSA. This work was also supported by NSF awards 2303064, 2247080, 2311876, and 2312673. This research used resources of the National Energy Research Scientific Computing Center, a DOE SC User Facility located at Lawrence Berkeley National Laboratory, operated under Contract No. DE-AC02-05CH11231. We would like to thank Dr. Zarija Lukić and Dr. Jean Sexton from the NYX team at Lawrence Berkeley National Laboratory for granting us access to cosmology datasets. This research used the open-source particle-in-cell code WarpX https://github.com/ECP-WarpX/WarpX, primarily funded by the US DOE Exascale Computing Project. Primary WarpX contributors are with LBNL, LLNL, CEA-LIDYL, SLAC, DESY, CERN, and TAE Technologies. We acknowledge all WarpX contributors.References
- (1)
- Ainsworth et al. (2018) Mark Ainsworth, Ozan Tugluk, Ben Whitney, and Scott Klasky. 2018. Multilevel techniques for compression and reduction of scientific data—the univariate case. Computing and Visualization in Science 19, 5–6 (2018), 65–76.
- Baker et al. (2019) Allison H Baker, Dorit M Hammerling, and Terece L Turton. 2019. Evaluating image quality measures to assess the impact of lossy data compression applied to climate simulation data. In Computer Graphics Forum, Vol. 38. Wiley Online Library, 517–528.
- Cappello et al. (2019) Franck Cappello, Sheng Di, Sihuan Li, Xin Liang, Ali Murat Gok, Dingwen Tao, Chun Hong Yoon, Xin-Chuan Wu, Yuri Alexeev, and Frederic T Chong. 2019. Use cases of lossy compression for floating-point data in scientific data sets. The International Journal of High Performance Computing Applications (2019).
- cuZFP (2023) cuZFP. 2023. https://github.com/LLNL/zfp/tree/develop/src/cuda_zfp. Online.
- Di and Cappello (2016a) Sheng Di and Franck Cappello. 2016a. Fast error-bounded lossy HPC data compression with SZ. In 2016 IEEE International Parallel and Distributed Processing Symposium. IEEE, 730–739.
- Di and Cappello (2016b) Sheng Di and Franck Cappello. 2016b. Fast error-bounded lossy HPC data compression with SZ. In 2016 IEEE International Parallel and Distributed Processing Symposium. IEEE, IEEE, Chicago, IL, USA, 730–739.
- Fedeli et al. (2022) L. Fedeli, A. Huebl, F. Boillod-Cerneux, T. Clark, K. Gott, C. Hillairet, S. Jaure, A. Leblanc, R. Lehe, A. Myers, C. Piechurski, M. Sato, N. Zaim, W. Zhang, J. Vay, and H. Vincenti. 2022. Pushing the Frontier in the Design of Laser-Based Electron Accelerators with Groundbreaking Mesh-Refined Particle-In-Cell Simulations on Exascale-Class Supercomputers. In SC22: International Conference for High Performance Computing, Networking, Storage and Analysis. IEEE Computer Society, Los Alamitos, CA, USA, 1–12. https://doi.org/10.1109/SC41404.2022.00008
- Grosset et al. (2020) Pascal Grosset, Christopher Biwer, Jesus Pulido, Arvind Mohan, Ayan Biswas, John Patchett, Terece Turton, David Rogers, Daniel Livescu, and James Ahrens. 2020. Foresight: analysis that matters for data reduction. In 2020 SC20: International Conference for High Performance Computing, Networking, Storage and Analysis (SC). IEEE Computer Society, 1171–1185.
- Harel et al. (2017) Guénolé Harel, Jacques-Bernard Lekien, and Philippe P Pébaÿ. 2017. Two new contributions to the visualization of AMR grids: I. interactive rendering of extreme-scale 2-dimensional grids ii. novel selection filters in arbitrary dimension. arXiv preprint arXiv:1703.00212 (2017).
- Jin et al. (2020) Sian Jin, Pascal Grosset, Christopher M Biwer, Jesus Pulido, Jiannan Tian, Dingwen Tao, and James Ahrens. 2020. Understanding GPU-Based Lossy Compression for Extreme-Scale Cosmological Simulations. arXiv preprint arXiv:2004.00224 (2020).
- Jin et al. (2021) Sian Jin, Jesus Pulido, Pascal Grosset, Jiannan Tian, Dingwen Tao, and James Ahrens. 2021. Adaptive Configuration of In Situ Lossy Compression for Cosmology Simulations via Fine-Grained Rate-Quality Modeling. arXiv preprint arXiv:2104.00178 (2021).
- Jin et al. (2022) Sian Jin, Dingwen Tao, Houjun Tang, Sheng Di, Suren Byna, Zarija Lukic, and Franck Cappello. 2022. Accelerating parallel write via deeply integrating predictive lossy compression with HDF5. arXiv preprint arXiv:2206.14761 (2022).
- Liang et al. (2018) Xin Liang, Sheng Di, Dingwen Tao, Sihuan Li, Shaomeng Li, Hanqi Guo, Zizhong Chen, and Franck Cappello. 2018. Error-controlled lossy compression optimized for high compression ratios of scientific datasets. In 2018 IEEE International Conference on Big Data. IEEE, 438–447.
- Liang et al. (2022) Xin Liang, Kai Zhao, Sheng Di, Sihuan Li, Robert Underwood, Ali M. Gok, Jiannan Tian, Junjing Deng, Jon C. Calhoun, Dingwen Tao, Zizhong Chen, and Franck Cappello. 2022. SZ3: A Modular Framework for Composing Prediction-Based Error-Bounded Lossy Compressors. IEEE Transactions on Big Data (2022), 1–14. https://doi.org/10.1109/TBDATA.2022.3201176
- Lindstrom (2014) Peter Lindstrom. 2014. Fixed-rate compressed floating-point arrays. IEEE Transactions on Visualization and Computer Graphics 20, 12 (2014), 2674–2683.
- Lorensen and Cline (1987) William E. Lorensen and Harvey E. Cline. 1987. Marching cubes: A high resolution 3D surface construction algorithm. In Proceedings of the 14th Annual Conference on Computer Graphics and Interactive Techniques, SIGGRAPH 1987, Anaheim, California, USA, July 27-31, 1987, Maureen C. Stone (Ed.). ACM, 163–169. https://doi.org/10.1145/37401.37422
- Lu et al. (2018) Tao Lu, Qing Liu, Xubin He, Huizhang Luo, Eric Suchyta, Jong Choi, Norbert Podhorszki, Scott Klasky, Mathew Wolf, Tong Liu, et al. 2018. Understanding and modeling lossy compression schemes on HPC scientific data. In 2018 IEEE International Parallel and Distributed Processing Symposium. IEEE, 348–357.
- Luo et al. (2019) Huizhang Luo, Dan Huang, Qing Liu, Zhenbo Qiao, Hong Jiang, Jing Bi, Haitao Yuan, Mengchu Zhou, Jinzhen Wang, and Zhenlu Qin. 2019. Identifying Latent Reduced Models to Precondition Lossy Compression. In 2019 IEEE International Parallel and Distributed Processing Symposium. IEEE.
- Luo et al. (2021) Huizhang Luo, Junqi Wang, Qing Liu, Jieyang Chen, Scott Klasky, and Norbert Podhorszki. 2021. zMesh: Exploring Application Characteristics to Improve Lossy Compression Ratio for Adaptive Mesh Refinement. In 2021 IEEE International Parallel and Distributed Processing Symposium (IPDPS). IEEE, 402–411.
- NYX simulation (2019) NYX simulation. 2019. https://amrex-astro.github.io/Nyx/. Online.
- Oak Ridge Leadership Computing Facility (2023) Oak Ridge Leadership Computing Facility. 2023. WarpX, granted early access to the exascale supercomputer Frontier, receives the high-performance computing world’s highest honor. https://www.olcf.ornl.gov/2022/11/17/plasma-simulation-code-wins-2022-acm-gordon-bell-prize/ Online.
- Stone et al. (2020) James M Stone, Kengo Tomida, Christopher J White, and Kyle G Felker. 2020. The Athena++ adaptive mesh Refinement framework: Design and magnetohydrodynamic solvers. The Astrophysical Journal Supplement Series 249, 1 (2020), 4.
- Tao et al. (2017a) Dingwen Tao, Sheng Di, Zizhong Chen, and Franck Cappello. 2017a. Significantly improving lossy compression for scientific data sets based on multidimensional prediction and error-controlled quantization. In 2017 IEEE International Parallel and Distributed Processing Symposium. IEEE, 1129–1139.
- Tao et al. (2017b) Dingwen Tao, Sheng Di, Zizhong Chen, and Franck Cappello. 2017b. Significantly improving lossy compression for scientific data sets based on multidimensional prediction and error-controlled quantization. In 2017 IEEE International Parallel and Distributed Processing Symposium. IEEE, 1129–1139.
- Tao et al. (2019) Dingwen Tao, Sheng Di, Xin Liang, Zizhong Chen, and Franck Cappello. 2019. Optimizing lossy compression rate-distortion from automatic online selection between SZ and ZFP. IEEE Transactions on Parallel and Distributed Systems 30, 8 (2019), 1857–1871.
- Tian et al. (2021) Jiannan Tian, Sheng Di, Xiaodong Yu, Cody Rivera, Kai Zhao, Sian Jin, Yunhe Feng, Xin Liang, Dingwen Tao, and Franck Cappello. 2021. Optimizing error-bounded lossy compression for scientific data on GPUs. In 2021 IEEE International Conference on Cluster Computing (CLUSTER). IEEE, 283–293.
- Tian et al. (2020) Jiannan Tian, Sheng Di, Kai Zhao, Cody Rivera, Megan Hickman Fulp, Robert Underwood, Sian Jin, Xin Liang, Jon Calhoun, Dingwen Tao, and Franck Cappello. 2020. cuSZ: An Efficient GPU-Based Error-Bounded Lossy Compression Framework for Scientific Data. (2020), 3–15.
- Wang et al. (2022b) Daoce Wang, Jesus Pulido, Pascal Grosset, Sian Jin, Jiannan Tian, James Ahrens, and Dingwen Tao. 2022b. TAC: Optimizing Error-Bounded Lossy Compression for Three-Dimensional Adaptive Mesh Refinement Simulations. In Proceedings of the 31st International Symposium on High-Performance Parallel and Distributed Computing. 135–147.
- Wang et al. (2023) Daoce Wang, Jesus Pulido, Pascal Grosset, Jiannan Tian, Sian Jin, Houjun Tang, Jean Sexton, Sheng Di, Zarija Lukić, Kai Zhao, Bo Fang, Franck Cappello, James Ahrens, and Dingwen Tao. 2023. AMRIC: A Novel In Situ Lossy Compression Framework for Efficient I/O in Adaptive Mesh Refinement Applications.
- Wang et al. (2020) Feng Wang, Nathan Marshak, Will Usher, Carsten Burstedde, Aaron Knoll, Timo Heister, and Chris R. Johnson. 2020. CPU Ray Tracing of Tree-Based Adaptive Mesh Refinement Data. Computer Graphics Forum 39, 3 (2020), 1–12.
- Wang et al. (2022a) Jinzhen Wang, Pascal Grosset, Terece L. Turton, and James Ahrens. 2022a. Analyzing the Impact of Lossy Data Reduction on Volume Rendering of Cosmology Data. In 2022 IEEE/ACM 8th International Workshop on Data Analysis and Reduction for Big Scientific Data (DRBSD). 11–20. https://doi.org/10.1109/DRBSD56682.2022.00007
- Weber et al. (2001) Gunther H. Weber, Oliver Kreylos, Terry J. Ligocki, John M. Shalf, Hans Hagen, Bernd Hamann, and Kenneth I. Joy. 2001. Extraction of Crack-free Isosurfaces from Adaptive Mesh Refinement Data. In 3rd Joint Eurographics - IEEE TCVG Symposium on Visualization, VisSym 2001, Ascona, Switzerland, May 28-30, 2001, David S. Ebert, Jean M. Favre, and Ronald Peikert (Eds.). Eurographics Association, 25–34. https://doi.org/10.1007/978-3-7091-6215-6_4
- Zhang et al. (2019) Weiqun Zhang, Ann Almgren, Vince Beckner, John Bell, Johannes Blaschke, Cy Chan, Marcus Day, Brian Friesen, Kevin Gott, Daniel Graves, et al. 2019. AMReX: a framework for block-structured adaptive mesh refinement. Journal of Open Source Software 4, 37 (2019), 1370–1370.
- Zhao et al. (2021) Kai Zhao, Sheng Di, Maxim Dmitriev, Thierry-Laurent D Tonellot, Zizhong Chen, and Franck Cappello. 2021. Optimizing error-bounded lossy compression for scientific data by dynamic spline interpolation. In 2021 IEEE 37th International Conference on Data Engineering (ICDE). IEEE, 1643–1654.