Analyzing recreational fishing effort - Gender differences and the impact of Covid-19
Abstract
Recreational fishing is an important economic driver and provides multiple social benefits. To predict fishing activity, identifying variables related to variation, such as gender or Covid-19, is helpful. We conducted a Canada-wide email survey of users of an online fishing platform and analyzed responses focusing on gender, the impact of Covid-19, and variables directly related to fishing effort. Genders (90% men and 10% women) significantly differed in demographics, socioeconomic status, and fishing skills but showed similar fishing preferences, fishing effort in terms of trip frequency, and travel distance. Covid-19 altered trip frequency for almost half of fishers, with changes varying by gender and activity level. A Bayesian network revealed travel distance as the main determinant of trip frequency, negatively impacting fishing activity for 61% of fishers, with fishing expertise also playing a role. The results suggest that among active fishers, socio-economic differences between genders do not drive fishing effort, but responses to Covid-19 were gender-specific. Recognizing these patterns is critical for equitable policy-making and accurate socio-ecological models, thereby improving resource management and sustainability.
1 Introduction
Recreational fishing is an important economic driver ([78]) and provides multiple social benefits such as stress release and connection to nature ([58, 110, 78, 79]). Freshwater recreational fisheries are complex adaptive systems, not only defined by ecological feedbacks but also by social drivers ([57]). Hence, effective sustainable management requires an understanding of both the ecological environment such as fish stock dynamics, and the social environment such as fishing behavior. Identifying how variables, such as demographics and socioeconomic status, are related to fishing activity can help to provide insights into the system and to improve fishing sustainability and fisher satisfaction ([58, 62, 68, 105]).
Participation in recreational fishing activities varies among people with different demographics. A long-term study in Texas revealed that women and young people go fishing less often and less consistently than older people and men ([76]). Most recent data in Canada showed men represented 79% of fishers with ages skewed to older age groups ([78]). Reasons for variable fishing participation could be differing fishing motivations and satisfaction levels between the genders. Socioeconomic backgrounds could also play a role because recreational fishing is a leisure activity ([107, 99, 87]). Most previous studies focused on variables influencing the participation of males and females in fishing activities. However, they disregarded how the fishing effort of participating men and women was influenced by different factors.
Fishing effort of participating fishers, such as the frequency of fishing trips, can also be influenced by demographics and socio-economic status. In addition, the distance and accessibility of water bodies, weather conditions and the global Covid-19 pandemic could alter in fishing effort, e.g., by reducing fisher access to fishing sites ([64, 84, 66]). Uncovering variables that impact fishing effort can help to enable participatory management and forecasting fishing activity trends ([93, 87]).
Surveys were often used to obtain data related to fishing participation and fishing effort ([103, 72, 59, 88, 74]). Often these survey data were analyzed using traditional statistical methods such as regression models, analysis of variance (ANOVA) and chi-square tests ([103, 72, 70]). These methods can be restrictive, for instance, in terms of handling missing data that could result from missing answers to individual survey questions, only analyzing interactions between pairs of factors disregarding the system as a whole (e.g., chi-square tests), or assuming linearity or certain distributional forms for the relationships between the variables (e.g., ANOVA).
Bayesian networks overcome these restrictions and can outperform traditional statistical methods ([106, 109]). Bayesian networks use conditional dependencies between different variables visualized in a network that can be learned from data and used to detect non-linear relationships between variables ([106, 102]). Several studies have combined survey data with Bayesian networks in different fields for different purposes such as supporting medical decisions ([71]), analyzing illegal crossing behavior of pedestrians ([96]), predicting mountain pine beetle infestations in forests ([102, 101]) and assessing the risk of safety levels in university laboratories ([112]).
In this study, gender differences among fishers and conditional dependencies between possible variables affecting fishing effort in terms of fishing frequency were analyzed. More specifically, three research questions were addressed: 1. Do women and men who fish recreationally differ in terms of demographics, socioeconomic status, fishing preferences, characteristics and effort? 2. How did Covid-19 affect the fishing effort of fishers of different genders and of different levels of fishing activity? 3. What variables can be used to predict fishing effort? An online survey across Canada was conducted with questions related to fishers’ demographics and socioeconomic status, and fishing characteristics, motivations, preferences and effort. Relationships between the variables were examined both statistically and via a Bayesian network. The latter made it possible to analyze direct and indirect probabilistic dependencies between the variables and to extract main determinants.
2 Materials and Methods
2.1 Email survey
2.1.1 Survey respondents
An email survey was sent on July 26, 2023, to all subscribers (126,431) to the newsletter of the Angler’s Atlas platform, a leading online platform for fishers in Canada (www.anglersatlas.com). Survey participants could win one of four gift cards of CA$100 (1 in 333 chance to win). Until August 31, 2023, 44,589 recipients opened the email (35%), 2,287 recipients clicked on the link of the survey and 1,689 recipients responded which resulted in a response rate of 3.8% of the recipients that opened the email. The study was reviewed and approved by the Research Ethics Board of the Alberta Research Information Services (ARISE, University of Alberta), study ID MS5_Pro00102610.
2.1.2 Survey questions
The survey comprised 36 questions of seven categories: (1) ten questions on demographics and socioeconomic status, (2) four on fishing characteristics, (3) four on fisher behavior, (4) eight questions on the preferable water-body environment, (5) two on the preferable weather conditions, (6) four on the usage of the Angler’s Atlas platform, (7) two on the impact of Covid-19, and two additional open questions to share additional information (see appendix). Questions were in the format of multiple-choice, single-select and open-text responses. See Supplementary Information for the actual questions.
2.2 Data preprocessing
Non-relevant responses from fishers that indicated no fishing region or a fishing region other than Canada were removed (n=5). Respondents who indicated as gender “female" were considered women, and respondents who indicated “male" were considered men. One percent of the respondents chose not to specify their gender or selected “Other” (n=16) and were therefore not included in the study. See SI methods for answers under “Other”.
Text responses were individually assessed and classified into the specified categories of each question. Postal codes of origin were assigned to the respective province. Continuous variables (short-distance trip frequency, long-distance trip frequency, household size, and fishing experience) were binned into four levels with equal frequency.
For questions with categorical responses (“Fishing reason" and “Use of Angler’s Atlas") binary dummy variables were created for each response option (seven variables for “Fishing reason" and six variables for “Use of Angler’s Atlas"). See Table 1 for an overview of all variables and their levels.
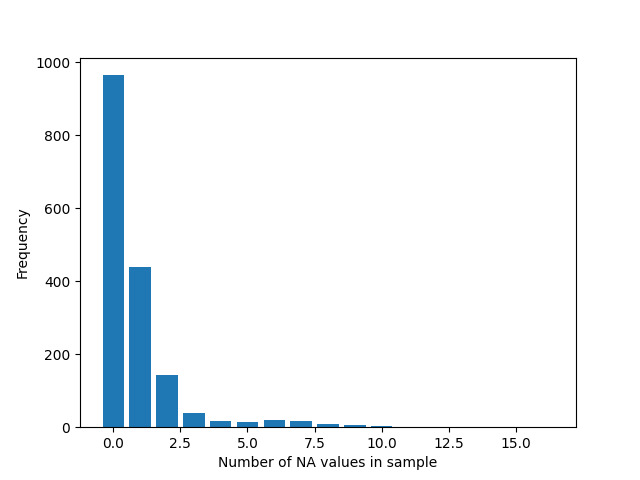
Of the 1,668 responses (samples), 703 were incomplete, meaning that at least for one variable the value was not available (NA) (Fig. S2). NA values appeared either because the participant provided no answer, the participant chose the option not to answer (e.g., for “Income") or the answer of the participant did not fit into any reasonable predefined category.
2.3 Data evaluation
2.3.1 Differences between genders
Gender and age distributions were compared to two surveys among fishing licence purchasers to evaluate how representative the survey respondents were. In 2015, Fisheries and Oceans Canada (DFO) surveyed Canada-wide active fishers using a stratified, systematic random sampling method and gained a participation rate of 4.4% (115,372 of 2,639,224 active residential and non-residential fishers, [78]). Moreover, data on 270,120 fishing licence purchasers fishing in the province of British Columbia in the year 2022 were available.
The chi-square test of independence was applied to detect differences between the frequencies of responses from women and men using the chi2_contingency() function of the scipy.stats module in Python. NA values were excluded.
2.3.2 Factors related to fishing effort
The preprocessed data set was further adjusted for learning Bayesian networks. Samples with more than four NA values were removed (n=68). The variables “Province of residence” and “Main fishing province” were grouped into five geographical categories (see Table 1 and SI Methods for details). The preprocessed data set included 1600 samples of 46 variables in seven categories (Table 1).
A Bayesian network was used to represent the set of variables and their probabilistic dependencies ([94]). It consisted of a directed acyclic graph and conditional probability distributions that were presented as tables in the case of discrete variables. The construction of the Bayesian network based on data was divided into two steps: (i) structure learning, the estimation of the network structure that captures the dependencies between the variables (the edges in the network), and (ii) parameter learning, the estimation of the probability distributions of each variable conditioned on its parents ([102]). The Bayesian network was learned with the bnlearn package (version 4.9.1) in R (version 4.3.2) ([108, 85]).
For (i), learning the structure based on an incomplete data set, the structural expectation-maximization algorithm was used to find the “best" network structure in an iterative process, consisting of repeated expectation and maximization steps (structural.em() in bnlearn, [80, 86, 106]). In the first expectation step, the NA values in the incomplete data set were imputed using an initial empty network structure to obtain a complete data set. In the maximization step, the complete data set was used in the score-based greedy hill-climbing to find the network structure with the maximum Bayesian Information Criteria (BIC) score in 1,000 iteration steps ([63, 82]). The new network structure was then used in the following expectation step to impute the NA values in the incomplete data set again. The stopping criteria for the expectation-maximization algorithm was set to five iterations. The resulting network structure with the highest score was chosen as the “best" network structure of the Bayesian network.
For (ii), learning the parameters of the Bayesian network, maximum likelihood estimation was used with the incomplete data set (bn.fit() in bnlearn). Given the best network structure, the conditional probabilities of each node was obtained based on the relative frequencies of variable values of locally complete samples (i.e., samples that had values for the node and its parent nodes). Conditional probabilities were expressed as relative frequencies in the results to be consistent with the first part of the analysis in which differences between genders were analyzed.
The strengths of dependencies between the variables were measured by generating 2,500 additional Bayesian network structures from bootstrap samples (boot.strength() in bnlearn, [67]). Bootstrap samples were randomly sampled from the original data set with replacement to obtain a new data set of the same size ([81, 91]). The strengths of the dependencies were estimated by their relative frequencies in the network structures and can be interpreted as probabilities for the inclusion of the edge in the Bayesian network.
See Supplementary Information for an R script illustrating the methods described above.
3 Results
3.1 Survey respondents
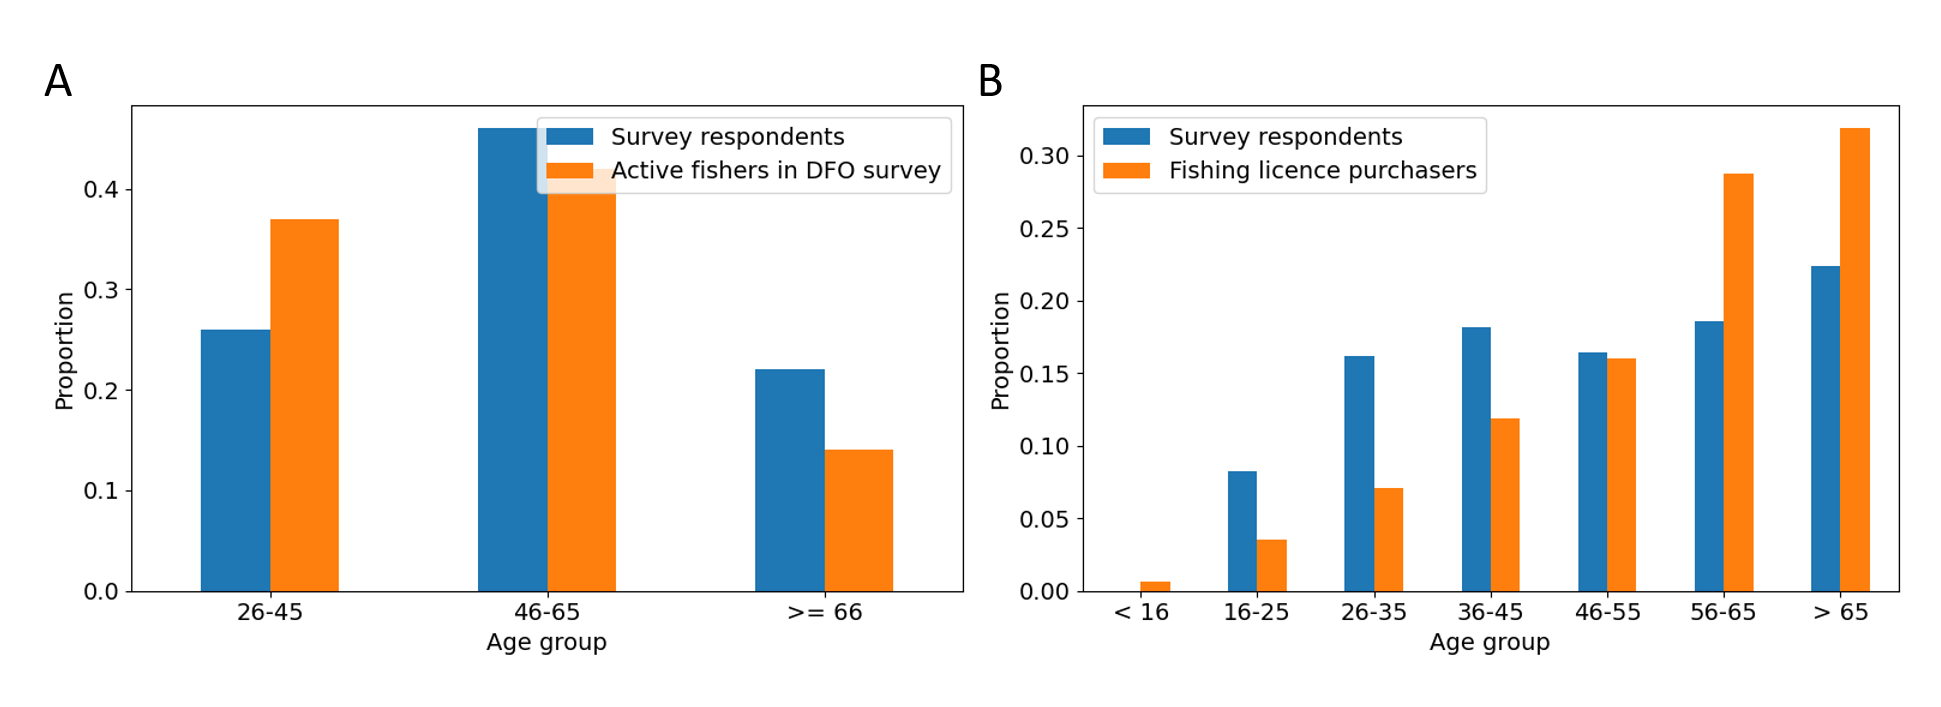
Of the 1,668 considered survey respondents across Canada, 90.1% were men and 9.9% were women. Email survey respondents represented around 0.06% of the Canadian active fishers in the year 2015 (about 2,831,000) and comprised a smaller fraction of women (21% women, [78]). Moreover, email survey respondents showed an older age distribution as compared to active fishers in the DFO survey of 2015, with 46% in the age group 46-65 years compared to 42% (45-64 years), 26% in the age group 26-45 years compared to 37% (25-44 years) and 22% in the age group 66 years and older compared to 14% (65 years and older) ([78], Fig. S1A). Like in the DFO survey, women were on average younger than men (45 years and 49 years in the DFO survey, [78]).
In the province of British Columbia, a higher fraction of email survey respondents than fishing license purchasers in 2021 were male (87% of 480 respondents vs. 77% of 270,120 purchasers, Fig. S1B). Email survey respondents were on average younger than fishing licence purchasers ( p < 0.001)(Fig. S1B).
3.2 Gender differences
Between the genders, significant differences were found in variables of all the considered categories.
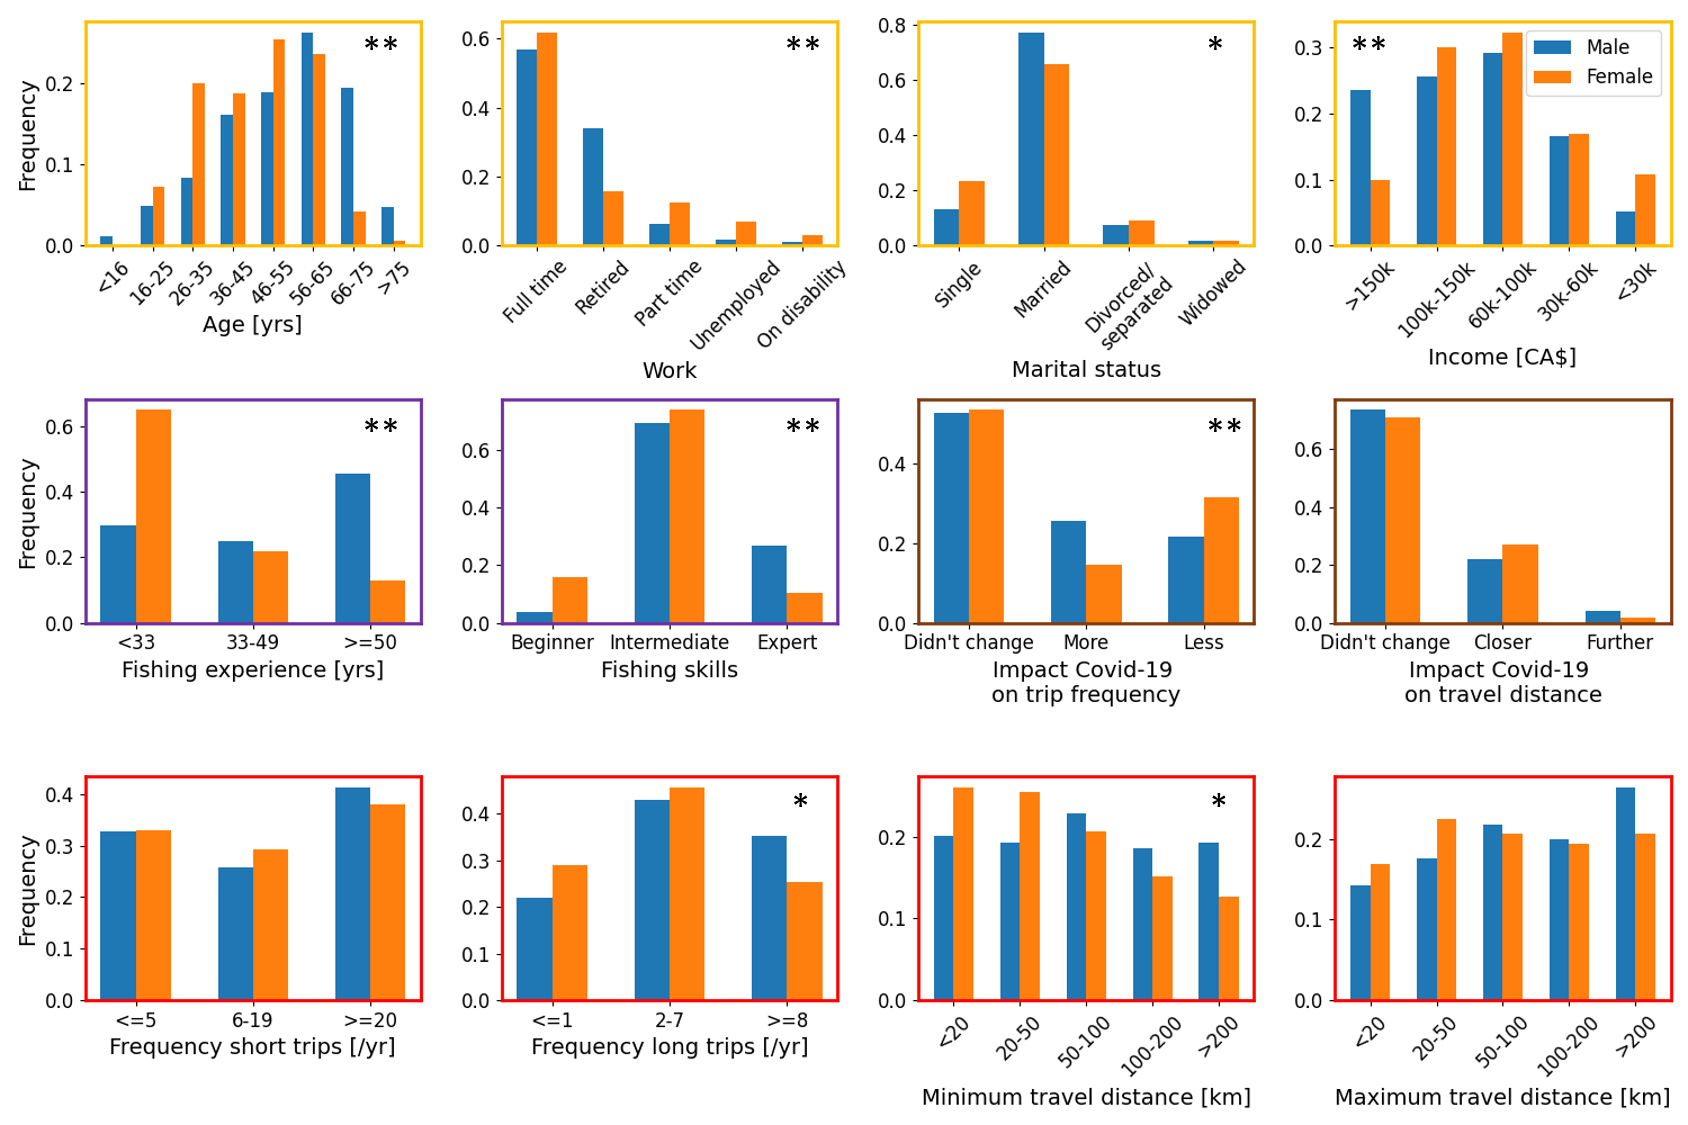
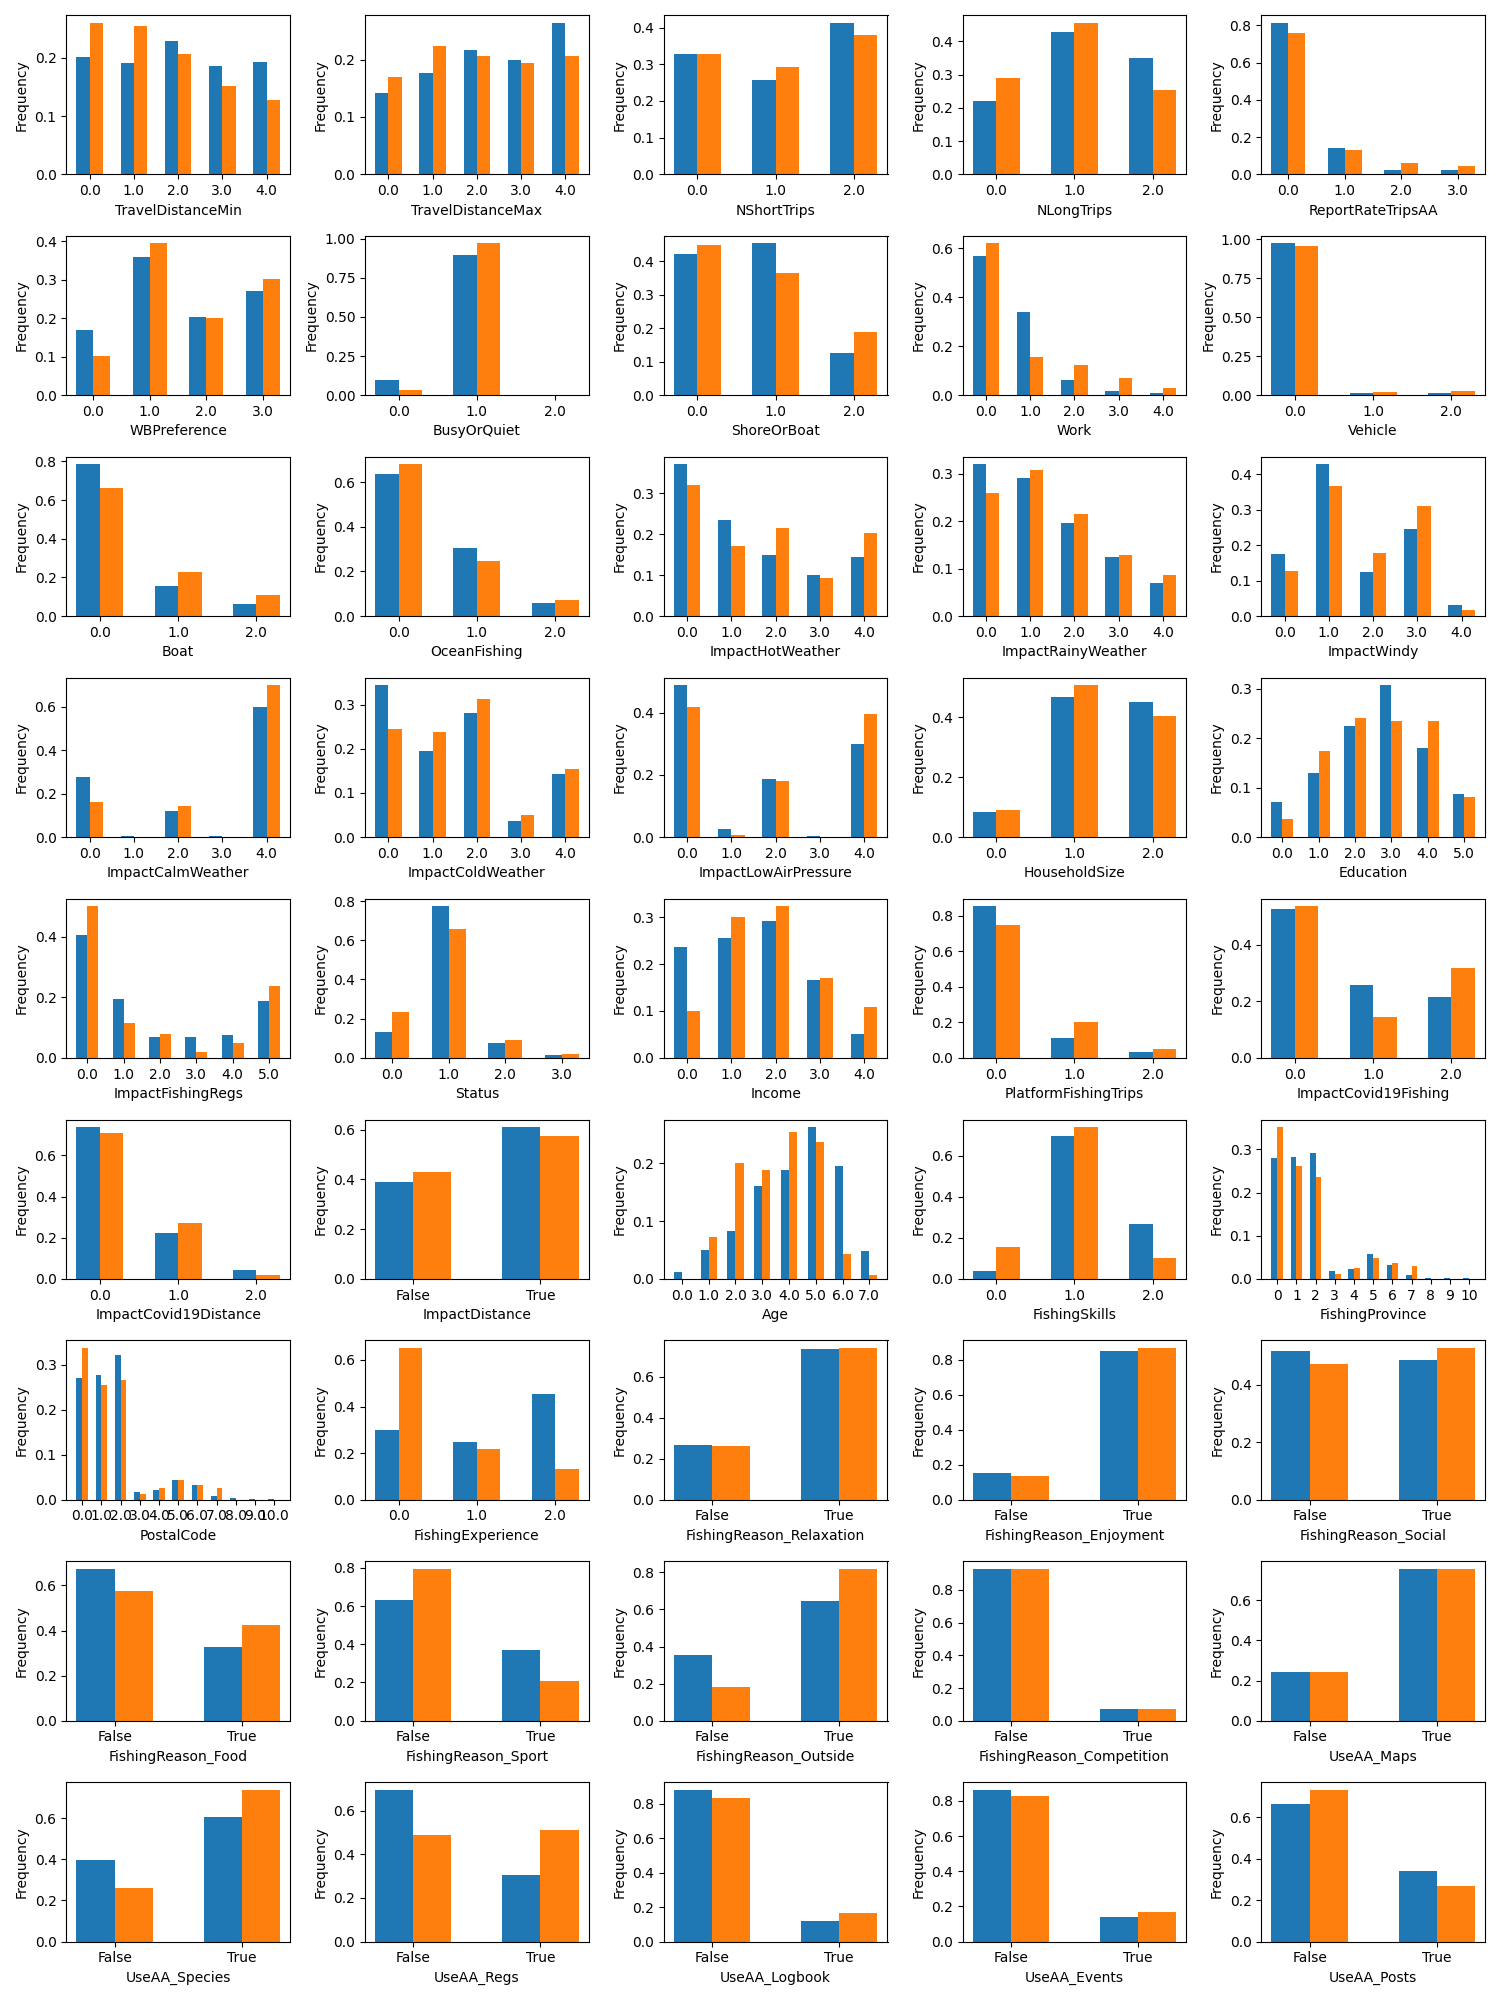
Regarding demographics and socioeconomic status, the distributions of the variables Age and Work differed ( p < 0.01, Table S1). The majority of men were in the age group 56-65 years, whereas women were mainly in the age group 46-55 years (Fig. 1). Most participants were employed full-time (57%), but more men were retired compared to women (34% vs. 16%), whereas more women were part-time employed or unemployed (19% vs. 8%, Fig. 1). Differences occurred also in the variables Marital status (p < 0.05), Income (p < 0.01) and Access to boat (p < 0.01, Table S1). Women had a higher proportion of the status single or divorced/separated (32% vs. 9%) and more men earned more than $150,000 per year (24% vs. 10%, Fig. 1). Men were more likely to have access to a boat (79% vs. 66%, Fig. S3). Independent of gender, most participants had a college, technical training or university degree (71%), a household size of two or more persons (92%), were married (76%) and earned between $60,000 and $150,000 per year (55%, Figs. 1, S3). Most fishers had always access to a vehicle (97%) and resided in the provinces of British Columbia, Alberta or Ontario (87%, Fig. S3).
Fishing characteristics differed significantly between women and men regarding the variables Fishing experience and Fishing skills ( p < 0.01) (Fig. S3). The Bayesian network revealed that in each level of Fishing experience, men dominated (Fig. S4A). 45% of the men reported having more than 50 years of fishing experience (vs. 13% of women, Fig. 1). The proportion of women increased from 3% in high Fishing experience (more than 50 years) to 18% in low Fishing experience (less than 33 years, Fig. S4A). Fishing skills were mostly intermediate regardless of gender (70%), but a higher fraction of women reported being beginners compared to men (16% vs. 4%), who reported more often being experts (69% vs. 10%, Fig. 1). Responses to the reasons for fishing were similar for both genders except that a higher fraction of women indicated the reasons “being outside” ( p < 0.01) and “food” (p < 0.05), and a higher fraction of men indicated “sport” as a reason (p < 0.01, Fig. S3. In general, reasons for fishing were relaxation (74%), enjoyment (85%) and being outside (66%) rather than fishing for food (34%), sport (35%) or competition (7%, Fig. S3). Most participants cited British Columbia, Alberta or Ontario as their main provinces for fishing trips (85%, Fig. S3).
Fisher behavior in terms of the frequencies of short-distance trips and the maximum travel distance did not significantly differ between women and men (Fig. 1). Men had more long-distance trips ( p < 0.05) and women tended to have shorter minimum travel distances (p < 0.05). Most respondents indicated to have more than 20 short-distance trips (41%) and two to seven long-distance trips per year (43%, Fig. 1).
Regarding the water-body environment, responses to preferred water-body type and ocean fishing were similar for both genders. Compared to men, a higher portion of women indicated that fishing regulations were not important (50% vs. 41%) or they preferred water bodies without regulations (24% vs. 19%, p < 0.01, Table S1, Fig. S3). More women compared to men preferred a quiet environment (90%, p < 0.01) and more men compared to women fished only from the boat (44%, p < 0.01) Independent of gender, most respondents preferred to fish in small lakes (36%) or had no preference for any particular water-body type (27%), and did not fish in the ocean in addition to freshwater (64%, Fig. S3).
In weather preferences, there were differences between the two genders regarding preferred hot, windy or calm conditions ( p < 0.05, Table S1, Fig. S3). The majority of respondents stated that hot weather is not important (37%) or they might cancel fishing in hot (23%) or windy weather (42%), that rainy weather has a medium impact on their decision about going fishing (49%), that they might or would usually fish in low air pressure (49%), that they would usually fish in calm weather (61%) and they might (28%) or would not care (33%) to fish in cold weather (Fig. S3).
See SI Results for the results regarding the usage of the Angler’s Atlas online platform.
3.3 Impact of Covid-19
Covid-19 had different effects on the frequency of fishing between genders ( p < 0.01, Table S1) and effects on the travel distance were similar. Women tended to go fishing more often due to Covid-19 (32%) compared to men (26%), while a higher fraction of men went fishing less often (22% men vs. 15% women) (Fig. 1). Most respondents indicated that Covid-19 did not affect their travel distance (73%, Fig. 1).
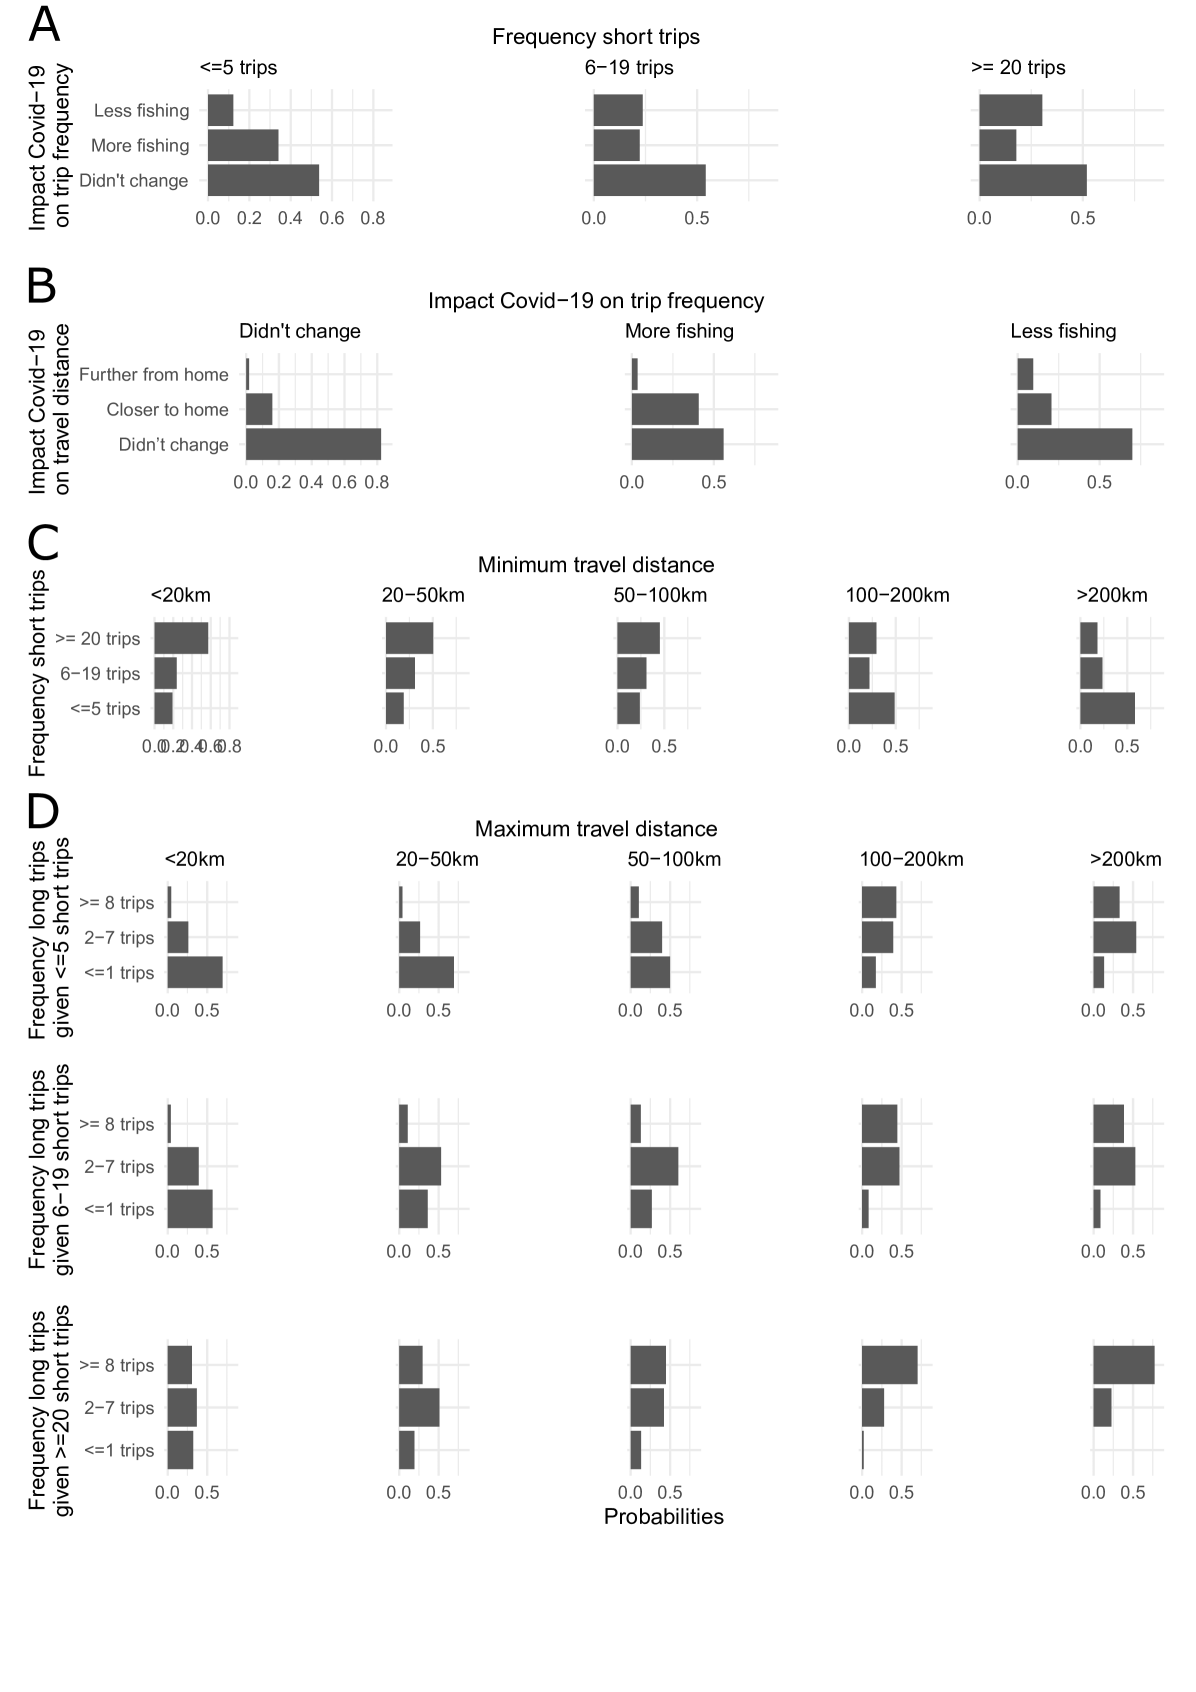
Additionally, the frequency of fishing trips remained the same for more than half of the fishers during Covid-19 (53%, Fig. 1, irrespective of how active they were (Fig. 3A). If Covid-19 caused a change, fishers with lower trip frequency (less than six short-distance trips per year) went fishing more often (74%), and fishers with a high trip frequency (more than 20 short-distance trips per year) went fishing less often (63%).
3.4 Variables related to fishing effort
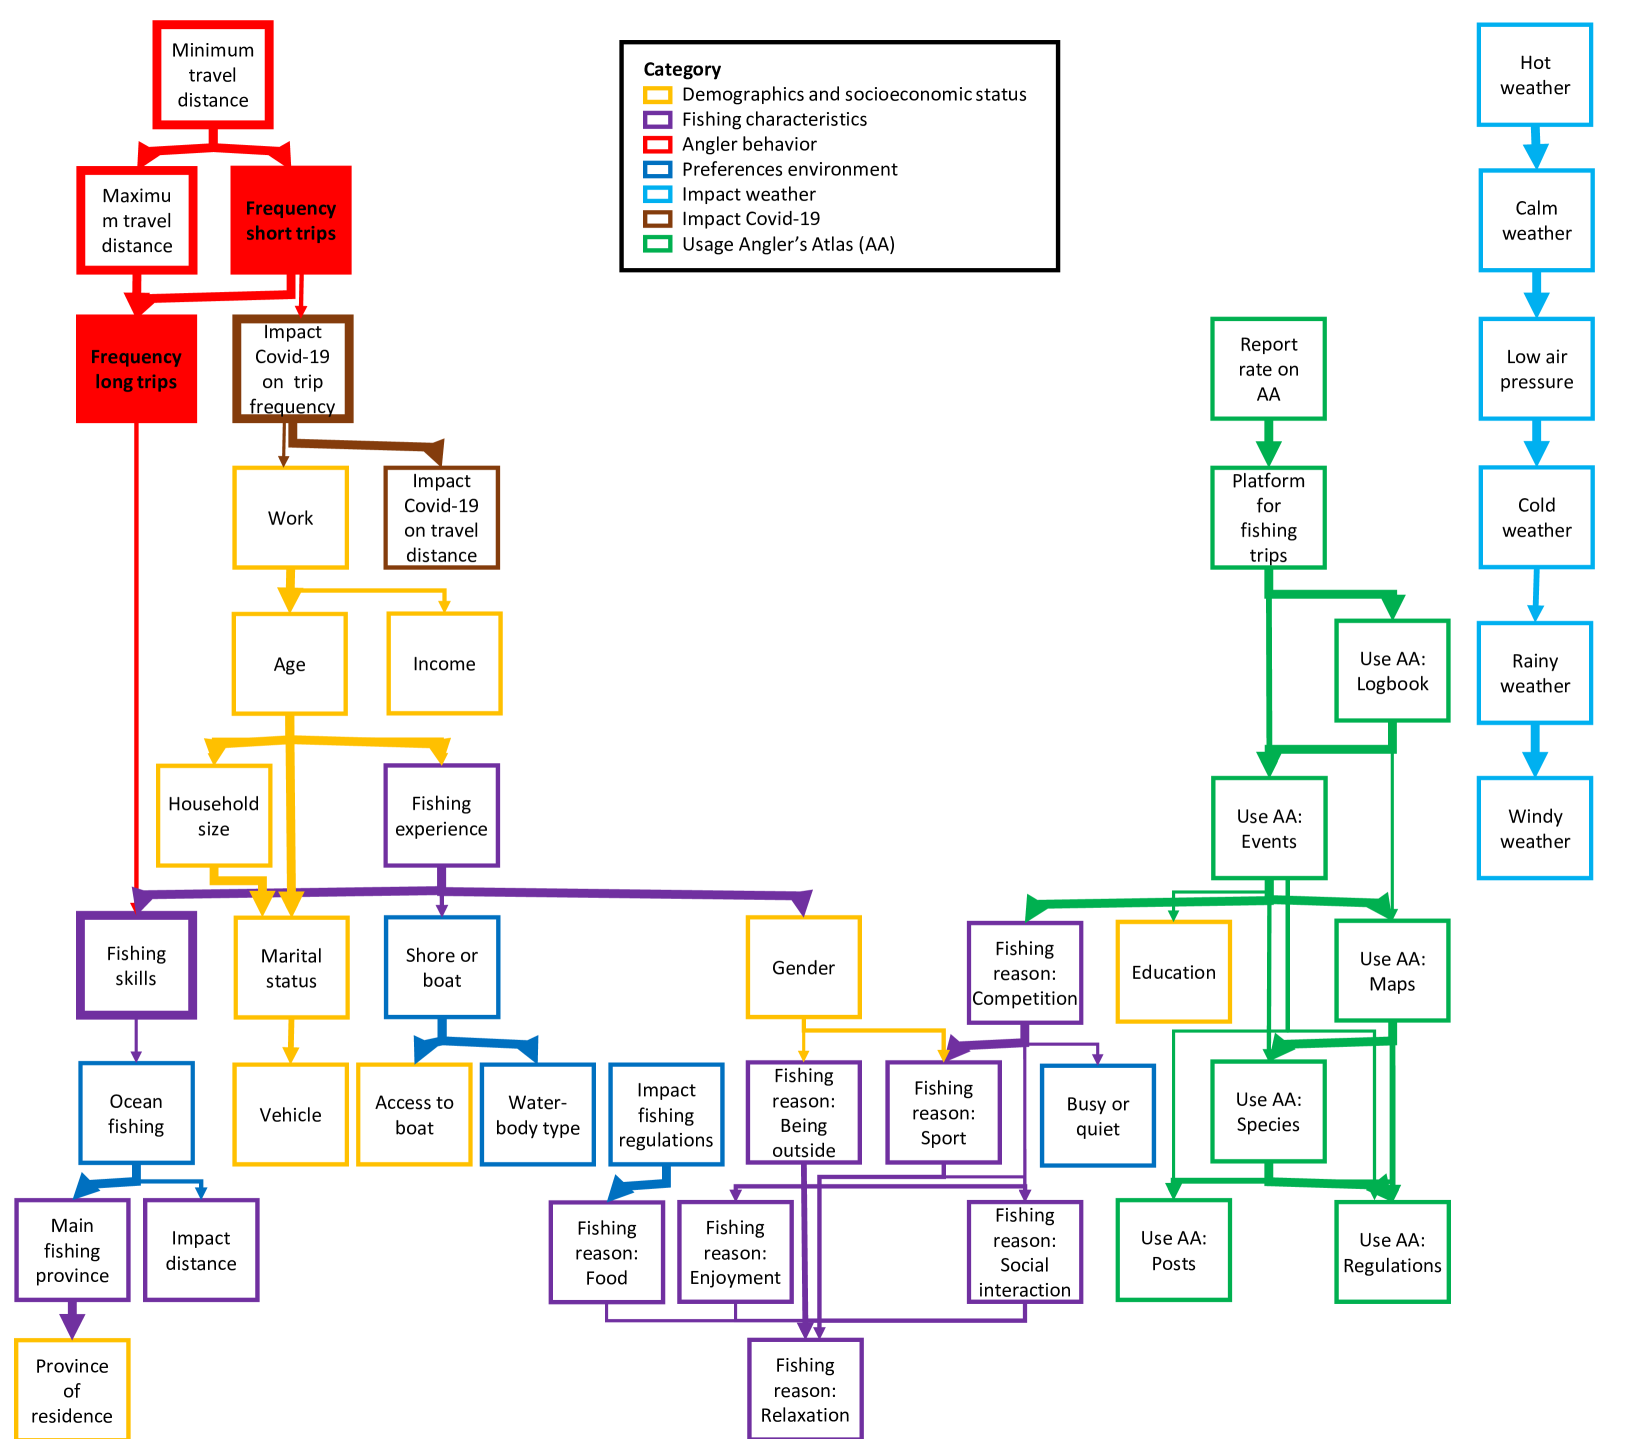
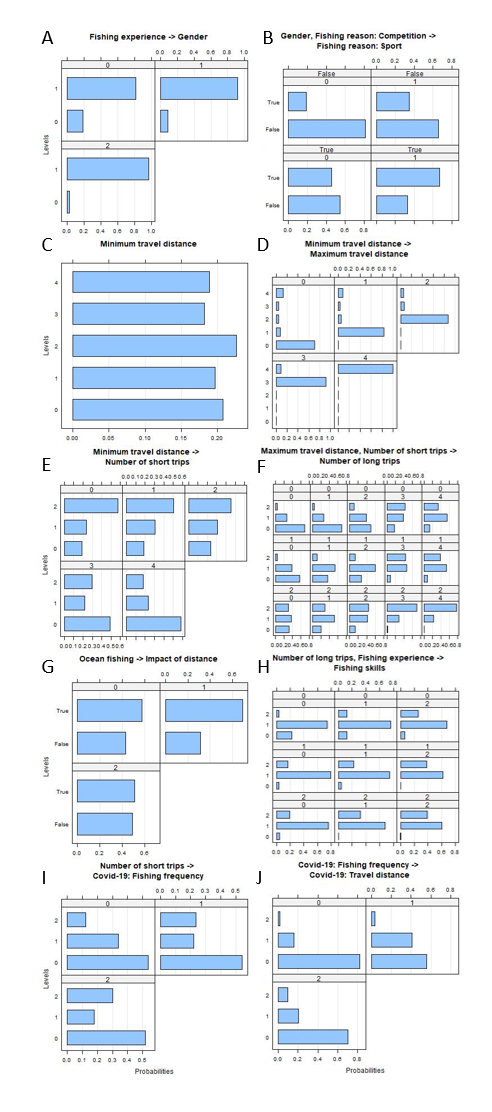
The Bayesian network enabled to detect direct and indirect relationships as well as dependence strengths between the variables. Direct conditional dependencies occurred in the network mostly between variables of the same category (e.g., “Demographics and socioeconomic status" or “Fishing characteristics", Fig. 2). Strong relationships between variables were found in the category “Fisher behavior" and in the category “Impact weather". Variables on preferences regarding the water body environment (e.g., busy or quiet environment) were scattered in the network and connected to variables of different categories. “Impact weather" variables were not related to variables of other categories.
Fishing effort was directly related to travel distance, fishing skills and the impact of Covid-19 on trip frequency.
Relationships between fishing skills and fishing effort: Most fishers indicated to have intermediate fishing skills, independent from fishing experience and the long-distance trip frequency. Fishers doing more than eight long-distance trips per year were likelier to indicate being fishing experts than fishers with fewer long-distance trips, irrespective of their fishing experience (Fig. S4H).
Relationships between travel distance and fishing effort: Travel distances were directly related to the frequency of fishing trips (Fig. 2). Minimum and maximum travel distance were the only variables that trip frequencies were strongly dependent on. The minimum and maximum travel distance of a respondent were mostly in the same range. For instance, if the minimum travel distance was less than 20 km, it was very likely that the maximum travel distance was also less than 20 km (Fig. S4D). The shorter the minimum travel distance was, the more likely the fisher did at least 20 short-distance trips per year (<100 km distance) (Fig. 3C). Most fishers with at least 20 short-distance trips per year had also more than eight long-distance trips per year (>100 km distance) (Fig. 3D). 61% of the fishers cared about the distance when choosing the water body (Fig. S3), but the distance became less relevant if the fisher did mainly ocean fishing (Fig. S4G).
4 Discussion
An online survey combined with Bayesian networks made it possible to identify variables directly related to fishing effort and the role of gender among participating fishers.
Most variables in fishing preferences and fishing effort were similar between genders although demographics, socioeconomic status and fishing skills differed. Fishing effort, in terms of annual trip frequency, and travel distances differed in the minimum travel distance and the frequency of long-distance trips between the genders. Covid-19 impacted the fishing activity of almost half of the respondents, whereby female or less-active fishers tended to increase the number of short-distance trips, and male fishers or very active fishers tended to decrease their short-distance trip frequency. The main determinant of trip frequency was trip distance, which negatively impacted the fishing activity of more than half of the fishers. Besides trip distance, fishing experience and fishing skills were associated with long-distance fishing frequency. Water-body environment and weather preferences as well as fishing reasons were only indirectly or not related to fishing efforts.
The underrepresentation of women in the online survey aligns with the findings of previous studies ([79, 60]), whereby barriers such as less leisure time due to family responsibilities, limited education and technical training, traditional gender roles, and power imbalances were identified ([65, 97, 104, 76, 79]). This study specifically examined active fishers who were able to participate despite potential challenges or restrictions. Significant gender differences in fishing effort and reasons were anticipated, however, the results challenge the idea that these factors consistently limit women’s engagement. For example, despite disparities in age, work, income, and fishing experience, the frequency of short fishing trips was similar between genders. This indicates that initial barriers to participation in fishing, rather than persistent socio-economic or role-related constraints, are the main cause of gender differences in fishing. Further investigation into the factors that enable women to overcome these barriers, such as the presence of support networks or autonomy, is needed.
Regardless of gender, the fishing preferences and reasons of respondents aligned with findings from previous studies. Most respondents fished for relaxation, enjoyment and a connection to nature rather than food or competition. They also preferred calm fishing environments, which is consistent with studies from the central United States and the West Coast ([88, 111]). These similarities suggest that our sample represents a diverse range of recreational fishers, as seen in broader studies.
The impact of Covid-19 on fishing effort was related to gender and activity level of the fisher. The fact that Covid-19 led to a change of fishing participation and fishing effort was also reported in previous studies ([89, 98, 66, 61]). Previous studies focused on possible reasons for changes in fishing activity such as improved mental and physical health and the listing of fishing as an essential activity for more fishing activity, or uncertain accessibility and the closure of national parks for reduced fishing activity due to Covid-19 ([89, 100]), but they did not distinguish between fishers of different demographic backgrounds or socioeconomic status in their analyses.
The strong connection between fishing effort to the travel distance is in agreement with previous studies in which most fishers chose water bodies in close proximity for their fishing activity ([69, 92]). These studies focused on reasons for specific water body choices of fishers, but did not analyze whether and how the distance affected their trip frequency. The connection between fishing experience, fishing skills and long-distance fishing frequency can be explained by the fact that highly specialized fishers would do long travel-distances trips for specific target fish species, catch rates and bag limits ([69, 95, 73]).
Responses on the impact of different weather conditions on fishing activity were not related to fishing effort. Fisher satisfaction and activity was also independent from weather conditions such as wind speed and maximum air temperature in previous studies ([90, 84]). Still, the email survey showed that some fishers would cancel their fishing trip at certain weather conditions. The missing dependencies between weather and fishing effort in the Bayesian network were likely due to the missing information of the actual weather conditions at fisher’s water bodies of choice. Moreover, the network showed independence between weather preferences and preferences regarding the water body environment and fishing reasons. This suggests that weather conditions could provide additional useful information for predicting fisher behavior.
The data represented only angler behavior of a subgroup of fishers in Canada. The sampling method was convenience sampling, meaning that the email survey was only sent to fishers who had signed up for the Angler’s Atlas platform newsletter, and the analysis only included responses from fishers who responded to the email and were willing to share their information, which represents approximately 0.06% of the active fishers in Canada in the year 2015 ([78, 75]). A younger age distribution of email survey participants compared to fishing licence purchasers in the province of British Columbia is consistent with a previous study ([83]). The main provinces of residency of email survey respondents (British Columbia, Alberta and Ontario) were different from the DFO survey in 2015 (Ontario and Quebec, [78]). The smaller participation of the French part of Canada could result from the fact that the online platform is only available in English, and, hence, less promoted and used in the province of Quebec. Moreover, only residents of Canada were considered in this study, but a substantial part of recreational fishers in Canada are non-residential ([78]). Although the identified factors influencing fisher behavior may be biased, the results provide valuable information about a subgroup of fishers that can be useful for analyzing the entire social system.
To validate the generality of the identified relationships, future studies can compare Bayesian networks based on data from similar surveys in different countries or different subgroups of fishers such as fishing license buyers. Moreover, the presented methodological approach can be extended to analyze not only fishing effort but also variables related to fishing participation by applying Bayesian networks to a broader group using fishing survey data of all residents, not only active fishers.
The Bayesian network can also be used to make predictions of fishing effort in specific regions, given a set of variables from the fishers living in that region. For instance, knowing the number of fishers in a region and their minimum travel distances can be used to predict the number of annual short- and long-distance trips, and thus the total annual fisher pressure in the region ([77]). Other incomplete subsets of the variables in the network can be used to make these predictions. Such predictions can help improve inclusivity and fishers management.
The findings highlight the need to incorporate gender differences in social-ecological models to avoid misrepresenting human behavior and undermining resource management. While fishing effort was similar among women and men, socio-economic and behavioral differences shaped their participation and responses to external factors such as Covid-19. Ignoring these differences risks ineffective policies and unequal access to fishing opportunities. Recognizing these patterns is critical for equitable policy-making and accurate socio-ecological models, ensuring sustainable management while maintaining social and economic benefits.
5 Acknowledgements
We acknowledge the support of the Government of Canada’s New Frontiers in Research Fund (NFRF), NFRFR-2021-00265. We thank Adrian Clarke and Adeleida Bingham from the Freshwater Fisheries Society of BC for providing the numbers of fishing licence sales in British Columbia, Canada. PR acknowledges funding from an NSERC Discovery Grant RGPIN-2022-05199.
6 Data Availability Statement
The data that support the findings of this study are available on request from the corresponding author. The data are not publicly available due to privacy or ethical restrictions.
7 Conflict of Interest Statement
The authors declare no conflict of interest.
References
- [1] R Arlinghaus et al. “Understanding and managing freshwater recreational fisheries as complex adaptive social-ecological systems” In Reviews in Fisheries Science & Aquaculture 25.1 Taylor & Francis, 2017, pp. 1–41
- [2] Robert Arlinghaus and Steven J Cooke “Recreational fisheries: socioeconomic importance, conservation issues and management challenges” In Recreational hunting, conservation and rural livelihoods: science and practice Wiley Online Library, 2009, pp. 39–58
- [3] Robert Arlinghaus and Thomas Mehner “Socio-economic characterisation of specialised common carp (Cyprinus carpio L.) anglers in Germany, and implications for inland fisheries management and eutrophication control” In Fisheries Research 61.1-3 Elsevier, 2003, pp. 19–33
- [4] Robert Arlinghaus and Thomas Mehner “A management-orientated comparative analysis of urban and rural anglers living in a metropolis (Berlin, Germany)” In Environmental Management 33 Springer, 2004, pp. 331–344
- [5] Asta Audzijonyte et al. “High-resolution app data reveal sustained increases in recreational fishing effort in Europe during and after COVID-19 lockdowns” In Royal Society Open Science 10.7 The Royal Society, 2023, pp. 230408
- [6] Victor C Barcellini, Fabio S Motta, Alessandra M Martins and Pietro S Moro “Recreational anglers and fishing guides from an estuarine protected area in southeastern Brazil: Socioeconomic characteristics and views on fisheries management” In Ocean & Coastal Management 76 Elsevier, 2013, pp. 23–29
- [7] Stefano Beretta et al. “Learning the structure of bayesian networks: A quantitative assessment of the effect of different algorithmic schemes” In Complexity 2018 Hindawi, 2018
- [8] Max Birdsong, Len M Hunt and Robert Arlinghaus “Recreational angler satisfaction: What drives it?” In Fish and Fisheries 22.4 Wiley Online Library, 2021, pp. 682–706
- [9] Kirsten Bradford, Cailyn Siider and Sarah Harper “Charting an Inclusive Future: A Discussion about Gender Equitable Small-Scale Fisheries Management in Canada” Too big to ignore, St John’s, Newfoundland, Canada, 2023
- [10] J Robert Britton et al. “Global responses to the COVID-19 pandemic by recreational anglers: considerations for developing more resilient and sustainable fisheries” In Reviews in Fish Biology and Fisheries 33.4 Springer, 2023, pp. 1095–1111
- [11] Bradley M Broom, Kim-Anh Do and Devika Subramanian “Model averaging strategies for structure learning in Bayesian networks with limited data” In BMC bioinformatics 13 Springer, 2012, pp. 1–18
- [12] Jacob W Brownscombe et al. “The future of recreational fisheries: advances in science, monitoring, management, and practice” In Fisheries Research 211 Elsevier, 2019, pp. 247–255
- [13] Edward V Camp, Robert NM Ahrens, Chelsey Crandall and Kai Lorenzen “Angler travel distances: Implications for spatial approaches to marine recreational fisheries governance” In Marine Policy 87 Elsevier, 2018, pp. 263–274
- [14] JEe Cinner and TR McClanahan “Socioeconomic factors that lead to overfishing in small-scale coral reef fisheries of Papua New Guinea” In Environmental conservation 33.1 Cambridge University Press, 2006, pp. 73–80
- [15] Anthony Costa Constantinou, Norman Fenton, William Marsh and Lukasz Radlinski “From complex questionnaire and interviewing data to intelligent Bayesian network models for medical decision support” In Artificial intelligence in medicine 67 Elsevier, 2016, pp. 75–93
- [16] Tomasz K Czarkowski, Arkadiusz Wołos and Andrzej Kapusta “Socio-economic portrait of Polish anglers: Implications for recreational fisheries management in freshwater bodies” In Aquatic Living Resources 34 EDP Sciences, 2021, pp. 19
- [17] Kora Dabrowksa, Len M Hunt and Wolfgang Haider “Understanding how angler characteristics and context influence angler preferences for fishing sites” In North American Journal of Fisheries Management 37.6 Taylor & Francis, 2017, pp. 1350–1361
- [18] Robert B Ditton and Stephen G Sutton “Substitutability in recreational fishing” In Human Dimensions of Wildlife 9.2 Taylor & Francis, 2004, pp. 87–102
- [19] Ilker Etikan, Sulaiman Abubakar Musa and Rukayya Sunusi Alkassim “Comparison of convenience sampling and purposive sampling” In American journal of theoretical and applied statistics 5.1 New York, 2016, pp. 1–4
- [20] Anthony J Fedler and Robert B Ditton “Dropping out and dropping in: a study of factors for changing recreational fishing participation” In North American Journal of Fisheries Management 21.2 Taylor & Francis, 2001, pp. 283–292
- [21] Samuel M Fischer et al. “Boosting propagule transport models with individual-specific data from mobile apps” In Journal of Applied Ecology 60.5 Wiley Online Library, 2023, pp. 934–949
- [22] Fisheries and Oceans Canada “Survey of Recreational Fishing in Canada, 2015”, 2019
- [23] Myron F Floyd et al. “Social stratification in recreational fishing participation: Research and policy implications” In Leisure Sciences 28.4 Taylor & Francis, 2006, pp. 351–368
- [24] Nir Friedman “Learning belief networks in the presence of missing values and hidden variables” In Icml 97.July, 1997, pp. 125–133 Berkeley, CA
- [25] Nir Friedman, Moises Goldszmidt and Abraham Wyner “Data analysis with Bayesian networks: A bootstrap approach” In arXiv preprint arXiv:1301.6695, 2013
- [26] José A Gámez, Juan L Mateo and José M Puerta “Learning Bayesian networks by hill climbing: efficient methods based on progressive restriction of the neighborhood” In Data Mining and Knowledge Discovery 22 Springer, 2011, pp. 106–148
- [27] Casper Gundelund et al. “Insights into the users of a citizen science platform for collecting recreational fisheries data” In Fisheries Research 229, 2020, pp. 105597 DOI: 10.1016/j.fishres.2020.105597
- [28] Casper Gundelund et al. “Investigating angler satisfaction: the relevance of catch, motives and contextual conditions” In Fisheries Research 250 Elsevier, 2022, pp. 106294
- [29] Kasper Daniel Hansen et al. “Rgraphviz: Provides plotting capabilities for R graph objects” R package version 2.46.0, 2023 DOI: 10.18129/B9.bioc.Rgraphviz
- [30] Jerónimo Hernández-González, Inaki Inza and Jose A Lozano “Learning Bayesian network classifiers from label proportions” In Pattern Recognition 46.12 Elsevier, 2013, pp. 3425–3440
- [31] Phil Hickley and Helena Tompkins “Recreational fisheries: social, economic, and management aspects” Fishing News Books Oxford, UK, 1998
- [32] Matthew P Hinrichs, Mark P Vrtiska, Mark A Pegg and Christopher J Chizinski “Motivations to participate in hunting and angling: a comparison among preferred activities and state of residence” In Human Dimensions of Wildlife 26.6 Taylor & Francis, 2021, pp. 576–595
- [33] Andrew Howarth et al. “COVID-19 restrictions and recreational fisheries in Ontario, Canada: preliminary insights from an online angler survey” In Fisheries Research 240 Elsevier, 2021, pp. 105961
- [34] Len M Hunt, Barry N Boots and Peter C Boxall “Predicting fishing participation and site choice while accounting for spatial substitution, trip timing, and trip context” In North American Journal of Fisheries Management 27.3 Taylor & Francis, 2007, pp. 832–847
- [35] S. Imoto et al. “Bootstrap Analysis of Gene Networks Based on Bayesian Networks and Nonparametric Regression” In Genome Informatics 13, 2002, pp. 369–370
- [36] Ali Jalali et al. “Angling to reach a destination to fish—Exploring the land and water travel dynamics of recreational fishers in Port Phillip Bay, Australia” In Frontiers in Marine Science 8 Frontiers, 2022, pp. 793074
- [37] Danika Kleiber, Leila M Harris and Amanda CJ Vincent “Gender and small-scale fisheries: a case for counting women and beyond” In Fish and Fisheries 16.4 Wiley Online Library, 2015, pp. 547–562
- [38] Daphne Koller and Nir Friedman “Probabilistic graphical models: principles and techniques” MIT press, 2009
- [39] W-C Lewin, MS Weltersbach, K Haase and HV Strehlow “Who travels how far: German Baltic sea anglers’ travel distances as precondition for fisheries management and coastal spatial planning” In Ocean & Coastal Management 209 Elsevier, 2021, pp. 105640
- [40] Yingying Ma, Siyuan Lu and Yuanyuan Zhang “Analysis on illegal crossing behavior of pedestrians at signalized intersections based on Bayesian network” In Journal of advanced transportation 2020 Hindawi Limited, 2020, pp. 1–14
- [41] Molly Mayer and Céline Le Bourdais “Sharing parental leave among dual-earner couples in Canada: Does reserved paternity leave make a difference?” In Population Research and Policy Review 38.2 Springer, 2019, pp. 215–239
- [42] Stephen R Midway et al. “COVID-19 influences on US recreational angler behavior” In PLoS One 16.8 Public Library of Science San Francisco, CA USA, 2021, pp. e0254652
- [43] Nina Marlene Mostegl “Where is the catch? A closer look into the fishing surveys of British Columbia to reveal angler motivation and satisfaction” Simon Fraser University, 2011
- [44] Yves Paradis, Simon Bernatchez, Dominique Lapointe and Steven J Cooke “Can you fish in a pandemic? An overview of recreational fishing management policies in North America during the COVID-19 crisis” In Fisheries 46.2 Wiley Online Library, 2021, pp. 81–85
- [45] Pouria Ramazi, Mélodie Kunegel-Lion, Russell Greiner and Mark A Lewis “Predicting insect outbreaks using machine learning: A mountain pine beetle case study” In Ecology and evolution 11.19 Wiley Online Library, 2021, pp. 13014–13028
- [46] Pouria Ramazi, Mélodie Kunegel-Lion, Russell Greiner and Mark A. Lewis “Exploiting the full potential of Bayesian networks in predictive ecology” In Methods in Ecology and Evolution 12 British Ecological Society, 2021, pp. 135–149 DOI: 10.1111/2041-210X.13509
- [47] EM Ann Rees et al. “Socio-economic drivers of specialist anglers targeting the non-native European catfish (Silurus glanis) in the UK” In PloS one 12.6 Public Library of Science San Francisco, CA USA, 2017, pp. e0178805
- [48] Pekka Salmi and Kirsi Sonck-Rautio “Invisible work, ignored knowledge? Changing gender roles, division of labor, and household strategies in Finnish small-scale fisheries” In Maritime Studies 17.2 Springer, 2018, pp. 213–221
- [49] Valerio Sbragaglia et al. “Preparing recreational fisheries for the uncertain future: An update of progress towards answering the 100 most pressing research questions” In Fisheries Research 263, 2023, pp. 106662 DOI: https://doi.org/10.1016/j.fishres.2023.106662
- [50] Mauro Scanagatta, Antonio Salmerón and Fabio Stella “A survey on Bayesian network structure learning from data” In Progress in Artificial Intelligence 8 Springer, 2019, pp. 425–439
- [51] Susan A Schroeder, David C Fulton, Leigh Currie and Tim Goeman “He said, she said: Gender and angling specialization, motivations, ethics, and behaviors” In Human Dimensions of Wildlife 11.5 Taylor & Francis, 2006, pp. 301–315
- [52] Marco Scutari “Learning Bayesian networks with the bnlearn R package” In arXiv preprint arXiv:0908.3817, 2009
- [53] Wenzhu Song et al. “Using Bayesian networks with Max-Min Hill-Climbing algorithm to detect factors related to multimorbidity” In Frontiers in Cardiovascular Medicine 9, 2022 DOI: 10.3389/fcvm.2022.984883
- [54] Matthew AL Young, Simon Foale and David R Bellwood “Why do fishers fish? A cross-cultural examination of the motivations for fishing” In Marine Policy 66 Elsevier, 2016, pp. 114–123
- [55] Talia Young et al. “Adaptation strategies of coastal fishing communities as species shift poleward” In ICES Journal of Marine Science 76.1 Oxford University Press, 2019, pp. 93–103
- [56] Jinlong Zhao et al. “Risk assessment of safety level in university laboratories using questionnaire and Bayesian network” In Journal of Loss Prevention in the Process Industries 83 Elsevier, 2023, pp. 105054
References
- [57] R Arlinghaus et al. “Understanding and managing freshwater recreational fisheries as complex adaptive social-ecological systems” In Reviews in Fisheries Science & Aquaculture 25.1 Taylor & Francis, 2017, pp. 1–41
- [58] Robert Arlinghaus and Steven J Cooke “Recreational fisheries: socioeconomic importance, conservation issues and management challenges” In Recreational hunting, conservation and rural livelihoods: science and practice Wiley Online Library, 2009, pp. 39–58
- [59] Robert Arlinghaus and Thomas Mehner “Socio-economic characterisation of specialised common carp (Cyprinus carpio L.) anglers in Germany, and implications for inland fisheries management and eutrophication control” In Fisheries Research 61.1-3 Elsevier, 2003, pp. 19–33
- [60] Robert Arlinghaus and Thomas Mehner “A management-orientated comparative analysis of urban and rural anglers living in a metropolis (Berlin, Germany)” In Environmental Management 33 Springer, 2004, pp. 331–344
- [61] Asta Audzijonyte et al. “High-resolution app data reveal sustained increases in recreational fishing effort in Europe during and after COVID-19 lockdowns” In Royal Society Open Science 10.7 The Royal Society, 2023, pp. 230408
- [62] Victor C Barcellini, Fabio S Motta, Alessandra M Martins and Pietro S Moro “Recreational anglers and fishing guides from an estuarine protected area in southeastern Brazil: Socioeconomic characteristics and views on fisheries management” In Ocean & Coastal Management 76 Elsevier, 2013, pp. 23–29
- [63] Stefano Beretta et al. “Learning the structure of bayesian networks: A quantitative assessment of the effect of different algorithmic schemes” In Complexity 2018 Hindawi, 2018
- [64] Max Birdsong, Len M Hunt and Robert Arlinghaus “Recreational angler satisfaction: What drives it?” In Fish and Fisheries 22.4 Wiley Online Library, 2021, pp. 682–706
- [65] Kirsten Bradford, Cailyn Siider and Sarah Harper “Charting an Inclusive Future: A Discussion about Gender Equitable Small-Scale Fisheries Management in Canada” Too big to ignore, St John’s, Newfoundland, Canada, 2023
- [66] J Robert Britton et al. “Global responses to the COVID-19 pandemic by recreational anglers: considerations for developing more resilient and sustainable fisheries” In Reviews in Fish Biology and Fisheries 33.4 Springer, 2023, pp. 1095–1111
- [67] Bradley M Broom, Kim-Anh Do and Devika Subramanian “Model averaging strategies for structure learning in Bayesian networks with limited data” In BMC bioinformatics 13 Springer, 2012, pp. 1–18
- [68] Jacob W Brownscombe et al. “The future of recreational fisheries: advances in science, monitoring, management, and practice” In Fisheries Research 211 Elsevier, 2019, pp. 247–255
- [69] Edward V Camp, Robert NM Ahrens, Chelsey Crandall and Kai Lorenzen “Angler travel distances: Implications for spatial approaches to marine recreational fisheries governance” In Marine Policy 87 Elsevier, 2018, pp. 263–274
- [70] JEe Cinner and TR McClanahan “Socioeconomic factors that lead to overfishing in small-scale coral reef fisheries of Papua New Guinea” In Environmental conservation 33.1 Cambridge University Press, 2006, pp. 73–80
- [71] Anthony Costa Constantinou, Norman Fenton, William Marsh and Lukasz Radlinski “From complex questionnaire and interviewing data to intelligent Bayesian network models for medical decision support” In Artificial intelligence in medicine 67 Elsevier, 2016, pp. 75–93
- [72] Tomasz K Czarkowski, Arkadiusz Wołos and Andrzej Kapusta “Socio-economic portrait of Polish anglers: Implications for recreational fisheries management in freshwater bodies” In Aquatic Living Resources 34 EDP Sciences, 2021, pp. 19
- [73] Kora Dabrowksa, Len M Hunt and Wolfgang Haider “Understanding how angler characteristics and context influence angler preferences for fishing sites” In North American Journal of Fisheries Management 37.6 Taylor & Francis, 2017, pp. 1350–1361
- [74] Robert B Ditton and Stephen G Sutton “Substitutability in recreational fishing” In Human Dimensions of Wildlife 9.2 Taylor & Francis, 2004, pp. 87–102
- [75] Ilker Etikan, Sulaiman Abubakar Musa and Rukayya Sunusi Alkassim “Comparison of convenience sampling and purposive sampling” In American journal of theoretical and applied statistics 5.1 New York, 2016, pp. 1–4
- [76] Anthony J Fedler and Robert B Ditton “Dropping out and dropping in: a study of factors for changing recreational fishing participation” In North American Journal of Fisheries Management 21.2 Taylor & Francis, 2001, pp. 283–292
- [77] Samuel M Fischer et al. “Boosting propagule transport models with individual-specific data from mobile apps” In Journal of Applied Ecology 60.5 Wiley Online Library, 2023, pp. 934–949
- [78] Fisheries and Oceans Canada “Survey of Recreational Fishing in Canada, 2015”, 2019
- [79] Myron F Floyd et al. “Social stratification in recreational fishing participation: Research and policy implications” In Leisure Sciences 28.4 Taylor & Francis, 2006, pp. 351–368
- [80] Nir Friedman “Learning belief networks in the presence of missing values and hidden variables” In Icml 97.July, 1997, pp. 125–133 Berkeley, CA
- [81] Nir Friedman, Moises Goldszmidt and Abraham Wyner “Data analysis with Bayesian networks: A bootstrap approach” In arXiv preprint arXiv:1301.6695, 2013
- [82] José A Gámez, Juan L Mateo and José M Puerta “Learning Bayesian networks by hill climbing: efficient methods based on progressive restriction of the neighborhood” In Data Mining and Knowledge Discovery 22 Springer, 2011, pp. 106–148
- [83] Casper Gundelund et al. “Insights into the users of a citizen science platform for collecting recreational fisheries data” In Fisheries Research 229, 2020, pp. 105597 DOI: 10.1016/j.fishres.2020.105597
- [84] Casper Gundelund et al. “Investigating angler satisfaction: the relevance of catch, motives and contextual conditions” In Fisheries Research 250 Elsevier, 2022, pp. 106294
- [85] Kasper Daniel Hansen et al. “Rgraphviz: Provides plotting capabilities for R graph objects” R package version 2.46.0, 2023 DOI: 10.18129/B9.bioc.Rgraphviz
- [86] Jerónimo Hernández-González, Inaki Inza and Jose A Lozano “Learning Bayesian network classifiers from label proportions” In Pattern Recognition 46.12 Elsevier, 2013, pp. 3425–3440
- [87] Phil Hickley and Helena Tompkins “Recreational fisheries: social, economic, and management aspects” Fishing News Books Oxford, UK, 1998
- [88] Matthew P Hinrichs, Mark P Vrtiska, Mark A Pegg and Christopher J Chizinski “Motivations to participate in hunting and angling: a comparison among preferred activities and state of residence” In Human Dimensions of Wildlife 26.6 Taylor & Francis, 2021, pp. 576–595
- [89] Andrew Howarth et al. “COVID-19 restrictions and recreational fisheries in Ontario, Canada: preliminary insights from an online angler survey” In Fisheries Research 240 Elsevier, 2021, pp. 105961
- [90] Len M Hunt, Barry N Boots and Peter C Boxall “Predicting fishing participation and site choice while accounting for spatial substitution, trip timing, and trip context” In North American Journal of Fisheries Management 27.3 Taylor & Francis, 2007, pp. 832–847
- [91] S. Imoto et al. “Bootstrap Analysis of Gene Networks Based on Bayesian Networks and Nonparametric Regression” In Genome Informatics 13, 2002, pp. 369–370
- [92] Ali Jalali et al. “Angling to reach a destination to fish—Exploring the land and water travel dynamics of recreational fishers in Port Phillip Bay, Australia” In Frontiers in Marine Science 8 Frontiers, 2022, pp. 793074
- [93] Danika Kleiber, Leila M Harris and Amanda CJ Vincent “Gender and small-scale fisheries: a case for counting women and beyond” In Fish and Fisheries 16.4 Wiley Online Library, 2015, pp. 547–562
- [94] Daphne Koller and Nir Friedman “Probabilistic graphical models: principles and techniques” MIT press, 2009
- [95] W-C Lewin, MS Weltersbach, K Haase and HV Strehlow “Who travels how far: German Baltic sea anglers’ travel distances as precondition for fisheries management and coastal spatial planning” In Ocean & Coastal Management 209 Elsevier, 2021, pp. 105640
- [96] Yingying Ma, Siyuan Lu and Yuanyuan Zhang “Analysis on illegal crossing behavior of pedestrians at signalized intersections based on Bayesian network” In Journal of advanced transportation 2020 Hindawi Limited, 2020, pp. 1–14
- [97] Molly Mayer and Céline Le Bourdais “Sharing parental leave among dual-earner couples in Canada: Does reserved paternity leave make a difference?” In Population Research and Policy Review 38.2 Springer, 2019, pp. 215–239
- [98] Stephen R Midway et al. “COVID-19 influences on US recreational angler behavior” In PLoS One 16.8 Public Library of Science San Francisco, CA USA, 2021, pp. e0254652
- [99] Nina Marlene Mostegl “Where is the catch? A closer look into the fishing surveys of British Columbia to reveal angler motivation and satisfaction” Simon Fraser University, 2011
- [100] Yves Paradis, Simon Bernatchez, Dominique Lapointe and Steven J Cooke “Can you fish in a pandemic? An overview of recreational fishing management policies in North America during the COVID-19 crisis” In Fisheries 46.2 Wiley Online Library, 2021, pp. 81–85
- [101] Pouria Ramazi, Mélodie Kunegel-Lion, Russell Greiner and Mark A Lewis “Predicting insect outbreaks using machine learning: A mountain pine beetle case study” In Ecology and evolution 11.19 Wiley Online Library, 2021, pp. 13014–13028
- [102] Pouria Ramazi, Mélodie Kunegel-Lion, Russell Greiner and Mark A. Lewis “Exploiting the full potential of Bayesian networks in predictive ecology” In Methods in Ecology and Evolution 12 British Ecological Society, 2021, pp. 135–149 DOI: 10.1111/2041-210X.13509
- [103] EM Ann Rees et al. “Socio-economic drivers of specialist anglers targeting the non-native European catfish (Silurus glanis) in the UK” In PloS one 12.6 Public Library of Science San Francisco, CA USA, 2017, pp. e0178805
- [104] Pekka Salmi and Kirsi Sonck-Rautio “Invisible work, ignored knowledge? Changing gender roles, division of labor, and household strategies in Finnish small-scale fisheries” In Maritime Studies 17.2 Springer, 2018, pp. 213–221
- [105] Valerio Sbragaglia et al. “Preparing recreational fisheries for the uncertain future: An update of progress towards answering the 100 most pressing research questions” In Fisheries Research 263, 2023, pp. 106662 DOI: https://doi.org/10.1016/j.fishres.2023.106662
- [106] Mauro Scanagatta, Antonio Salmerón and Fabio Stella “A survey on Bayesian network structure learning from data” In Progress in Artificial Intelligence 8 Springer, 2019, pp. 425–439
- [107] Susan A Schroeder, David C Fulton, Leigh Currie and Tim Goeman “He said, she said: Gender and angling specialization, motivations, ethics, and behaviors” In Human Dimensions of Wildlife 11.5 Taylor & Francis, 2006, pp. 301–315
- [108] Marco Scutari “Learning Bayesian networks with the bnlearn R package” In arXiv preprint arXiv:0908.3817, 2009
- [109] Wenzhu Song et al. “Using Bayesian networks with Max-Min Hill-Climbing algorithm to detect factors related to multimorbidity” In Frontiers in Cardiovascular Medicine 9, 2022 DOI: 10.3389/fcvm.2022.984883
- [110] Matthew AL Young, Simon Foale and David R Bellwood “Why do fishers fish? A cross-cultural examination of the motivations for fishing” In Marine Policy 66 Elsevier, 2016, pp. 114–123
- [111] Talia Young et al. “Adaptation strategies of coastal fishing communities as species shift poleward” In ICES Journal of Marine Science 76.1 Oxford University Press, 2019, pp. 93–103
- [112] Jinlong Zhao et al. “Risk assessment of safety level in university laboratories using questionnaire and Bayesian network” In Journal of Loss Prevention in the Process Industries 83 Elsevier, 2023, pp. 105054
| Category | Variable | Definition and value |
|---|---|---|
| Demographics and | Age | 0: <16 years; 1: 16-25 years; 2: 26-35 years; 3: 36-45 years; 4: 46-55 years; 5: 56-65 years; 6: 66-75 years; 7: >75 years |
| socioeconomic | Gender | 0: Male; 1: Female |
| status | Marital status | 0: Single; 1: Married; 2: Divorced/separated; 3: Widowed |
| Education | 0: 12th grade or less; 1: High school graduate; 2: College graduate; 3: Some college / Technical training; 4: University degree; 5: Post graduate degree (Masters or Doctorate) | |
| Income | 0: >$150,000; 1: $100,000-$150,000; 2: $60,000-$100,000; 3: $30,000-$60,000; 4: <$30,000 | |
| Household size | 0: 1 person; 1: 2 persons; 3: >2 persons | |
| Work | 0: Employed full time; 1: Retired; 2: Employed part time; 3: Unemployed; 4: On disability | |
| Province of residence | 0: BC (0); 1: ON (1); 2: AB (2); 3: SK (5), MT (6), TT (9); 4: QB (3), NB (4), NS (7), NL (8), PEI (10) | |
| Vehicle | 0: Yes; 1: No; 2: Sometimes | |
| Access to boat | ||
| Fishing | Fishing experience | 0: <33 years; 1: 33-49 years; 2: 50 years |
| characteristics | Fishing skills | 0: Beginner; 1: Intermediate; 2: Expert |
| Main fishing province | 0: BC (0); 1: ON (1); 2: AB (2); 3: SK (5), MT (6), TT (9); 4: QB (3), NB (4), NS (7), NL (8), PEI (10) | |
| Impact of distance | 0: Yes; 1: No | |
| Fishing reason (boolean) | Relaxation, Enjoyment, Social interaction, Food, Sport, Being outside, Competition | |
| Fisher behavior | Frequency short trips | 0: 5 trips; 1: 6-19 trips; 2: 20 trips |
| Frequency long trips | 0: 1 trip; 1: 2-7 trips; 2: 8 trips | |
| Minimum travel distance | 0: <20km; 1: 20-50km; 2: 50-100km; | |
| Maximum travel distance | 3: 100-200km; 4: >200km | |
| Preferences | Water body type | 0: River; 1: Small lake; 2: Big lake; 3: Not important |
| environment | Busy or quiet | 0: Not important, 1: Quiet; 2: Busy |
| Shore or boat | 0: Both; 1: Boat; 2: Shore | |
| Impact fishing regulations | 0: Not important; 1: Prefer with fish size and bag size limitations; 2: Prefer with fish size limitations; 3: Prefer with bag size limitations; 4: Prefer with catch-and-release; 5: Prefer without regulations | |
| Ocean fishing | 0: No; 1: Yes, but preferably freshwater fishing; 2: Yes, mainly in the ocean | |
| Impact weather | Hot weather | 0: Doesn’t matter; |
| Rainy weather | 1: Might cancel fishing; | |
| Windy weather | 2: Might go fishing; | |
| Calm weather | 3: Usually cancel fishing; | |
| Cold weather | 4: Usually go fishing | |
| Low air pressure | ||
| Usage Angler’s | Use AA (boolean) | Maps, Species, Regulations, Logbook, Events, Posts |
| Atlas (AA) | Platform for fishing trips | 0: None; 1: App, 2: Website |
| Report rate on AA | 0: No trips at all; 1: <50%; 2: >50%; 3: All trips | |
| Impact Covid-19 | Impact Covid-19 on trip frequency | 0: Didn’t change; 1: More fishing; 2: Less fishing |
| Impact Covid-19 on travel distance | 0: Didn’t change; 1: Closer to home; 2: Further from home |
Supplementary Information:
Analyzing recreational fishing effort - Gender differences and the impact of Covid-19
S1 SI Methods
Of the responses to gender 12 respondents did not specify their gender and four respondents chose “Other". Under “Other", one was classified as “male", two were classified as “Prefer not to say", and one indicated a nonbinary gender.
This was not included in the quantitative analysis due to the low sample size in the category.
The 11 values in the variables “Province of residence" and “Main fishing province" were grouped into five categories for learning Bayesian networks. Three categories included one province, respectively: British Columbia (434 and 464 samples), Ontario (431 and 451 samples) and Alberta (491 and 457 samples). The fourth category comprised the provinces of Saskatchewan, Manitoba and The Territories (115 and 141 samples) and the fifth category consisted of samples from the provinces of Quebec, New Brunswick, Nova Scotia, Newfoundland and Labrador, and Prince Edward Island (81 and 88 samples). Groupings were based on the spatial proximity of the provinces and similar sample sizes.
S2 SI Results
The Angler’s Atlas online platform was helpful for the majority to obtain information about maps (76%) and fish species (62%) in water bodies, but was used less for information about fishing regulations (33%), fisher posts (33%), fishing events (14%) or as a fishing logbook (12%). The trip report rate, the use of the platform for information on present fish species and on regulations differed between genders ( p < 0.01). More women compared to men reported using the platform to obtain information about fishing regulations (51% vs. 31%) and fish species present (74% vs. 60%) and reported their trips on the platform (Table S1).
S3 SI Figures
S4 SI Tables
| Category | Variable | Chi-Squared | Degrees of freedom | p-value |
| Demographics | Age | 54.359 | 7.0 | 2.00e-09** |
| and | Marital status | 13.054 | 3.0 | 4.52e-03* |
| socioeconomic status | Education | 9.597 | 5.0 | 8.75e-02 |
| Income | 17.419 | 4.0 | 1.60e-03** | |
| Household size | 1.172 | 2.0 | 5.57e-01 | |
| Work | 45.238 | 4.0 | 3.55e-09** | |
| Province of residence | 8.796 | 10.0 | 5.52e-01 | |
| Vehicle | 1.569 | 2.0 | 4.56e-01 | |
| Access to boat | 13.304 | 2.0 | 1.29e-03** | |
| Fishing | Fishing experience | 83.269 | 2.0 | 8.28e-19** |
| characteristics | Fishing skills | 56.780 | 2.0 | 4.68e-13** |
| Main fishing province | 11.229 | 10.0 | 3.40e-01 | |
| Impact of distance | 0.694 | 1.0 | 4.05e-01 | |
| Fishing reason: Relaxation | 0.001 | 1.0 | 9.78e-01 | |
| Fishing reason: Enjoyment | 0.289 | 1.0 | 5.91e-01 | |
| Fishing reason: Social interaction | 0.947 | 1.0 | 3.31e-01 | |
| Fishing reason: Food | 5.881 | 1.0 | 1.53e-02* | |
| Fishing reason: Sport | 16.549 | 1.0 | 4.74e-05** | |
| Fishing reason: Being outside | 19.137 | 1.0 | 1.22e-05** | |
| Fishing reason: Competition | 0.000 | 1.0 | 1.00e+00 | |
| Fisher behavior | Frequency short trips | 1.056 | 2.0 | 5.90e-01 |
| Frequency long trips | 7.623 | 2.0 | 2.21e-02* | |
| Minimum travel distance | 10.138 | 4.0 | 3.82e-02* | |
| Maximum travel distance | 4.742 | 4.0 | 3.15e-01 | |
| Preferences | Water-body type | 5.064 | 3.0 | 1.67e-01 |
| environment | Busy or quiet | 8.989 | 2.0 | 1.12e-02* |
| Shore or boat | 7.169 | 2.0 | 2.78e-02* | |
| Impact fishing regulations | 17.757 | 5.0 | 3.27e-03** | |
| Ocean fishing | 2.864 | 2.0 | 2.39e-01 | |
| Impact weather | Hot weather | 10.887 | 4.0 | 2.79e-02* |
| Rainy weather | 2.743 | 4.0 | 6.02e-01 | |
| Windy weather | 9.938 | 4.0 | 4.15e-02* | |
| Calm weather | 11.764 | 4.0 | 1.92e-02* | |
| Cold weather | 7.038 | 4.0 | 1.34e-01 | |
| Low air pressure | 8.378 | 4.0 | 7.87e-02 | |
| Usage Angler’s | Use AA: Maps | 0.000 | 1.0 | 1.00e+00 |
| Atlas (AA) | Use AA: Species | 10.524 | 1.0 | 1.18e-03** |
| Use AA: Regulations | 27.772 | 1.0 | 1.36e-07** | |
| Use AA: Logbook | 2.306 | 1.0 | 1.29e-01 | |
| Use AA: Events | 1.124 | 1.0 | 2.89e-01 | |
| Use AA: Posts | 2.996 | 1.0 | 8.34e-02 | |
| Platform for fishing trips | 1.328 | 1.0 | 2.49e-01 | |
| Report rate on AA | 10.386 | 1.0 | 1.56e-02* | |
| Impact Covid-19 | Impact Covid-19 on trip frequency | 13.987 | 2.0 | 9.18e-04** |
| Impact Covid-19 on travel distance | 3.749 | 2.0 | 1.53e-01 |
See pages - of Angler_Survey.pdf See pages - of Create_Evaluate_BN.pdf