Artificial Intelligence in Ovarian Cancer Histopathology: A Systematic Review
Abstract
Purpose
To characterise and assess the quality of published research evaluating artificial intelligence (AI) methods for ovarian cancer diagnosis or prognosis using histopathology data.
Methods
A search of PubMed, Scopus, Web of Science, Cochrane Central Register of Controlled Trials, and WHO International Clinical Trials Registry Platform was conducted up to 19/05/2023. The inclusion criteria required that research evaluated AI on histopathology images for diagnostic or prognostic inferences in ovarian cancer, including primary tumours of the ovaries, fallopian tubes, and peritoneum. Reviews and non-English language articles were excluded. The risk of bias was assessed for every model that met the inclusion criteria using the Prediction model Risk Of Bias ASsessment Tool (PROBAST). Information about each model of interest was tabulated and summary statistics were reported. Based on the results, we provided recommendations to improve study design and reporting to reduce the risk of bias and improve the reproducibility of future research in the field. The study protocol was registered on PROSPERO (CRD42022334730). PRISMA 2020 reporting guidelines were followed.
Results
A total of 1573 records were identified, of which 45 were eligible for inclusion. These studies reported 80 total models of interest, including 37 diagnostic models, 22 prognostic models, and 21 models with other diagnostically relevant outcomes, such as tumour segmentation and cell-type classification. Models were developed using 1-1375 slides from 1-776 ovarian cancer patients. There was a wide array of model outcomes, the most common being treatment response (11/80), malignancy status (10/80), stain quantity (9/80), histological subtype (7/80), and overall survival (6/80). Older studies used traditional machine learning (ML) models with hand-crafted features, while newer studies typically employed deep learning to automatically learn features and predict model outcome(s). All models were found to be at high or unclear risk of bias overall, with most research having a high risk of bias in the analysis and a lack of clarity regarding participants and predictors in the study. Research frequently suffered from insufficient reporting and limited validation using small sample sizes, with external validations being particularly rare.
Conclusion
Limited research has been conducted on the application of AI to histopathology images for diagnostic or prognostic purposes in ovarian cancer, and none of the associated models have been demonstrated to be ready for real-world implementation. Recommendations are provided addressing underlying biases and flaws in study design, which should help inform higher-quality reproducible future research. Key aspects to help ensure clinical translation include more transparent and comprehensive reporting of data provenance and modelling approaches, as well as improved quantitative performance evaluation using cross-validation and external validations.
Funding
Engineering and Physical Sciences Research Council and The Tony Bramall Charitable Trust
Introduction
Ovarian cancer is the eighth most common malignancy in women worldwide [1]. It is notoriously difficult to detect and diagnose, with ineffective screening [2] and non-specific symptoms similar to those caused by menopause [3]. Encompassing primary malignant tumours of the ovaries, fallopian tubes, and peritoneum, the disease has often started to spread within the abdomen at the time of diagnosis (FIGO [4] Stage 3). This typical late stage at diagnosis makes ovarian cancer a particularly deadly disease, with the 314,000 new cases diagnosed each year translating to 207,000 deaths per year globally [1].
Most ovarian cancers are carcinomas (cancers of epithelial origin) which predominantly fall into five histological subtypes: high-grade serous, low-grade serous, clear cell, endometrioid, and mucinous. Non-epithelial ovarian cancers are much less common and include germ cell, sex cord-stromal, and mesenchymal tumours. Ovarian cancer subtypes differ morphologically and prognostically and have varying treatment options [5]. High-grade serous carcinoma is the most common form of ovarian cancer, accounting for approximately 70% of all cases [6].
Histopathology, the examination of tissue specimens at the cellular level, is the gold standard for ovarian cancer diagnosis. Pathologists typically interpret tissue stained with haematoxylin and eosin (H&E), though interpretation can be a subjective, time-consuming process, with some tasks having a high level of inter-observer variation [7, 8, 9]. In the assessment of difficult cases, general pathologists may seek assistance from subspecialty gynaecological pathology experts, and/or use ancillary tests, such as immunohistochemistry (IHC). Referrals and ancillary testing can be essential to the accuracy of the diagnostic process but come at the cost of making it longer and more expensive. Worldwide, pathologists are in much greater demand than supply, with significant disparities in the number of pathologists between countries [10], and with better-supplied countries still unable to meet demand [11].
Traditionally, pathologists have analysed glass slides using a light microscope. However, the implementation of a digital workflow, where pathologists review scanned whole slide images (WSIs) using a computer, is becoming more common. While digital pathology uptake has likely been driven by efficiency benefits [12], it has created an opportunity for the development of automated tools to assist pathologists. These tools often aim to improve the accuracy, efficiency, objectivity, and consistency of diagnosis. Such tools could help to alleviate the global workforce shortage of pathologists, increasing diagnostic throughput and reducing the demand for referrals and ancillary tests. This is an increasingly active area of research [13] and, for some malignancies, these systems are starting to achieve clinical utility [14].
In this study, we systematically reviewed all literature in which artificial intelligence (AI) techniques (comprising both traditional machine learning (ML) and deep learning methods) were applied to digital pathology images for the diagnosis or prognosis of ovarian cancer. This included research which focused on a single diagnostic factor such as histological subtype, and studies that performed computer-aided diagnostic tasks such as tumour segmentation. The review characterises the state of the field, describing which diagnostic and prognostic tasks have been addressed, and assessing factors relevant to the clinical utility of these methods, such as the risks of bias. Despite ovarian cancer being a particularly difficult disease to detect and diagnose, and the shortage of available pathologists, AI models have not yet been implemented in clinical practice for this disease. This review aims to provide insights and recommendations based on published literature to improve the clinical utility of future research, including reducing risks of bias, improving reproducibility, and increasing generalisability.
Methods
Literature Search
Searches were conducted in three research databases, PubMed, Scopus and Web of Science, and two trial registries, Cochrane Central Register of Controlled Trials (CENTRAL) and the World Health Organisation International Clinical Trial Registry Platform (WHO-ICTRP). The research databases only include journals and conference proceedings which have undergone peer review, ensuring the integrity of included research. The initial searches were performed on 25/04/2022 and were most recently repeated on 19/05/2023. The search strategy was composed of three distinct aspects - artificial intelligence, ovarian cancer, and histopathology. For each aspect, multiple relevant terms were combined using the OR operator (e.g. “artificial intelligence” OR “machine learning”), and then these were combined using the AND operator to ensure that retrieved research met all three aspects. The widest possible set of search fields was used for each search engine except for Scopus, where restrictions were imposed to avoid searching within the citation list of each article, which is not an available field in the other search engines. The terms ’ML’ and ’AI’ were restricted to specific fields due to the diversity of their possible meanings. To ensure the most rigorous literature search possible, no restrictions were placed on the publication date or article type during searching.
Many AI approaches build on statistical models, such as logistic regression, which can blur the lines between disciplines. When conducting searches, a previously reported methodology was adopted [15] whereby typical AI approaches were searched by name (e.g. neural networks), and other methods were searched by whether the authors described their work as artificial intelligence. Full details of the search implementation for each database are provided in Appendix A. The review protocol was registered with PROSPERO before the search results were screened for inclusion (CRD42022334730).
Literature Selection
One researcher (JB) manually removed duplicate papers with the assistance of the referencing software EndNote X9. Two researchers (JB, KA) then independently screened articles for inclusion in two stages, the first based on title and abstract, the second based on full text. Disagreements were discussed and arbitrated by a third researcher (NR or NMO). Trials in WHO-ICTRP do not have associated abstracts, so for these studies, only titles were available for initial screening.
The inclusion criteria required that research evaluated the use of at least one AI approach to make diagnostic or prognostic inferences on human histopathology images from suspected or confirmed cases of ovarian cancer. Studies were only included where AI methods were applied directly to the digital pathology images, or to features which were automatically extracted from the images. Fundamental tasks, such as segmentation and cell counting, were included as these could be used by pathologists for computer-aided diagnosis. Only conventional light microscopy images were considered, with other imaging modalities, such as fluorescence and hyperspectral imaging, excluded. Publications which did not include primary research were excluded (such as review papers). Non-English language articles and research where a full version of the manuscript was not accessible were excluded.
A model in an included study was considered to be a model of interest if it met the same inclusion criteria. Where multiple models were compared against the same outcome, the model of interest was taken to be the newly proposed model, with the best performing model during validation taken if this was unclear. If multiple model outcomes were assessed in the same study, a model of interest was taken for each model outcome, regardless of any similarity in modelling approaches. The same model outcome at different levels of precision (e.g. patch-level, slide-level, patient-level) were not considered to be different model outcomes. Models didn’t need to be entirely independent, for example, the output of one model of interest could have been used as the input of another model of interest on the condition that model performance was separately evaluated for each model.
Risk of Bias Assessment
The risk of bias was assessed for models of interest using the Prediction model Risk Of Bias ASsessment Tool (PROBAST) [16], where risk of bias is the chance of reported results being distorted by limitations within the study design, conduct, and analysis. It includes 20 guiding questions which are categorised into four domains (participants, predictors, outcome, and analysis), which are summarised as either high-risk or low-risk, or unclear in the case that there is insufficient information to make a comprehensive assessment and none of the available information indicates a high risk of bias. As such, an unclear risk of bias does not indicate methodological flaws, but incomplete reporting.
The participants domain covers the recruitment and selection of participants to ensure the study population is consistent and representative of the target population. Relevant details include the participant recruitment strategy (when and where participants were recruited), the inclusion criteria, and how many participants were recruited.
The predictors domain covers the consistent definition and measurement of predictors, which in this field typically refers to the generation of digital pathology images. This includes methods for fixing, staining, scanning, and digitally processing tissue before modelling.
The outcome domain covers the appropriate definition and consistent determination of ground-truth labels. This includes the criteria used to determine diagnosis/prognosis, the expertise of any persons determining these labels, and whether labels are determined independently of any model outputs.
The analysis domain covers statistical considerations in the evaluation of model performance to ensure valid and not unduly optimistic results. This includes many factors, such as the number of participants in the test set with each outcome, the validation approaches used (cross-validation, external validation, bootstrapping, etc.), the metrics used to assess performance, and methods used to overcome the effects of censoring, competing risks/confounders, and missing data. The risks caused by some of these factors are interrelated, for example, the risk of bias from using a small dataset is somewhat mitigated by cross-validation, which increases the effective size of the test set and can be used to assess variability, reducing optimism in the results. Further, the risk caused by using a small dataset depends on the type of outcome being predicted, for example, more data is required for a robust analysis of 5-class classification than binary classification. There must also be sufficient data within all relevant patient subgroups, for example, if multiple subtypes of ovarian cancer are included, there must not be a subtype that is only represented by a few patients. Due to these interrelated factors, there are no strict criteria to determine the appropriate size of a dataset, though fewer than 50 samples per class or fewer than 100 samples overall is likely to be considered high-risk, and more than 1000 samples overall is likely to be considered low-risk.
Risks of bias often arise due to inconsistent methodologies. Inconsistency in the participants and predictors domains may cause heterogeneity in the visual properties of digital pathology slides which may lead to spurious correlations, either through random chance or systematic differences between subgroups in the dataset. Varied data may be beneficial during training to improve model generalisability when using large datasets, though this must be closely controlled to avoid introducing systematic confounding. Inconsistent determination of the outcome can mean that the results of a study are unreliable due to spurious correlations in the ground truth labels, or invalid due to incorrect determination of labels.
While PROBAST provides a framework to assess risks of bias, there is some level of subjectivity in the interpretation of signalling questions. As such, each model was analysed by three independent researchers (any of JB, KA, NR, KZ, NMO), with at least one computer scientist and one clinician involved in the risk of bias assessment for each model. The PROBAST applicability of research analysis was not implemented as it is unsuitable for such a diverse array of possible research questions.
Data Synthesis
Data extraction was performed independently by two researchers (JB, KA) using a form containing 81 fields within the categories Overview, Data, Methods, Results, and Miscellaneous. Several of these fields were added or clarified during data extraction with the agreement of both researchers and retroactively applied to all accepted literature. The final data extraction form is available at www.github.com/scjjb/OvCaReview, with a summary included in Appendix B.
Information was sought from full-text articles, as well as references and supplementary materials where appropriate. Inferences were made only when both researchers were confident that this gave the correct information, with disagreements resolved through discussion. Fields which could not be confidently completed were labelled as being unclear.
All extracted data were summarised in two tables, one each for study-level and model-level characteristics. Only models of interest were included in these tables. The term model outcome refers to the model output, whether this was a clinical outcome (diagnosis/prognosis), or a diagnostically relevant outcome that could be used for computer-aided diagnosis, such as tumour segmentation. The data synthesis did not include any meta-analysis due to the diversity of included methods and model outcomes.
Results
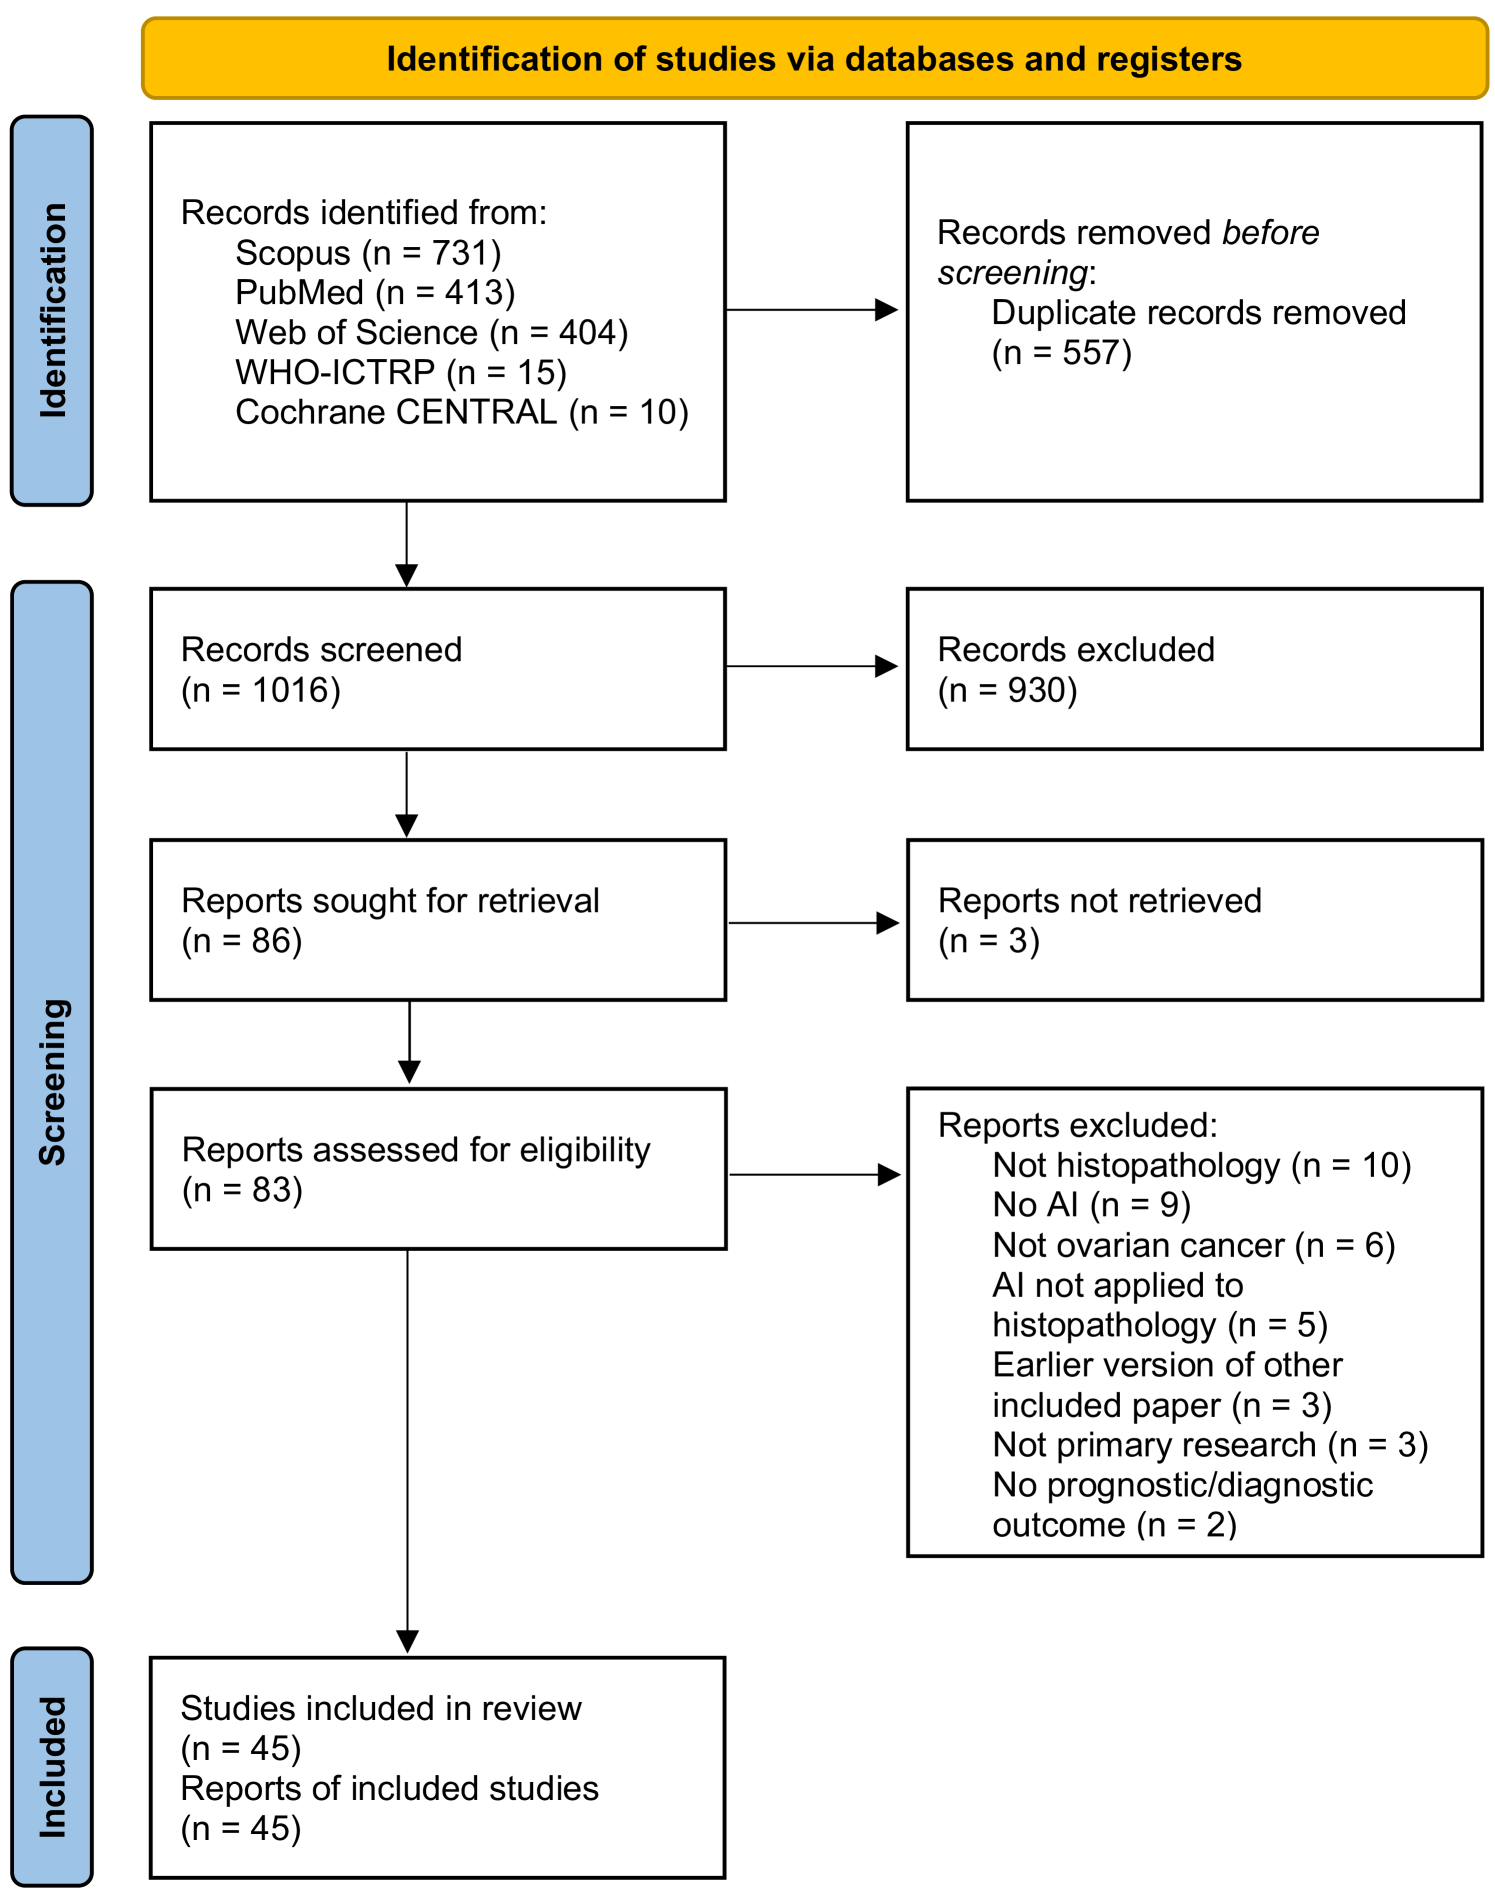
As shown in Figure 1, the literature searches returned a total of 1573 records, of which 557 were duplicates. 930 records were excluded during the screening of titles and abstracts, and 41 were excluded based on full paper screening, including 3 records for which full articles could not be obtained. The remaining 45 studies were included in the review, of which 11 were conference papers and 34 were journal papers. All accepted studies were originally identified through searches of research databases, with no records from trial registries meeting the inclusion criteria. While the searches returned literature from as early as 1949, all of the research which met the inclusion criteria was published since 2010, with over 70% of the included literature published since 2020. Study characteristics are shown in Table 2. The 45 accepted articles contained 80 models of interest, details of which are shown in Table 3.
Risk of Bias Assessment
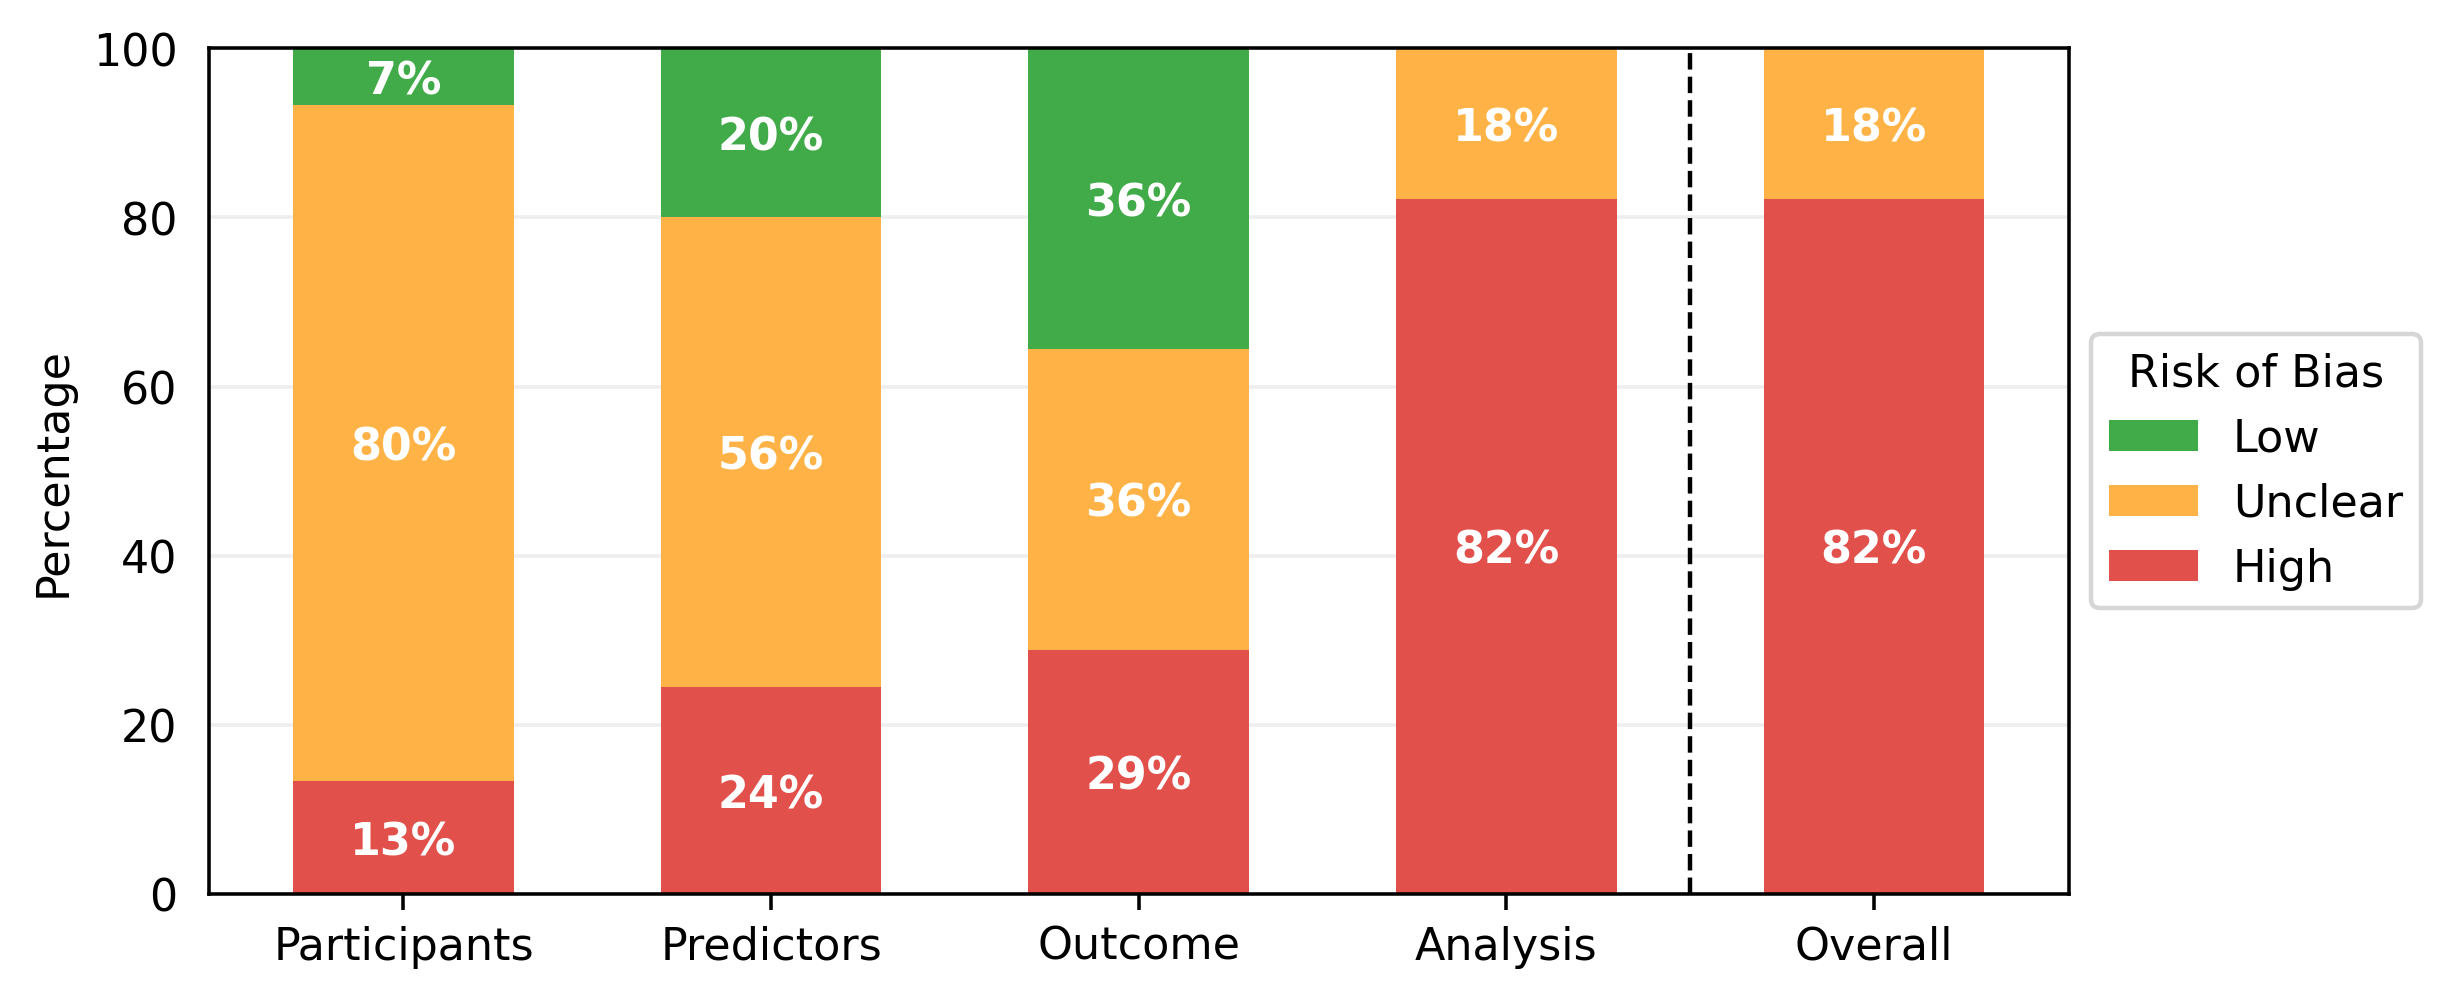
The results of the PROBAST assessments are shown in Table 1. While some studies contained multiple models of interest, none of these contained models with different risk of bias scores for any section of the PROBAST assessment, so one risk of bias analysis is presented per paper. All models showed either a high overall risk of bias (37/45) or an unclear overall risk of bias (8/45). Every high-risk model had a high-risk score in the analysis section (37/45), with several also being at high risk for participants (6/45), predictors (11/45), or outcomes (13/45). Less than half of the studies achieved a low risk of bias in any domain (21/45), with most low risks being found in the outcomes (16/45) and predictors (9/45) sections. Nearly all of the papers had an unclear risk of bias in at least one domain, most commonly the participants (36/45) and predictors (25/45) domains. Qualitative summaries are presented in Figure 2.
| \rowcolorblack!70 Publication | Participants | Predictors | Outcome | Analysis | Overall |
| Dong 2010(a) [17] | \cellcolorred!25High | \cellcolorred!25High | \cellcolorred!25High | \cellcolorred!25High | \cellcolorred!25High |
| Dong 2010(b) [18] | \cellcolorred!25High | \cellcolorred!25High | \cellcolorred!25High | \cellcolorred!25High | \cellcolorred!25High |
| Signolle 2010 [19] | \cellcoloryellow!25Unclear | \cellcoloryellow!25Unclear | \cellcolorred!25High | \cellcolorred!25High | \cellcolorred!25High |
| Janowczyk 2011 [20] | \cellcoloryellow!25Unclear | \cellcoloryellow!25Unclear | \cellcolorgreen!25Low | \cellcolorred!25High | \cellcolorred!25High |
| Janowczyk 2012 [21] | \cellcoloryellow!25Unclear | \cellcolorred!25High | \cellcoloryellow!25Unclear | \cellcolorred!25High | \cellcolorred!25High |
| Kothari 2012 [22] | \cellcoloryellow!25Unclear | \cellcolorgreen!25Low | \cellcolorgreen!25Low | \cellcoloryellow!25Unclear | \cellcoloryellow!25Unclear |
| Poruthoor 2013 [23] | \cellcoloryellow!25Unclear | \cellcolorred!25High | \cellcolorred!25High | \cellcolorred!25High | \cellcolorred!25High |
| BenTaieb 2015 [24] | \cellcoloryellow!25Unclear | \cellcoloryellow!25Unclear | \cellcolorgreen!25Low | \cellcolorred!25High | \cellcolorred!25High |
| BenTaieb 2016 [25] | \cellcoloryellow!25Unclear | \cellcolorred!25High | \cellcoloryellow!25Unclear | \cellcolorred!25High | \cellcolorred!25High |
| BenTaieb 2017 [26] | \cellcoloryellow!25Unclear | \cellcoloryellow!25Unclear | \cellcolorgreen!25Low | \cellcolorred!25High | \cellcolorred!25High |
| Lorsakul 2017 [27] | \cellcoloryellow!25Unclear | \cellcoloryellow!25Unclear | \cellcolorred!25High | \cellcolorred!25High | \cellcolorred!25High |
| Du 2018 [28] | \cellcoloryellow!25 Unclear | \cellcoloryellow!25 Unclear | \cellcoloryellow!25 Unclear | \cellcoloryellow!25 Unclear | \cellcoloryellow!25 Unclear |
| Heindl 2018 [29] | \cellcoloryellow!25Unclear | \cellcolorgreen!25Low | \cellcolorgreen!25Low | \cellcolorred!25High | \cellcolorred!25High |
| Kalra 2020 [30] | \cellcoloryellow!25Unclear | \cellcolorgreen!25Low | \cellcolorgreen!25Low | \cellcolorred!25High | \cellcolorred!25High |
| Levine 2020 [31] | \cellcoloryellow!25Unclear | \cellcolorgreen!25Low | \cellcolorgreen!25Low | \cellcoloryellow!25Unclear | \cellcoloryellow!25Unclear |
| Yaar 2020 [32] | \cellcoloryellow!25Unclear | \cellcoloryellow!25Unclear | \cellcolorgreen!25Low | \cellcolorred!25High | \cellcolorred!25High |
| Yu 2020 [33] | \cellcoloryellow!25Unclear | \cellcolorgreen!25Low | \cellcolorgreen!25Low | \cellcolorred!25High | \cellcolorred!25High |
| Gentles 2021 [34] | \cellcolorred!25High | \cellcoloryellow!25Unclear | \cellcolorred!25High | \cellcolorred!25High | \cellcolorred!25High |
| Ghoniem 2021 [35] | \cellcoloryellow!25Unclear | \cellcoloryellow!25Unclear | \cellcoloryellow!25Unclear | \cellcolorred!25High | \cellcolorred!25High |
| Jiang 2021 [36] | \cellcolorred!25High | \cellcolorred!25High | \cellcoloryellow!25Unclear | \cellcolorred!25High | \cellcolorred!25High |
| Laury 2021 [37] | \cellcolorgreen!25Low | \cellcolorred!25High | \cellcolorred!25High | \cellcolorred!25High | \cellcolorred!25High |
| Paijens 2021 [38] | \cellcolorgreen!25Low | \cellcolorred!25High | \cellcoloryellow!25Unclear | \cellcolorred!25High | \cellcolorred!25High |
| Shin 2021 [39] | \cellcoloryellow!25Unclear | \cellcoloryellow!25Unclear | \cellcoloryellow!25Unclear | \cellcolorred!25High | \cellcolorred!25High |
| Zeng 2021 [40] | \cellcoloryellow!25Unclear | \cellcoloryellow!25Unclear | \cellcolorgreen!25Low | \cellcolorred!25High | \cellcolorred!25High |
| Boehm 2022 [41] | \cellcoloryellow!25Unclear | \cellcolorred!25High | \cellcoloryellow!25Unclear | \cellcolorred!25High | \cellcolorred!25High |
| Boschman 2022 [42] | \cellcoloryellow!25Unclear | \cellcolorgreen!25Low | \cellcolorgreen!25Low | \cellcolorred!25High | \cellcolorred!25High |
| Elie 2022 [43] | \cellcoloryellow!25Unclear | \cellcolorgreen!25Low | \cellcolorred!25High | \cellcolorred!25High | \cellcolorred!25High |
| Farahani 2022 [44] | \cellcoloryellow!25Unclear | \cellcoloryellow!25Unclear | \cellcolorgreen!25Low | \cellcoloryellow!25Unclear | \cellcoloryellow!25Unclear |
| Hu 2022 [45] | \cellcoloryellow!25Unclear | \cellcoloryellow!25Unclear | \cellcoloryellow!25Unclear | \cellcoloryellow!25Unclear | \cellcoloryellow!25Unclear |
| Jiang 2022 [46] | \cellcoloryellow!25Unclear | \cellcoloryellow!25Unclear | \cellcolorred!25High | \cellcolorred!25High | \cellcolorred!25High |
| Kasture 2022 [47] | \cellcolorred!25High | \cellcolorred!25High | \cellcolorred!25High | \cellcolorred!25High | \cellcolorred!25High |
| Kowalski 2022 [48] | \cellcoloryellow!25Unclear | \cellcoloryellow!25Unclear | \cellcoloryellow!25Unclear | \cellcolorred!25High | \cellcolorred!25High |
| Lazard 2022 [49] | \cellcoloryellow!25Unclear | \cellcoloryellow!25Unclear | \cellcoloryellow!25Unclear | \cellcoloryellow!25Unclear | \cellcoloryellow!25Unclear |
| Liu 2022 [50] | \cellcoloryellow!25Unclear | \cellcoloryellow!25Unclear | \cellcoloryellow!25Unclear | \cellcoloryellow!25Unclear | \cellcoloryellow!25Unclear |
| Mayer 2022 [51] | \cellcoloryellow!25Unclear | \cellcoloryellow!25Unclear | \cellcolorred!25High | \cellcolorred!25High | \cellcolorred!25High |
| Nero 2022 [52] | \cellcoloryellow!25Unclear | \cellcolorgreen!25Low | \cellcolorred!25High | \cellcolorred!25High | \cellcolorred!25High |
| Salguero 2022 [53] | \cellcoloryellow!25Unclear | \cellcoloryellow!25Unclear | \cellcolorgreen!25Low | \cellcolorred!25High | \cellcolorred!25High |
| Wang 2022(a) [54] | \cellcoloryellow!25Unclear | \cellcoloryellow!25Unclear | \cellcoloryellow!25Unclear | \cellcolorred!25High | \cellcolorred!25High |
| Wang 2022(b) [55] | \cellcoloryellow!25Unclear | \cellcoloryellow!25Unclear | \cellcolorgreen!25Low | \cellcolorred!25High | \cellcolorred!25High |
| Yokomizo 2022 [56] | \cellcolorgreen!25Low | \cellcolorgreen!25Low | \cellcoloryellow!25Unclear | \cellcoloryellow!25Unclear | \cellcoloryellow!25Unclear |
| Ho 2023 [57] | \cellcoloryellow!25Unclear | \cellcoloryellow!25Unclear | \cellcoloryellow!25Unclear | \cellcolorred!25High | \cellcolorred!25High |
| Meng 2023 [58] | \cellcoloryellow!25Unclear | \cellcoloryellow!25Unclear | \cellcolorgreen!25Low | \cellcolorred!25High | \cellcolorred!25High |
| Ramasamy 2023 [59] | \cellcolorred!25High | \cellcolorred!25High | \cellcolorred!25High | \cellcolorred!25High | \cellcolorred!25High |
| Wang 2023 [60] | \cellcoloryellow!25Unclear | \cellcoloryellow!25Unclear | \cellcoloryellow!25Unclear | \cellcolorred!25High | \cellcolorred!25High |
| Wu 2023 [61] | \cellcoloryellow!25Unclear | \cellcoloryellow!25Unclear | \cellcolorgreen!25Low | \cellcolorred!25High | \cellcolorred!25High |
Data Synthesis Results
Data in Included Literature
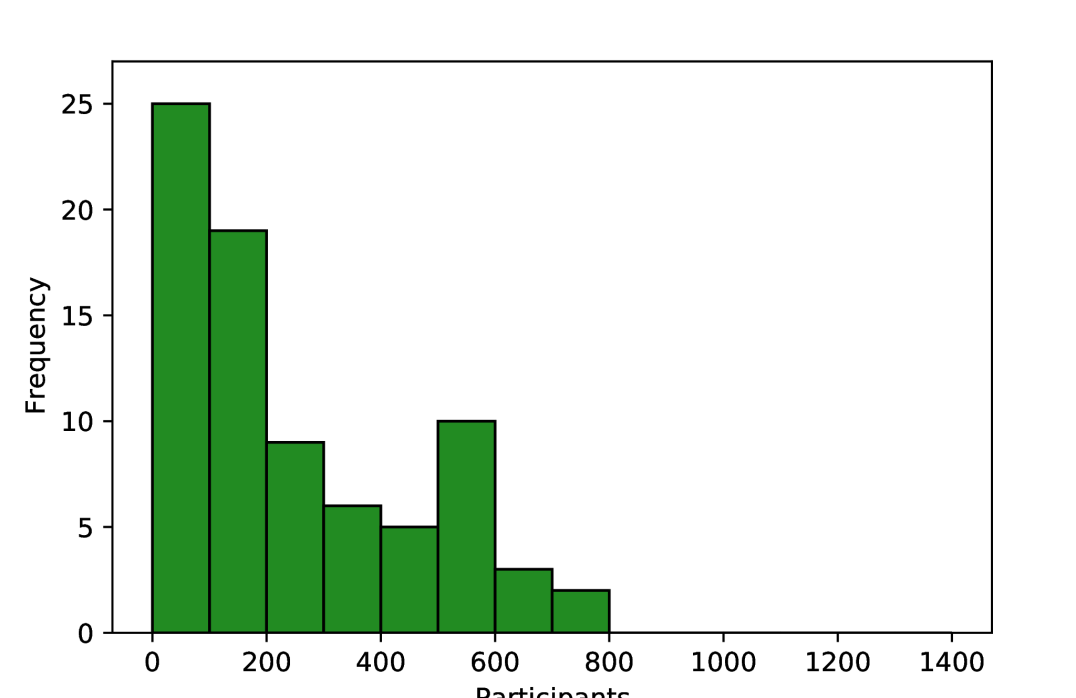
The number of participants in internal datasets varied by orders of magnitude, with each study including 1 to 776 ovarian cancer patients, and one study including over 10,000 total patients across a range of 32 malignancies [30]. Most research only used data from the five most common subtypes of ovarian carcinoma, though one recent study included the use of sex cord-stromal tumours [58]. Only one study explicitly included any prospective data collection, and this was only for a small subset which was not used for external validation [41].
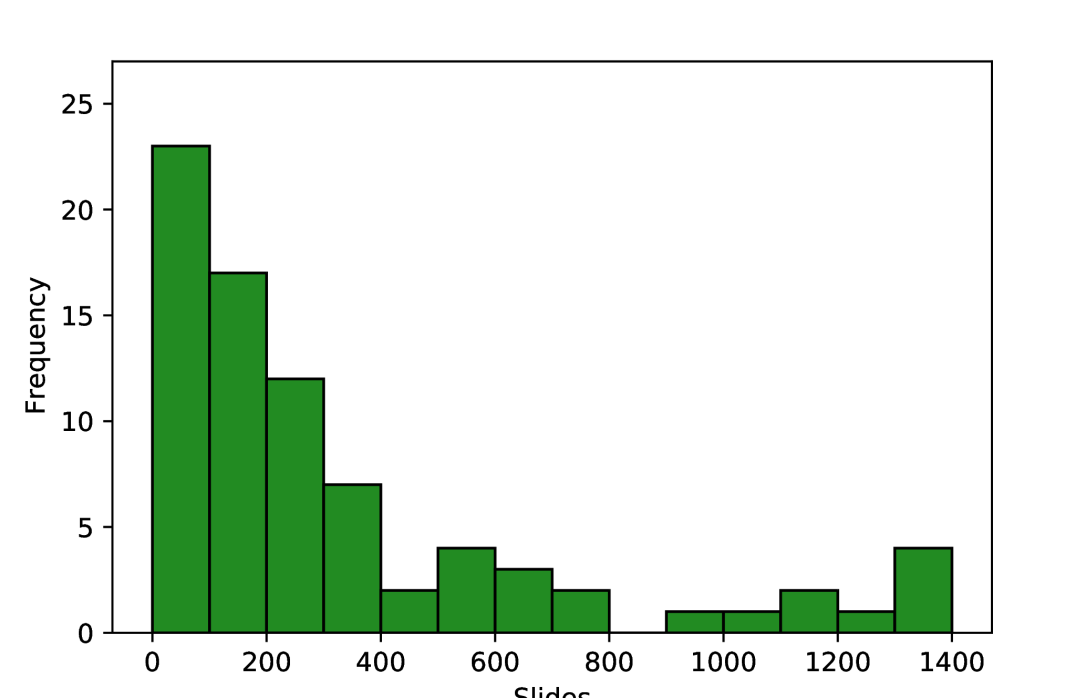
As shown in Figure 3, the number of pathology slides used was often much greater than the number of patients included, with three studies using over 1000 slides from ovarian cancer patients [22, 33, 50]. In most of the studies, model development samples were WSIs containing resected or biopsied tissue (34/45), with others using individual tissue microarray (TMA) core images (5/45) or pre-cropped digital pathology images (3/45). Most studies used H&E-stained tissue (33/45) and others used a variety of IHC stains (11/45), with no two papers reporting the use of the same IHC stains. Some studies included multi-modal approaches, using genomics [23, 32, 35, 40, 41], proteomics [23, 40], transcriptomics [40], and radiomics [41] data alongside histopathological data.
The most commonly used data source was The Cancer Genome Atlas (TCGA) (18/45), a project from which over 30,000 digital pathology images from 33 malignancies are publicly available. The ovarian cancer subset, TCGA-OV [62], contains 1481 WSIs from 590 cases of ovarian serous carcinoma (mostly, but not exclusively, high-grade), with corresponding genomic, transcriptomic, and clinical data. This includes slides from eight data centres in the United States, with most slides containing frozen tissue sections (1374/1481) rather than formalin-fixed, paraffin-embedded (FFPE) sections. Other recurring data sources were the University of British Columbia Ovarian Cancer Research Program (OVCARE) repository [31, 42, 44], the Transcanadian study [24, 25], and clinical records at the Mayo Clinic [36, 46], Tri-Service General Hospital [54, 55, 60], and Memorial Sloan Kettering Cancer Center [41, 57]. All other researchers either used a unique data source (12/45) or did not report the provenance of their data (8/45). TCGA-OV, OVCARE, and the Transcanadian study are all multi-centre datasets. Aside from these, few studies reported the use of multi-centre data [38, 39, 40, 41, 44, 51]. Only two studies reported the use of multiple slide scanners, with every slide scanned on one of two available scanners [42, 44]. The countries from which data were sourced included Canada, China, Finland, France, Germany, Italy, Japan, the Netherlands, South Korea, Taiwan, the United Kingdom, and the United States of America.
Methods in Included Literature
There was a total of 80 models of interest in the 45 included papers, with each paper containing 1 to 6 such models. There were 37 diagnostic models, 22 prognostic models, and 21 other models predicting diagnostically relevant information. Diagnostic model outcomes included the classification of malignancy status (10/37), histological subtype (7/37), primary cancer type (5/37), genetic mutation status (4/37), tumour-stroma reaction level (3/37), grade (2/37), transcriptomic subtype (2/37), stage (1/37), microsatellite instability status (1/37), epithelial-mesenchymal transition status (1/37), and homologous recombination deficiency status (1/37). Prognostic models included the prediction of treatment response (11/23), overall survival (6/23), progression-free survival (3/23), and recurrence (2/23). The other models performed tasks which could be used to assist pathologists in analysing pathology images, including measuring the quantity/intensity of staining, generating segmentation masks, and classifying tissue/cell types.
A variety of models were used, with the most common types being convolutional neural network (CNN) (41/80), support vector machine (SVM) (10/80), and random forest (6/80). CNN architectures included GoogLeNet [28], VGG16 [33, 46], VGG19 [31, 44], InceptionV3 [39, 54, 55, 60], ResNet18 [41, 42, 44, 45, 49, 51], ResNet34 [56], ResNet50 [52, 58, 61], ResNet182 [57], and MaskRCNN [46]. Novel CNNs typically used multiple standardised blocks involving convolutional, normalization, activation, and/or pooling layers [32, 47, 48], with two studies also including attention modules [50, 60]. One study generated their novel architecture by using a topology optimization approach on a standard VGG16 [35].
Most researchers split their original images into patches to be separately processed, with patch sizes ranging from 60x60 to 2048x2048 pixels, the most common being 512x512 pixels (19/56) and 256x256 pixels (12/56). A range of feature extraction techniques were employed, including both hand-crafted/pre-defined features (23/80) and features that were automatically learned by the model (51/80). Hand-crafted features included a plethora of textural, chromatic, and cellular and nuclear morphological features. Hand-crafted features were commonly used as inputs to classical ML methods, such as SVM and random forest models. Learned features were typically extracted using a CNN, which was often also used for classification.
Despite the common use of patches, most models made predictions at the WSI level (29/80), TMA core level (18/80), or patient level (6/80), requiring aggregation of patch-level information. Two distinct aggregation approaches were used, one aggregating before modelling and one aggregating after modelling. The former approach requires the generation of slide-level features before modelling, the latter requires the aggregation of patch-level model outputs to make slide-level predictions. Slide-level features were generated using summation [58], averaging [23, 40, 57], attention-based weighted averaging [45, 50, 52, 49, 61], concatenation [25, 30], as well as more complex embedding approaches using Fisher vector encoding [24] and k-means clustering [26]. Patch-level model outputs were aggregated to generate slide-level predictions by taking the maximum [32, 60], median [56], or average [35], using voting strategies [42, 55], or using a random forest classifier [44]. These approaches are all examples of multiple instance learning (MIL), though few models of interest were reported using this terminology [32, 45, 49, 52].
![[Uncaptioned image]](https://cdn.awesomepapers.org/papers/b165e197-c273-4f7f-801d-b054eacded17/x4.png)
![[Uncaptioned image]](https://cdn.awesomepapers.org/papers/b165e197-c273-4f7f-801d-b054eacded17/x5.png)
Most studies included segmentation at some stage, with many of these analysing tumour/stain segmentation as a model outcome [17, 18, 19, 20, 21, 38, 46, 48, 57, 59]. Some other studies used segmentation to determine regions of interest for further modelling, either simply separating tissue from background [22, 30, 52, 61], or using tumour segmentation to select the most relevant tissue regions [34, 37, 54, 55, 60]. One study also used segmentation to detect individual cells for classification [29]. Some studies also used segmentation in determining hand-crafted features relating to the quantity and morphology of different tissues, cells, and nuclei [22, 23, 25, 36, 40, 41].
While attention-based approaches have been applied to other malignancies for several years [64, 65], they were only seen in the most recent ovarian cancer studies [44, 45, 49, 50, 52, 54, 55, 61, 60], and none of the methods included self-attention, an increasingly popular method for other malignancies [66]. Most models were deterministic, though hidden Markov trees [19], probabilistic boosting trees [20], and Gaussian mixture models [43] were also used. Aside from the common use of low-resolution images to detect and remove non-tissue areas, images were typically analysed at a single resolution, with only six papers including multi-magnification techniques in their models of interest. Four of these combined features from different resolutions for modelling [24, 25, 26, 57], and the other two used different magnifications for selecting informative tissue regions and for modelling [54, 55]. Out of the papers for which it could be determined, the most common modelling magnifications were 20x (35/41) and 40x (7/41). Few models integrated histopathology data with other modalities (6/80). Multi-modal approaches included the concatenation of separately extracted uni-modal features before modelling [23, 35, 40], the amalgamation of uni-modal predictions from separate models [41], and a teacher-student approach where multiple modalities were used in model training but only histopathology data was used for prediction [32].
Analysis in Included Literature
Analyses were limited, with less than half of the model outcomes being evaluated with cross-validation (39/80) and with very few externally validated using independent ovarian cancer data (7/80), despite small internal cohort sizes. Cross-validation methods included k-fold (22/39) with 3 to 10 folds, Monte Carlo (12/39) with 3 to 15 repeats, and leave-one-patient-out cross-validations (5/39). Some other papers included cross-validation on the training set to select hyperparameters but used only a small unseen test set from the same data source for evaluation. Externally validated models were all trained with WSIs, with validations either performed on TMA cores (2/7) or WSIs from independent data sources (5/7), with two of these explicitly using different scanners to digitize internal and external data [42, 44]. Some reported methods were externally validated with data from non-ovarian malignancies, but none of these included ovarian cancer data in any capacity, so were not included in the review. However, there was one method which trained with only gastrointestinal tumour data and externally validated with ovarian tumour data [58].
Most classification models were evaluated using accuracy, balanced accuracy, and/or area under the receiver operating characteristic curve (AUC), with one exception where only a p-value was reported measuring the association between histological features and transcriptomic subtypes based on a Kruskal-Wallis test [33]. Some models were also evaluated using the F1-score, which we chose not to tabulate (in Figure 3) as the other metrics were reported more consistently. Survival model performance was typically reported using AUC, with other metrics including p-value, accuracy, hazard ratios, and C-index, which is similar to AUC but can account for censoring. Segmentation models were almost all evaluated differently from each other, with different studies reporting AUC, accuracy, Dice coefficient, intersection over union, sensitivity, specificity, and qualitative evaluations. Regression models were all evaluated using the coefficient of determination (-statistic). For some models, performance was broken down per patient [43, 51], per subtype [58], or per class [29, 30, 40, 46], without an aggregated, holistic measure of model performance.
The variability of model performance was not frequently reported (33/94), and when it was reported it was often incomplete. This included cases where it was unclear what the intervals represented (95% confidence interval, one standard deviation, variation, etc.), or not clear what the exact bounds of the interval were due to results being plotted but not explicitly stated. Within the entire review, there were only three examples in which variability was reported during external validation [39, 42, 51], only one of which clearly reported both the bounds and the type of the interval [39]. No studies performed any Bayesian form of uncertainty quantification. Reported results are shown in Table 3, though direct comparisons between the performance of different models should be treated with caution due to the diversity of data and validation methods used to evaluate different models, the lack of variability measures, the consistently high risks of bias, and the heterogeneity in reported metrics.
Discussion
The vast majority of published research on AI for diagnostic or prognostic purposes in ovarian cancer histopathology was found to be at a high risk of bias due to issues within the analyses performed. Researchers often used a limited quantity of data and conducted analyses on a single train-test data split without using any methods to account for overfitting and model optimism (cross-validation, bootstrapping, external validation). These limitations are common in gynaecological AI research using other data types, with recent reviews pointing to poor clinical utility caused by predominantly retrospective studies using limited data [67, 68] and limited methodologies with weak validation, which risk model performance being overestimated [69, 70].
The more robust analyses included one study in which several relevant metrics were evaluated using 10 repeats of Monte Carlo cross-validation on a set of 406 WSIs, with standard deviations reported for each metric [31]. Other positive examples included the use of both internal cross-validation and external validation for the same outcome, giving a more rigorous analysis [44, 51, 55]. While external validations were uncommon, those which were conducted offered a real insight into model generalisability, with a clear reduction in performance on all external validation sets except one [44]. The only study which demonstrated high generalisability included the largest training set out of all externally validated approaches, included more extensive data labelling than many similar studies, and implemented a combination of three colour normalisation approaches, indicating that these factors may benefit generalisability.
Studies frequently had an unclear risk of bias within the participants and predictors domains of PROBAST due to incomplete reporting. Frequently missing information included where the patients were recruited, how many patients were included, how many samples/images were used, whether any patients/images were excluded, and the methods by which tissue was processed and digitized. Reporting was often poor regarding open-access datasets. Only three papers were found to be at low risk of bias for participants, with these including clear and reasonable patient recruitment strategies and selection criteria, which can be seen as positive examples for other researchers [37, 38, 56]. Information about the predictors (histopathology images and features derived thereof) was generally better reported, but still often missed key details which meant that it was unclear whether all tissue samples were processed similarly to avoid risks of bias from visual heterogeneity. It was found that when patient characteristics were reported, they often showed a high risk of bias. Many studies included very small quantities of patients with specific differences from the majority (e.g. less than 20 patients with a different cancer subtype to the majority), causing a risk of spurious correlations and results which are not generalisable to the wider population.
Reporting was particularly sparse in studies which used openly accessible data, possibly indicating that AI-focused researchers were not taking sufficient time to understand these datasets and ensure their research was clinically relevant. For example, many of the researchers who used TCGA data included frozen tissue sections without commenting on whether this was appropriate, despite the fact that pathologists do not consider them to be of optimal diagnostic quality. One paper handled TCGA data more appropriately, with a clear explanation of the positives and negatives of the dataset, and entirely separate models for FFPE and frozen slides [30].
Sharing code can help to mitigate the effects of incomplete reporting and drastically improve reproducibility, but only 19 of the 45 papers did this, with some of these appearing to be incomplete or inaccessible. The better code repositories included detailed documentation to aid reproducibility, including environment set-up information [33, 58], overviews of included functions [41, 49, 57], and code examples used to generate reported results [29].
Two papers were found to have major discrepancies between the reported data and the study design, indicating much greater risks of bias than those seen in any other research [47, 59]. In one paper [47], it was reported that TCGA-OV data was used for subtyping with 5 classes, despite this dataset only including high-grade serous and low-grade serous carcinomas. In the other paper [59], it was reported that TCGA-OV data was used for slide-level classification into ovarian cancer and non-ovarian cancer classes using PAS-stained tissue, despite TCGA-OV only containing H&E-stained ovarian cancer slides.
Limitations of the Review
While the review protocol was designed to reduce biases and maximise the quantity of relevant research included, there were some limitations. This review is restricted to published literature in the English language, however, AI research may be published in other languages or made available as pre-prints without publication in peer-reviewed journals, making this review incomplete. While most of the review process was completed by multiple independent researchers, the duplicate detection was performed by only a single researcher, raising the possibility of errors in this step of the review process, resulting in incorrect exclusions. Due to the significant time gap between the initial and final literature searches (approximately 12 months), there may have been inconsistencies in interpretations, both for data extraction and risk of bias assessments. Finally, this review focused only on light microscopy images of human histopathology samples relating to ovarian cancer, so may have overlooked useful literature outside of this domain.
Development of the Field
The field of AI in ovarian cancer histopathology diagnosis is rapidly growing, with more research published since the start of 2020 than in all preceding years combined. The earliest research, published between 2010-2013, used hand-crafted features to train classical ML methods such as SVMs. These models were used for segmentation [17, 18, 19, 21], malignancy classification [20, 22], grading [23], and overall survival prediction [23]. Most of these early studies focused on IHC-stained tissue (5/7), which would be much less commonly used in subsequent research (6/38).
The field was relatively dormant in the following years, with only 6 papers published between 2014-2019, half of which had the same primary author [24, 25, 26]. These models still used traditional ML classifiers, though some used learned features rather than the traditional hand-crafted features. The models developed were used for histological subtyping [24, 25, 26] and cellular/tissue classification [27, 28, 29].
Since 2020 there has been a much greater volume of research published, most of which has involved the use of deep neural networks for automatic feature extraction and classification. Recent research has investigated a broader array of diagnostic outcomes, including the classification of primary cancer type [30, 59], mutation status [40, 52, 57], homologous recombination deficiency status [49], tumour-stroma reaction level [46], transcriptomic subtypes [33, 40], microsatellite instability [40], and epithelial-mesenchymal transition status [45]. Three additional prognostic outcomes have also been predicted in more recent literature - progression-free survival [37, 41, 56], relapse [52, 56], and treatment response [32, 33, 54, 55, 60].
Despite progress within a few specific outcomes, there was no obvious overall trend in the sizes of datasets used over time, either in terms of the number of slides or the number of participants. Similarly, there was no evidence that recent research included more rigorous internal validations, though external validations have been increasing in frequency - no research before 2021 included any external validation with ovarian cancer data, but seven studies published more recently did [39, 40, 42, 44, 51, 55, 58]. While these external validations were typically limited to small quantities of data, the inclusion of any external validation demonstrates progress from previous research. Such validations are essential to the clinical utility of these models as real-world implementation will require robustness to different sources of visual heterogeneity, with variation occurring across different data centres and within data centres over time. As this field continues to mature, we hope to see more studies conduct thorough validations with larger, high-quality independent datasets, including clearly reported protocols for patient recruitment and selection, pathology slide creation, and digitization. This will help to reduce the biases, limited reproducibility, and limited generalisability identified in most of the existing research in this domain.
Current Limitations and Future Recommendations
A large proportion of published work did not provide sufficient clinical and pathological information to assess the risk of bias. It is important that AI researchers thoroughly report data provenance to understand the extent of heterogeneity in the dataset, and to understand whether this has been appropriately accounted for in the study design. Modelling and analysis methods must also be thoroughly reported to improve reliability and reproducibility. Researchers may find it useful to refer to reporting checklists, such as transparent reporting of a multivariable prediction model for individual prognosis or diagnosis (TRIPOD) [71], to ensure that they have understood and reported all relevant details of their studies. In many studies, it is not clear how AI would fit in the clinical workflow, or whether there are limitations in how these methods could be applied. AI researchers should ensure they understand the clinical context of their data and potential models before undertaking research to reduce bias and increase utility. Ideally, this will involve regular interactions with expert clinicians, including histopathologists and oncologists.
To further improve reproducibility, we recommend that researchers should make code and data available where possible. It is relatively easy to publish code and generate documentation to enhance usability, and there are few drawbacks to doing so when publishing research. Making data available is more often difficult due to data security requirements and the potential storage costs, but it can provide benefits beyond the primary research of the original authors. Digital pathology research in ovarian cancer is currently limited by the lack of openly accessible data, leading to over-dependence on TCGA, and causing many researchers to painstakingly collate similar but distinct datasets. These datasets often contain little of the heterogeneity seen in multi-centre, multi-scanner data, making it difficult for researchers to train robust models or assess generalisability. Where heterogeneous data is included, it often includes small quantities of data which are different to the majority, introducing risks of bias and confounding rather than helping to overcome these issues. TCGA-based studies are prone to this, with significant differences between TCGA slides originating from different data centres [72], but with many of these centres only providing small quantities of data. Many researchers are reliant on open-access data, but there is a severe shortage of suitable open-access ovarian cancer histopathology data. Making such data available, with detailed protocols describing data creation, allows researchers to conduct more thorough analyses and significantly improve model generalisability and clinical implementability.
For AI to achieve clinical utility, it is essential that more robust validations are performed, especially considering the limitations of the available datasets. We recommend that researchers should always conduct thorough analyses, using cross-validation, bootstrapping, and/or external validations to ensure that results are robust and truly reflect the ability of their model(s) to generalise to unseen data, and are not simply caused by chance. This should include reporting the variability of results (typically in a 95% confidence interval), especially when comparing multiple models to help to distinguish whether one model is genuinely better than another or whether the difference is due to chance. Statistical tests can also be beneficial for these evaluations. Another option for capturing variability is Bayesian uncertainty quantification, which can be used to separate aleatoric (inherent) and epistemic (modelling) uncertainty.
Current literature in this field can be largely characterised as model prototyping with homogeneous retrospective data. Researchers rarely consider the reality of human-machine interaction, perhaps believing that these models are a drop-in replacement for pathologists. However, these models perform narrow tasks within the pathology pipeline and do not take into consideration the clinical context beyond their limited training datasets and siloed tasks. We believe these models would be more beneficial (and more realistic to implement) as assistive tools for pathologists, providing secondary opinions or novel ancillary information. While current research is typically focused on assessing model accuracy without any pathologist input, different study designs could be employed to better assess the real-world utility of these models as assistive tools. For example, usability studies could investigate which models are most accessible and most informative to pathologists in practice, and prospective studies could quantify any benefits to diagnostic efficiency and patient outcomes, and investigate the robustness of models in practice. Understanding the effects of AI on the efficiency of diagnosis is particularly important given the limited supply of pathologists worldwide. As such, this type of research will significantly benefit clinical translation.
Summary of recommendations
-
•
Understand data and ensure planned research is clinically relevant before modelling, ideally involving clinicians throughout the project.
-
•
Consider different study designs, including usability studies and/or prospective studies.
-
•
Clearly report the context of any histopathology data, including how patients were recruited/selected, and how tissue specimens were processed to generate digital pathology images.
-
•
Conduct thorough analyses using cross-validation, external validation, and/or bootstrapping.
-
•
Make all code openly accessible (and data if possible).
Acknowledgments
There was no direct funding for this research. JB is supported by the UKRI Engineering and Physical Sciences Research Council (EPSRC) [EP/S024336/1]. KA, PA are supported by the Tony Bramall Charitable Trust. AS is supported by Innovate UK via the National Consortium of Intelligent Medical Imaging (NCIMI) [104688], Cancer Research UK [C19942/A28832] and Leeds Hospitals Charity [9R01/1403]. The funders had no role in influencing the content of this research. For the purpose of open access, the author has applied a Creative Commons Attribution (CC BY) licence to any Author Accepted Manuscript version arising from this submission.
Author Contributions
JB created the study protocol with feedback and contributions from all other authors. JB, KA, KZ, NMO, and NR performed the risk of bias assessments. JB and KA performed data extraction. JB analysed extracted data and wrote the manuscript, with feedback and contributions from all other authors.
Competing Interests
GH receives research funding from IQVIA. NMO receives research funding from 4D Path. All other authors declare no conflicts of interest.
References
- [1] Hyuna Sung, Jacques Ferlay, Rebecca L. Siegel, Mathieu Laversanne, Isabelle Soerjomataram, Ahmedin Jemal, and Freddie Bray. Global cancer statistics 2020: Globocan estimates of incidence and mortality worldwide for 36 cancers in 185 countries. CA: A Cancer Journal for Clinicians, 71, 2021.
- [2] Usha Menon, Aleksandra Gentry-Maharaj, Matthew Burnell, Naveena Singh, Andy Ryan, Chloe Karpinskyj, Giulia Carlino, Julie Taylor, Susan K. Massingham, Maria Raikou, Jatinderpal K. Kalsi, Robert Woolas, Ranjit Manchanda, Rupali Arora, Laura Casey, Anne Dawnay, Stephen Dobbs, Simon Leeson, Tim Mould, Mourad W. Seif, Aarti Sharma, Karin Williamson, Yiling Liu, Lesley Fallowfield, Alistair J. McGuire, Stuart Campbell, Steven J. Skates, Ian J. Jacobs, and Mahesh Parmar. Ovarian cancer population screening and mortality after long-term follow-up in the uk collaborative trial of ovarian cancer screening (ukctocs): a randomised controlled trial. The Lancet, 397, 2021.
- [3] Mark H. Ebell, Marybeth B. Culp, and Taylor J. Radke. A systematic review of symptoms for the diagnosis of ovarian cancer. American Journal of Preventive Medicine, 50, 2016.
- [4] Jonathan S. Berek, Malte Renz, Sean Kehoe, Lalit Kumar, and Michael Friedlander. Cancer of the ovary, fallopian tube, and peritoneum: 2021 update. International Journal of Gynecology and Obstetrics, 155, 2021.
- [5] Martin Köbel, Steve E. Kalloger, Niki Boyd, Steven McKinney, Erika Mehl, Chana Palmer, Samuel Leung, Nathan J. Bowen, Diana N. Ionescu, Ashish Rajput, Leah M. Prentice, Dianne Miller, Jennifer Santos, Kenneth Swenerton, C. Blake Gilks, and David Huntsman. Ovarian carcinoma subtypes are different diseases: Implications for biomarker studies. PLoS Medicine, 5, 2008.
- [6] Jaime Prat. Staging classification for cancer of the ovary, fallopian tube, and peritoneum. International Journal of Gynecology and Obstetrics, 124:1–5, 2014.
- [7] Rayna K. Matsuno, Mark E. Sherman, Kala Visvanathan, Marc T. Goodman, Brenda Y. Hernandez, Charles F. Lynch, Olga B. Ioffe, David Horio, Charles Platz, Sean F. Altekruse, Ruth M. Pfeiffer, and William F. Anderson. Agreement for tumor grade of ovarian carcinoma: Analysis of archival tissues from the surveillance, epidemiology, and end results residual tissue repository. Cancer Causes and Control, 24, 2013.
- [8] Martin Köbel, Julia Bak, Björn I. Bertelsen, Olli Carpen, Anni Grove, Estrid S. Hansen, Anne Marie Levin Jakobsen, Marianne Lidang, Anna Måsbäck, Anna Tolf, C. Blake Gilks, and Joseph W. Carlson. Ovarian carcinoma histotype determination is highly reproducible, and is improved through the use of immunohistochemistry. Histopathology, 64, 2014.
- [9] Mollie E. Barnard, Alexander Pyden, Megan S. Rice, Miguel Linares, Shelley S. Tworoger, Brooke E. Howitt, Emily E. Meserve, and Jonathan L. Hecht. Inter-pathologist and pathology report agreement for ovarian tumor characteristics in the nurses’ health studies. Gynecologic Oncology, 150, 2018.
- [10] Michael L. Wilson, Kenneth A. Fleming, Modupe A. Kuti, Lai Meng Looi, Nestor Lago, and Kun Ru. Access to pathology and laboratory medicine services: a crucial gap. The Lancet, 391, 2018.
- [11] Royal College of Pathologists. Meeting pathology demand: Histopathology workforce census. 2018.
- [12] Alexi Baidoshvili, Anca Bucur, Jasper van Leeuwen, Jeroen van der Laak, Philip Kluin, and Paul J. van Diest. Evaluating the benefits of digital pathology implementation: time savings in laboratory logistics. Histopathology, 73, 2018.
- [13] Albrecht Stenzinger, Maximilian Alber, Michael Allgäuer, Philipp Jurmeister, Michael Bockmayr, Jan Budczies, Jochen Lennerz, Johannes Eschrich, Daniel Kazdal, Peter Schirmacher, Alex H. Wagner, Frank Tacke, David Capper, Klaus Robert Müller, and Frederick Klauschen. Artificial intelligence and pathology: From principles to practice and future applications in histomorphology and molecular profiling. Seminars in Cancer Biology, 84, 2022.
- [14] Patricia Raciti, Jillian Sue, Juan A Retamero, Rodrigo Ceballos, Ran Godrich, Jeremy D Kunz, Adam Casson, Dilip Thiagarajan, Zahra Ebrahimzadeh, Julian Viret, et al. Clinical validation of artificial intelligence–augmented pathology diagnosis demonstrates significant gains in diagnostic accuracy in prostate cancer detection. Archives of Pathology & Laboratory Medicine, 2022.
- [15] Paula Dhiman, Jie Ma, Constanza L. Andaur Navarro, Benjamin Speich, Garrett Bullock, Johanna A. A. Damen, Lotty Hooft, Shona Kirtley, Richard D. Riley, Ben Van Calster, Karel G. M. Moons, and Gary S. Collins. Methodological conduct of prognostic prediction models developed using machine learning in oncology: a systematic review. BMC Medical Research Methodology, 22:101, 12 2022.
- [16] Robert F. Wolff, Karel G.M. Moons, Richard D. Riley, Penny F. Whiting, Marie Westwood, Gary S. Collins, Johannes B. Reitsma, Jos Kleijnen, and Sue Mallett. Probast: A tool to assess the risk of bias and applicability of prediction model studies. Annals of Internal Medicine, 170, 2019.
- [17] Jiwen Dong, Jing Li, Jian Lu, and Aifang Fu. Automatic segmentation for ovarian cancer immunohistochemical image based on chroma criterion. In 2010 2nd International Conference on Advanced Computer Control, volume 2, pages 147–150. IEEE, 2010.
- [18] Jiwen Dong, Jing Li, Aifang Fu, and Huiming Lv. Automatic segmentation for ovarian cancer immunohistochemical image based on yuv color space. In 2010 International Conference on Biomedical Engineering and Computer Science, pages 1–4. IEEE, 2010.
- [19] Nicolas Signolle, Marinette Revenu, Benoît Plancoulaine, and Paulette Herlin. Wavelet-based multiscale texture segmentation: Application to stromal compartment characterization on virtual slides. Signal Processing, 90, 2010.
- [20] Andrew Janowczyk, Sharat Chandran, Michael Feldman, and Anant Madabhushi. Local morphologic scale: application to segmenting tumor infiltrating lymphocytes in ovarian cancer tmas. In Medical Imaging 2011: Image Processing, volume 7962, pages 827–840. SPIE, 2011.
- [21] Andrew Janowczyk, Sharat Chandran, Rajendra Singh, Dimitra Sasaroli, George Coukos, Michael D. Feldman, and Anant Madabhushi. High-throughput biomarker segmentation on ovarian cancer tissue microarrays via hierarchical normalized cuts. IEEE Transactions on Biomedical Engineering, 59, 2012.
- [22] Sonal Kothari, John H Phan, Adeboye O Osunkoya, and May D Wang. Biological interpretation of morphological patterns in histopathological whole-slide images. In Proceedings of the ACM conference on bioinformatics, computational biology and biomedicine, pages 218–225, 2012.
- [23] Anjaly Poruthoor, John H Phan, Sonal Kothari, and May D Wang. Exploration of genomic, proteomic, and histopathological image data integration methods for clinical prediction. In 2013 IEEE China Summit and International Conference on Signal and Information Processing, pages 259–263. IEEE, 2013.
- [24] Aïcha BenTaieb, Hector Li-Chang, David Huntsman, and Ghassan Hamarneh. Automatic diagnosis of ovarian carcinomas via sparse multiresolution tissue representation. In Medical Image Computing and Computer-Assisted Intervention–MICCAI 2015: 18th International Conference, Munich, Germany, October 5-9, 2015, Proceedings, Part I 18, pages 629–636. Springer, 2015.
- [25] Aïcha BenTaieb, Masoud S Nosrati, Hector Li-Chang, David Huntsman, and Ghassan Hamarneh. Clinically-inspired automatic classification of ovarian carcinoma subtypes. Journal of pathology informatics, 7(1):28, 2016.
- [26] Aïcha BenTaieb, Hector Li-Chang, David Huntsman, and Ghassan Hamarneh. A structured latent model for ovarian carcinoma subtyping from histopathology slides. Medical image analysis, 39:194–205, 2017.
- [27] Auranuch Lorsakul, Emilia Andersson, Suzana Vega Harring, Hadassah Sade, Oliver Grimm, and Joerg Bredno. Automated wholeslide analysis of multiplex-brightfield ihc images for cancer cells and carcinoma-associated fibroblasts. In Medical Imaging 2017: Digital Pathology, volume 10140, pages 41–46. SPIE, 2017.
- [28] Yue Du, Roy Zhang, Abolfazl Zargari, Theresa C. Thai, Camille C. Gunderson, Katherine M. Moxley, Hong Liu, Bin Zheng, and Yuchen Qiu. Classification of tumor epithelium and stroma by exploiting image features learned by deep convolutional neural networks. Annals of Biomedical Engineering, 46, 2018.
- [29] Andreas Heindl, Adnan Mujahid Khan, Daniel Nava Rodrigues, Katherine Eason, Anguraj Sadanandam, Cecilia Orbegoso, Marco Punta, Andrea Sottoriva, Stefano Lise, Susana Banerjee, and Yinyin Yuan. Microenvironmental niche divergence shapes brca1-dysregulated ovarian cancer morphological plasticity. Nature Communications, 9, 2018.
- [30] Shivam Kalra, H. R. Tizhoosh, Sultaan Shah, Charles Choi, Savvas Damaskinos, Amir Safarpoor, Sobhan Shafiei, Morteza Babaie, Phedias Diamandis, Clinton J.V. Campbell, and Liron Pantanowitz. Pan-cancer diagnostic consensus through searching archival histopathology images using artificial intelligence. npj Digital Medicine, 3, 2020.
- [31] Adrian B. Levine, Jason Peng, David Farnell, Mitchell Nursey, Yiping Wang, Julia R. Naso, Hezhen Ren, Hossein Farahani, Colin Chen, Derek Chiu, Aline Talhouk, Brandon Sheffield, Maziar Riazy, Philip P. Ip, Carlos Parra-Herran, Anne Mills, Naveena Singh, Basile Tessier-Cloutier, Taylor Salisbury, Jonathan Lee, Tim Salcudean, Steven J.M. Jones, David G. Huntsman, C. Blake Gilks, Stephen Yip, and Ali Bashashati. Synthesis of diagnostic quality cancer pathology images by generative adversarial networks. Journal of Pathology, 252, 2020.
- [32] Asfand Yaar, Amina Asif, Shan E Ahmed Raza, Nasir Rajpoot, and Fayyaz Minhas. Cross-domain knowledge transfer for prediction of chemosensitivity in ovarian cancer patients. In Proceedings of the IEEE/CVF Conference on Computer Vision and Pattern Recognition Workshops, pages 928–929, 2020.
- [33] Kun Hsing Yu, Vincent Hu, Feiran Wang, Ursula A. Matulonis, George L. Mutter, Jeffrey A. Golden, and Isaac S. Kohane. Deciphering serous ovarian carcinoma histopathology and platinum response by convolutional neural networks. BMC Medicine, 18, 2020.
- [34] Lucy Gentles, Rachel Howarth, Won Ji Lee, Sweta Sharma-Saha, Angela Ralte, Nicola Curtin, Yvette Drew, and Rachel Louise O’Donnell. Integration of computer-aided automated analysis algorithms in the development and validation of immunohistochemistry biomarkers in ovarian cancer. Journal of Clinical Pathology, 74, 2021.
- [35] Rania M. Ghoniem, Abeer D. Algarni, Basel Refky, and Ahmed A. Ewees. Multi-modal evolutionary deep learning model for ovarian cancer diagnosis. Symmetry, 13, 2021.
- [36] Jun Jiang, Burak Tekin, Ruifeng Guo, Hongfang Liu, Yajue Huang, and Chen Wang. Digital pathology-based study of cell- and tissue-level morphologic features in serous borderline ovarian tumor and high-grade serous ovarian cancer. Journal of Pathology Informatics, 12, 2021.
- [37] Anna Ray Laury, Sami Blom, Tuomas Ropponen, Anni Virtanen, and Olli Mikael Carpén. Artificial intelligence-based image analysis can predict outcome in high-grade serous carcinoma via histology alone. Scientific Reports, 11, 2021.
- [38] S. T. Paijens, A. Vledder, D. Loiero, E. W. Duiker, J. Bart, A. M. Hendriks, M. Jalving, H. H. Workel, H. Hollema, N. Werner, A. Plat, G. B.A. Wisman, R. Yigit, H. Arts, A. J. Kruse, N. M. de Lange, V. H. Koelzer, M. de Bruyn, and H. W. Nijman. Prognostic image-based quantification of cd8cd103 t cell subsets in high-grade serous ovarian cancer patients. OncoImmunology, 10, 2021.
- [39] Seo Jeong Shin, Seng Chan You, Hokyun Jeon, Ji Won Jung, Min Ho An, Rae Woong Park, and Jin Roh. Style transfer strategy for developing a generalizable deep learning application in digital pathology. Computer Methods and Programs in Biomedicine, 198:105815, 2021.
- [40] Hao Zeng, Linyan Chen, Mingxuan Zhang, Yuling Luo, and Xuelei Ma. Integration of histopathological images and multi-dimensional omics analyses predicts molecular features and prognosis in high-grade serous ovarian cancer. Gynecologic Oncology, 163, 2021.
- [41] Kevin M. Boehm, Emily A. Aherne, Lora Ellenson, Ines Nikolovski, Mohammed Alghamdi, Ignacio Vázquez-García, Dmitriy Zamarin, Kara Long Roche, Ying Liu, Druv Patel, Andrew Aukerman, Arfath Pasha, Doori Rose, Pier Selenica, Pamela I. Causa Andrieu, Chris Fong, Marinela Capanu, Jorge S. Reis-Filho, Rami Vanguri, Harini Veeraraghavan, Natalie Gangai, Ramon Sosa, Samantha Leung, Andrew McPherson, Jian Jiong Gao, Yulia Lakhman, and Sohrab P. Shah. Multimodal data integration using machine learning improves risk stratification of high-grade serous ovarian cancer. Nature Cancer, 3:723–733, 6 2022.
- [42] Jeffrey Boschman, Hossein Farahani, Amirali Darbandsari, Pouya Ahmadvand, Ashley Van Spankeren, David Farnell, Adrian B. Levine, Julia R. Naso, Andrew Churg, Steven J.M. Jones, Stephen Yip, Martin Köbel, David G. Huntsman, C. Blake Gilks, and Ali Bashashati. The utility of color normalization for ai-based diagnosis of hematoxylin and eosin-stained pathology images. Journal of Pathology, 256, 2022.
- [43] Nicolas Elie, Florence Giffard, Cécile Blanc-Fournier, Pierre Marie Morice, Pierre Emmanuel Brachet, Soizic Dutoit, Benoît Plancoulaine, and Laurent Poulain. Impact of automated methods for quantitative evaluation of immunostaining: Towards digital pathology. Frontiers in Oncology, 12, 10 2022.
- [44] Hossein Farahani, Jeffrey Boschman, David Farnell, Amirali Darbandsari, Allen Zhang, Pouya Ahmadvand, Steven J. M. Jones, David Huntsman, Martin Köbel, C. Blake Gilks, Naveena Singh, and Ali Bashashati. Deep learning-based histotype diagnosis of ovarian carcinoma whole-slide pathology images. Modern Pathology, 35:1983–1990, 12 2022.
- [45] Yang Hu, Korsuk Sirinukunwattana, Kezia Gaitskell, Ruby Wood, Clare Verrill, and Jens Rittscher. Predicting molecular traits from tissue morphology through self-interactive multi-instance learning. In Medical Image Computing and Computer Assisted Intervention–MICCAI 2022: 25th International Conference, Singapore, September 18–22, 2022, Proceedings, Part II, pages 130–139. Springer, 2022.
- [46] Jun Jiang, Burak Tekin, Lin Yuan, Sebastian Armasu, Stacey J. Winham, Ellen L. Goode, Hongfang Liu, Yajue Huang, Ruifeng Guo, and Chen Wang. Computational tumor stroma reaction evaluation led to novel prognosis-associated fibrosis and molecular signature discoveries in high-grade serous ovarian carcinoma. Frontiers in Medicine, 9, 9 2022.
- [47] Kokila R. Kasture, Dharmaveer Choudhari, and Pravin N. Matte. Prediction and classification of ovarian cancer using enhanced deep convolutional neural network. International Journal of Engineering Trends and Technology, 70:310–318, 3 2022.
- [48] Piotr A Kowalski, Jakub Błoniarz, and Łukasz Chmura. Convolutional neural networks in the ovarian cancer detection. In Computational Intelligence and Mathematics for Tackling Complex Problems 2, pages 55–64. Springer, 2022.
- [49] Tristan Lazard, Guillaume Bataillon, Peter Naylor, Tatiana Popova, François-Clément Bidard, Dominique Stoppa-Lyonnet, Marc-Henri Stern, Etienne Decencière, Thomas Walter, and Anne Vincent-Salomon. Deep learning identifies morphological patterns of homologous recombination deficiency in luminal breast cancers from whole slide images. Cell Reports Medicine, 3(12):100872, 2022.
- [50] Tianling Liu, Ran Su, Changming Sun, Xiuting Li, and Leyi Wei. Eocsa: Predicting prognosis of epithelial ovarian cancer with whole slide histopathological images. Expert Systems with Applications, 206, 11 2022.
- [51] Robin S Mayer, Steffen Gretser, Lara E Heckmann, Paul K Ziegler, Britta Walter, Henning Reis, Katrin Bankov, Sven Becker, Jochen Triesch, Peter J Wild, et al. How to learn with intentional mistakes: Noisyensembles to overcome poor tissue quality for deep learning in computational pathology. Frontiers in Medicine, 9, 2022.
- [52] Camilla Nero, Luca Boldrini, Jacopo Lenkowicz, Maria Teresa Giudice, Alessia Piermattei, Frediano Inzani, Tina Pasciuto, Angelo Minucci, Anna Fagotti, Gianfranco Zannoni, Vincenzo Valentini, and Giovanni Scambia. Deep-learning to predict brca mutation and survival from digital h&e slides of epithelial ovarian cancer. International Journal of Molecular Sciences, 23, 10 2022.
- [53] Jennifer Salguero, Prateek Prasanna, Germán Corredor, Angel Cruz-Roa, David Becerra, and Eduardo Romero. Selecting training samples for ovarian cancer classification via a semi-supervised clustering approach. In Medical Imaging 2022: Digital and Computational Pathology, volume 12039, pages 20–24. SPIE, 2022.
- [54] Ching-Wei Wang, Yu-Ching Lee, Cheng-Chang Chang, Yi-Jia Lin, Yi-An Liou, Po-Chao Hsu, Chun-Chieh Chang, Aung-Kyaw-Oo Sai, Chih-Hung Wang, and Tai-Kuang Chao. A weakly supervised deep learning method for guiding ovarian cancer treatment and identifying an effective biomarker. Cancers, 14(7):1651, 2022(a).
- [55] Ching Wei Wang, Cheng Chang Chang, Yu Ching Lee, Yi Jia Lin, Shih Chang Lo, Po Chao Hsu, Yi An Liou, Chih Hung Wang, and Tai Kuang Chao. Weakly supervised deep learning for prediction of treatment effectiveness on ovarian cancer from histopathology images. Computerized Medical Imaging and Graphics, 99, 7 2022(b).
- [56] Ryo Yokomizo, Tiago JS Lopes, Nagisa Takashima, Sou Hirose, Ayako Kawabata, Masataka Takenaka, Yasushi Iida, Nozomu Yanaihara, Kei Yura, Haruhiko Sago, et al. O3c glass-class: A machine-learning framework for prognostic prediction of ovarian clear-cell carcinoma. Bioinformatics and Biology Insights, 16:11779322221134312, 2022.
- [57] David Joon Ho, M Herman Chui, Chad M Vanderbilt, Jiwon Jung, Mark E Robson, Chan-Sik Park, Jin Roh, and Thomas J Fuchs. Deep interactive learning-based ovarian cancer segmentation of h&e-stained whole slide images to study morphological patterns of brca mutation. Journal of Pathology Informatics, 14:100160, 2023.
- [58] Zhu Meng, Guangxi Wang, Fei Su, Yan Liu, Yuxiang Wang, Jing Yang, Jianyuan Luo, Fang Cao, Panpan Zhen, Binhua Huang, et al. A deep learning-based system trained for gastrointestinal stromal tumor screening can identify multiple types of soft tissue tumors. The American Journal of Pathology, 2023.
- [59] Sathya Ramasamy and Vaidehi Kaliyaperumal. A hybridized channel selection approach with deep convolutional neural network for effective ovarian cancer prediction in periodic acid-schiff-stained images. Concurrency and Computation: Practice and Experience, 35(5):e7568, 2023.
- [60] Ching-Wei Wang, Yu-Ching Lee, Yi-Jia Lin, Chun-Chieh Chang, Chih-Hung Wang, Tai-Kuang Chao, et al. Interpretable attention-based deep learning ensemble for personalized ovarian cancer treatment without manual annotations. Computerized Medical Imaging and Graphics, 107:102233, 2023.
- [61] Meixuan Wu, Chengguang Zhu, Jiani Yang, Shanshan Cheng, Xiaokang Yang, Sijia Gu, Shilin Xu, Yongsong Wu, Wei Shen, Shan Huang, et al. Exploring prognostic indicators in the pathological images of ovarian cancer based on a deep survival network. Frontiers in Genetics, 13, 2023.
- [62] Chandra Holback, Rose Jarosz, Fred Prior, David G Mutch, Priya Bhosale, Kimberly Garcia, Yueh Lee, Shanah Kirk, Cheryl A Sadow, Seth Levine, Evis Sala, Pierre Elnajjar, Tara Morgan, and Brad Erickson. The cancer genome atlas ovarian cancer collection (tcga-ov) (version 4) [data set]. The Cancer Imaging Archive, 2016.
- [63] Martin Köbel, Steve E. Kalloger, Patricia M. Baker, Carol A. Ewanowich, Jocelyne Arseneau, Viktor Zherebitskiy, Soran Abdulkarim, Samuel Leung, Máire A. Duggan, Dan Fontaine, Robin Parker, David G. Huntsman, and C. Blake Gilks. Diagnosis of ovarian carcinoma cell type is highly reproducible: A transcanadian study. American Journal of Surgical Pathology, 34, 2010.
- [64] Maximilian Ilse, Jakub Tomczak, and Max Welling. Attention-based deep multiple instance learning. In International conference on machine learning, pages 2127–2136. PMLR, 2018.
- [65] Ming Y. Lu, Drew F.K. Williamson, Tiffany Y. Chen, Richard J. Chen, Matteo Barbieri, and Faisal Mahmood. Data-efficient and weakly supervised computational pathology on whole-slide images. Nature Biomedical Engineering, 5, 2021.
- [66] Kelei He, Chen Gan, Zhuoyuan Li, Islem Rekik, Zihao Yin, Wen Ji, Yang Gao, Qian Wang, Junfeng Zhang, and Dinggang Shen. Transformers in medical image analysis: A review. Intelligent Medicine, 2022.
- [67] Pallabi Shrestha, Bhavya Poudyal, Sepideh Yadollahi, Darryl E Wright, Adriana V Gregory, Joshua D Warner, Panagiotis Korfiatis, Isabel C Green, Sarah L Rassier, Andrea Mariani, et al. A systematic review on the use of artificial intelligence in gynecologic imaging–background, state of the art, and future directions. Gynecologic Oncology, 2022.
- [68] Jingyang Zhou, Weiwei Cao, Lan Wang, Zezheng Pan, and Ying Fu. Application of artificial intelligence in the diagnosis and prognostic prediction of ovarian cancer. Computers in Biology and Medicine, page 105608, 2022.
- [69] Oraianthi Fiste, Michalis Liontos, Flora Zagouri, Georgios Stamatakos, and Meletios Athanasios Dimopoulos. Machine learning applications in gynecological cancer: a critical review. Critical Reviews in Oncology/Hematology, page 103808, 2022.
- [70] He-Li Xu, Ting-Ting Gong, Fang-Hua Liu, Hong-Yu Chen, Qian Xiao, Yang Hou, Ying Huang, Hong-Zan Sun, Yu Shi, Song Gao, et al. Artificial intelligence performance in image-based ovarian cancer identification: A systematic review and meta-analysis. EClinicalMedicine, 53:101662, 2022.
- [71] Gary S Collins, Johannes B Reitsma, Douglas G Altman, and Karel GM Moons. Transparent reporting of a multivariable prediction model for individual prognosis or diagnosis (tripod): the tripod statement. Annals of internal medicine, 162(1):55–63, 2015.
- [72] Taher Dehkharghanian, Azam Asilian Bidgoli, Abtin Riasatian, Pooria Mazaheri, Clinton JV Campbell, Liron Pantanowitz, HR Tizhoosh, and Shahryar Rahnamayan. Biased data, biased ai: deep networks predict the acquisition site of tcga images. Diagnostic Pathology, 18(1):1–12, 2023.
Appendix A Search strategy
Searches for all databases are shown here, with any text which is not directly input to the search bar in bold font. These searches are each a combination of three aspects - artificial intelligence, ovarian cancer, and histopathology. No filters were applied, and all options were left on their default settings. The wildcard character, *, was used to search for multiple versions of the same word, for example, “patholog*” searches for all of “pathology”, “pathologist”, “pathologists”, and “pathological”.
A.1 PubMed
(“Machine Learning”[Mesh] OR “Artificial Intelligence”[Mesh] OR “Neural Networks, Computer”[Mesh] OR “support vector machine”[MeSH] OR “Deep Learning”[Mesh] OR “diagnosis, computer-assisted”[Mesh] OR “Machine learn” OR “Artificial Intelligen” OR (ML[Title/Abstract] NOT (gml[Title/Abstract] OR /ml[Title/Abstract] OR mgml[Title/Abstract] OR pgml[Title/Abstract] OR ngml[Title/Abstract] OR uiml[Title/Abstract] OR iuml[Title/Abstract] OR miuml[Title/Abstract] OR muiml[Title/Abstract] OR uml[Title/Abstract] OR gml[Title/Abstract] OR mlkg[Title/Abstract] OR milliliter[Title/Abstract])) OR AI[Title/Abstract] OR “Computer Vision” OR “Neural network” OR “Deep Network” OR “Computer-aided Diagnosis” OR “Computer aided Diagnosis” OR Perceptron OR “Convolutional Network” OR “Recurrent Network” OR “Graph Network” OR “Deep Learn” OR “Deep-Learn” OR Backprop OR “support vector” OR ensemble OR “random forest” OR “nearest neighbor” OR “nearest neighbour” OR “k-nearest neighbor” OR “k-nearest neighbour” OR “Gradient boost” OR “XGBoost” OR “segmentation” OR “instance learning” OR “multi-instance learning” OR “Active Learning”)
AND (((ovar OR fallopian) AND (cancer OR mass OR carcinoma OR tumour OR tumor OR neoplasm OR malignan OR “carcinoma”[Mesh] OR “neoplasms”[Mesh])) OR “Ovarian Neoplasms”[Mesh] OR “peritoneal cancer” OR “peritoneal carcinoma” OR “peritoneal tumo”)
AND ((digit AND patholog) OR “computational patholog” OR “tissue microarray” OR histopath OR histolog OR “Whole Slide Imag” OR “Tissue slide” OR “pathology slide” OR “pathology image” OR Immunohistochem OR ((Haematoxylin OR Hematoxylin) AND Eosin) OR Histology[Mesh])
A.2 Scopus
TITLE-ABS-KEY(“Machine learn” OR “Artificial Intelligen” OR (“ML” AND NOT “ ml” AND NOT “g ml” AND NOT “ui ml” AND NOT “Ul ml” AND NOT “iu ml” AND NOT “u ml” AND NOT “g ml” AND NOT “ml kg” AND NOT milliliter) OR AI OR “Computer Vision” OR “Neural network” OR “Deep Network” OR “Computer-aided Diagnosis” OR “Computer aided Diagnosis” OR Perceptron OR “Convolutional Network” OR “Recurrent Network” OR “Graph Network” OR “Deep Learn” OR “Deep-Learn” OR Backprop OR “support vector” OR ensemble OR “random forest” OR “nearest neighbor” OR “nearest neighbour” OR “k-nearest neighbor” OR “k-nearest neighbour” OR “Gradient boost” OR “XGBoost” OR “segmentation” OR “instance learning” OR “multi-instance learning” OR “Active Learning”)
AND TITLE-ABS-KEY(((ovar OR fallopian) AND (cancer OR mass OR carcinoma OR tumour OR tumor OR neoplasm OR malignan)) OR “peritoneal cancer” OR “peritoneal carcinoma” OR “peritoneal tumo”)
AND TITLE-ABS-KEY((digit AND patholog) OR “computational patholog” OR “tissue microarray” OR histopath OR histolog OR “Whole Slide Imag” OR “Tissue slide” OR “pathology slide” OR “pathology image” OR Immunohistochem OR ((Haematoxylin OR Hematoxylin) AND Eosin))
A.3 Web of Science
(ALL=(“Machine learn” OR “Artificial Intelligen” OR “Computer Vision” OR “Neural network” OR “Deep Network” OR “Computer-aided Diagnosis” OR “Computer aided Diagnosis” OR Perceptron OR “Convolutional Network” OR “Recurrent Network” OR “Graph Network” OR “Deep Learn” OR “Deep-Learn” OR Backprop OR “support vector” OR ensemble OR “random forest” OR “nearest neighbor” OR “nearest neighbour” OR “k-nearest neighbor” OR “k-nearest neighbour” OR “Gradient boost” OR “XGBoost” OR “segmentation” OR “instance learning” OR “multi-instance learning” OR “Active Learning”) OR TS=(AI OR (“ML” NOT (“ ml” OR “g ml” OR “ui ml” OR “Ul ml” OR “iu ml” OR “u ml” OR “g ml” OR “ml kg” OR milliliter))))
AND ALL=(((ovar OR fallopian) AND (cancer OR mass OR carcinoma OR tumour OR tumor OR neoplasm OR malignan)) OR “peritoneal cancer” OR “peritoneal carcinoma” OR “peritoneal tumo”)
AND ALL=((digit AND patholog) OR “computational patholog” OR “tissue microarray” OR histopath OR histolog OR “Whole Slide Imag” OR “Tissue slide” OR “pathology slide” OR “pathology image” OR Immunohistochem OR ((Haematoxylin OR Hematoxylin) AND Eosin))
A.4 Cochrane Central Register of Controlled Trials
Search #1:
All text: (“Machine learn” OR “Artificial Intelligen” OR “Computer Vision” OR “Neural network” OR “Deep Network” OR “Computer-aided Diagnosis” OR “Computer aided Diagnosis” OR Perceptron OR “Convolutional Network” OR “Recurrent Network” OR “Graph Network” OR “Deep Learn” OR “Deep-Learn” OR Backprop OR “support vector” OR ensemble OR “random forest” OR “nearest neighbor” OR “nearest neighbour” OR “k-nearest neighbor” OR “k-nearest neighbour” OR “Gradient boost” OR “XGBoost” OR “segmentation” OR “instance learning” OR “multi-instance learning” OR “Active Learning”)
Search #2:
Title-Abstract-Keyword: (“AI” OR (“ML” NOT (“ ml” OR “g ml” OR “ui ml” OR “Ul ml” OR “iu ml” OR “u ml” OR “g ml” OR “ml kg” OR milliliter))) in Title Abstract Keyword
Search #3:
All text: (((ovar OR fallopian) AND (cancer OR mass OR carcinoma OR tumour OR tumor OR neoplasm OR malignan)) OR “peritoneal cancer” OR “peritoneal carcinoma” OR “peritoneal tumo”)
AND ((digit AND patholog) OR “computational patholog” OR “tissue microarray” OR histopath OR histolog OR “Whole Slide Imag” OR “Tissue slide” OR “pathology slide” OR “pathology image” OR Immunohistochem OR ((Haematoxylin OR Hematoxylin) AND Eosin))
Final search:
(#1 OR #2) AND #3
A.5 WHO-ICTRP
((“Machine learn” OR “Artificial Intelligen” OR “Computer Vision” OR “Neural network” OR “Deep Network” OR “Computer-aided Diagnosis” OR “Computer aided Diagnosis” OR Perceptron OR “Convolutional Network” OR “Recurrent Network” OR “Graph Network” OR “Deep Learn” OR “Deep-Learn” OR Backprop OR “support vector” OR ensemble OR “random forest” OR “nearest neighbor” OR “nearest neighbour” OR “k-nearest neighbor” OR “k-nearest neighbour” OR “Gradient boost” OR “XGBoost” OR “segmentation” OR “instance learning” OR “multi-instance learning” OR “Active Learning”) OR (“AI” OR (“ML” NOT (“/ml” OR “g/ml” OR “ui/ml” OR “Ul/ml” OR “iu/ml” OR “u/ml” OR “g/ml” OR “ml/kg” OR milliliter))))
AND (((ovar OR fallopian) AND (cancer OR mass OR carcinoma OR tumour OR tumor OR neoplasm OR malignan)) OR “peritoneal cancer” OR “peritoneal carcinoma” OR “peritoneal tumo”)
AND ((digit AND patholog) OR “computational patholog” OR “tissue microarray” OR histopath OR histolog OR “Whole Slide Imag” OR “Tissue slide” OR “pathology slide” OR “pathology image” OR Immunohistochem OR ((Haematoxylin OR Hematoxylin) AND Eosin))
Appendix B Data extraction
| \rowcolorgray!30 Category | Fields |
| Overview | Internal ID. Lead author. Year. Conference/Journal name. |
| Data | Number of development images. Total number of images. Type of samples. FFPE/Frozen. Size of images. Tissue of origin. Number of development patients. Total number of patients. Number of data collection centres. Type of stain. Number of stainers. Scanners. Number of scanner types. Number of tissue processing centes. Data origin countries. Number of pathologists for data labelling. Online dataset. Prospective/retrospective. Clinical/research tissue. Data annotation. Maximum magnification available. Supplementary datatypes. Data exclusion reasons. Number of images excluded. Other cancer types included. |
| Methods | Outcome. Outcome measure/classes. Outcome standards/definition. Magnifications used. Patch sizes. Patches per image. Task type. Feature extraction type. Feature extractors. AI in main method. Other AI methods. Optimiser. Number of external validations. Differences to external validation set. Total external validation images. Number of cross-validation folds. Number of non-novel methods compared. Number of GPUs. Type of GPUs. |
| Results | Internal test accuracy, error bounds. AUC, error bounds. Sensitivity/specificity, error bounds. Other metric 1, error bounds. Other metric 2, error bounds. Other metric 3, error bounds. External training type. External test accuracy, error bounds. AUC, error bounds. Sensitivity/specificity, error bounds. Other metric 1, error bounds. Other metric 2, error bounds. Other metric 3, error bounds. Type of error bounds. Model training time. Visualisation type. |
| Miscellaneous | Code availability. Data availability. Notes |