Ashkin-Teller phase transition and multicritical behavior in a classical monomer-dimer model
Abstract
We use Monte Carlo simulations and tensor network methods to study a classical monomer-dimer model on the square lattice with a hole (monomer) fugacity , an aligning dimer-dimer interaction that favors columnar order, and an attractive dimer-dimer interaction between two adjacent dimers that lie on the same principal axis of the lattice. The Monte Carlo simulations of finite size systems rely on our grand-canonical generalization of the dimer worm algorithm, while the tensor network computations are based on a uniform matrix product ansatz for the eigenvector of the row-to-row transfer matrix that work directly in the thermodynamic limit. The phase diagram has nematic, columnar order and fluid phases, and a nonzero temperature multicritical point at which all three meet. For any fixed , we argue that this multicritical point continues to be located at a nonzero hole fugacity ; our numerical results confirm this theoretical expectation but find that very rapidly as . Our numerical results also confirm the theoretical expectation that the corresponding multicritical behavior is in the universality class of the four-state Potts multicritical point on critical line of the two-dimensional Ashkin-Teller model.
I Introduction
Dimer models provide interesting examples of entropy-dominated physics [1]. On planar graphs in the fully-packed limit (i.e., with hole fugacity set to zero), they are exactly solvable by Pfaffian methods[2, 3, 4]. These methods allow for a detailed characterization of the critical power law correlations of such fully packed dimer models on the square and honeycomb lattices [5]. This critical behavior also admits an interesting description in terms of a coarse-grained action for a fluctuating height field [1].
The analogous fully packed dimer model in three dimensions as well as two-dimensional bilayer models are not exactly solvable even at full packing, nor are related models with an admixture of hard squares. Several such models have been studied using numerical simulations and coarse-grained effective field theory ideas [6, 7, 8, 9]. Connections to the physics of quantum dimer models [10] and resonating valence bond wave functions [11, 12, 13] have also been explored [14, 15].
Interactions and nonzero hole fugacity also preclude the possibility of an exact solution even in the simple square lattice case. Nevertheless, the phase diagram on the square lattice in the presence of nonzero hole fugacity and an aligning interaction that favors two parallel dimers on a square plaquette has been studied in detail using numerical simulations [16, 17, 18]. These studies reveal that the aligning interactions drive a transition to columnar order at low temperature and fugacity . In the columnar ordered phase, both lattice rotational symmetry and translational symmetry are spontaneously broken, and almost all dimers align in the same direction.
In this system, the transition from this columnar ordered state to the dilute high-temperature dimer fluid has a continuously varying correlation length exponent , although the anomalous exponent associated with the columnar order parameter remains fixed at as long as the transition remains second-order in nature [17, 18]. For temperatures below a tricritical value, the transition turns first order [17, 18]. In the regime with a continuously varying correlation length exponent , long distance properties are controlled by the physics of the Ashkin-Teller fixed line [19, 20, 21], for which the value of serves as a convenient universal coordinate [7]. Indeed, this particular microscopic realization of Ashkin-Teller criticality is described by the portion of the Ashkin-Teller fixed line that starts at its Kosterlitz-Thouless endpoint (corresponding to the transition in the fully packed dimer model, with formally equal to infinity) and continues on to the four-state Potts point (corresponding to the tricritical transition of this dimer model, with ) on this fixed line [17, 18].
In related work [22], Papanikolaou et al also studied the effect of an additional dimer interaction that competes with the aligning interaction and hole fugacity on the square lattice. The additional interaction represents an attraction between two adjacent dimers on the same principal axis of the square lattice and favors nematic order. In such a nematic state, lattice translation symmetry is preserved, but the symmetry of rotations by is spontaneously broken. As a result, in the thermodynamic limit, where is the number of horizontal dimers, is the number of vertical dimers, and the angular brackets denote the equilibrium average. The presence of such a state at low enough temperature and small enough hole fugacity was also rigorously established [23, 24].
Consequently, the phase diagram in the presence of both interactions and is rich, and supports three different phases at nonzero hole density: a dilute fluid phase, a nematic phase, and a columnar ordered phase. Previous work [22] characterized the phase diagram in the - plane in some detail. This analysis led to the following conclusion [22]: When both interactions are nonzero and compete with each other, the transition from the low low columnar solid to the fluid proceeds in two steps, an Ising transition from columnar order to nematic order, and a second Ising transition from nematic order to fluid. In this scenario [22] for the phase diagram in the - plane, there are thus two Ising lines emerging from the Kosterlitz-Thouless transition point when and compete with each other. In the limit, the first of these pivots coincides with the temperature axis of the - phase diagram, rendering the low-emperature columnar order unstable to infinitesimal .
Having two Ising transition lines emanate from the Kosterlitz-Thouless transition point on the temperature axis throws up an interesting puzzle when considered from the point of view the coarse-grained field theory ideas used earlier in closely related contexts [7, 18, 17]. At issue is the fact that the Kosterlitz-Thouless point on the axis at is expected to continue on to an Ashkin-Teller line as one turns on a small and lowers the temperature slightly.
This fits in with the fact that Kosterlitz-Thouless criticality is known to emerge as the limiting behavior at one end of the Ashkin-Teller line when as this end point is approached. Additionally, it is also well-known that if a line of Ashkin-Teller transitions bifurcates into two Ising lines at a multicritical point, this multicritical point is expected to have four-state Potts symmetry. As a result, one expects that the correlation length exponent tends to as this point is approached along the Ashkin-Teller line [20, 25, 21].
Having two Ising transition lines emanate from the Kosterlitz-Thouless transition point on the temperature axis would violate both these expectations. Resolving this puzzle is our principal motivation for revisiting this phase diagram with a pair of complementary techniques, namely, tensor network (TN) computations and large-scale Monte Carlo (MC) simulations using our grand-canonical generalization of the dimer worm algorithm [17, 26, 27].
The tensor network computations use a matrix product operator representation of the row-to-row transfer matrix to obtain a variational uniform matrix product (uMPS) approximation to its top eigenvector (with largest eigenvalue) [28, 29, 30, 31]. This computational method allows efficient scans of large swathes of the phase diagram as well as direct determination of the central charge and scaling dimensions at critical points. Since it works directly in the thermodynamic limit, the accuracy is only limited by the systematic error associated with the finite internal bond dimension for the tensors used in the matrix product representation; this error can be rendered negligible by choosing a large enough bond dimension. In contrast, the MC results only have statistical sampling errors, but include finite-size effects. We comment on the conventional transfer matrix method on a stripe. Although it can be applied to the monomer-dimer model, the width of a stripe is limited because the size of the transfer matrix grows exponentially [16, 17]. Since the maximum width is much smaller than the correlation length obtained by our simulations near the critical point, we do not adopt this method.
In the next section, we define the monomer-dimer model. In Sec. III, we explain the numerical methods used in this paper. Our numerical results are shown in Sec. V. The last section is devoted to discussion and conclusions.
II Monomer-Dimer Model
We consider a classical hard-core monomer-dimer model with two kinds of attractive dimer-dimer interactions on the square lattice. The classical Hamiltonian in the grand canonical ensemble is given as
| (1) |
Here, denotes the dimer occupation number of a link between neighboring sites, and , and is the monomer occupation number at a site . These occupation numbers take the value or , and should satisfy because of the hard-core constraint.
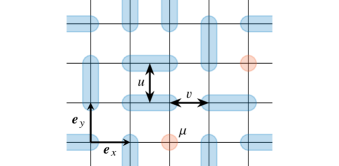
The term in the first term of Eq. (1) is the interaction between two dimers on a plaquette. On the other hand, the term acts on two adjacent dimers aligning in the dimer direction (Fig. 1). We call the former the plaquette interaction and the latter the dimer-aligning interaction as well as Ref. [22]. We assume that and are non-negative, that is, both the interactions are attractive. The last term of Eq. (1) is the chemical potential of monomers. The fugacity of a monomer at the temperature is defined as , where is the inverse temperature. In this paper, we set as a unit of energy so that the perfectly columnar ordered state at full packing has a constant energy per site, .
When the plaquette interaction is sufficiently large, the columnar ordered phase appears. This phase spontaneously breaks the symmetry of lattice rotations about a site, as well as lattice translational symmetry along one principal axis. In contrast, in the nematic phase which is favored by the term, the system spontaneously choses to have macroscopically more dimers of one orientation over the other. Translational symmetries along both principal axes are preserved, but the system spontaneously breaks the symmetry of lattice rotations about a site.
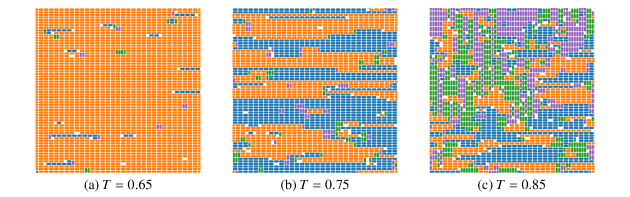
Typical configurations of three phases are shown in Fig. 2. These are generated by the MC simulations at and , using the method described in the next section for three temperatures, , , and , which correspond respectively to the columnar ordered, nematic and disordered fluid phases. From this depiction, it is clear that the nematic phase breaks the lattice rotational symmetry but does not break translational symmetry, while the columnar state breaks both lattice translation symmetry and rotational symmetry.
III Methods
As mentioned in Introduction, our computational study of this monomer-dimer model uses complementary methods. One employs our grand-canonical generalization of the dimer worm algorithm to perform Monte Carlo simulations, while the other uses tensor network methods. Below, we summarize each in turn.
III.1 Monte Carlo method
The usual dimer worm algorithm [27, 26, 17] provides a rejection-free nonlocal update scheme for interacting dimer models at full-packing. Here, we build on ideas developed in Ref. 32 to generalize this dimer worm algorithm and obtain an efficient grand-canonical algorithm for the monomer-dimer model at nonzero monomer fugacity. In the first step of our grand-canonical scheme, one chooses at random a site of the lattice. There are two possibilities at this first step: either the initially chosen site has a monomer on it, or it is covered by a dimer. Let us consider each in turn.
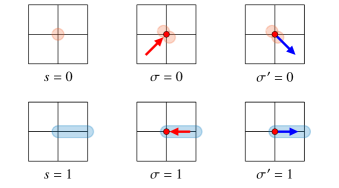
If has a monomer on it, we have five options at our disposal. The first four options consist of placing a dimer connecting the initial site to one of its four neighbors. The fifth option is to exit without doing anything. Each of these possibilities is assigned a probability from a probability table. We will discuss the construction of this probability table in some detail below. For now we simply introduce some language that will subsequently be useful in describing the construction of this probability table: the initial site is our first “pivot” site , which we have “entered” from the “entry” , i.e. from “outside the lattice” (Fig. 3). Aborting our attempted worm move at this step itself without doing anything corresponds to “exiting the pivot” via “exit” . On the other hand, if we opt to place a dimer connecting the pivot to its -th neighbor, this option corresponds to exiting the pivot via exit (so can take on values from 1 to 4). If the chosen exit is , we now move to the site corresponding to the chosen exit and continue the construction.
Before we describe what is done next, we need to specify the procedure to be used if the initially chosen site has a dimer covering it. In this case, one walks to the other end of this dimer; the site covered by this other end becomes our first pivot , which we have “entered” from the entry corresponding to . Now, the choices available are again five in number: One can delete this dimer that connects the pivot site to the entrance site . This introduces two monomers in the system and concludes the worm move. As before, this corresponds to “exiting” the first pivot via exit . Or, one can pivot the dimer covering so that it now connects to its -th neighbor. If one of these latter four options is chosen, we say the pivot is exited via exit number , and we move to the site corresponding to the chosen exit to proceed further as described below.
At this stage of our worm construction, we are at the site corresponding to exit of the previous pivot, having arrived there because we chose to place a dimer connecting the previous pivot point to this exit site. If this site does not already have another dimer covering it, we have reached an allowed configuration and the worm move ends. On the other hand, if this exit site does have another dimer already covering it, this site becomes the current “overlap site” . We now walk along this pre-existing dimer from to its other end. The site at this other end becomes our next pivot site , which has been “entered” via entry number that corresponds to the overlap site .
At this step, there are again five choices for , the exit to be used to exit the current pivot site . As before, exit corresponds to deleting the dimer covering the current pivot site . If this is chosen, the worm move ends. On the other hand, exits numbered through correspond to pivoting the dimer covering so that it now connects to the site corresponding to . If this exit site does not already have a dimer covering it, we have reached an allowed configuration and the move ends. Otherwise, this exit site becomes the next overlap site , and the procedure is repeated.
It is easy to see that this worm construction yields a valid rejection-free algorithm if we choose the probability table for transition probabilities in a way that it satisfies local detailed balance at each step. This amounts to requiring that the probability obeys the constraint equations:
| (2) |
Here, is the conditional probability for exiting a pivot via exit given that we have entered it via entrance , is the conditional probability for the reverse process, and the weights and represent the Boltzmann weights of the configurations corresponding to the choices and , respectively. These Boltzmann weights are to be calculated ignoring the violation of the hard-core constraint on dimers in the configurations that arise during the worm construction.
The simplest choice of solution is the heat-bath solution (sometimes called the Gibbs sampler) given as . In practice, we use the iterative Metropolized Gibbs sampler to reduce the bounce process [33], i.e., reduce the magnitude of the diagonal elements of the probability table. Note also that the computation of the weights and is simplified by the fact that they only differ due to factors arising from the contribution of the immediate neighborhood of the pivot. Since the equation set is homogenous, we can cancel all common factors to define reduced weights that only depend on the local environment of the pivot, and use these in Eq. (2).
These reduced weights can be written as
| (3) |
where () denotes the number of nearest neighbor dimers parallel in the transverse (longitudinal) direction to the dimer that covers the pivot when the configuration corresponds to entrances/exits . These numbers can be calculated by checking the direction of dimers on eight sites around , that is, , , , . The number of valid configurations in these eight sites is , much smaller than .
The factor of in the first term of Eq. (3) reflects the fact that configuration has one fewer dimer, i.e., two additional holes (monomers) in comparison with the configurations with .
Finally, we note for completeness that this worm construction and its detailed balance property generalizes straightforwardly to lattices with arbitrary coordination number. The “out-of-plane” entrance/exit in the general case is numbered , and the other entrances/exits are numbered from to , where is the coordination number of the pivot site in question ( can be different for different sites, and there is thus no restriction of regularity for this algorithm to remain valid)
Using this algorithm, we perform the MC simulations of systems with periodic boundary conditions for system size up to . The number of the worm updates used per Monte Carlo step is chosen for each set of control parameters to be such that , is the mean number of sites visited during the construction of a single worm. We perform worm updates to estimate and to thermalize the system before measuring physical quantities. With this convention defining a MC step, we ensure that we obtain at least MC configurations of the system from which we can calculate equilibrium properties.
III.2 Tensor network method
The tensor network representation of our model is based on the singular value decomposition of the local Boltzmann weight on a bond. The partition function is rewritten as the contraction of the tensor network,
| (4) |
The tensor is located on sites of the square lattice and has four indices representing links to the nearest neighbor sites. An element of has the form
| (5) |
where denotes the local configuration at a site as shown in Fig. 3. The matrices ’s are determined by the singular value decomposition of the local Boltzmann weight on a bond. The Boltzmann weight on a horizontal bond is represented as a matrix,
| (6) |
where the row (column) index of corresponds to a state at (), respectively. Elements with a value of zero indicate a configuration prohibited by the hard-core constraint. The singular value decomposition, , defines and . We note that and can be chosen to be real orthogonal matrices since is a real square matrix. Similarly we obtain the Boltzmann weight on a vertical bond between (row) and (column) as
| (7) |
and we define and . The chemical potential of a monomer acts as the external field and gives the corresponding on-site factor as
| (8) |
The first term has the factor of in contrast to Eq. (3). The former corresponds to the Boltzmann weight for valid configurations of our monomer-dimer model, while tha latter is for extended configurations containing one doubly occupied site.
The row-to-row transfer matrix with infinite width is represented as a uniform matrix product operator with a local tensor . Using the variational uniform matrix product state algorithm (VUMPS) [28, 29, 30, 31], we calculate the eigenvector corresponding to the largest eigenvalue of the transfer matrix. The uniform matrix product state (uMPS) obtained in this way approximates this eigenvector with accuracy that is controlled by the bond dimension of the uMPS. We increase up to to ensure sufficient accuracy. In practice, we assume that the uMPS has a unit-cell structure [31] as is appropriate for a description of the columnar ordered state. After calculating the horizontal uMPS in this way, we also calculate the vertical uMPS, which approximates the corresponding eigenvector of the column-to-column transfer matrix. A good initial guess for the vertical uMPS can be given by the fixed point tensor of the horizontal uMPS [28]. We have confirmed that the physical quantities calculated from the horizontal and vertical uMPS agree with each other to machine precision even in the ordered phases.
IV Observables and interpretation
We now summarize the definitions and physical significance of the various observables of interest to us in this problem, and indicate how they may be accessed in either of the computational methods we use.
IV.1 The order parameters and Binder ratios
We detect columnar order using a complex order parameter constructed from the following local order parameter field defined at each site as
| (9) |
The corresponding order parameter,
| (10) |
takes or when the state has the complete columnar order.
Nematic order, which breaks the symmetry of rotations, can be detected by comparing the number of horizontal and vertical dimers. With this motivation, we define the local nematic order parameter field as
| (11) |
The corresponding order parameter,
| (12) |
takes on values both in the nematic and columnar states.
The corresponding Binder ratios [34] are defined in the usual way:
| (13) |
As is well-known, the Binder ratios converge in the ordered phase to as the denominator and numerator take on the same limiting value in the thermodynamic limit. On the other hand, in a phase without symmetry breaking, the limiting value depends on the nature of fluctuations of the order parameter. in the nematic and in the disordered fluid phase are both expected to converge to in the thermodynamic limit because the fluctuations of the corresponding order parameters obey a one-dimensional Gaussian distribution in these regimes. On the other hand, in the disordered fluid phase because the fluctuations of obey a two-dimensional Gaussian distribution. We note that the conventional and Ising definition of the Binder parameter for the frustrated Ising model discussed in Ref. [35] correspond and , respectively. Since the Binder ratio is a dimensionless quantity in the sense of the renormalization group, curves that represent the dependence of a Binder ratio on a control parameter ( or ) for systems of different sizes are all expected to cross at the critical value of the control parameter. This allow us to locate the phase transitions involving loss of order in a convenient way.
IV.2 Correlation length and entanglement entropy
The correlation length is obtained as
| (14) |
where () is the (second) largest eigenvalue of the transfer matrix defined by the uMPS. We note that the uMPS is always normalized such that , and the factor comes from the unit-cell size of the uMPS. Since we calculate the uMPS in both the horizontal and vertical directions, two kinds of correlation length exist in a phase that breaks the symmetry of lattice rotations. The “transverse” correlation length is measured along the direction perpendicular to the dimers, while the “longitudinal” correlation length is in the direction parallel to the dimers. In the disordered fluid phase, both correlation lengths are the same as expected. In the nematic phase, a level crossing of occurs, and takes a smaller value than below a certain temperature. In the columnar ordered phase, we always have . In other words, the correlation length scale along the dimers become larger than in the perpendicular direction. Thus, the transverse correlation length seems to be suitable for studying the phase transition between the columnar ordered and disordered fluid phases. We also note that corresponds to the truncated correlation function and takes a finite value even in the ordered phase.
The entanglement entropy is defined as
| (15) |
where denotes the singular value of the core matrix in the mixed canonical form of the uMPS. Since we calculate the horizontal and vertical uMPS with a unit-cell structure, may depend on direction and position in the unit cell. In the disordered and nematic phases, we find that the all are equal to each other. On the other hand, in the columnar ordered phase, we find that takes on two values, depending on whether the core matrix of the horizontal uMPS is on a dimer or between dimers. The former always yields the larger . In our analysis below, we use the largest entanglement entropy thus obtained.
IV.3 Connection with coarse-grained Ashkin-Teller description
It is instructive to think in terms of a coarse-grained version of our local complex columnar order parameter field , and write
| (16) |
Clearly, the corresponding coarse-grained version of the local nematic order parameter field satisfies
| (17) | |||||
The defined in the above are two coarse-grained Ising fields. In the columnar ordered phase, both and are ordered; this correctly accounts for the four-fold symmetry breaking in the columnar ordered state. Nematic order corresponds to the product being ordered, without any long range order in the individual . From the symmetries of the original problem, we see that interchanging the is a symmetry of the theory. Thus, the natural description is in terms of a symmetric Ashkin-Teller theory with two Ising fields and .
This connection to the physics of the Ashkin-Teller model [19, 20, 21] yields a wealth of information. For instance, along a line of continuous transitions from the columnar ordered state to the disordered fluid state, we expect the critical behavior to controlled by the critical properties of the corresponding fixed line in the Ashkin-Teller model. Along this line, both the Ising fields and have a fixed anomalous dimension of [19, 20, 21]. Since the columnar order parameter is linear in the Ising fields , we expect it to also scale with an anomalous exponent all along the line of continuous transitions between columnar ordered and disordered fluid phases.
Along the fixed line of the Ashkin-Teller theory, scales with an anomalous dimension that varies continuously [19, 20, 21] and is related to the continuously varying correlation length exponent by the Ashkin-Teller relation . Since the nematic order parameter , we expect it to have an anomalous dimension [7] given by this relation all along the line of continuous transitions between columnar ordered and disordered fluid phases.
In the Ashkin-Teller model, the point at which Ashkin-Teller line splits into two lines of Ising transitions is known to have the symmetries for the four-state Potts model [19, 20, 21, 25] ; in the phase between these two Ising transition lines, is ordered although and remain individually disordered . The enhanced Potts symmetry at this multicritical point implies that , , and all have the same anomalous exponent. Thus at this point, and the Ashkin-Teller relation implies . Given the correspondence made above, this implies that the nematic order parameter is expected to have an anomalous exponent of at the multicritical point at which the Ising phase boundaries of the nematic phase meet the line of continuous transitions between columnar ordered and disordered fluid phases.
From this perspective, it is clear that the value of (or equivalently ) serves as a universal coordinate for the line of continuous transitions from the columnar ordered phase to the disordered fluid phase. At full-packing, i.e., , the system has a description in terms of a coarse-grained Gaussian height action for a scalar height , and the transition from the power-law ordered high temperature state to the low temperature state is expected to be governed by a Kosterlitz-Thouless transition at which the leading cosine nonlinearity becomes relevant. As a result, one expects as along the line of continuous transitions between the columnar ordered state and the disordered fluid state. From this it is clear that the multicritical point at which the two Ising lines meet cannot be at , since this multicritical point corresponds to a value of .
This theoretical perspective and the resulting expectations informs much of the data analysis we present in the next section.
V Numerical results
Before getting into the details, it is useful to provide a summary of our results for representative slices through the phase diagram, as these slices clarify the overall picture and help answer the question raised in Introduction.
V.1 Overview
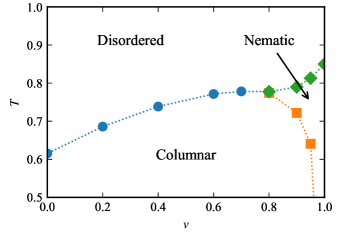
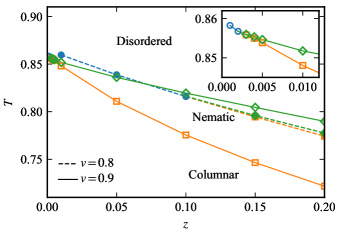
To this end, we first consider a fixed slice and display the computed two-dimensional phase diagram in the – plane (with ). This is shown in Fig. 4.
For , there is a direct temperature driven phase transition between the columnar ordered and disordered fluid phases. As is increased further, this phase boundary splits slightly below into two transition lines and the nematic phase appears as an intermediate phase beyond this multicritical point at which three transition lines meet. We have also checked that a corresponding slice at somewhat larger reduces the temperature scale of the transitions. The transition temperatures shown in Fig. 4 is determined from the peak position of the correlation length estimated by the TN method. The result of the MC method agrees with it within errors that are smaller than the symbol sizes used.
Next we consider slices with fixed and (with ) and display the computed two-dimensional phase diagram in the – plane. This is shown in Fig. 5. The transition points are determined in the same way as Fig. 4. Since the fully packed system is particularly challenging for TN computations, we do not extend our study all the way to . Nevertheless, we are able to go to low enough to demarcate the essential features of the phase diagram. It would be difficult to obtain this phase diagram using the MC method because the phase boundaries cannot be calculated with such precision due to the finite size effect.
At , the low-temperature nematic phase is quite narrow and disappears below the multicritical value of which is close to . On the other hand, for , the nematic phase is very broad and seems to exist even at very low values of . However, our detailed computations reveal that there is no nematic state below a multicritical threshold value of which is close to (Fig. 5). The actual monomer densities associated with these multicritical points are extremely small: For , the multicritical monomer density is about . At , the multicritical monomer density is a much lower value of .
This conclusion is contrary to that of Ref. [22]. However, it is entirely consistent with our understanding of the phase boundaries based on the coarse-grained effective field theory. Indeed, as we have already reviewed earlier, the multicritical point is expected to have rather different universal behavior from the transition at full packing since the former is expected to correspond to a and the latter corresponds to (where is the anomalous exponent associated with the nematic order parameter). As a result, for , there is no consistent scenario in which the multicritical point coincides with the transition at full packing. The resolution is of course that the multicritical value of approaches extremely rapidly as is increased, but does not reach at any finite .
In the rest of this section, we display our results for a few representative values of and , and provide a detailed account of the analysis that leads to these phase diagrams and this overall conclusion.
V.2 Detailed analysis
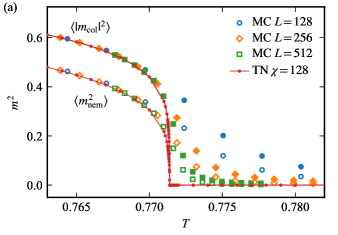
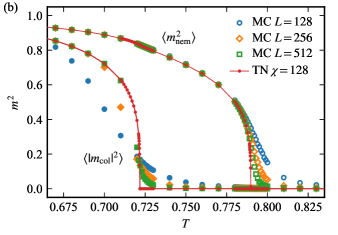
We use both tensor network (TN) and Monte Carlo (MC) methods to obtain the nematic and columnar order parameters, since these two complementary methods provide a nontrivial consistency check on each other. Figure 6 shows the temperature dependence of the order parameters at and with .
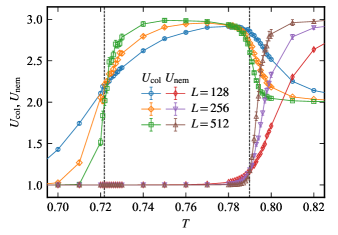
At , both the order parameters take on nonzero values below , signaling the onset of columnar order. On the other hand, at , we find that a nematic phase exists between and , as is clear from the fact that the columnar order parameter vanishes but the nematic order parameter takes on a nonzero value. The transition temperatures are estimated by identifying the crossing points of the Binder ratios, as shown in Fig. 7 for the Binder ratios calculated by the MC simulations at and . These crossing points are found to be consistent with the transition temperature estimated by the TN method.
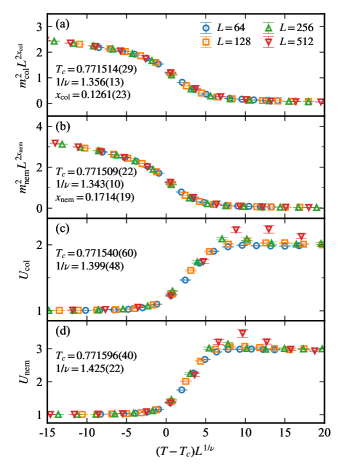
We obtain the scaling dimensions of various quantities at these transitions by performing a finite-size scaling (FSS) analysis, using the following FSS form for the columnar and nematic order parameters,
| (18) |
where denotes the scaling dimension of the corresponding operator (); these scaling dimensions are related to the anomalous exponents introduced earlier via , . Likewise, the scaling dimension of the energy operator is related to the correlation length exponent introduced earlier: .
We use the kernel method [36] to infer the critical exponents and the critical temperature and estimate their confidential intervals. At the best fit value of the scaling dimensions and the transition point, all data collapse reasonably well onto a single curve as shown in Fig. 8.
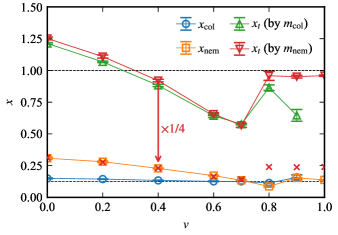
The scaling dimensions are plotted in Fig. 9. Below the multicritical point, i.e., along the line of continuous phase transitions between the columnar ordered and disordered fluid states, the scaling dimensions and are seen to continuously change with , while remains constant at a value consistent with the theoretical expectation of . We have checked that the corresponding exponents and satisfy the Ashkin-Teller relation , i.e., within our errors. On the other hand, we have for . This discontinuous change in the critical index ratio strongly suggests the change from the single transition to the two separate transitions, i.e., the existence of the multi-critical point. The expected at the multicritical point is actually realized at about . Parenthetically, we note that we find a decoupled Ising point at about in the plane, where we have and .
The scaling dimension of the energy operator can also be estimated from the FSS analysis of the Binder ratio as shown in Fig. 8. Although the nonmonotonic behavior of the Binder ratio for columnar order and the relatively closely spaced successive transitions makes this difficult, we obtain almost the same results for from this analysis, as we do using the earlier analysis in terms of the order parameters. We emphasize that nonmonotonicity has to do with the differing character of the columnar order parameter fluctuations in the nematic and the disordered fluid phases, and the related presence of a proximate multicritical point. Similar nonmonotonicity has been noted in the - Ising model earlier [37]. In contrast to other examples of such behavior in frustrated Ising models, which is associated with a proximate weakly first order transition, we do not find evidence of any first-order transitions for the values of studied here.
Although it is difficult to completely exclude possibility of the weakly first-order phase transition around the multicritical point in our simulations, the weight of evidence suggests that the presence of a sizable term replaces the first order transition found in Refs. [16, 17] by an intermediate nematic phase flanked by two second-order Ising phase boundaries. This is consistent with the fact that generalized four-state clock models, which serve as a discrete hard-spin analog of the coarse-grained description in terms of order parameter fields and , are known for some parameter values to have such an intermediate phase flanked by two Ising lines that meet at a multicritical point with enhanced four-state Potts symmetry at the end of a line of Ashkin-Teller transitions [25].
The multicritical point at is expected to have the four-state Potts universality. It is difficult to determine accurate location of the multicritical point because of the finite-size or finite bond-dimension effect. To make matters worse, one also expects that a logarithmic correction appears at the four-state Potts model. Our data, however, support the symmetry at the multicritical point. The order parameters satisfy below , while for (Fig. 6). Thus we expect that at , which indicates the emergent symmetry.
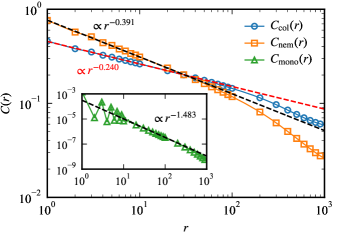
By definition, the scaling dimension also appears in the corresponding critical two-point correlation function as . We consider the correlation function along an axis because the uMPS can easily calculate it. The correlation function between the local quantities is defined as
| (19) |
In our TN simulation, runs over sites in the unit cell, which corresponds to a value of . For correlation between monomers, the truncated correlation function,
| (20) |
is expected to scale as . As shown in Fig. 10, the scaling dimensions extracted by the linear fitting of the correlation functions agree with the results obtained by the FSS analysis.
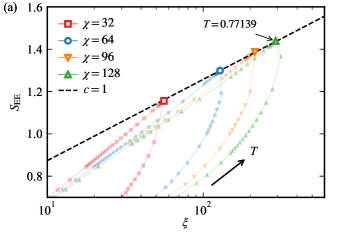
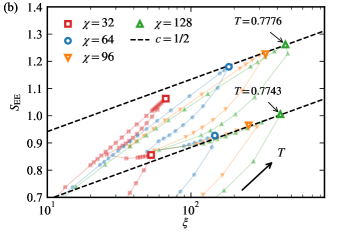
The central charge is another important universal property of a critical point. According to the conformal field theory, the correlation length and the entanglement entropy are related by the Calabrese-Cardy formula at criticality:
| (21) |
where denotes the central charge.
One of the advantages of the TN method is that these two quantities can be calculated naturally. Figure 11 clearly shows that the values obtained from the TN method are consistent with the Cardy-Calabrese formula (21). Based on the theoretical framework outlined in the previous section, the continuous phase transition between the columnar ordered and disordered fluid phases is expected to have a central charge of . On the other hand, the continuous Ising phase boundaries of the nematic phase are expected to have a central charge of . From the results displayed in Fig. 11, we see that our results do indeed conform to both these expectations.
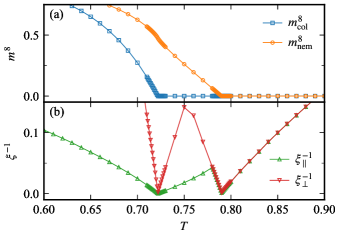
Above the multicritical point (), there are two phase transitions, the columnar-nematic and nematic-disorder ones. Although the FSS result of deviates from the expected value (Fig. 9), we believe that it is due to the correction to scaling and effects from another critical point. The TN result at shows that the eighth power of the order parameters and the inverse of the correlation length are linear to the temperature near the criticality (Fig. 12). This fact strongly indicates that these critical exponents satisfy and , which is consistent with the Ising universality.
Finally, we comment on the approach of the multicritical point to as is increased. This happens very rapidly, and simultaneously, the phase boundary between the columnar and nematic phases, shown by orange squares in Fig. 5, approaches the vertical temperature axis as increases. This is clear from monitoring the relative values of and as in our earlier discussion about the symmetry of the multicritical point. Eventually, in the limit , the columnar phase vanishes and only the phase boundary between the nematic and disordered phases remains.
VI Discussions and Summary
In this paper, we have studied the classical grand-canonical monomer-dimer model on the square lattice with two types of attractive interactions. We have determined the phase diagrams and analyzed the nature of the phase transitions using MC and TN methods. The phase transition between disordered and columnar ordered phases shows the same feature as the Ashkin-Teller transition, where the critical exponents change continuously. On the other hand, both nematic-disordered and columnar-nematic phase transitions belong to the Ising universality class. Our numerical results show that the multicritical point, where three phases meet, has a positive fugacity when .
Our conclusions and the theoretical framework within which they are situated has already been discussed at length. Here, we confine ourselves to highlighting one aspect of the phase diagram that appears to be worth further study. This has to do with the rapidity with which the multicritical point (at which the two Ising transitions meet the Ashkin-Teller line) moves towards as we increase . The proximity to the full-packing limit raises the possibility that aspects of this could be understood by expanding about the full-packing limit in some way. It would be interesting to explore this in future work. A related question has to do with the extent of the nematic phase itself in the – phase diagram at large . As noted in Ref. [22], one expects that the low-temperature phase at full-packing will be columnar ordered for any finite value of , no matter how large. However, the extent of this phase in decreases very rapidly with increasing , until, at asymptotically large values of , the columnar state only exists at full packing. Again, it would be interesting if some small expansion method could yield a more quantitative characterization of this phenomenon, which is very challenging to study by numerical methods.
Acknowledgements.
The work of S.M., H.-Y.L., and N.K. was supported by JSPS KAKENHI Grants No. JP19H01809 and No. JP20K03780. K.D. was supported at the Tata Institute of Fundamental Research by DAE, India and in part by a J. C. Bose Fellowship (JCB/2020/000047) of SERB, DST India, and by the Infosys-Chandrasekharan Random Geometry Center (TIFR). The inception of this work was made possible by a Visiting Professor appointment (K.D.) and associated research support at the Institute for Solid State Physics (ISSP), the University of Tokyo. The computational component of this work has been done using the facilities of the Supercomputer Center, ISSP.References
- Henley [2010] C. L. Henley, The “Coulomb phase” in frustrated systems, Annual Review of Condensed Matter Physics 1, 179 (2010).
- Kasteleyn [1961] P. Kasteleyn, The statistics of dimers on a lattice: I. the number of dimer arrangements on a quadratic lattice, Physica 27, 1209 (1961).
- Temperley and Fisher [1961] H. N. V. Temperley and M. E. Fisher, Dimer problem in statistical mechanics-an exact result, The Philosophical Magazine: A Journal of Theoretical Experimental and Applied Physics 6, 1061 (1961).
- Fisher [1961] M. E. Fisher, Statistical mechanics of dimers on a plane lattice, Phys. Rev. 124, 1664 (1961).
- Fisher and Stephenson [1963] M. E. Fisher and J. Stephenson, Statistical mechanics of dimers on a plane lattice. ii. dimer correlations and monomers, Phys. Rev. 132, 1411 (1963).
- Huse et al. [2003] D. A. Huse, W. Krauth, R. Moessner, and S. L. Sondhi, Coulomb and Liquid Dimer Models in Three Dimensions, Phys. Rev. Lett. 91, 167004 (2003).
- Ramola et al. [2015] K. Ramola, K. Damle, and D. Dhar, Columnar Order and Ashkin-Teller Criticality in Mixtures of Hard Squares and Dimers, Phys. Rev. Lett. 114, 190601 (2015).
- Desai et al. [2021] N. Desai, S. Pujari, and K. Damle, Bilayer coulomb phase of two-dimensional dimer models: Absence of power-law columnar order, Phys. Rev. E 103, 042136 (2021).
- Wilkins and Powell [2020] N. Wilkins and S. Powell, Interacting double dimer model on the square lattice, Phys. Rev. B 102, 174431 (2020).
- Rokhsar and Kivelson [1988] D. S. Rokhsar and S. A. Kivelson, Superconductivity and the Quantum Hard-Core Dimer Gas, Phys. Rev. Lett. 61, 2376 (1988).
- Albuquerque and Alet [2010] A. F. Albuquerque and F. Alet, Critical correlations for short-range valence-bond wave functions on the square lattice, Phys. Rev. B 82, 180408(R) (2010).
- Tang et al. [2011] Y. Tang, A. W. Sandvik, and C. L. Henley, Properties of resonating-valence-bond spin liquids and critical dimer models, Phys. Rev. B 84, 174427 (2011).
- Albuquerque et al. [2012] A. F. Albuquerque, F. Alet, and R. Moessner, Coexistence of Long-Range and Algebraic Correlations for Short-Range Valence-Bond Wave Functions in Three Dimensions, Phys. Rev. Lett. 109, 147204 (2012).
- Damle et al. [2012] K. Damle, D. Dhar, and K. Ramola, Resonating Valence Bond Wave Functions and Classical Interacting Dimer Models, Phys. Rev. Lett. 108, 247216 (2012).
- Patil et al. [2014] P. Patil, I. Dasgupta, and K. Damle, Resonating valence-bond physics on the honeycomb lattice, Phys. Rev. B 90, 245121 (2014).
- Alet et al. [2005] F. Alet, J. L. Jacobsen, G. Misguich, V. Pasquier, F. Mila, and M. Troyer, Interacting Classical Dimers on the Square Lattice, Phys. Rev. Lett. 94, 235702 (2005).
- Alet et al. [2006] F. Alet, Y. Ikhlef, J. L. Jacobsen, G. Misguich, and V. Pasquier, Classical dimers with aligning interactions on the square lattice, Phys. Rev. E 74, 041124 (2006).
- Papanikolaou et al. [2007] S. Papanikolaou, E. Luijten, and E. Fradkin, Quantum criticality, lines of fixed points, and phase separation in doped two-dimensional quantum dimer models, Phys. Rev. B 76, 134514 (2007).
- Ashkin and Teller [1943] J. Ashkin and E. Teller, Statistics of two-dimensional lattices with four components, Phys. Rev. 64, 178 (1943).
- Kadanoff and Brown [1979] L. P. Kadanoff and A. C. Brown, Correlation functions on the critical lines of the Baxter and Ashkin-Teller models, Annals of Physics 121, 318 (1979).
- Delfino and Grinza [2004] G. Delfino and P. Grinza, Universal ratios along a line of critical points. the Ashkin-Teller model, Nuclear Physics B 682, 521 (2004).
- Papanikolaou et al. [2014] S. Papanikolaou, D. Charrier, and E. Fradkin, Ising nematic fluid phase of hard-core dimers on the square lattice, Phys. Rev. B 89, 035128 (2014).
- Heilmann and Lieb [1979] O. J. Heilmann and E. H. Lieb, Lattice models for liquid crystals, Journal of Statistical Physics 20, 679 (1979).
- Jauslin and Lieb [2018] I. Jauslin and E. H. Lieb, Nematic liquid crystal phase in a system of interacting dimers and monomers, Communications in Mathematical Physics 363, 955 (2018).
- Alcaraz and Koberle [1980] F. C. Alcaraz and R. Koberle, Duality and the phases of z(n) spin systems, J. Phys. A: Math. Gen. 13, L153 (1980).
- Sandvik and Moessner [2006] A. W. Sandvik and R. Moessner, Correlations and confinement in nonplanar two-dimensional dimer models, Phys. Rev. B 73, 144504 (2006).
- Syljuåsen and Sandvik [2002] O. F. Syljuåsen and A. W. Sandvik, Quantum monte carlo with directed loops, Phys. Rev. E 66, 046701 (2002).
- Haegeman and Verstraete [2017] J. Haegeman and F. Verstraete, Diagonalizing transfer matrices and matrix product operators: A medley of exact and computational methods, Annual Review of Condensed Matter Physics 8, 355 (2017).
- Zauner-Stauber et al. [2018] V. Zauner-Stauber, L. Vanderstraeten, M. T. Fishman, F. Verstraete, and J. Haegeman, Variational optimization algorithms for uniform matrix product states, Phys. Rev. B 97, 045145 (2018).
- Vanderstraeten et al. [2018] L. Vanderstraeten, J. Haegeman, and F. Verstraete, Tangent-space methods for uniform matrix product states, SciPost Phys. Lect. Notes , 7 (2018).
- Nietner et al. [2020] A. Nietner, B. Vanhecke, F. Verstraete, J. Eisert, and L. Vanderstraeten, Efficient variational contraction of two-dimensional tensor networks with a non-trivial unit cell, Quantum 3, 328 (2020).
- Rakala and Damle [2017] G. Rakala and K. Damle, Cluster algorithms for frustrated two-dimensional ising antiferromagnets via dual worm constructions, Phys. Rev. E 96, 023304 (2017).
- Pollet et al. [2004] L. Pollet, S. M. A. Rombouts, K. Van Houcke, and K. Heyde, Optimal monte carlo updating, Phys. Rev. E 70, 056705 (2004).
- Binder [1981] K. Binder, Finite size scaling analysis of ising model block distribution functions, Zeitschrift für Physik B Condensed Matter 43, 119 (1981).
- Watanabe et al. [2023] H. Watanabe, Y. Motoyama, S. Morita, and N. Kawashima, Non-monotonic behavior of the Binder parameter in discrete spin systems, Prog. Theor. Exp. Phys. 2023, 033A02 (2023).
- Harada [2011] K. Harada, Bayesian inference in the scaling analysis of critical phenomena, Phys. Rev. E 84, 056704 (2011).
- Jin et al. [2012] S. Jin, A. Sen, and A. W. Sandvik, Ashkin-Teller Criticality and Pseudo-First-Order Behavior in a Frustrated Ising Model on the Square Lattice, Phys. Rev. Lett. 108, 045702 (2012).