Atomic-resolution imaging of carbonyl sulfide by laser-induced electron diffraction
Abstract
Measurements on the strong-field ionization of carbonyl sulfide molecules by short, intense, 2 µm wavelength laser pulses are presented from experiments where angle-resolved photoelectron distributions were recorded with a high-energy velocity map imaging spectrometer, designed to reach a maximum kinetic energy of 500 eV. The laser-field-free elastic-scattering cross section of carbonyl sulfide was extracted from the measurements and is found in good agreement with previous experiments, performed using conventional electron diffraction. By comparing our measurements to the results of calculations, based on the quantitative rescattering theory (QRS), the bond lengths and molecular geometry were extracted from the experimental differential cross sections to a precision better than pm and in agreement with the known values.
I Introduction
Probing the structure of small to medium-size molecules in the gas phase is a formidable challenge. Femtosecond x-ray diffractive-imaging experiments have been recently demonstrated at free-electron lasers (FELs) Küpper et al. (2014); Glownia et al. (2016) and first electron-diffraction experiments using relativistic electron beams have been performed Weathersby et al. (2015); Yang et al. (2016). Alternatively, new laser-based approaches are being developed that make use of strong-field ionization with intense and ultrashort laser pulses. In a strong laser field, an electron can tunnel ionize near the peak of the oscillatory laser field and is then accelerated in the field. Depending on the ionization time within the laser period, the electron can be driven back by the laser field and elastically scatter from its parent ion Corkum (1993). The scattered electron is accelerated again in the laser field, reaching a very high kinetic energy. This process is responsible for the appearance of a recollision plateau in the photoelectron momentum distribution. Extracting the differential scattering cross section (DCS) of the molecule from the angular distribution of these high-energy electrons allows to derive the molecular structure Spanner et al. (2004); Blaga et al. (2012).
Laser-induced electron diffraction (LIED) has been first applied in atoms Okunishi et al. (2008); Xu et al. (2012), in diatomic molecules Blaga et al. (2012); Xu et al. (2014) and more recently in polyatomic molecular systems, such as acetylene Pullen et al. (2015), ethylene Ito et al. (2017), and benzene Ito et al. (2016). To extract structural information from a LIED experiment, the returning electron wavepacket should have a de Broglie wavelength comparable with the bond lengths that occur in the molecule. This is typically achieved using a mid-infrared laser field, as the ponderomotive energy scales quadratically with the laser wavelength.
While coupled rotational-electronic wavepacket dynamics in NO Walt et al. (2017) and ultrafast bond breaking in acetylene dications in the presence of the strong ionizing laser field Wolter et al. (2016) have been recently characterized by LIED, the suitability of this technique for retrieving transient molecular structures following photoexcitation has yet to be demonstrated. In this context, carbonyl sulfide (OCS) is a particularly interesting system. Photoexcitation of ground-state OCS () in the (220–250 nm) UV wavelength range has been intensively investigated Brouard et al. (2007); Suzuki et al. (1998); Sivakumar et al. (1985) and is known to be dominated by a transition to the state, leading to fragmentation of the molecules predominantly into Brouard et al. (2007). Non-adiabatic coupling along the bending coordinate is responsible for the formation of low-speed fragments Suzuki et al. (1998) and the production of rotationally excited CO fragments Sivakumar et al. (1985). Therefore, OCS can serve as a benchmark to test the suitability of the LIED method for recording molecular movies of molecular dynamics, in this case imaging of molecular dissociation involving bending motion.
Interestingly, strong-field ionization of OCS, performed with 800 nm radiation and intensities above , showed evidence for a bending deformation of the molecule during Coulomb explosion Sanderson et al. (2002). This suggests that the molecular geometry can substantially change both during and after ionization, with a large impact on the retrieval of the molecular structure in a LIED experiment. Therefore, it is important to test the ability of the LIED technique to image the structure of the OCS molecule in its equilibrium geometry before performing any dynamical investigation.
Here, we present an LIED measurement on OCS molecules, photoionized by strong 2 µm wavelength laser pulses. Different from previous investigations Blaga et al. (2012); Pullen et al. (2015); Wolter et al. (2016), the experiment was performed using a velocity map imaging spectrometer Eppink and Parker (1997) that allowed the detection of all electrons with kinetic energies up to 500 eV. Our new experimental apparatus was benchmarked by strong-field ionization experiments on argon and krypton. DCSs extracted from measured photoelectron angular distributions for a recolliding electron energy of 100 eV were compared to results from partial-wave calculations for scattering of electrons by atoms performed using the Elsepa package Salvat, Jablonski, and Powell (2005), and agree very well. The same procedure was applied to the experimental data for OCS. Fitting the calculated DCS to the experimental one with the O-C and C-S bond lengths and the bending angle as adjustable parameters, we were able to confirm the linear structure and were able to extract the internuclear distances of the molecule to a precision better than 5 pm. Our experimentally determined values agree very well with reported bond lengths of the OCS molecule Dakin, Good, and Coles (1947) and suggest that accurate structures can be retrieved for OCS using the LIED technique.
II Experimental setup
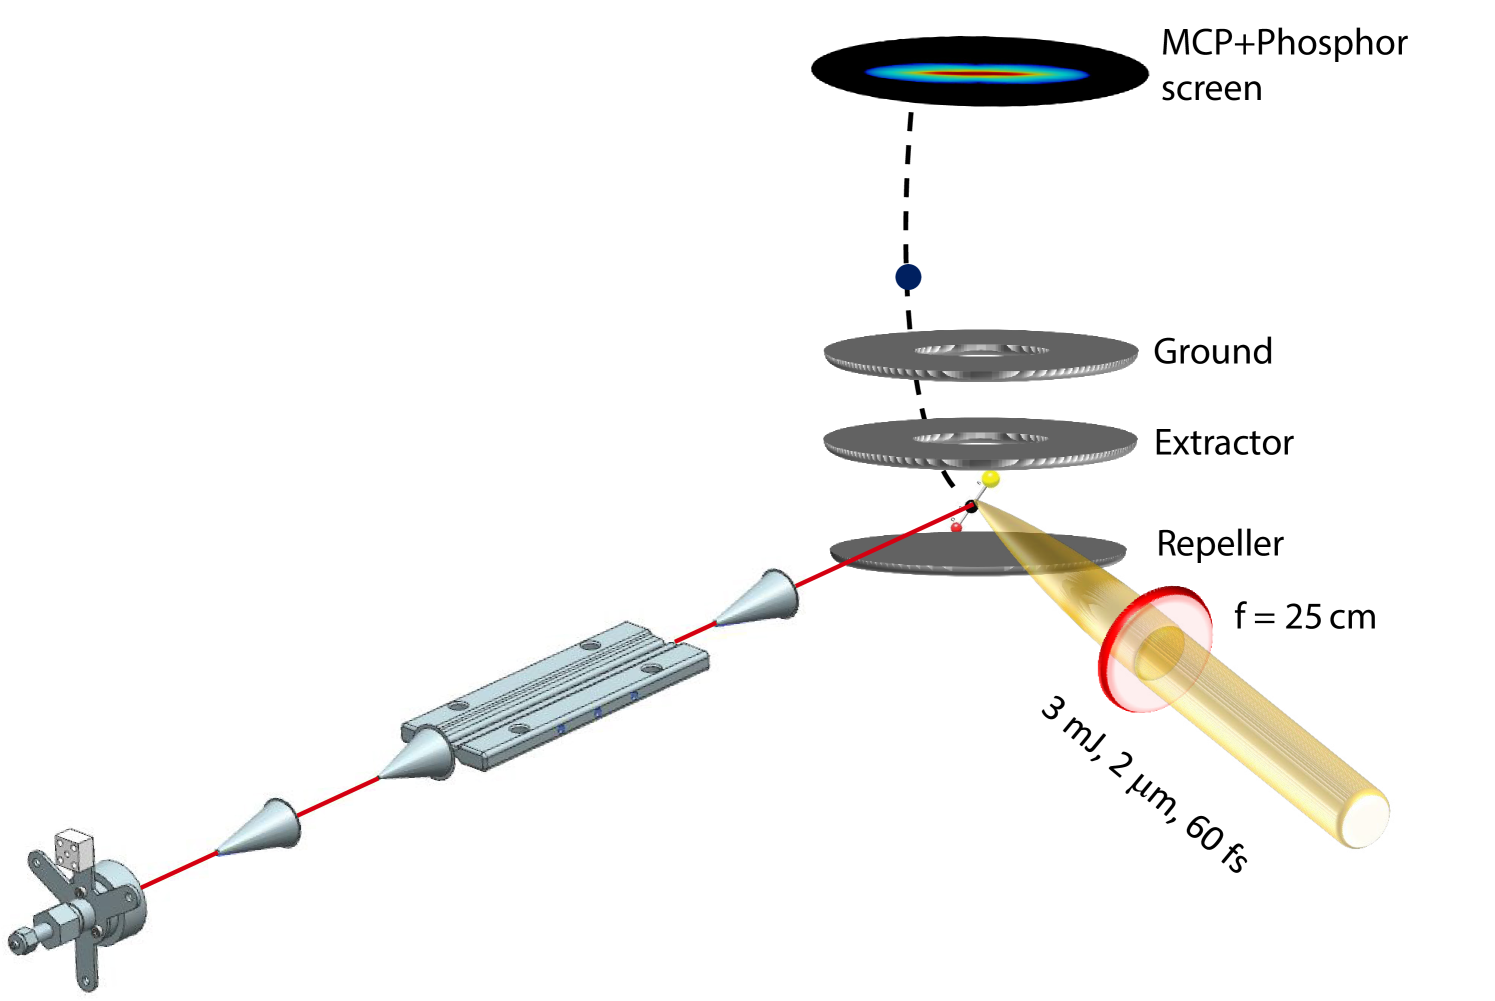
The experiments were performed using 2 µm radiation pulses, obtained from an optical parametric amplifier pumped by 800 nm laser pulses from a commercial amplifier system, delivering 30 mJ, 38 fs (full width at half maximum, FWHM) pulses at a repetition rate of 1 kHz. The linearly polarized 2 µm laser pulses were focused into a beam of nearly pure ground-state OCS molecules at the center of a high-energy velocity map imaging spectrometer (VMI) using a CaF2 lens with a 25 cm focal length, see Fig. 1 . The laser polarization axis was aligned in the plane of the detector, corresponding to the vertical axis in all images presented, vide infra.
The molecular beam was formed by supersonic expansion of a mixture of OCS in helium with a mixing ratio 1/2000 and a constant pressure of 90 bar, using an Even-Lavie valve running at a repetition rate of 250 Hz. In the experiments performed on atoms, a pure sample of either argon or krypton was expanded into vacuum, where the stagnation pressure was limited to 1 bar to avoid cluster formation. An electrostatic deflector Kienitz et al. (2017) was operated at kV to spatially separate OCS molecules from the helium carrier gas Chang et al. (2015). We note that this device is ideally suited for quantum-state selection and the preparation of structurally pure samples, even of complex molecules Chang et al. (2015); Teschmit, Horke, and Küpper (2018); Trippel et al. (2018). Here, the deflection provided the sample of OCS molecules in their rotational ground-state Nielsen et al. (2011); Karamatskos et al. (2018).
Photoelectrons from strong-field ionization (SFI) by the 2 µm laser pulses were accelerated into a 10 cm long field-free flight tube before being detected on a 77 mm diameter dual microchannel-plate/phosphor-screen assembly. The projected 2D electron momentum distributions were recorded using a CCD camera and inverted using an Abel-inversion procedure based on the BASEX algorithm Dribinski et al. (2002) in order to yield 3D electron momentum distributions.
III Results and discussion
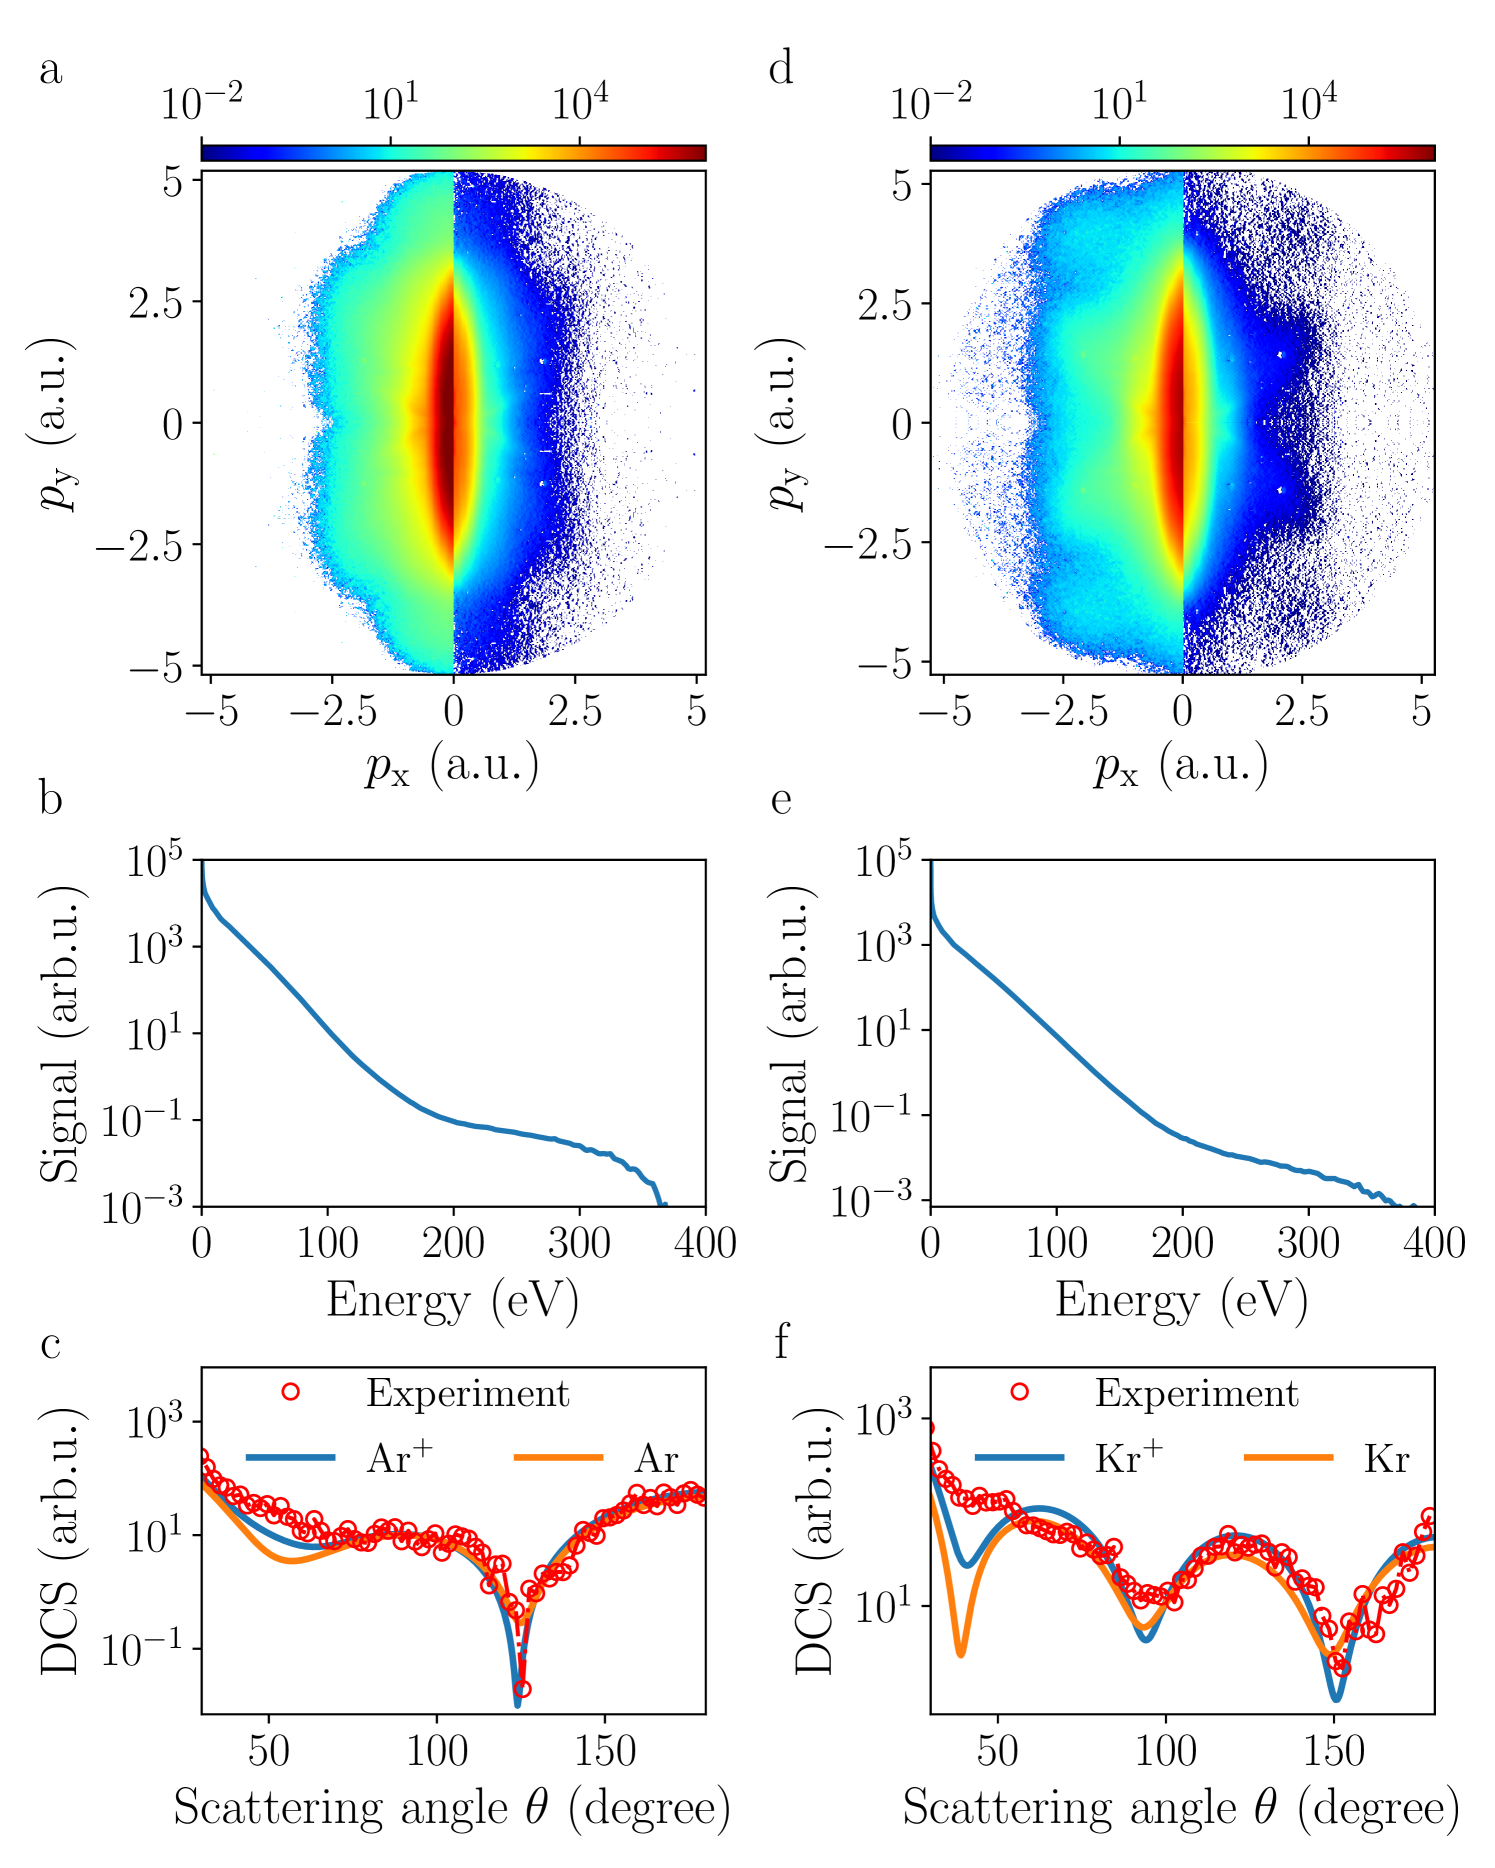
In order to validate our experimental methodology, experiments were first performed for pure samples of rare-gas atoms. Projected 2D electron momentum distributions recorded in argon and krypton and corresponding slices through their 3D momentum distributions are presented in Fig. 2 a, d. The laser intensity was , which corresponds to a Keldysh parameter of , with the ponderomotive energy eV, and eV the ionization potential, indicating that the experiment was performed deep into the tunneling regime. The angle-resolved photoelectron spectra were averaged over laser shots. To account for rest gas, an image obtained without atomic beam was subtracted from the 2D electron momentum distributions prior to Abel inversion.
In a classical picture of the strong-field ionization Corkum (1993), electrons that have experienced a single recollision with the parent ion can reach a maximum kinetic energy of 10 , whereas electrons that do not further interact with the parent ion – commonly called “direct electrons” – can have a maximum kinetic energy of 2 . In our measurement, the direct electron yield is five to six orders of magnitude larger than the contribution from rescattered electrons, see Fig. 2 . For argon and krypton, the photoelectron spectra observed experimentally extend to a kinetic energy close to 400 eV.
Field-free DCSs of argon and krypton were extracted from our measurements following a procedure given by the quantitative rescattering theory Chen et al. (2009); Xu et al. (2010). The high-energy rescattered photoelectron momentum distribution is expressed as the product of the momentum distribution of the returning electron (with the momentum at the instant of recollision) and the DCS , with the scattering angle. The relationship between the measured electron momentum and is obtained by considering that the scattered electrons gain an additional momentum after the recollision, which is given by the vector potential at the time of recollision :
| (1) | |||||
| (2) |
with defined as the laser polarization axis. According to the classical equations of motion and neglecting the effect of the Coulomb potential on the electron trajectories, the maximum recollision electron momentum satisfies , with the magnitude of the vector potential, corresponding to a maximum kinetic energy of , i. e., eV for a wavelength of 2 µm and an intensity of . The DCS for the highest recollision energy can, therefore, be extracted from the photoelectron angular distribution (PAD) by measuring the photoelectron yield on a circle with radius Okunishi et al. (2008) and centered at . We note that this procedure yields the DCS weighted by the ionization yield.
Fig. 2 c, f shows the field-free DCS extracted for argon and krypton using this method. The results were obtained using an integration range of and an angular integration width of . For krypton two pronounced minima at scattering angles of and are clearly observed. For argon, the DCS presents a strong dip near and a broad minimum near . These results are in very good agreement with previous LIED experiments Xu et al. (2012) as well as with conventional electron-scattering experiments using an external electron source Fon et al. (1983); Fon, Berrington, and Hibbert (1984). The DCS for both atomic targets compare also very well with theoretical calculations for field-free electron–atom collisions obtained using the Elsepa package Salvat, Jablonski, and Powell (2005), shown as orange and blue curves in Fig. 2 c, f. In these calculations, the nuclear charge distribution was approximated by a point charge and the electron charge density of the atomic cation was evaluated from self-consistent Dirac-Fock calculations. Exchange and correlation-polarization potentials were neglected. The simulations were performed considering both, a neutral and an ionic, atomic target. We note that to achieve the best agreement with the experimental DCS, the magnitude of the vector potential and, therefore, the laser intensity used to extract the DCS from the PAD was fitted. Best agreement was found for intensities of and , with corresponding return electron kinetic energies of 98 and 107 eV, for argon and krypton, respectively. These values are in close agreement with the estimated intensity based on the laser-pulse parameters used in these experiments. We attribute the difference observed between the two atomic targets to a small variation of the pulse energy between the two measurements. The comparison between the experimentally retrieved DCS and the simulated DCS, obtained for a neutral and an ionic atomic target shown in Fig. 2 c, f, reveals that a better agreement is found when considering that the returning electron interacts with a singly charged atomic ion.
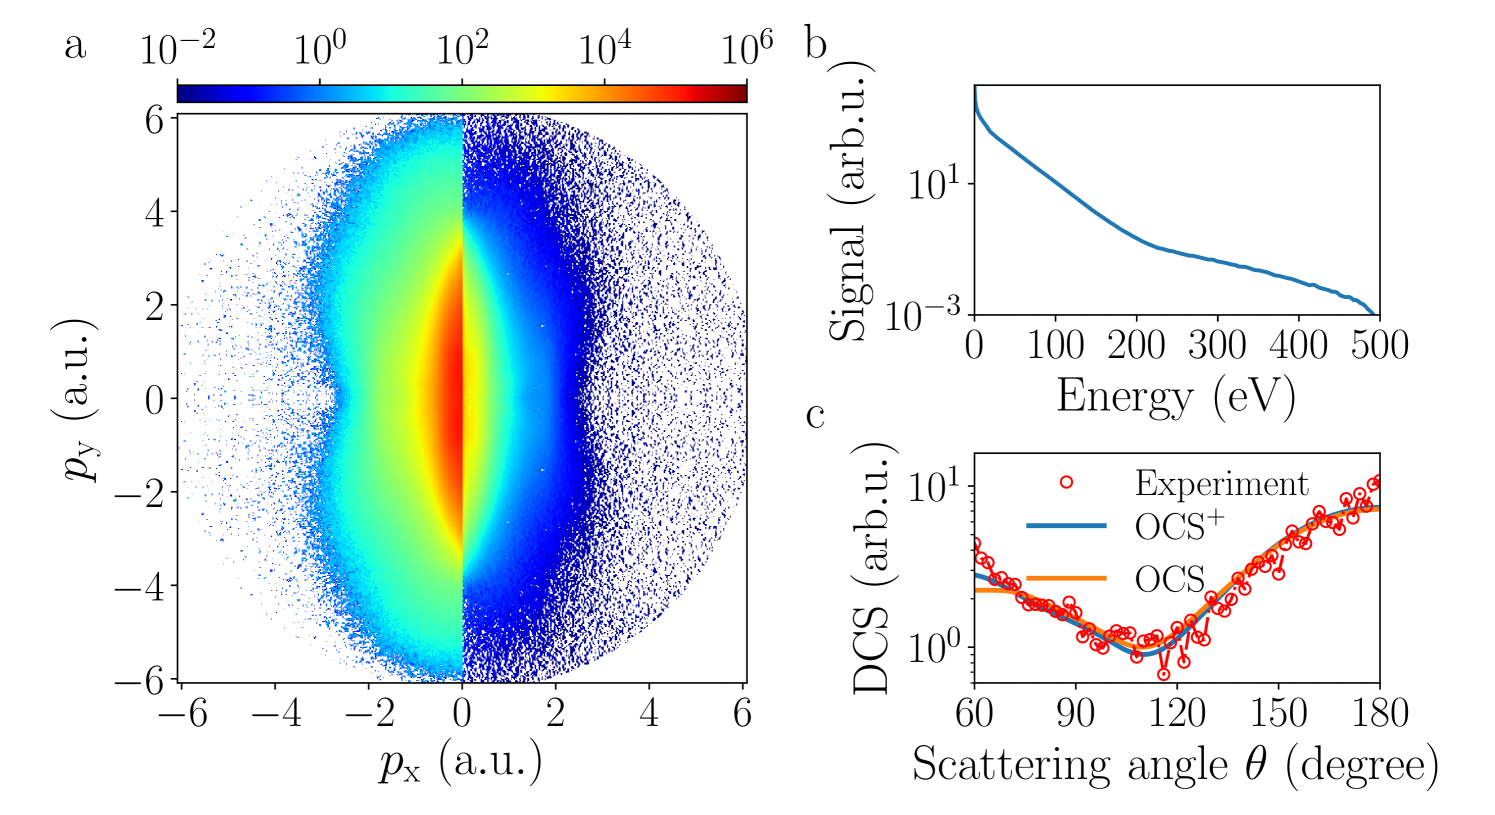
Subsequently, we recorded the PAD resulting from SFI of OCS. Note that no laser alignment was used in the experiment, and hence the OCS molecules were randomly oriented prior to their interaction with the laser. The laser intensity was adjusted to observe only the parent molecular ion in an ion time-of-flight measurement (fragmentation ) in order to minimize the influence of multiple ionization channels. The 2D momentum distribution recorded for OCS and its corresponding photoelectron kinetic-energy spectrum are shown in Fig. 3 a, b. The kinetic energy spectrum extends to 480 eV, suggesting an intensity , i.e., slightly higher than in the measurements for argon and krypton.
Similarly to the atomic case, the field-free DCS was retrieved from the PAD for a return electron energy of 100 eV and is shown in Fig. 3 c. A broad minimum near is observed, similar to previously reported electron-scattering experiments with 100 eV kinetic energy projectiles Murai et al. (2013); Michelin et al. (2000). The minimum observed at is known to be dominated by the atomic form factor of the sulfur atom, smeared out by the molecular structure Murai et al. (2013). To extract the internuclear distances of OCS from our measurement, we applied a procedure that was first introduced in reference Blaga et al., 2012 to retrieve the internuclear distance of diatomic molecules from LIED measurements. For a fixed-in-space molecule, oriented at Euler angles with respect to the laser polarization axis , the PAD is written as:
| (3) |
with the angle-dependent ionization probability. For an isotropic molecular sample the measured signal is then given by:
| (4) |
Recent studies Schell et al. (2018) have shown that the shape of molecular orbitals can leave its imprint on the recollision probability. Moreover, in molecular ionization, multiple orbitals can contribute to ionization Krečinić et al. (2018); Trabattoni et al. (2018). For OCS, the HOMO (IP=11.2 eV) and HOMO-1 (15.1 eV) orbitals are separated by 4 eV and the contribution of the HOMO-1 orbital to the ionization dynamics is expected to be negligible. Since randomly oriented molecules were used in the experiment, we assume that the influence of the shape of the molecular orbital from which the electron is emitted is washed out during the propagation of the electron wavepacket in the laser field. Using this assumption, the field-free DCS in (4) can be approximated by an independent-atom model (IAM) and expressed as:
| (5) |
with the momentum transfer , the internuclear distances and the scattering amplitude for atom . The returning electron interacts with the molecular ion, which we modeled by a singly charged sulfur atom and neutral carbon and oxygen atoms. This is well justified as the removal of an electron from the HOMO of OCS is expected to lead to a molecular ion with a final charge mainly localized on the sulfur atom Holmegaard et al. (2010), see the appendix for further details.
Combining the IAM with the QRS yields the following expression that was used for the analysis of our measurements:
| (6) |
The first term corresponds to an incoherent sum over the scattering amplitudes of the individual atoms whereas the second term corresponds to a molecular interference term. Following the standard approach (Blaga et al., 2012), we define the molecular contrast factor (MCF) as:
| (7) |
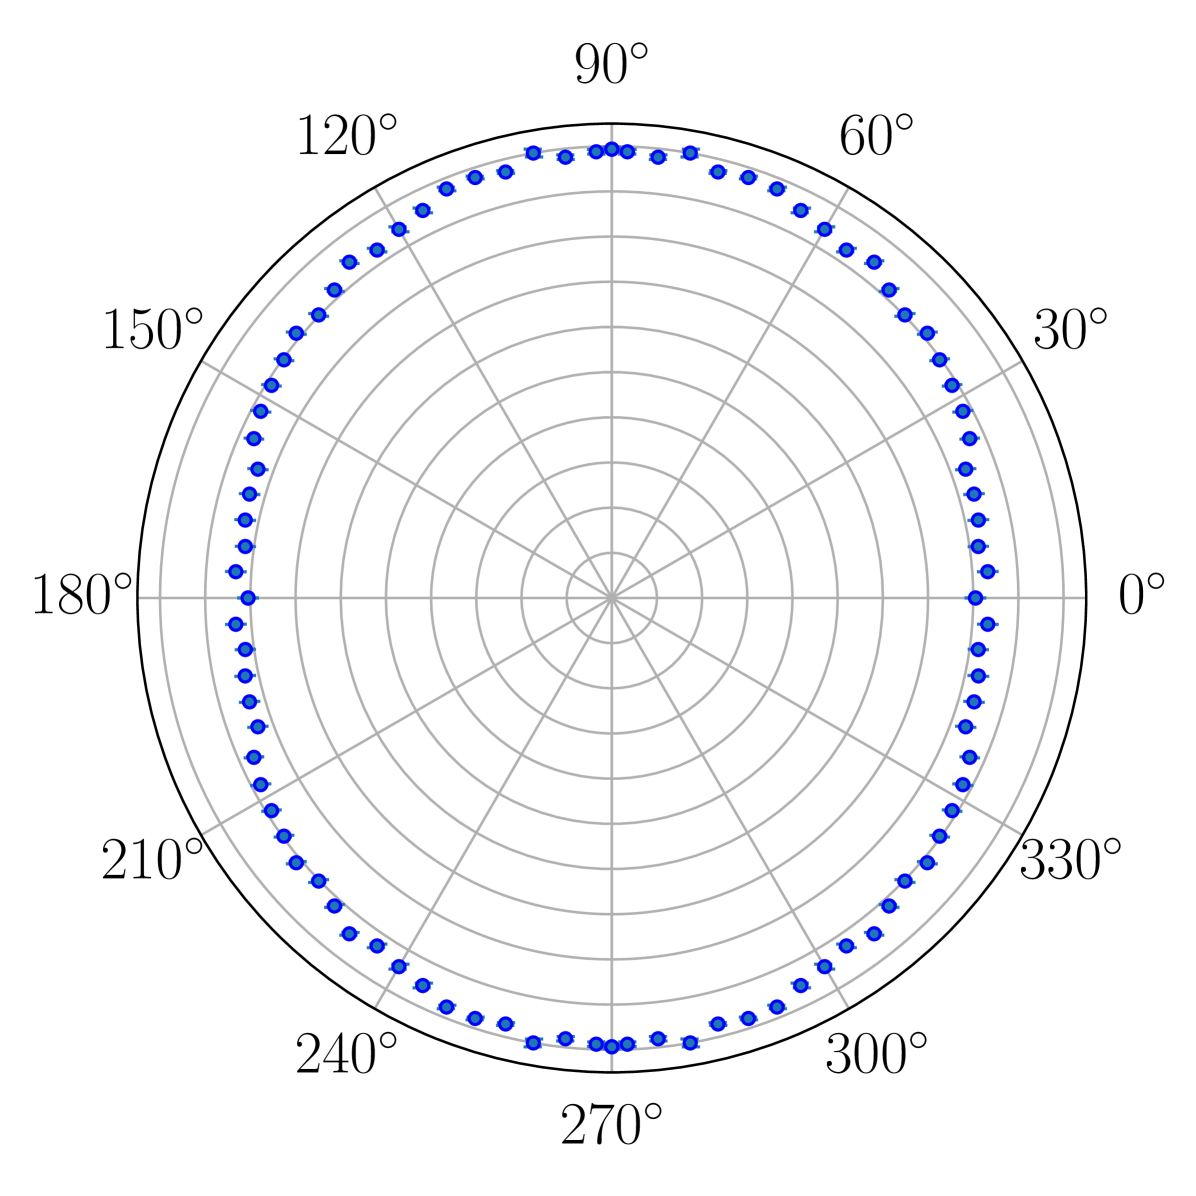
In order to extract bond lengths from our measurement, we have compared the MCF extracted experimentally with simulations using expression (7). The neutral atomic scattering factors were obtained using the Elsepa package Salvat, Jablonski, and Powell (2005). To estimate the angle-dependent ionization probability necessary to calculate the MCF, the following experiment was performed. A sequence of two laser pulses, at a wavelength centered at 800 nm and with 255 fs pulse duration, were used to strongly align the molecule prior to the 2 µm laser pulse, see reference Karamatskos et al. (2018) for details. The angle-dependent ionization probability was then obtained experimentally by monitoring the ionization yield as a function of the angle between the molecular axis and the ionizing laser polarization, see Fig. 4 , and then used to calculate the MCF. Finally, the and bond distances were fitted in order to minimize the variance between experiment and theory using the following expression for the error:
| (8) |
with a normalization constant, the DCS extracted from the measured photoelectron spectrum and the DCS calculated using (6). The result from this procedure is shown in Fig. 5 . The best agreement is obtained for pm and pm. Even for the relatively low return electron energy of 100 eV, a precision of pm is reached. These values are in very close agreement with the known values pm and pm obtained by microwave absorption spectroscopy Dakin, Good, and Coles (1947), which are marked by the red dot in Fig. 5 b.
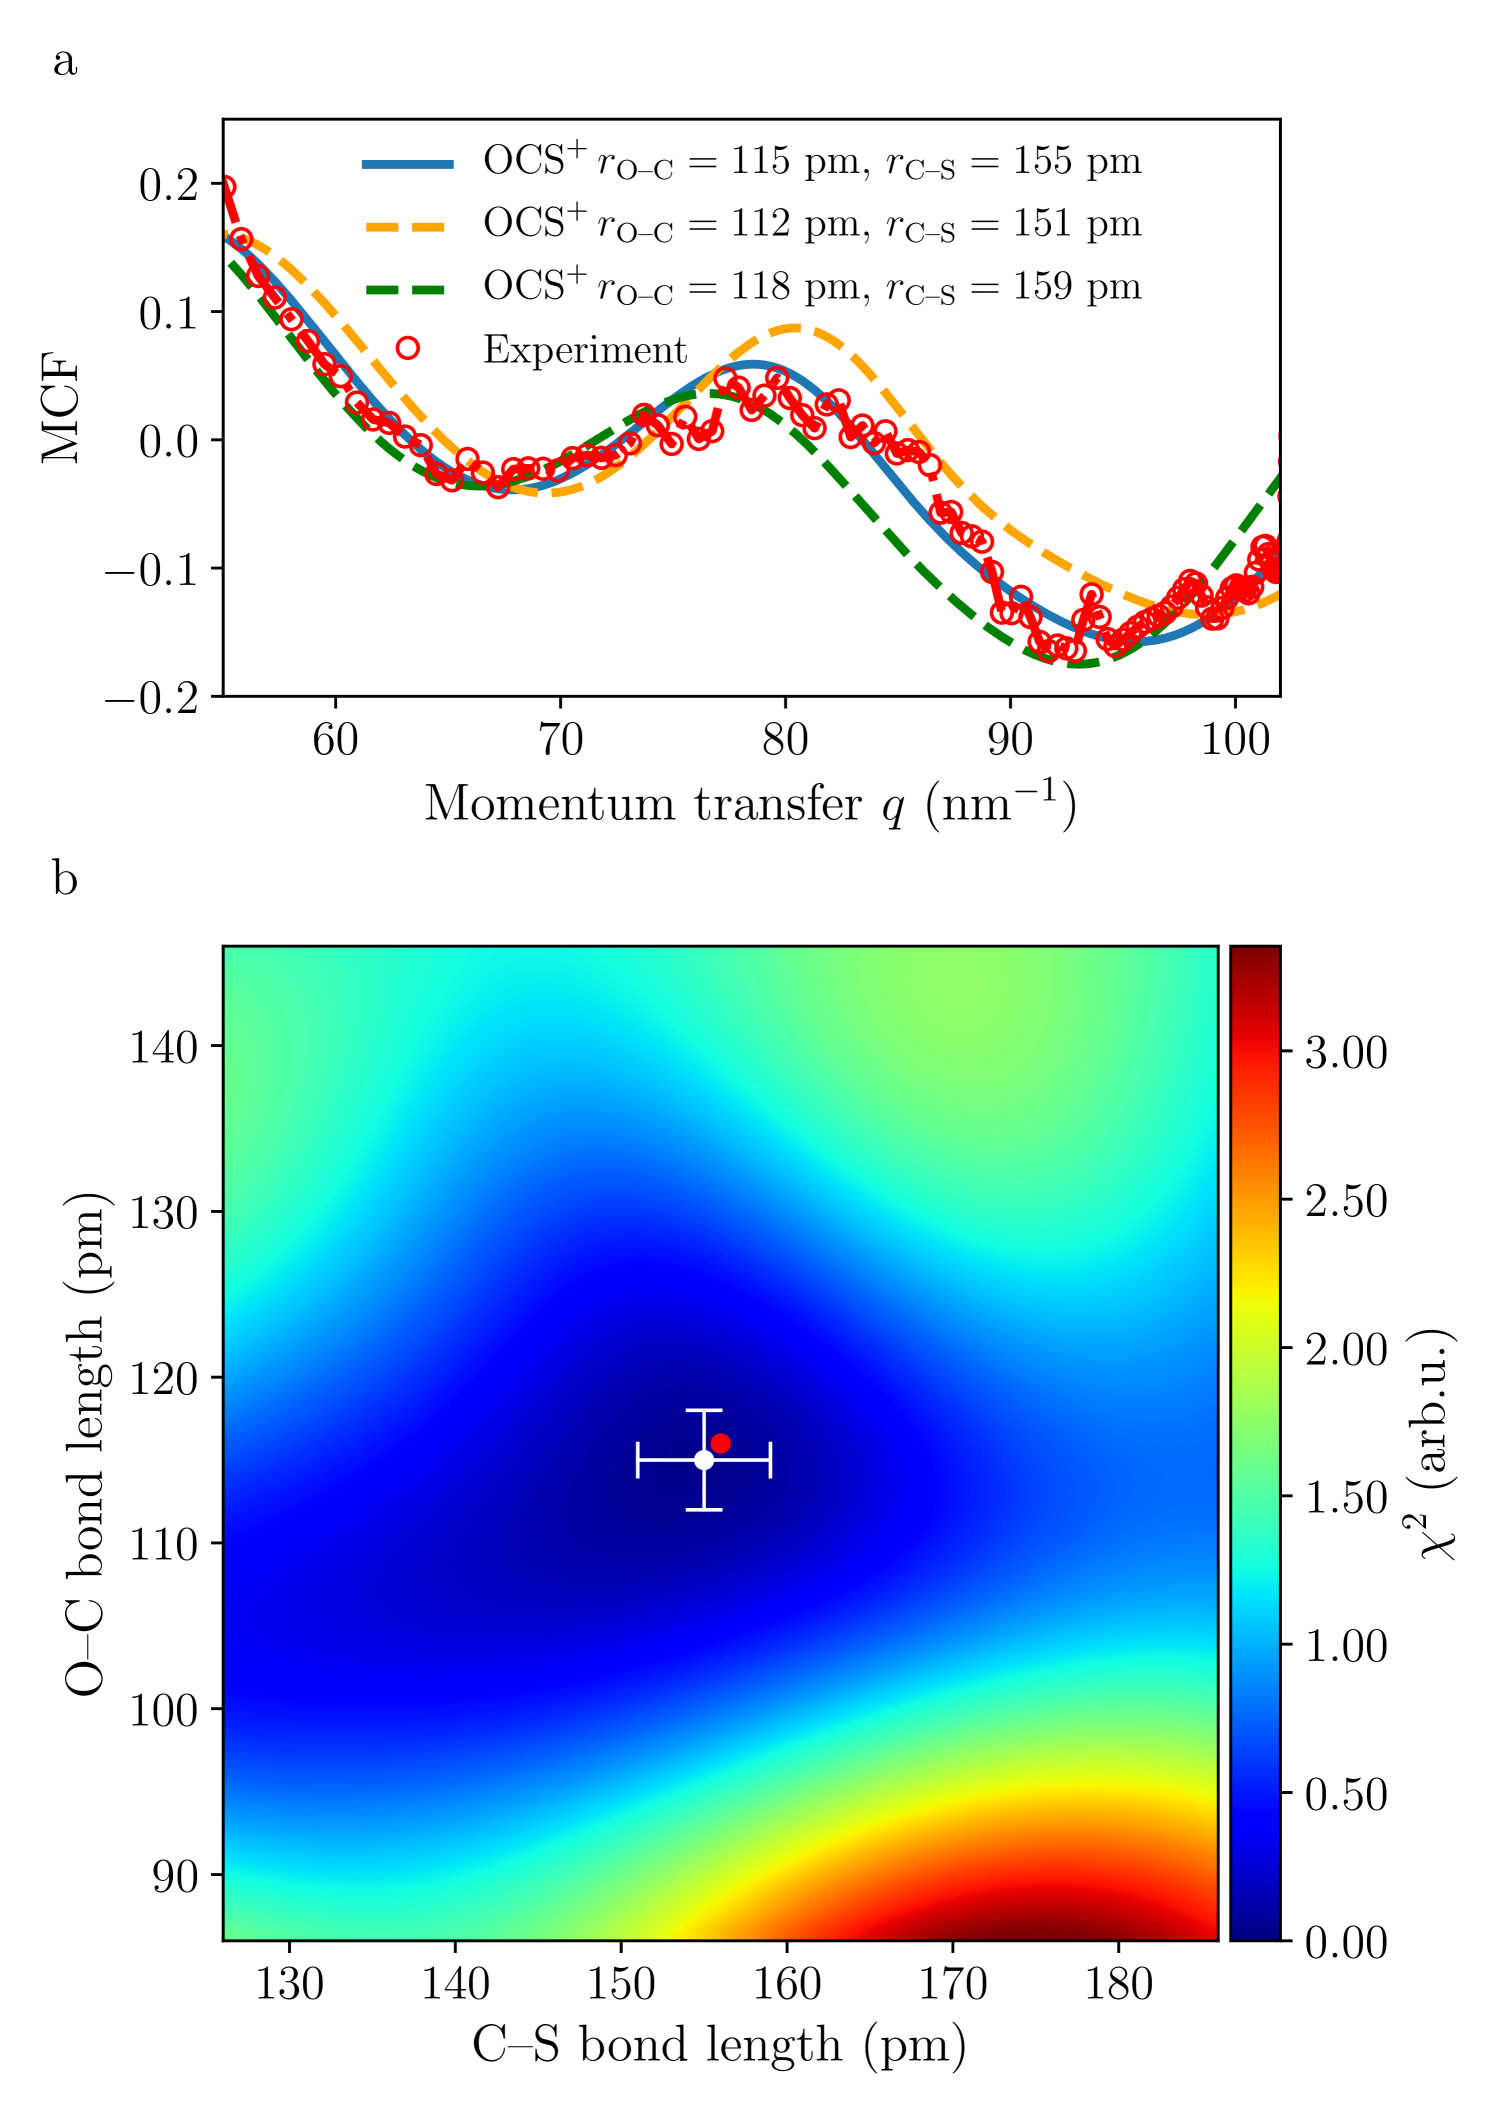
As previously mentioned, we cannot a priori exclude a possible deformation of the molecule following its ionization by the intense laser field. If this deformation takes place on a timescale shorter than the duration between ionization and recollision, it would be observed in our experiment as a deformed, bent or stretched OCS geometry upon recollision. However, we did not observe any indication of stretching of the bond distances of the molecule, even when we performed an extended analysis of our measurement using the overall O–S distance as an additional fitting parameter. Best agreement was found for pm, with pm and pm, i. e., for the linear configuration of the molecule. This suggests that in our experiment, with intensity and wavelength 2 µm, corresponding to a laser period of 6.6 fs, the molecular structure remains essentially unchanged during the time interval between ionization to recollision. In this context we note that recent ab-initio calculations Bilalbegovic (2008) for laser pulses centered at 790 nm and an intensity of have shown that the atomic distances and bending angle are changing on a timescale longer than 10 fs, i. e., longer than the optical period in our experiment.
IV Conclusion
We have recorded angle-resolved photoelectron spectra of argon, krypton and OCS, ionized by short laser pulses at 2 µm, with a high-energy VMI. We extracted field-free differential electron rescattering cross sections at 100 eV, which are in excellent agreement with calculated DCSs for electron-atom and electron-molecule scattering. The geometry and bond distances of the OCS molecule were extracted from our measurement with a precision better than pm and in full agreement with the known structure of ground-state OCS.
It remains an open question to what extent the LIED technique can be used to retrieve multiple bond lengths and angles during molecular transformations, for instance following the photoexcitation of a molecule. Further investigations combining pump-probe schemes and LIED are ongoing to explore the possibility to use this technique to directly record a so-called “molecular movie” of these motions, in which the evolving structure is measured with femtosecond and picometer precision while the molecule is “in action”.
V Acknowledgements
This work has been supported by the Deutsche Forschungsgemeinschaft (DFG) through the priority program “Quantum Dynamics in Tailored Intense Fields” (QUTIF, SPP1840, AR 4577/4, KU 1527/3) and by the Clusters of Excellence “Center for Ultrafast Imaging” (CUI, EXC 1074, ID 194651731) and “Advanced Imaging of Matter” (AIM, EXC 2056, ID 390715994) of the Deutsche Forschungsgemeinschaft, by the Helmholtz Gemeinschaft through the “Impuls- und Vernetzungsfond”, and by the European Union’s Horizon 2020 research and innovation programme under the Marie Sklodowska-Curie grant agreement No 674960 (ASPIRE). A.T. gratefully acknowledges a fellowship of the Alexander von Humboldt Foundation.
Appendix A Charge distribution in the independent-atom model
Structure retrieval in LIED experiments is typically achieved by employing the quantitative rescattering theory (QRS) Chen et al. (2009); Xu et al. (2010) combined with the independent-atom model (IAM) Hargittai and Hargittai (1988); Lin et al. (2010). Generally, the IAM is not well suited to incorporate scattering from singly charged cations, as in this model a molecule is described as a collection of independent atoms as the scattering centers for the incoming electron flux. However, the hole charge density is generally delocalized within the molecule, which cannot be described within the independent-atom model, where the substitution of neutral scattering amplitudes by the corresponding ones for singly charged ions leads to a strong localization of the hole charge density on one atomic site.
For OCS, it was shown that ionization from the HOMO of OCS leads to a molecular cation with of the hole charge density localized at the S atom Holmegaard et al. (2010). Therefore, in the main article, the IAM model was applied by replacing the scattering amplitude of neutral sulfur by the corresponding ionic one. Here, for comparison, we provide the results obtained for a model in which OCS is either neutral or a singly charged ion with a final charge localized on the carbon or the oxygen sites. Except for neutral OCS, the other cases did not allow to retrieve the correct equilibrium geometry of OCS, confirming that the hole charge density of singly charged OCS is mostly localized at the sulfur site.
A.1 Neutral OCS
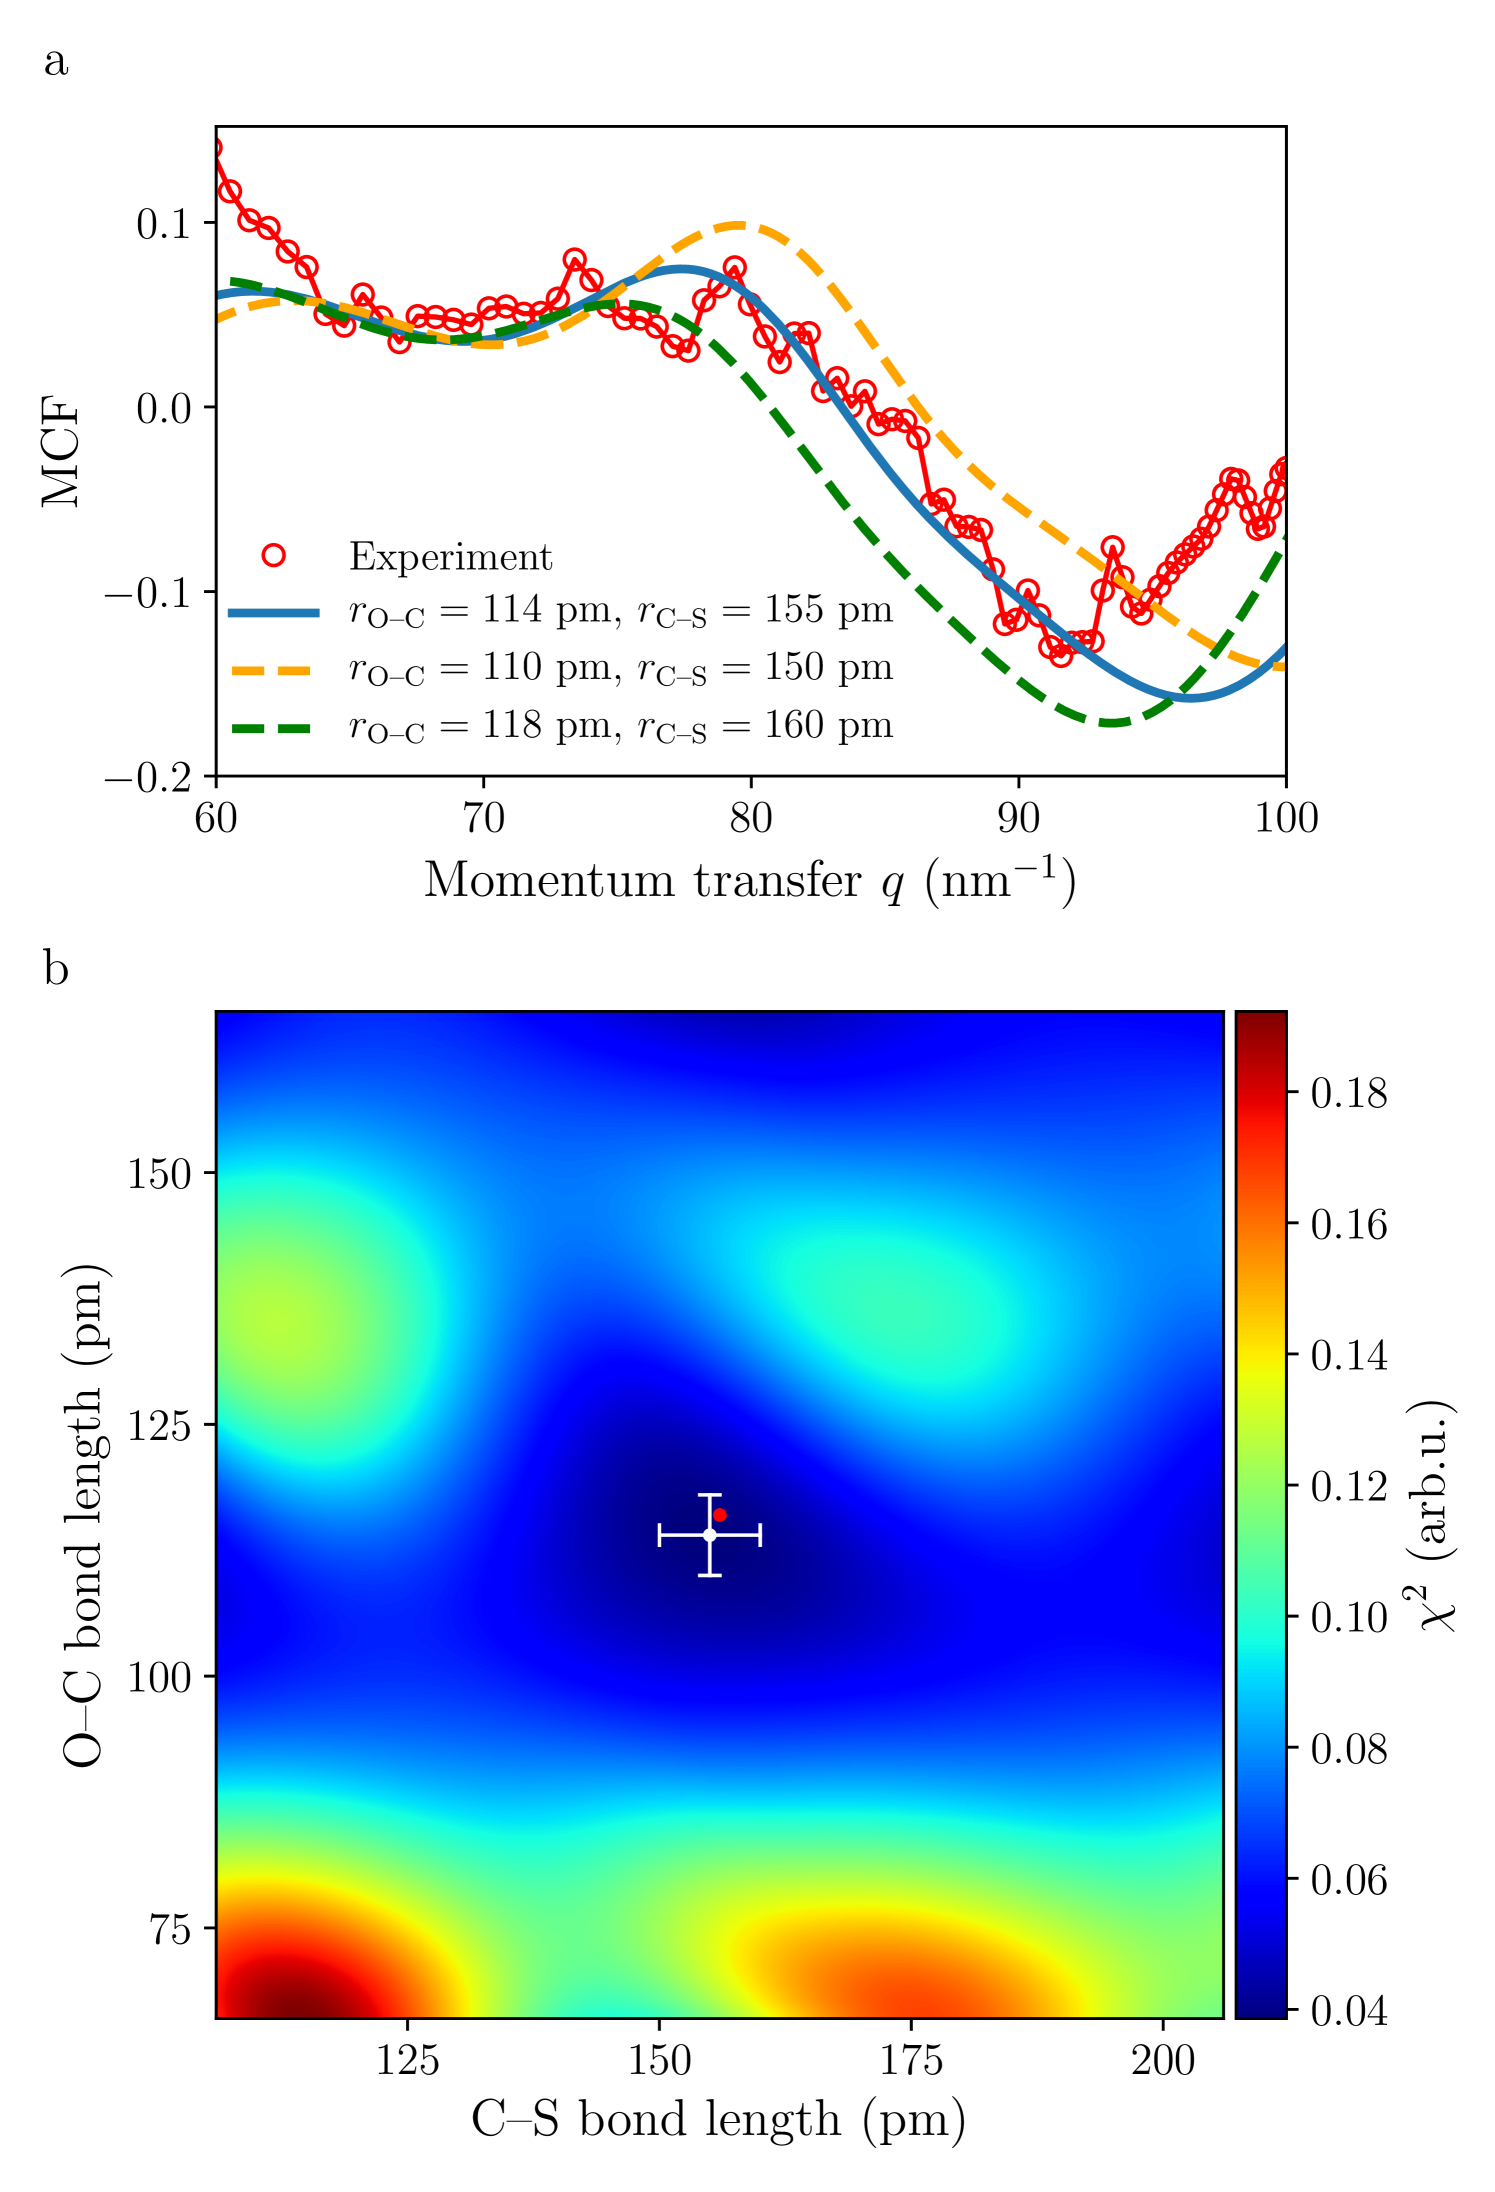
Fig. 6 shows the results of the fitting procedure for neutral OCS, including only atomic scattering amplitudes of neutral oxygen, carbon, and sulfur. The experimental MCF fits the simulations only in the range and a deviation for smaller and larger momentum transfer is observed. The fits were thus carried out only in this range of momentum transfer. Then, the best fit yielded values for the bond lengths of and with . While this provided bond lengths close to the known values Dakin, Good, and Coles (1947), with this model the MCF is not well reproduced for low and large momentum transfers, whereas the cation model presented in the main text provides a robust overall description of the experimental data.
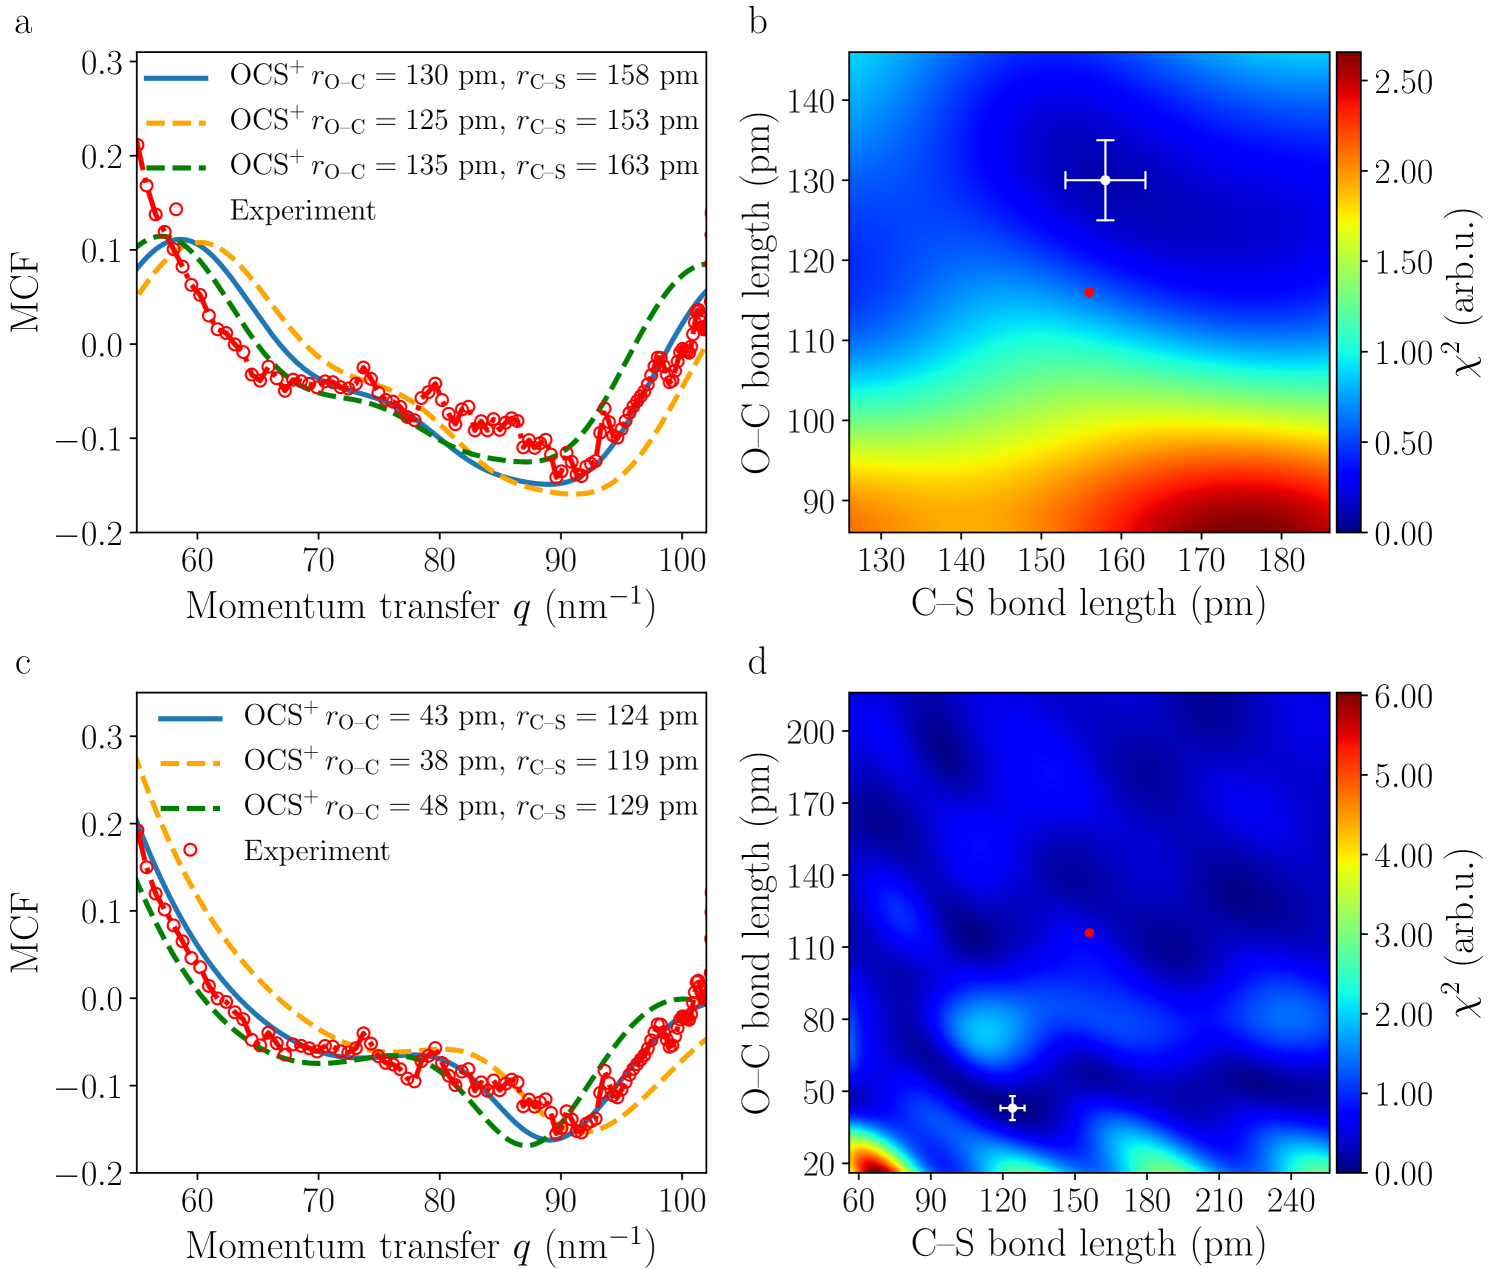
A.2 OCS+ with the charge localized on O or C
The same procedure was applied for a molecular cation with the charge localized on the oxygen atom, see Fig. 7 a, b, or on the carbon atom, see Fig. 7 c, d. The best fits yielded values for the bond lengths of and for a charge localized on the oxygen atom with ; and and for a charge localized on the carbon atom with . In these two cases, a large deviation from the known bond distances of OCS is retrieved from the fit, highlighting the relevance of an appropriate hole charge distribution in the analysis of LIED data. The best fit was obtained considering electron scattering from a molecular cation with a final charge localized on the sulfur atom, see Fig. 5 , yielding bond lengths of and with .
References
- Küpper et al. (2014) J. Küpper, S. Stern, L. Holmegaard, F. Filsinger, A. Rouzée, A. Rudenko, P. Johnsson, A. V. Martin, M. Adolph, A. Aquila, S. Bajt, A. Barty, C. Bostedt, J. Bozek, C. Caleman, R. Coffee, N. Coppola, T. Delmas, S. Epp, B. Erk, L. Foucar, T. Gorkhover, L. Gumprecht, A. Hartmann, R. Hartmann, G. Hauser, P. Holl, A. Hömke, N. Kimmel, F. Krasniqi, K.-U. Kühnel, J. Maurer, M. Messerschmidt, R. Moshammer, C. Reich, B. Rudek, R. Santra, I. Schlichting, C. Schmidt, S. Schorb, J. Schulz, H. Soltau, J. C. H. Spence, D. Starodub, L. Strüder, J. Thøgersen, M. J. J. Vrakking, G. Weidenspointner, T. A. White, C. Wunderer, G. Meijer, J. Ullrich, H. Stapelfeldt, D. Rolles, and H. N. Chapman, “X-ray diffraction from isolated and strongly aligned gas-phase molecules with a free-electron laser,” Phys. Rev. Lett. 112, 083002 (2014), arXiv:1307.4577 [physics] .
- Glownia et al. (2016) J. M. Glownia, A. Natan, J. P. Cryan, R. Hartsock, M. Kozina, M. P. Minitti, S. Nelson, J. Robinson, T. Sato, T. van Driel, G. Welch, C. Weninger, D. Zhu, and P. H. Bucksbaum, “Self-referenced coherent diffraction x-ray movie of ångstrom- and femtosecond-scale atomic motion,” Phys. Rev. Lett. 117, 153003 (2016), arXiv:1608.03039 [physics] .
- Weathersby et al. (2015) S. P. Weathersby, G. Brown, M. Centurion, T. F. Chase, R. Coffee, J. Corbett, J. P. Eichner, J. C. Frisch, A. R. Fry, M. Gühr, N. Hartmann, C. Hast, R. Hettel, R. K. Jobe, E. N. Jongewaard, J. R. Lewandowski, R. K. Li, A. M. Lindenberg, I. Makasyuk, J. E. May, D. McCormick, M. N. Nguyen, A. H. Reid, X. Shen, K. Sokolowski-Tinten, T. Vecchione, S. L. Vetter, J. Wu, J. Yang, H. A. Dürr, and X. J. Wang, “Mega-electron-volt ultrafast electron diffraction at SLAC National Accelerator Laboratory,” Rev. Sci. Instrum. 86, 073702 (2015).
- Yang et al. (2016) J. Yang, M. Guehr, X. Shen, R. Li, T. Vecchione, R. Coffee, J. Corbett, A. Fry, N. Hartmann, C. Hast, K. Hegazy, K. Jobe, I. Makasyuk, J. Robinson, M. S. Robinson, S. Vetter, S. Weathersby, C. Yoneda, X. Wang, and M. Centurion, “Diffractive imaging of coherent nuclear motion in isolated molecules,” Phys. Rev. Lett. 117, 153002 (2016).
- Corkum (1993) P. B. Corkum, “Plasma perspective on strong-field multiphoton ionization,” Phys. Rev. Lett. 71, 1994–1997 (1993).
- Spanner et al. (2004) M. Spanner, O. Smirnova, P. B. Corkum, and M. Y. Ivanov, “Reading diffraction images in strong field ionization of diatomic molecules,” J. Phys. B 37, L243–L250 (2004).
- Blaga et al. (2012) C. I. Blaga, J. Xu, A. D. DiChiara, E. Sistrunk, K. Zhang, P. Agostini, T. A. Miller, L. F. DiMauro, and C. D. Lin, “Imaging ultrafast molecular dynamics with laser-induced electron diffraction,” Nature 483, 194–197 (2012).
- Okunishi et al. (2008) M. Okunishi, T. Morishita, G. Prümper, K. Shimada, C. D. Lin, S. Watanabe, and K. Ueda, “Experimental retrieval of target structure information from laser-induced rescattered photoelectron momentum distributions,” Phys. Rev. Lett. 100, 143001 (2008).
- Xu et al. (2012) J. Xu, C. I. Blaga, A. D. DiChiara, E. Sistrunk, K. Zhang, Z. Chen, A.-T. Le, T. Morishita, C. D. Lin, P. Agostini, and L. F. DiMauro, “Laser-induced electron diffraction for probing rare gas atoms,” Phys. Rev. Lett. 109, 233002 (2012).
- Xu et al. (2014) J. Xu, C. I. Blaga, K. Zhang, Y. H. Lai, C. D. Lin, T. A. Miller, P. Agostini, and L. F. DiMauro, “Diffraction using laser-driven broadband electron wave packets,” Nat. Commun. 5, 4635 (2014).
- Pullen et al. (2015) M. G. Pullen, B. Wolter, A.-T. Le, M. Baudisch, M. Hemmer, A. Senftleben, C. D. Schroter, J. Ullrich, R. Moshammer, C. D. Lin, and J. Biegert, “Imaging an aligned polyatomic molecule with laser-induced electron diffraction,” Nat. Commun. 6, 7262 (2015).
- Ito et al. (2017) Y. Ito, R. Carranza, M. Okunishi, R. R. Lucchese, and K. Ueda, “Extraction of geometrical structure of ethylene molecules by laser-induced electron diffraction combined with ab initio scattering calculations,” Phys. Rev. A 96, 053414 (2017).
- Ito et al. (2016) Y. Ito, C. Wang, A.-T. Le, M. Okunishi, D. Ding, C. D. Lin, and K. Ueda, “Extracting conformational structure information of benzene molecules via laser-induced electron diffraction,” Struct. Dyn. 3, 034303 (2016).
- Walt et al. (2017) S. G. Walt, B. N. Ram, M. Atala, N. I. Shvetsov-Shilovski, A. von Conta, D. Baykusheva, M. Lein, and H. J. Wörner, “Dynamics of valence-shell electrons and nuclei probed by strong-field holography and rescattering,” Nat. Commun. 8, 15651 (2017).
- Wolter et al. (2016) B. Wolter, M. G. Pullen, A. T. Le, M. Baudisch, K. Doblhoff-Dier, A. Senftleben, M. Hemmer, C. D. Schroter, J. Ullrich, T. Pfeifer, R. Moshammer, S. Gräfe, O. Vendrell, C. D. Lin, and J. Biegert, “Ultrafast electron diffraction imaging of bond breaking in di-ionized acetylene,” Science 354, 308–312 (2016).
- Brouard et al. (2007) M. Brouard, A. V. Green, F. Quadrini, and C. Vallance, “Photodissociation dynamics of OCS at 248 nm: The s(d21) atomic angular momentum polarization,” J. Chem. Phys. 127, 084304 (2007).
- Suzuki et al. (1998) T. Suzuki, H. Katayanagi, S. Nanbu, and M. Aoyagi, “Nonadiabatic bending dissociation in 16 valence electron system OCS,” J. Chem. Phys. 109, 5778–5794 (1998).
- Sivakumar et al. (1985) N. Sivakumar, I. Burak, W. Y. Cheung, P. L. Houston, and J. W. Hepburn, “State-resolved photofragmentation of carbonyl sulfide (OCS) monomers and clusters,” J. Phys. Chem. 89, 3609–3611 (1985).
- Sanderson et al. (2002) J. H. Sanderson, T. R. J. Goodworth, A. El-Zein, W. A. Bryan, W. R. Newell, A. J. Langley, and P. F. Taday, “Coulombic and pre-coulombic geometry evolution of carbonyl sulfide in an intense femtosecond laser pulse, determined by momentum imaging,” Phys. Rev. A 65, 043403 (2002).
- Eppink and Parker (1997) A. T. J. B. Eppink and D. H. Parker, “Velocity map imaging of ions and electrons using electrostatic lenses: Application in photoelectron and photofragment ion imaging of molecular oxygen,” Rev. Sci. Instrum. 68, 3477–3484 (1997).
- Salvat, Jablonski, and Powell (2005) F. Salvat, A. Jablonski, and C. Powell, “ELSEPA – Dirac partial-wave calculation of elastic scattering of electrons and positrons by atoms, positive ions and molecules,” Comp. Phys. Comm. 165, 157–190 (2005).
- Dakin, Good, and Coles (1947) T. W. Dakin, W. E. Good, and D. K. Coles, “Bond distances in OCS from microwave absorption lines,” Phys. Rev. 71, 640–641 (1947).
- Kienitz et al. (2017) J. S. Kienitz, K. Długołęcki, S. Trippel, and J. Küpper, “Improved spatial separation of neutral molecules,” J. Chem. Phys. 147, 024304 (2017), arXiv:1704.08912 [physics] .
- Chang et al. (2015) Y.-P. Chang, D. A. Horke, S. Trippel, and J. Küpper, “Spatially-controlled complex molecules and their applications,” Int. Rev. Phys. Chem. 34, 557–590 (2015), arXiv:1505.05632 [physics] .
- Teschmit, Horke, and Küpper (2018) N. Teschmit, D. A. Horke, and J. Küpper, “Spatially separating the conformers of the dipeptide Ac-Phe-Cys-NH2,” Angew. Chem. Int. Ed. 57, 13775–13779 (2018), arXiv:1805.12396 [physics] .
- Trippel et al. (2018) S. Trippel, M. Johny, T. Kierspel, J. Onvlee, H. Bieker, H. Ye, T. Mullins, L. Gumprecht, K. Długołęcki, and J. Küpper, “Knife edge skimming for improved separation of molecular species by the deflector,” Rev. Sci. Instrum. 89, 096110 (2018), arXiv:1802.04053 [physics] .
- Nielsen et al. (2011) J. H. Nielsen, P. Simesen, C. Z. Bisgaard, H. Stapelfeldt, F. Filsinger, B. Friedrich, G. Meijer, and J. Küpper, “Stark-selected beam of ground-state OCS molecules characterized by revivals of impulsive alignment,” Phys. Chem. Chem. Phys. 13, 18971–18975 (2011), arXiv:1105.2413 [physics] .
- Karamatskos et al. (2018) E. T. Karamatskos, S. Raabe, T. Mullins, A. Trabattoni, P. Stammer, G. Goldsztejn, R. R. Johansen, K. Długołęcki, H. Stapelfeldt, M. J. J. Vrakking, S. Trippel, A. Rouzée, and J. Küpper, “Molecular movie of ultrafast coherent rotational dynamics,” (2018), arXiv:1807.01034 .
- Dribinski et al. (2002) V. Dribinski, A. Ossadtchi, V. A. Mandelshtam, and H. Reisler, “Reconstruction of Abel-transformable images: The Gaussian basis-set expansion Abel transform method,” Rev. Sci. Instrum. 73, 2634 (2002).
- Chen et al. (2009) Z. Chen, A.-T. Le, T. Morishita, and C. D. Lin, “Quantitative rescattering theory for laser-induced high-energy plateau photoelectron spectra,” Phys. Rev. A 79, 033409 (2009).
- Xu et al. (2010) J. Xu, Z. Chen, A.-T. Le, and C. D. Lin, “Self-imaging of molecules from diffraction spectra by laser-induced rescattering electrons,” Phys. Rev. A 82, 033403 (2010).
- Fon et al. (1983) W. C. Fon, K. A. Berrington, P. G. Burke, and A. Hibbert, “The elastic scattering of electrons from inert gases. III. Argon,” J. Phys. B 16, 307 (1983).
- Fon, Berrington, and Hibbert (1984) W. C. Fon, K. A. Berrington, and A. Hibbert, “The elastic scattering of electrons from inert gases. IV. Krypton,” J. Phys. B 17, 3279–3294 (1984).
- Murai et al. (2013) H. Murai, Y. Ishijima, T. Mitsumura, Y. Sakamoto, H. Kato, M. Hoshino, F. Blanco, G. Garcia, P. Limao-Vieira, M. J. Brunger, S. J. Buckman, and H. Tanaka, “A comprehensive and comparative study of elastic electron scattering from OCS and CS2 in the energy region from 1.2 to 200 eV,” J. Chem. Phys. 138, 054302 (2013).
- Michelin et al. (2000) S. E. Michelin, T. Kroin, I. Iga, M. G. P. Homem, H. S. Miglio, and M. T. Lee, “Elastic and total cross sections for electron-carbonyl sulfide collisions,” J. Phys. B 33, 3293 (2000).
- Schell et al. (2018) F. Schell, T. Bredtmann, C.-P. Schulz, S. Patchkovskii, M. J. J. Vrakking, and J. Mikosch, “Molecular orbital imprint in laser-driven electron recollision,” Science Advances 4, eaap8148 (2018).
- Krečinić et al. (2018) F. Krečinić, P. Wopperer, B. Frusteri, F. Brauße, J.-G. Brisset, U. De Giovannini, A. Rubio, A. Rouzée, and M. J. J. Vrakking, “Multiple-orbital effects in laser-induced electron diffraction of aligned molecules,” Phys. Rev. A 98, 041401 (2018).
- Trabattoni et al. (2018) A. Trabattoni, S. Trippel, U. D. Giovannini, J. F. Olivieri, J. Wiese, T. Mullins, J. Onvlee, S.-K. Son, A. R. Biagio Frusteri, and J. Küpper, “Setting the clock of photoelectron emission through molecular alignment,” (2018), arXiv:1802.06622 [physics] .
- Holmegaard et al. (2010) L. Holmegaard, J. L. Hansen, L. Kalhoj, S. L. Kragh, H. Stapelfeldt, F. Filsinger, J. Küpper, G. Meijer, D. Dimitrovski, M. Abu-samha, C. P. J. Martiny, and L. B. Madsen, “Photoelectron angular distributions from strong-field ionization of oriented molecules,” Nat. Phys. 6, 428 (2010).
- Bilalbegovic (2008) G. Bilalbegovic, “Carbonyl sulphide under strong laser field: time-dependent density functional theory,” Eur. Phys. J. D 49, 43–49 (2008).
- Hargittai and Hargittai (1988) I. Hargittai and M. Hargittai, Stereochemical Applications of Gas-Phase Electron Diffraction (VCH Verlagsgesellschaft, Weinheim, Germany, 1988).
- Lin et al. (2010) C. D. Lin, A.-T. Le, Z. Chen, T. Morishita, and R. Lucchese, “Strong-field rescattering physics - self-imaging of a molecule by its own electrons,” J. Phys. B 43, 122001 (2010).