Ballistic transport of (001) GaAs 2D holes through a strain-induced
lateral superlattice
Abstract
We report the observation of ballistic commensurability oscillations and positive magnetoresistance in a high-mobility, (001) GaAs two-dimensional hole system with a unidirectional, surface-strain-induced, periodic potential modulation. The positions of the resistivity minima agree well with the electrostatic commensurability condition. From an analysis of the amplitude of the oscillations we deduce a ballistic scattering time and an effective magnitude for the induced periodic potential seen by the two-dimensional holes.
Spatially modulated two-dimensional (2D) carrier systems exhibit magnetoresistance oscillations as a consequence of the commensurability between the size of the ballistic cyclotron orbits and the period of the modulation. ref01Weiss.EPL.8.179.1989 ; ref02Winkler.PRL.62.1177.1989 ; ref03Gerhardts.PRL.62.1173.1989 ; ref04Beenakker.PRL.62.2020.1989 ; ref05Beton.PRB.42.9229.1990 ; ref06Peeters.PRB.46.1992 ; ref06bMirlin.PRB.58.1998 ; ref07Lu.PRB.58.1138.1998 ; ref13Lu.PRL.81.1282.1998;Lu.PRB.60.13776.1999 ; ref08Smet.PRL.83.2620.1999 ; ref09Skuras.APL.70.871.1997 ; ref10Endo.PRB.62.16761.2000 ; ref11Endo.PRB.72.235303.2005 ; ref12Endo.JPSJ.74.1792.2005 These commensurability oscillations (COs) have proved to be a useful tool for studying transport properties as they lead to an interplay between the inherent parameters of the 2D carriers and those of the modulation potential. The positive magnetoresistance, typically seen at very low fields, and the amplitude of the COs are related to the magnitude of the modulation potential and the scattering times. The frequency of the COs probes the shape and size of the Fermi contours and the subband occupations. While most investigations of commensurability effects have been performed on GaAs 2D electron systems, ref01Weiss.EPL.8.179.1989 ; ref02Winkler.PRL.62.1177.1989 ; ref03Gerhardts.PRL.62.1173.1989 ; ref04Beenakker.PRL.62.2020.1989 ; ref05Beton.PRB.42.9229.1990 ; ref06Peeters.PRB.46.1992 ; ref06bMirlin.PRB.58.1998 ; ref07Lu.PRB.58.1138.1998 ; ref08Smet.PRL.83.2620.1999 ; ref09Skuras.APL.70.871.1997 ; ref10Endo.PRB.62.16761.2000 ; ref11Endo.PRB.72.235303.2005 ; ref12Endo.JPSJ.74.1792.2005 GaAs 2D hole systems (2DHSs) have been studied as well. ref13Lu.PRL.81.1282.1998;Lu.PRB.60.13776.1999 ; ref14footnote1 The 2DHS studies, however, have primarily focused on low-symmetry (113) GaAs samples because high-quality, C-doped (001) GaAs samples have not been available until recently. ref15footnote2
Here we report a quantitative study of COs in high-mobility, C-doped (001) GaAs 2DHSs. To create a periodic, unidirectional potential modulation, we employ surface strain induced by stripes of negative electron-beam (e-beam) resist deposited on the sample surface. It produces a local 2DHS density modulation through the piezoelectric effect. ref09Skuras.APL.70.871.1997 The successful use of such a technique for inducing COs has been demonstrated in GaAs 2D electron systems. ref09Skuras.APL.70.871.1997 ; ref10Endo.PRB.62.16761.2000 ; ref11Endo.PRB.72.235303.2005 ; ref12Endo.JPSJ.74.1792.2005 Our measurements reveal resistance minima at the electrostatic commensurability condition: ref01Weiss.EPL.8.179.1989 ; ref02Winkler.PRL.62.1177.1989 ; ref03Gerhardts.PRL.62.1173.1989 ; ref04Beenakker.PRL.62.2020.1989 ; ref05Beton.PRB.42.9229.1990 ; ref06Peeters.PRB.46.1992 ; ref06bMirlin.PRB.58.1998 ; ref07Lu.PRB.58.1138.1998 ; ref13Lu.PRL.81.1282.1998;Lu.PRB.60.13776.1999 ; ref08Smet.PRL.83.2620.1999 ; ref09Skuras.APL.70.871.1997 ; ref10Endo.PRB.62.16761.2000 ; ref11Endo.PRB.72.235303.2005 ; ref12Endo.JPSJ.74.1792.2005
| (1) |
where is the cyclotron radius, is the period of the potential modulation, and with and being the Fermi wave vector and hole density, respectively. We present the dependence of the amplitude and positions of the COs on the potential modulation period and the 2DHS density. We also extract estimates of the magnitude of the potential modulation and the scattering time for the ballistic holes.
We prepared strain-induced lateral superlattice samples with different lattice periods from a 2DHS confined to a 175-Å-wide GaAs quantum well (QW) grown via molecular beam epitaxy on an undoped (001) GaAs substrate. The QW is located 131 nm below the surface and is surrounded on each side by 95-nm-thick undoped Al0.24Ga0.76As (spacer) and C -doped layers. The as-grown 2DHS density at 300 mK is cm-2, and the mobility is cm2/Vs. The density was varied using an In back gate. Hall bars were made by wet etching past the dopants along the or directions. As illustrated in Fig. 1(a), half of each Hall bar was covered with a grating of high-resolution negative e-beam resist using e-beam lithography while the other half was kept unpatterned as a reference. The periods of the gratings were 100, 150, 175, 200, 250, and 300 nm. A scanning electron microscope image of a 175-nm-period resist grating is given in Fig. 1(a). The samples were measured in a pumped 3He refrigerator with a base temperature of 300 mK using lock-in techniques.
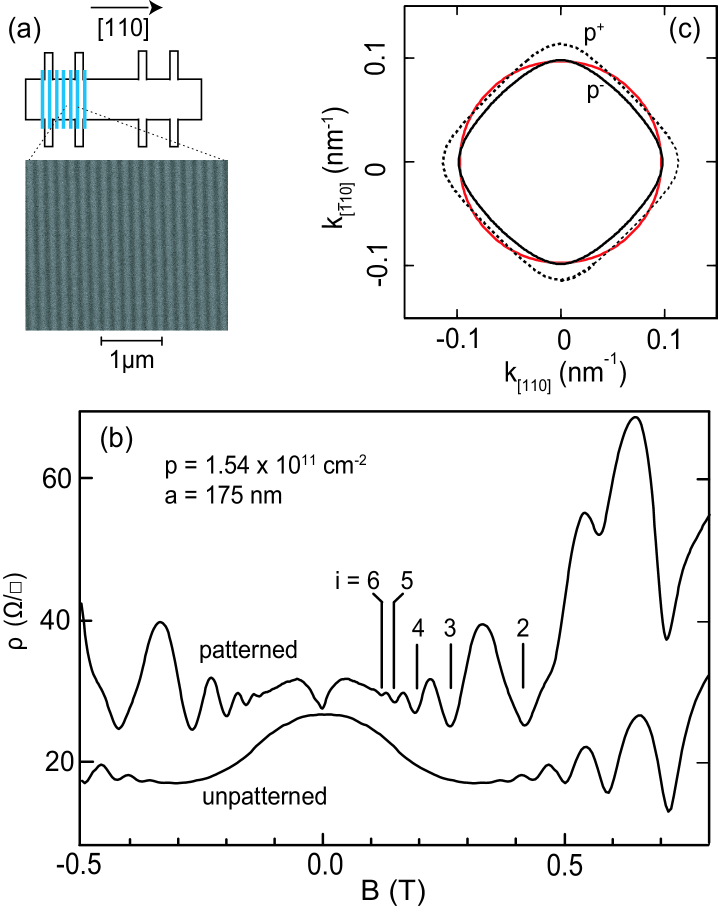
Low-field magnetoresistance traces from the patterned and unpatterned regions of the nm sample are shown in Fig. 1(b). The trace from the unpatterned region shows Shubnikov-de Haas (SdH) oscillations starting around T. The modulated region’s trace exhibits clear COs below 0.4 T. The expected positions of the COs minima, based on a circular, spin-degenerate Fermi contour, i.e. with , are marked with vertical lines indexed according to Eq. (1). Because of the mixing between the CO and SdH oscillations at T, the minimum corresponding to is difficult to distinguish and is not shown here. The trace from the patterned region also exhibits positive magnetoresistance at very small fields, signalling the formation of resonant orbits. ref04Beenakker.PRL.62.2020.1989 ; ref05Beton.PRB.42.9229.1990
Figure 1(c) shows the results of self-consistent calculations of the Fermi contours for a 2DHS at cm-2 confined to a 175-Å-wide (001) GaAs QW. The calculation is free of adjustable parameters and is based on the Kane Hamiltonian. ref16Winkler.Springer.2003 It accounts for the nonparabolicity, spin-orbit interaction induced spin-splitting, and the anisotropy of the 2DHS band structure. There are two anisotropic Fermi contours, and , one for each spin-subband. Because the Fermi wave vectors for and along the current direction are different, in principle, there should be two sets of COs with different frequencies. ref13Lu.PRL.81.1282.1998;Lu.PRB.60.13776.1999 However, our data exhibit only one set of COs, consistent with the red circular contour corresponding to shown in Fig. 1(c), and suggesting that we cannot resolve the two contours. ref17additionalfootnote
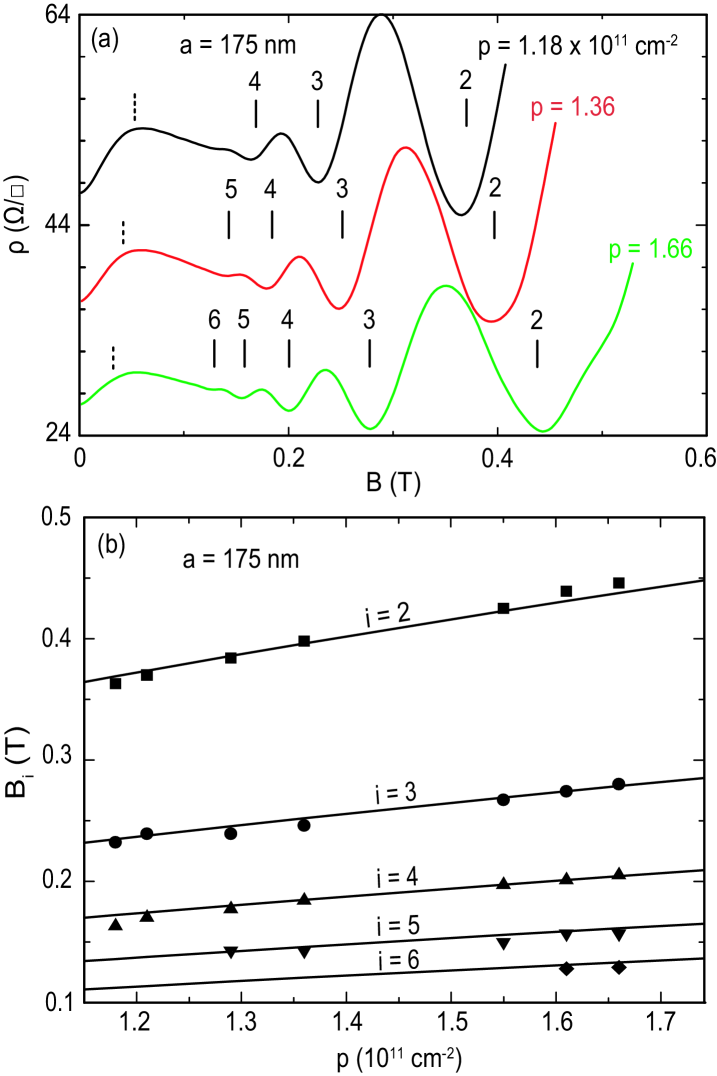
The dependence of the COs on density for the nm period sample is presented in Fig. 2. The density is varied from 1.18 to 1.66 1011 cm-2 using the back gate. Magnetoresistance traces are shown for three representative densities in Fig. 2(a). Figure 2(b) summarizes the evolution of all the observed CO minima along with their values according to Eq. (1), and assuming spin-degenerate, circular Fermi contours.
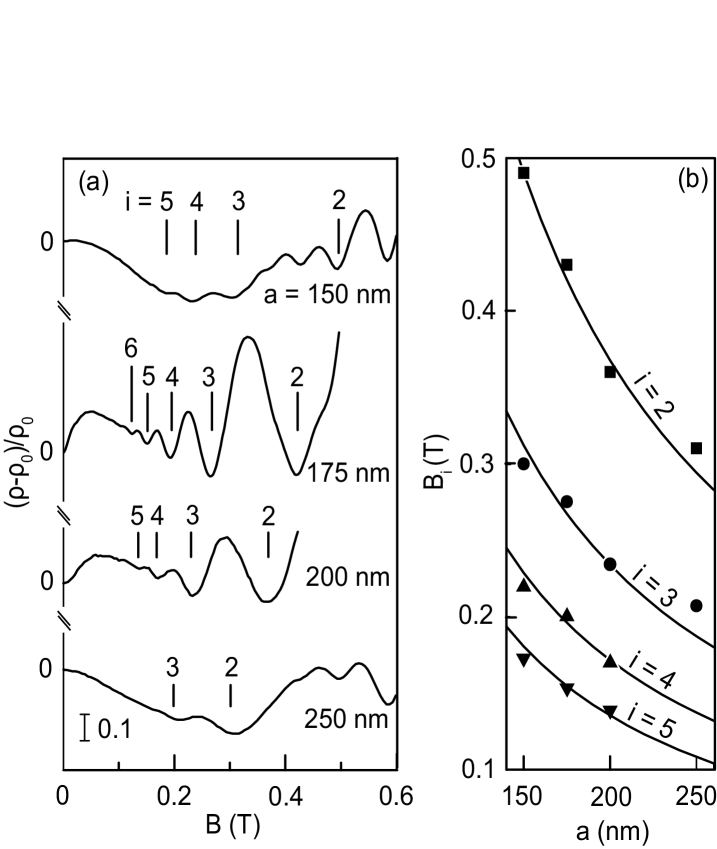
Figure 3(a) shows the low-field magnetoresistance of samples with different modulation periods and with 1011 cm-2. The observed CO minima are close to the predicted positions for all periods. Figure 3(b) summarizes the evolution of the observed minima with modulation period at a fixed density of 1011 cm-2. Data from the 100 nm and 300 nm period samples are not shown here as these samples do not exhibit any COs at all, and traces from their patterned and unpatterned regions are very similar. The positive low-field magnetoresistance appears to be even more sensitive to the modulation period than the COs themselves and is discernible only for the 175 nm and 200 nm period gratings.
The oscillatory part of the COs, , can be expressed in terms of the ratio of the potential modulation amplitude to the Fermi energy by treating the modulation as a perturbation. ref04Beenakker.PRL.62.2020.1989 ; ref05Beton.PRB.42.9229.1990 ; ref06Peeters.PRB.46.1992 ; ref06bMirlin.PRB.58.1998 The resulting asymptotic expression:
| (2) |
includes the mean-free path , where is the mobility, and an additional damping factor . ref10Endo.PRB.62.16761.2000 The damping factor, with , the cyclotron frequency, and the CO lifetime, accounts for carriers that scatter before completing a cyclotron orbit. The temperature factor given in Ref.11 has been omitted here because its value is a constant nearly equal to unity for temperatures close to 300 mK.
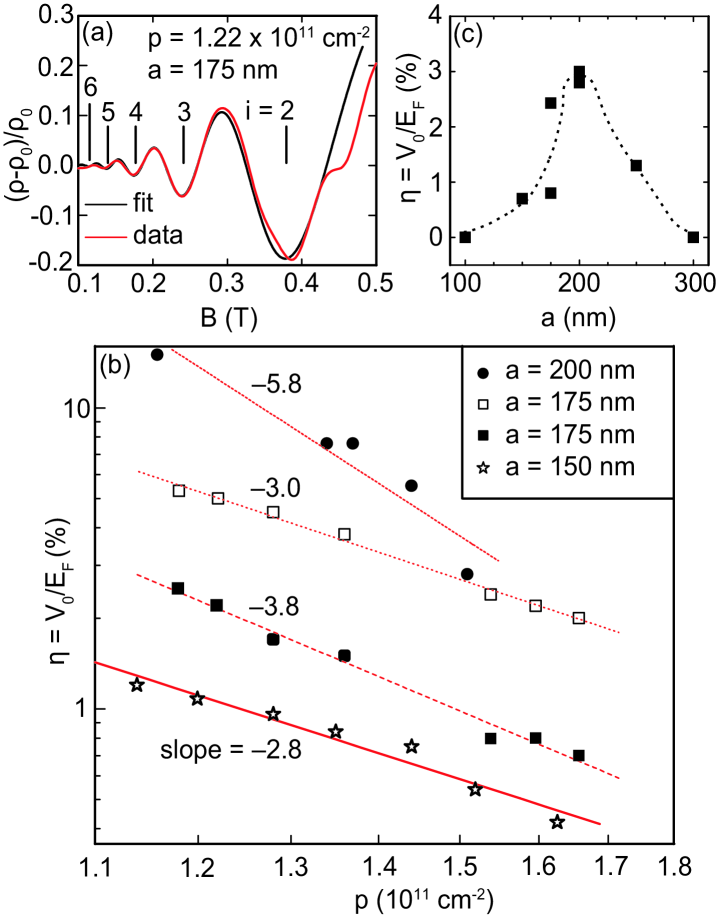
We studied the dependence of the ratio on the period of the modulation and the 2DHS density quantitatively by fitting the envelope of the COs using Eq. (2). The results are shown in Fig. 4. We fit the values of the maxima and minima for each magnetoresistance trace before the appearance of SdH oscillations independently with spline curves. We then use the difference between the two fits to obtain the background resistance which is subtracted from the magnetoresistance trace to yield its oscillatory part. The oscillatory part of a typical trace is plotted in Fig. 4(a) along with the fit using Eq. (2). The calculated positions of CO minima are given as well.
The fit shown in Fig. 4(a) gives a CO lifetime ps. In this estimate we used the effective mass obtained from our band calculations, , where is the free-electron mass. The transport (mobility) lifetime obtained from the zero-field resistance is ps. The SdH (quantum) lifetime estimated from the -dependence of the envelope of the SdH oscillations in the unpatterned region above T is ps. The observation that is somewhat surprising because, according to the available theory, ref06Peeters.PRB.46.1992 and should have the same value. Our observation implies that COs are not as sensitive to (small-angle) scattering as SdH oscillations are. We note that has also been reported for other 2D carrier systems.ref07Lu.PRB.58.1138.1998 ; ref13Lu.PRL.81.1282.1998;Lu.PRB.60.13776.1999 Additionally, the value of our deduced is comparable to the CO lifetimes reported for (113) GaAs 2DHSs.ref13Lu.PRL.81.1282.1998;Lu.PRB.60.13776.1999
Figure 4(b) summarizes the deduced ratio as a function of density for several samples. The data for nm are from two Hall bars on the same sample. The log-log scale in Fig. 4(b) permits us to extract an approximate power-law for the dependence of on the density. If we assume that the modulation amplitude does not depend on density, is anticipated to have a dependence coming from the linear relation between the Fermi energy and the hole density, . Similar to previous results for electrons, ref10Endo.PRB.62.16761.2000 however, the data for all samples (Fig. 4(b)) show that decreases much faster with . This observation, for both electrons and holes, likely stems from screening which leads to a reduction of the modulation potential amplitude with increasing density.
Figure 4(c) is effectively a vertical cut at a fixed density of 1011 cm-2. It includes additional data points from other samples. The dependence of on period implies that obtained from the envelope fits reaches a maximum when the period is 200 nm and goes to zero for periods 100 nm and 300 nm. In the nm sample, the modulation is likely smeared out because the period is smaller than the distance of the 2DHS from the surface. We do not know why the nm sample does not show COs. Based on the COs observed at large in samples with shorter modulation period, the mean-free-path should be long enough for the 2D holes in this sample to complete ballistic trajectories.
The CO envelope fits can also be used to estimate the positions of the expected extinction field marked by the vertical dashed lines in Fig. 2(a). ref05Beton.PRB.42.9229.1990 This is the field at which the Lorentz force balances the force of the electrostatic potential. When , holes overcome the confinement potential created by the electrostatic modulation and resonant orbits are no longer formed, resulting in a decrease of the resistivity. The estimation of the position of is done using the relation between the extinction field and the ratio : ref10Endo.PRB.62.16761.2000 ; ref11Endo.PRB.72.235303.2005
| (3) |
Note that in Fig. 2(b) our deduced values of are indeed close to the maximum of the positive magnetoresistance peak often used as a measure of the extinction field.
In closing, we remark on the following observations. First, there is a sample dependence of , evident from the two Hall bars of the nm sample, where is more than a factor of 2 different. At present, we do not know what causes this sample dependence but we suspect it is related to the details of the patterning process. Second, the values of are comparable to those reported for electron systems ref10Endo.PRB.62.16761.2000 with similar parameters ref19footnote5 although a direct comparison is difficult since depends on the modulation period, the QW depth from the sample surface, the carrier density, and the effective mass.
Acknowledgements.
We are grateful to A. Endo and Y. Iye for useful discussions. We also thank Tokoyama Corporation for supplying the negative e-beam resist TEBN-1 used to make the samples. We acknowledge support through the NSF (ECCS-1001719, DMR-0904117, and MRSEC DMR-0819860) and the Moore Foundation for sample fabrication and characterization, and the DOE BES (DE-FG02-00-ER45841) for measurements..
References
- (1) D. Weiss, K. von Klitzing, K. Ploog, and G. Weimann, Europhys. Lett. 8, 179 (1989).
- (2) R. W. Winkler, J.P Kotthaus, and K. Ploog, Phys. Rev. Lett. 62, 1177 (1989).
- (3) R. R. Gerhardts, D. Weiss, and K. von Klitzing, Phys. Rev. Lett. 62, 1173 (1989).
- (4) C. W. J. Beenakker, Phys. Rev. Lett. 62, 2020 (1989).
- (5) P. H. Beton, E. S. Alves, P. C. Main, L. Eaves, M. W. Dellow, M. Henini, O. H. Hughes, S. P. Beaumont, and C. D. W. Wilkinson, Phys. Rev. B 42, 9229 (1990).
- (6) F. M. Peeters and P. Vasilopoulos, Phys. Rev. B 46, 4667 (1992).
- (7) A.D. Mirlin and P. Wolfle, Phys. Rev. B 58, 12986 (1998).
- (8) J. P. Lu and M. Shayegan, Phys. Rev. B 58, 1138 (1998).
- (9) J. H. Smet, S. Jobst, K. von Klitzing, D. Weiss, W. Wegscheider, and V. Umansky, Phys. Rev. Lett. 83, 2620 (1999).
- (10) E. Skuras, A. R. Long, I. A. Larkin, J. H. Davies, and M. C. Holland, Appl. Phys. Lett. 70, 871 (1997).
- (11) A. Endo, S. Katsumoto, and Y. Iye, Phys. Rev. B 62, 16761 (2000).
- (12) A. Endo and Y. Iye, Phys. Rev. B 72, 235303 (2005).
- (13) A. Endo and Y. Iye, J. Phys. Soc. Jpn. 74, 1792 (2005).
- (14) J. P. Lu, J. B. Yau, S. P. Shukla, M. Shayegan, L. Wissinger, U. Rossler, and R. Winkler, Phys. Rev. Lett. 81, 1282 (1998); J. P. Lu, M. Shayegan, L. Wissinger, U. Rossler, and R. Winkler, Phys. Rev. B 60, 13776 (1999).
- (15) Ballistic transport in (113) GaAs 2D holes with 2D arrays of antidots has also been reported: M. Zitzlsperger, R. Onderka, M. Suhrke, U. Rossler, D. Weiss, W. Wegscheider, M. Bichler, R. Winkler, Y. Hirayama, and K. Muraki, Europhys. Lett. 61, 382 (2003); J. Shabani, M. Shayegan, and R. Winkler, Phys. Rev. Lett. 100, 096803 (2008).
- (16) B. Grbic, C. Ellenberger, T. Ihn, K. Ensslin, D. Reuter, and A. D. Wieck, Appl. Phys. Lett. 85, 2277 (2005); M. J. Manfra, L. N. Pfeiffer, K. W. West, R. de Picciotto, and K. W. Baldwin, Appl. Phys. Lett. 86, 162106 (2005); C. Gerl, S. Schmult, H. P. Tranitz, C. Mitzkus, and W. Wegscheider, Appl. Phys. Lett. 86, 252105 (2005).
- (17) R. Winkler, Spin-Orbit Coupling Effects in Two Dimensional Electron and Hole Systems (Springer, Berlin, 2003).
- (18) Unlike the contours in Ref.14 which are well separated, the contours in our samples are close together. Thus, we might not have enough resolution to see COs corresponding to the and contours. The Fermi contours in Fig. 2(c) were calculated for a symmetric charge distribution in the QW and have symmetry along the [110] and directions. If the charge distribution in the QW is asymmetric, because of the interplay of the Rashba and Dresselhaus spin-orbit coupling, the contours along these directions are no longer equivalent and become slightly asymmetric. Our data appear not to be sensitive to this asymmetry.
- (19) For example, for sample H in Ref.11, which has a 2D electron system located 90 nm below the surface and a modulation period nm, % is reported at a density of cm-2.