Baseline validation of a bias-mitigated loan screening model based on the European Banking Authority’s trust elements of Big Data & Advanced Analytics applications using Artificial Intelligence
University of Bergamo, Bergamo 24100, Italy
alessandro.danovi@unibg.it
\AndMarzio Roma
Alba Leasing, Milano 20139, Italy
marzio.roma@albaleasing.eu
\And
QuantumSPEKTRAL, Milano 20100, Italy
davide@quantumspektral.com
\And
University of Ferrara, Ferrara 44121, Italy
* stefano.olgiati@unife.it
\AndFernando Metelli
Alba Leasing, Milano 20139, Italy
fernando.metelli@albaleasing.eu
Abstract
Background The goal of our 4-phase research project was to test if a machine-learning-based loan screening application (5D) could detect bad loans: 1) in a subset of non-performing loans, and; 2) in a set of performing and non-performing loans, subject to the following constraints: a) utilize a minimal-optimal number of publicly available features unrelated to the credit history, gender, race or ethnicity of the borrower (BiMOPT features); b) comply with the European Banking Authority and EU Commission AI HLEG principles on trustworthy Artificial Intelligence (AI). Methods All datasets have been anonymized and pseudoanonymized. In Phase 0 we selected a subset of 10 BiMOPT features out of a total of 84 features; in Phase I we trained 5D to detect bad loans in a historical dataset extracted from a mandatory report to the Bank of Italy consisting of 7,289 non-performing loans (NPLs) closed in the period 2010-2021; in Phase II we assessed the baseline performance of 5D on a distinct validation dataset consisting of an active portolio of 63,763 outstanding loans (performing and non-performing) for a total financed value of over EUR 11.5 billion as of December 31, 2021; in Phase III we will monitor the baseline performance for a period of 5 years (2023-27) to assess the prospective real-world bias-mitigation and performance of the 5D system and its utility in credit and fintech institutions Results 5D correctly detected 1,461 bad loans out of a total of 1,613 (Sensitivity = 0.91, Prevalence = 0.0253;, Positive Predictive Value = 0.19), and correctly classified 55,866 out of the other 62,150 exposures (Specificity = 0.90, Negative Predictive Value = 0.997). Interpretation Our preliminary results support the hypothesis that Big Data & Advanced Analytics applications based on AI can mitigate bias and improve consumer protection in the loan screening process without compromising the efficacy of the credit risk assessment. Further validation is required to assess the prospective performance and utility of 5D in credit and fintech institutions. Funding QuantumSPEKTRAL and Alba Leasing.
Keywords Loan screening Bias mitigation Big Data and Advanced Analytics Artificial Intelligence
1 Background
1.1 The European Banking Authority Report on Big Data & Advanced Analytics applications
The European Banking Authority (EBA) published in 2020 a report on big data and advanced analytics (BD&AA) where it observed a fast-growing interest in the use BD&AA solutions, with two out of three EU credit institutions already deploying such solutions 1.
EBA identified: i) the four functions of BD&AA applications; ii) the four key pillars of BD&AA applications, and; iii) the eleven fundamental trust elements of BD&AA applications based on Artificial Intelligence.
1.1.1 The four functions of BD&AA applications
EBA observed that all functions across institutions could benefit from BD&AA applications, as they can improve 2,:
-
1.
efficiency;
-
2.
productivity;
-
3.
the cost-effectiveness of existing services, and;
-
4.
create new business opportunities.
EBA remarked that presently EU credit institutions are using software applications based on simpler algorithms than BD&AA, limiting themselves to leveraging on their existing core data but that the current landscape can evolve at a rapid pace in the next few years.
This evolution introduces the necessity to define the key pillars and fundamental trust elements upon which BD&AA applications should be built.
1.1.2 The four key pillars of BD&AA applications
The EBA report identifies the four key pillars for the development, implementation, and adoption of BD&AA 3:
-
1.
data management;
-
2.
technological infrastructure;
-
3.
analytics methodology, and;
-
4.
organization and governance.
1.1.3 The eleven fundamental trust elements of BD&AA applications based on Artificial Intelligence
EBA finds that the roll-out of BD&AA applications based on artificial intelligence/machine learning is based on the principle of trustworthiness, and the European Commission notes that all BD&AA applications deployed by credit institutions in the EU should respect these eleven fundamental trust elements and that they have implications for all the four key pillars. These eleven trust elements are 4:
-
1.
ethics;
-
2.
explainability;
-
3.
interpretability;
-
4.
fairness;
-
5.
avoidance of bias;
-
6.
traceability;
-
7.
auditability;
-
8.
data protection;
-
9.
data quality;
-
10.
security;
-
11.
consumer protection.
1.2 The position of the European Commission High-Level Expert Group on Artificial Intelligence
The European Commission High-Level Expert Group on Artificial Intelligence (AI HLEG) has also prepared a document which elaborates the Guidelines on trustworthy AI used. Machine Learning is a subcategory of AI.
1.2.1 The three principles of trustworthy Artificial Intelligence
According to the AI HLEG Guidelines, trustworthy AI should be 4:
-
1.
lawful - respecting all applicable laws and regulations;
-
2.
ethical - respecting ethical principles and values;
-
3.
robust - both from a technical perspective while taking into account its social environment.
1.2.2 The seven key requirements of Artificial Intelligence systems
The Guidelines put forward by AI HLEG are a set of seven key requirements that AI systems should meet in order to be deemed trustworthy 5:
-
1.
Human agency and oversight: AI systems should empower human beings, allowing them to make informed decisions and fostering their fundamental rights. At the same time, proper oversight mechanisms need to be ensured, which can be achieved through: i) human-in-the-loop; ii) human-on-the-loop, and; iii) human-in-command approaches;
-
2.
Technical Robustness and safety: AI systems need to be resilient and secure. They need to be safe, ensuring a fall back plan in case something goes wrong, as well as being accurate, reliable and reproducible. That is the only way to ensure that also unintentional harm can be minimized and prevented;
-
3.
Privacy and data governance: besides ensuring full respect for privacy and data protection, adequate data governance mechanisms must also be ensured, taking into account the quality and integrity of the data, and ensuring legitimized access to data;
-
4.
Transparency: the data, system and AI business models should be transparent. Traceability mechanisms can help achieving this. Moreover, AI systems and their decisions should be explained in a manner adapted to the stakeholder concerned. Humans need to be aware that they are interacting with an AI system, and must be informed of the system’s capabilities and limitations;
-
5.
Diversity, non-discrimination and fairness: Unfair bias must be avoided, as it could could have multiple negative implications, from the marginalization of vulnerable groups, to the exacerbation of prejudice and discrimination. Fostering diversity, AI systems should be accessible to all, regardless of any disability, and involve relevant stakeholders throughout their entire life circle;
-
6.
Societal and environmental well-being: AI systems should benefit all human beings, including future generations. It must hence be ensured that they are sustainable and environmentally friendly. Moreover, they should take into account the environment, including other living beings, and their social and societal impact should be carefully considered;
-
7.
Accountability: Mechanisms should be put in place to ensure responsibility and accountability for AI systems and their outcomes;
-
8.
Auditability, which enables the assessment of algorithms, data and design processes plays a key role therein, especially in critical applications. Moreover, adequate an accessible redress should be ensured.
1.3 Definition of non-performing loans and their subcategories by the Bank of Italy
The definitions of non-performing loans (NPLs) and their subcategories adopted by the Bank of Italy have been harmonized within the Single Supervisory Mechanism (SSM) and meet the European Banking Authority (EBA) standards 6, 7,8, 9, 10, 11, 12, 13, 14.
NPLs are exposures to debtors who are no longer able to meet all or part of their contractual obligations because their economic and financial circumstances have deteriorated.
The 3 subcategories of NPLs are:
-
1.
Bad loans are exposures to debtors that are insolvent or in substantially similar circumstances.
-
2.
Unlikely-to-pay exposures (aside from those included among bad loans) are those in respect of which banks believe the debtors are unlikely to meet their contractual obligations in full unless action such as the enforcement of guarantees is taken.
-
3.
Overdrawn and/or past-due exposures (aside from those classified among bad loans and unlikely-to-pay exposures) are those that are overdrawn and/or past-due by more than 90 days and for above a predefined amount.
2 Methods
2.1 Purpose of the 5D research project
The goal of our research was to test if 5D, a machine-learning-based loan screening application, could detect a sub-subset of bad loans: 1) in a small subset of non-performing loans (bad loans, unlikely-to-pay, overdrawn and/or past-due exposures), and; 2) in a larger set of performing and non-performing loans subject to the following constraints: a) achieve a sensitivity and specificity not lower than 0.9: b) utilize a maximally relevant, minimally redundant number of publicly available features unrelated to the credit history, gender, race or ethnicity of the borrower (BiMOPT features); 3) comply with the European Banking Authority’s and EU AI HLEG’s Commission’s principles on Big Data & Advanced Analytics based on Artificial Intelligence.
2.2 Phases
The 5D research project is divided into 4 Phases as shown in Figure 1:
-
1.
in Phase 0 we selected a subset of 10 BiMOPT features out of a total of 84 features;
-
2.
in Phase I we trained 5D to detect bad loans in a historical dataset extracted from a mandatory report to the Bank of Italy consisting of 7,289 non-performing loans (NPLs) closed in the period 2010-2021;
-
3.
in Phase II we assessed the baseline performance of 5D on a distinct validation dataset consisting of an active portolio of 63,763 outstanding loans (performing and non-performing) for a total financed value of over EUR 11.5 billion as of December 31, 2021;
-
4.
in Phase III we will monitor the baseline performance for a period of 5 years (2023-27) to assess the prospective real-world bias-mitigation and performance of the 5D system and its utility in credit and fintech institutions.
2.3 Timeline
The timeline of the 5D research project is shown in Figure 2:
2.4 Datasets
The 5D model has been trained and tested on the historical portfolio extracted from a mandatory report to the Bank of Italy and validated on the active portfolio:
-
•
The historical portfolio extracted from a mandatory report to the Bank of Italy consists only of Non-performing Loans (NPLs) closed in the period 2010-2021 as shown in Figure 3: i) NPLs are exposures to debtors who are no longer able to meet all or part of their contractual obligations because their economic and financial circumstances have deteriorated; ii) Bad loans is the most severe subcategory of NPLs consisting of exposures to debtors that are insolvent or in substantially similar circumstances;
-
•
The active portfolio consists of both Performing and Non-performing Loans (NPLs) as of December 31, 2021 as shown in Figure 4.
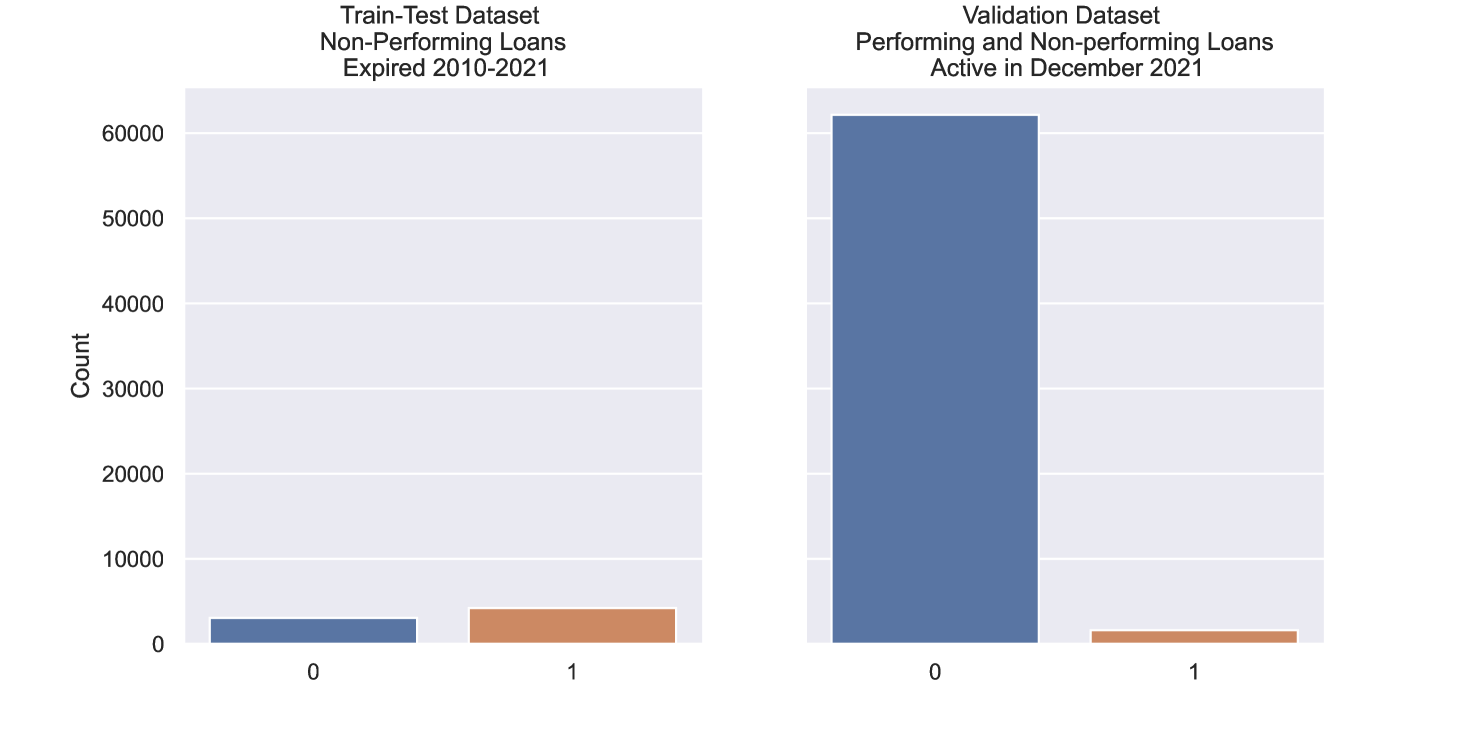
The historical portfolio (Train-Test Dataset) was balanced versus a highly imbalanced active portfolio (Baseline Validation Dataset) as shown in Figure 5 and Table 1.
2.5 EU GDPR Data Anonymization and Pseudonymization
All datasets have been anonymized and pseudoanonymized. We removed any references to an identifiable person/entity from all data sets, thus turning personal information into non-personal information. The remaining data have been pseudonymized by masking and noising, so that no person/entity can be identified from the information without reference to additional information. The additional information has been kept separately from the pseudonymized person/entity information and is subject to technical and organizational safeguards (such as access controls) to keep it secure 15, 16.
2.6 Bias-mitigated minimal-optimal features
We performed data-based bias mitigation by 17, 18, 19, 20, 21 removing features related to the credit history, gender, race or ethnicity of the borrower 22, 23 .
We improved the performance of 5D by selecting maximally relevant, minimally redundant features 24, 25, 26.
We referred to these new features as Bias-Mitigated Minimal-Optimal Features (BiMOPT) as shown in Figure 6 and Table 2 .
2.7 Retrospective Performance of the 5D model on the Train-Test Dataset
We trained a scalable tree-based extreme gradient boosting meta-algorithm 27 and assessed its performance and skill on the Train-Test Dataset by calibrating the predicted probabilities 28 and by measuring the Brier Loss 29 and Brier Skill Score (Figure 7) 30.
- 1.
-
2.
The Brier Loss Score (BS) measures the mean squared difference between the predicted probability and the actual outcome. The smaller the Brier score loss, the better, hence the naming with loss 1.
(1) The Brier Score always takes on a value between zero and one, since this is the largest possible difference between a predicted probability (which must be between zero and one) and the actual outcome (which can take on values of only 0 and 1). The Brier score is appropriate for binary and categorical outcomes 29;
-
3.
The quality of the predictions and thus the reliability of probability predictions can be evaluated using the Brier Skill Score (BSS) 2.
(2) Where BS is the Brier Score, BSref is the No-skill Brier Score, or the Brier Score resulting by just predicting the positive class (bad loans) based on prevalence, in this case 0.0253.
The BSS indicates the degree of improvement of the classifier over a classifier with no skill. A skill score value less than zero means that the performance is even worse than that of the baseline or reference predictions 3.
3 Results
Using as little as 10 Bias-mitigated minimal-optimal features 2.6 selected out of 84 total features, 5D correctly detected 1,461 bad loans out of a total of 1,613 (Sensitivity = 0.91, Prevalence = 0.0253), and correctly classified 55,866 out of the other 62,150 exposures (Specificity = 0.90) 4.
The low Positive Predictive Value (0.19) and high Negative Predictive Value (0.997) of bad loans by 5D at baseline is characteristic of a ’prudential’ approach to the classification of bad loans, as banks are required to adopt ’prudential’ credit risk models. Only in Phase III of the research project we will be able to update the baseline performances of the 5D system.
4 Limitations
To our present knowledge, our research findings suffer from the following limitations:
-
•
5D has been baseline validated on an ’active’ portfolio. This means that the baseline performance values reported in the 3 section can be ’terminally’ estimated only when the loans they refer to are closed;
-
•
the 5D classifier has been trained on the portfolio of a specific bank-related asset financing institution. This means that it might not ’generalize’ to other credit institutions, even if trained on their specific datasets;
-
•
the 10 BiMOPT features selected for the machine-learning-based predictions can be time-biased; in other words, they might contain information which has been updated in the period 2010-2021 to reflect the evolving status of the loan; that information would not have been available at the time of the decision, therefore 5D has an ’advantage’ towards an original ’manual’ decisor;
-
•
the 10 BiMOPT features might be subject to ’data drift’ bot in the period 2010-2021 and in the Phase III period 2022-2027; drift is a distribution change between the training and deployment data, which can affect model performance for reasons not related to the actual predictive power of the algorithm 33, 34.
5 Interpretation
Our preliminary results support the hypothesis that Big Data & Advanced Analytics applications based on AI can mitigate bias and improve consumer protection in the loan screening process without compromising the efficacy of the credit risk assessment. Further validation is required; in Phase III of the research project we will monitor the baseline performance of 5D for a period of 5 years (2023-27) to assess the prospective real-world bias-mitigation and performance of the 5D system and its utility in credit and fintech institutions.
6 Funding
This study received funding from QuantumSPEKTRAL (Milano, Italy, EU) and Alba Leasing (Milano, Italy, EU) in the form of direct reimbursement of research costs. No other funding was received.
Acknowledgments
We are grateful of the collaboration on use cases and empirical evaluation by the employees of Alba Leasing. In particular, we appreciate Stefano Rossi for the guidance and support on implementation. We also would like to extend our gratitude to Nima Heidari and Brady Fish for for reviewing the manuscript. We would also like to thank a number of anonymous reviewers for helpful comments on earlier versions of this paper.
Author contributions statement
S.O. and D.M. were responsible for conceptualization, the methodology, and the software; A.D. and S.O. were responsible for the formal analysis; S.O. and M.R. were responsible for the investigation; A.D. was responsible for the resources; M.R. was responsible for data curation; S.O. was responsible for writing the original draft preparation; A.D., M.R. and F.M. were responsible for review and editing; S.O. and D.M. were responsible for visualization; A.D., M.R. and F.M. were responsible for supervision; A.D. was responsible for project administration. S.O. and D.M. are responsible for the AI/ML algorithms. All authors have read and agreed to the published version of the manuscript.
Competing Interest Statement
The authors declare that they have received support for the present manuscript in terms of provision of funds, data and study materials. In the past 36 months, the authors have received grants from public research institutions and contracts from fintech and other financial companies pertaining the field of fintech. The authors have received and are likely to receive in the future royalties, licenses, consulting fees, payment or honoraria for lectures, presentations, speakers bureaus, manuscript writing or educational events. Some parts of the Artificial Intelligence algorithms are copyrighted by QuantumSPEKTRAL and QuantumSPEKTRAL is likely to patent some of the contents. The authors hold stock and stock options directly and indirectly in publicly traded and private fintech and other financial companies. The authors declare no other competing interests.
Copyright, Patents and Registered Marks
The copyright holder for this preprint is QuantumSPEKTRAL who has granted a license to display the preprint in perpetuity. All rights reserved. No reuse allowed without permission. 5D is a registered trademark of QuantumSPEKTRAL.
Machine Learning / Artificial Intelligence Disclaimer
Machine Learning and Artificial Intelligence are sometimes wrong. Although QuantumSPEKTRAL (Milano, Italy) takes all possible care to ensure the correctness of published information, no warranty can be accepted regarding the correctness, accuracy, up-to-dateness, reliability and completeness of the content of this information. QuantumSPEKTRAL expressly reserves the right to change, delete or temporarily not to publish the contents of this preprint wholly or partly at any time and without giving notice. Liability claims against QuantumSPEKTRAL because of tangible or intangible damage arising from accessing, using or not using the published information are excluded.
EU GDPR Data Anonymization and Pseudonymization Policy
All datasets used to train, test, and validate the machine-learning models have been destroyed by QuantumSPEKTRAL after training, testing, and validation. Before training, testing, and validation, Alba Leasing and QuantumSPEKTRAL removed any references to an identifiable person/entity from all data sets, thus turning personal information into non-personal information. The remaining data have been pseudonymized by masking and noising, so that no person/entity can be identified from the information without reference to additional information. The additional information has been kept separately from the pseudonymized person/entity information and is subject to technical and organizational safeguards (such as access controls) to keep it secure. Given the changing nature of technology, it is possible that some anonymized data sets might, one day, be subject to re-identification. Some researchers also found that machine-learning models can be used to re-build the original datasets. However, this should not be reasonably possible in the current technological climate.
References
- Authority [2020] European Banking Authority. Report on big data and advanced analytics, 2020.
- Authority [2016] European Banking Authority. Joint committee discussion paper on the use of big data by financial institutions, 2016.
- Authority [2018] European Banking Authority. Joint committee final report on big data, 2018.
- on Artificial Intelligence [2019a] European Commission High-Level Expert Group on Artificial Intelligence. Ethics guidelines for trustworthy ai, 2019a.
- on Artificial Intelligence [2019b] European Commission High-Level Expert Group on Artificial Intelligence. A definition of ai: main capabilities and disciplines. definition developed for the purpose of the ai hleg deliverables, 2019b.
- Bank [2017] European Central Bank. Guidance to banks on non-performing loanss, 2017.
- Bank [2021] European Central Bank. Non-performing loans. supervisory practices. priorities and risks, 2021.
- of Italy [2008] Bank of Italy. Circolare n. 272 del 30 luglio 2008 - matrice dei conti, 2008.
- of Italy [2020a] Bank of Italy. Financial stability report no. 1 - 2020, 2020a.
- of Italy [2020b] Bank of Italy. Financial stability report no. 2 - 2020, 2020b.
- of Italy [2021a] Bank of Italy. Financial stability report no. 1 - 2021, 2021a.
- of Italy [2021b] Bank of Italy. Financial stability report no. 2 - 2021, 2021b.
- of Italy [2021c] Bank of Italy. Circolare n. 272 del 30 luglio 2008 - matrice dei conti - testo integrale al 15 aggiornamento, 2021c.
- of Italy [2022] Bank of Italy. Financial stability report no. 1 - 2022, 2022.
- Commission [2018] European Commission. Eu general data protection regulation (gdpr), 2018. URL https://ec.europa.eu/commission/sites/beta-political/files/data-protection-factsheet-changes_en.pdf.
- Katirai [2006] Hooman Katirai. A theory and toolkit for the mathematics of privacy: methods for anonymizing data while minimizing information loss. PhD thesis, Massachusetts Institute of Technology, 2006.
- Review [2020] MIT Sloan Management Review. The risk of machine learning bias (and how to prevent it), 2020.
- of Technology [2020] Massachusetts Institute of Technology. Case study with data: Mitigating gender bias on the uci adult database, 2020.
- Zhong [2018] Ziyuan Zhong. A tutorial on fairness in machine learning. Medium, October, 22:2018, 2018.
- Olteanu [2018] A Olteanu. Tutorial: Learning curves for machine learning in python, 2018.
- Kun [2015] J Kun. One definition of algorithmic fairness: Statistical parity, 2015.
- Verma et al. [2021] Sahil Verma, Michael Ernst, and Rene Just. Removing biased data to improve fairness and accuracy. arXiv preprint arXiv:2102.03054, 2021.
- Abu-Elyounes [2020] Doaa Abu-Elyounes. Contextual fairness: A legal and policy analysis of algorithmic fairness. U. Ill. JL Tech. & Pol’y, page 1, 2020.
- Cover [1974] Thomas M Cover. The best two independent measurements are not the two best. IEEE Transactions on Systems, Man, and Cybernetics, 1(1):116–117, 1974.
- Ding and Peng [2005] Chris Ding and Hanchuan Peng. Minimum redundancy feature selection from microarray gene expression data. Journal of bioinformatics and computational biology, 3(02):185–205, 2005.
- Zhao et al. [2019] Zhenyu Zhao, Radhika Anand, and Mallory Wang. Maximum relevance and minimum redundancy feature selection methods for a marketing machine learning platform. In 2019 IEEE International Conference on Data Science and Advanced Analytics (DSAA), pages 442–452. IEEE, 2019.
- Chen and Guestrin [2016] Tianqi Chen and Carlos Guestrin. XGBoost: A scalable tree boosting system. In Proceedings of the 22nd ACM SIGKDD International Conference on Knowledge Discovery and Data Mining, KDD ’16, pages 785–794, New York, NY, USA, 2016. ACM. ISBN 978-1-4503-4232-2. doi:10.1145/2939672.2939785. URL http://doi.acm.org/10.1145/2939672.2939785.
- Niculescu-Mizil and Caruana [2005] Alexandru Niculescu-Mizil and Rich Caruana. Predicting good probabilities with supervised learning. In Proceedings of the 22nd international conference on Machine learning, pages 625–632, 2005.
- Brier et al. [1950] Glenn W Brier et al. Verification of forecasts expressed in terms of probability. Monthly weather review, 78(1):1–3, 1950.
- Gneiting and Raftery [2007] Tilmann Gneiting and Adrian E Raftery. Strictly proper scoring rules, prediction, and estimation. Journal of the American statistical Association, 102(477):359–378, 2007.
- Naeini et al. [2015] Mahdi Pakdaman Naeini, Gregory Cooper, and Milos Hauskrecht. Obtaining well calibrated probabilities using bayesian binning. In Twenty-Ninth AAAI Conference on Artificial Intelligence, 2015.
- Guo et al. [2017] Chuan Guo, Geoff Pleiss, Yu Sun, and Kilian Q Weinberger. On calibration of modern neural networks. In International conference on machine learning, pages 1321–1330. PMLR, 2017.
- Ackerman et al. [2020] Samuel Ackerman, Eitan Farchi, Orna Raz, Marcel Zalmanovici, and Parijat Dube. Detection of data drift and outliers affecting machine learning model performance over time. arXiv preprint arXiv:2012.09258, 2020.
- Ackerman et al. [2021] Samuel Ackerman, Orna Raz, Marcel Zalmanovici, and Aviad Zlotnick. Automatically detecting data drift in machine learning classifiers. arXiv preprint arXiv:2111.05672, 2021.
7 Tables
| Total | Bad Loans | Bad Loans as % of Total | Bad Loans Distribution | |
|---|---|---|---|---|
| Train-Test Dataset | 7,289 | 4,224 | 57.95 | Balanced |
| Validation Dataset | 63,763 | 1,613 | 2.53 | Highly Imbalanced |
Legend
Composition of the Train-Test and Baseline Validation Datasets. The Baseline Validation Dataset is heavily imbalanced 2.4.
|
|
BiMOPT Features | |||||
|---|---|---|---|---|---|---|---|
| Number of Features | 30 | 84 | 10 |
Legend
Bias-mitigated minimal-optimal features (BiMOPT) are bias-mitigated, maximum relevance, minimum redundance, publicly available features unrelated to the credit history, gender, race or ethnicity of the borrower. They are a subset of the features in common between the Train-Test and Baseline Validation Datasets 2.6.
| ECE | BS | BSS | |
| Train-Test Performance | 0.04 | 0.19 | 0.2 |
Legend
Calibration, Brier Loss Score and Brier Skill Score of 5D in the training-testing retrospective Phase II 2.7:
-
1.
Thus, Expected Calibration Error (ECE) is a weighted mean of the calibration errors of the single bins, where each bin weighs proportionally to the number of observations that it contains. We set the number of bins according to the Freedman-Diaconis rule designed for finding the number of bins that makes the histogram as close as possible to the theoretical probability distribution;
-
2.
The Brier Loss Score (BS) 1 measures the mean squared difference between the predicted probability and the actual outcome. The smaller the Brier score loss, the better, hence the naming with loss. The Brier score always takes on a value between zero and one, since this is the largest possible difference between a predicted probability (which must be between zero and one) and the actual outcome (which can take on values of only 0 and 1). The Brier score is appropriate for binary and categorical outcomes. The x axis represents the predicted probability. The y axis is the Brier Loss Score of the classifier for every predicted probability;
-
3.
The quality of the predictions and thus the reliability of probability predictions can be evaluated using the Brier Skill Score (BSS) 2. The BSS is based on the Brier Score (BS). BSS for a given underlying score is an offset and (negatively) scaled variant of the underlying score such that a skill score value of zero means that the score for the predictions is merely as good as that of a set of baseline or reference or default predictions, while a skill score value of one represents the best possible score. A skill score value less than zero means that the performance is even worse than that of the baseline or reference predictions.
.
| Prevalence of Bad Loans | Sensitivity | Specificity | PPV | NPV | |
| Baseline Performance | 0.0253 | 0.90 | 0.91 | 0.19 | 0.997 |
Legend
Baseline Performance of 5D 3:
-
1.
Prevalence: Serves to measure the balance of data within the total population. It is possible to measure the prevalence of positives or negatives and the sum of both quotients is = 1, a balanced data set would give coefficients close to 0.5 If, on the contrary, one of the factors is close to 1 and the other to 0, we are going to have an unbalanced data set;
-
2.
Sensitivity measures the proportion of true positives that are correctly identified as such;
-
3.
Specificity (also called the True Negative Rate) measures the proportion of true negatives that are correctly identified as such;
-
4.
PPV - Positive Predictive Value or Precision describe the performance of a diagnostic test as the proportion of true positives in the predicted positives. PPV is not intrinsic to the test; it depends also on the Prevalence;
-
5.
NPV - Negative predictive value describe the performance of a diagnostic test as the proportion of true negatives in the predicted negatives. NPV is not intrinsic to the test; it depends also on the Prevalence.
8 Figures
[2]20102026[] \event20102010 \event[2010]2021Historical Data Collection \event20212021 \event[2021]2023Phases 0, I and II \event20232023 \event[2023]2027Phase III \event20272027
Legend
Composition of the Train-Test Dataset consisting only of Non-performing Loans (NPLs) closed in the period 2010-2021: i) NPLs are exposures to debtors who are no longer able to meet all or part of their contractual obligations because their economic and financial circumstances have deteriorated; ii) Bad loans is the most severe subcategory of NPLs consisting of exposures to debtors that are insolvent or in substantially similar circumstances 2.4.
Legend
Composition of the Validation Dataset consisting of both Performing and Non-performing Loans (NPLs) as of December 31, 2021: i) NPLs are exposures to debtors who are no longer able to meet all or part of their contractual obligations because their economic and financial circumstances have deteriorated; ii) Bad loans is the most severe subcategory of NPLs consisting of exposures to debtors that are insolvent or in substantially similar circumstances 2.4.
Legend
Composition of the Train-Test Dataset 2.4 consisting of:
-
•
0 = Unlikely-to-pay exposures (aside from those included among bad loans) are those in respect of which banks believe the debtors are unlikely to meet their contractual obligations in full unless action such as the enforcement of guarantees is taken;
-
•
1 = Bad loans is the most severe subcategory of NPLs consisting of exposures to debtors that are insolvent or in substantially similar circumstances.
Composition of the Baseline Validation Dataset consisting of:
-
•
0 = Performing and Non-performing exposures which are not Bad Loans;
-
•
1 = Bad loans.
Legend
Bias-mitigated minimal-optimal features (BiMOPT) are bias-mitigated, maximum relevance, minimum redundance, publicly available features unrelated to the credit history, gender, race or ethnicity of the borrower. They are a subset of the features in common between the Train-Test and Baseline Validation Datasets 2.6.
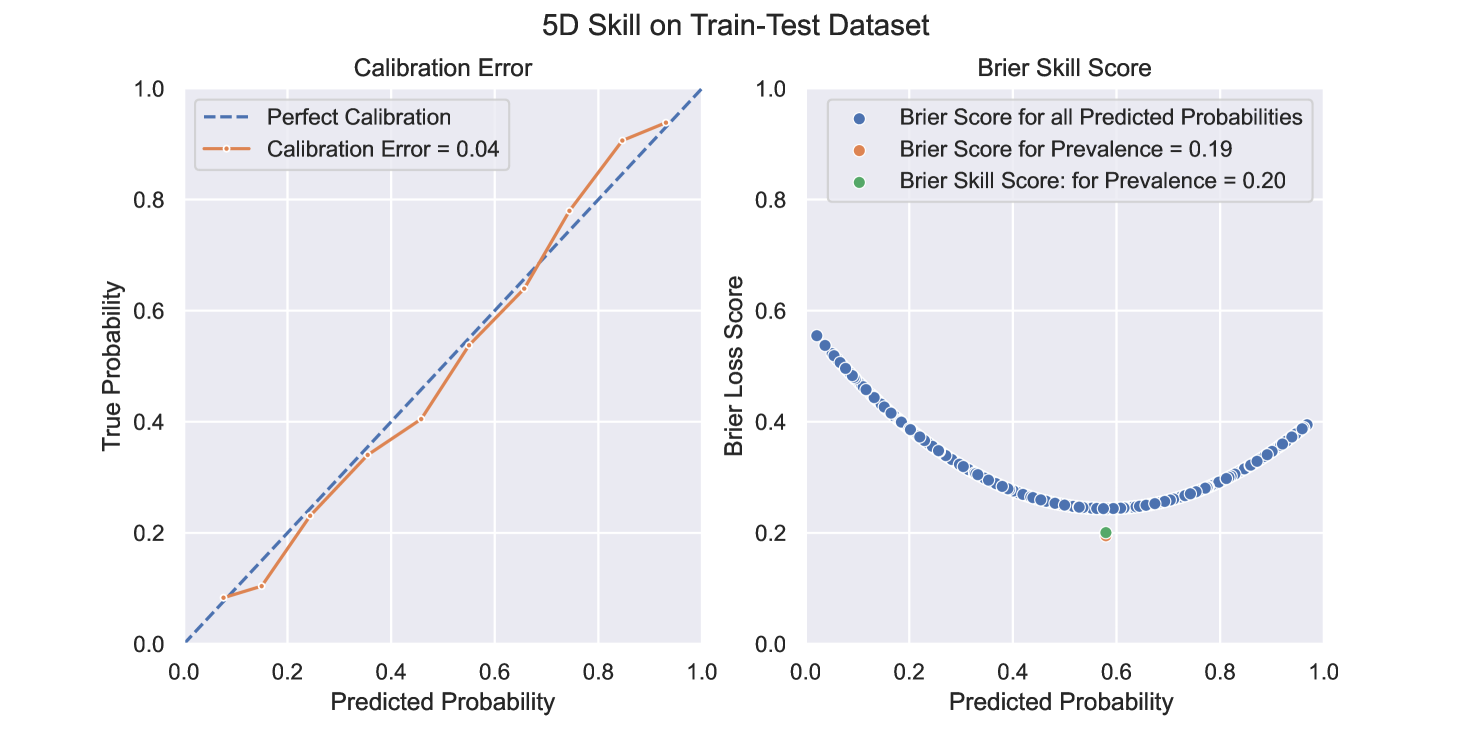
Legend
Calibration, Brier Loss Score and Brier Skill Score of 5D in the training-testing retrospective Phase II 2.7:
-
1.
The Calibration Curve (reliability diagram) compares how well the probabilistic predictions of the 5D binary classifier are calibrated. It plots the true frequency of the positive label (Bad Loans) against its predicted probability, for binned predictions. The x axis represents the average predicted probability in each bin. The y axis is the fraction of positives, i.e. the proportion of samples whose class is the positive class in each bin (Bad Loans);
-
2.
Thus, Expected Calibration Error (ECE) is a weighted mean of the calibration errors of the single bins, where each bin weighs proportionally to the number of observations that it contains. We set the number of bins according to the Freedman-Diaconis rule designed for finding the number of bins that makes the histogram as close as possible to the theoretical probability distribution;
-
3.
The Brier Loss Score (BS) 1 measures the mean squared difference between the predicted probability and the actual outcome. The smaller the Brier score loss, the better, hence the naming with loss. The Brier score always takes on a value between zero and one, since this is the largest possible difference between a predicted probability (which must be between zero and one) and the actual outcome (which can take on values of only 0 and 1). The Brier score is appropriate for binary and categorical outcomes. The x axis represents the predicted probability. The y axis is the Brier Loss Score of the classifier for every predicted probability;
-
4.
The quality of the predictions and thus the reliability of probability predictions can be evaluated using the Brier Skill Score (BSS) 2. The BSS is based on the Brier Score (BS). BSS for a given underlying score is an offset and (negatively) scaled variant of the underlying score such that a skill score value of zero means that the score for the predictions is merely as good as that of a set of baseline or reference or default predictions, while a skill score value of one represents the best possible score. A skill score value less than zero means that the performance is even worse than that of the baseline or reference predictions.