Bayesian Deep Learning Via Expectation Maximization and Turbo Deep Approximate Message Passing
Abstract
Efficient learning and model compression algorithm for deep neural network (DNN) is a key workhorse behind the rise of deep learning (DL). In this work, we propose a message passing based Bayesian deep learning algorithm called EM-TDAMP to avoid the drawbacks of traditional stochastic gradient descent (SGD) based learning algorithms and regularization-based model compression methods. Specifically, we formulate the problem of DNN learning and compression as a sparse Bayesian inference problem, in which group sparse prior is employed to achieve structured model compression. Then, we propose an expectation maximization (EM) framework to estimate posterior distributions for parameters (E-step) and update hyperparameters (M-step), where the E-step is realized by a newly proposed turbo deep approximate message passing (TDAMP) algorithm. We further extend the EM-TDAMP and propose a novel Bayesian federated learning framework, in which and the clients perform TDAMP to efficiently calculate the local posterior distributions based on the local data, and the central server first aggregates the local posterior distributions to update the global posterior distributions and then update hyperparameters based on EM to accelerate convergence. We detail the application of EM-TDAMP to Boston housing price prediction and handwriting recognition, and present extensive numerical results to demonstrate the advantages of EM-TDAMP.
Index Terms:
Bayesian deep learning, DNN model compression, expectation maximization, turbo deep approximate message passing, Bayesian federated learningI Introduction
Deep learning (DL) has become increasingly important in various artificial intelligence (AI) applications. In DL, a deep neural network (DNN), which is a type of neural network modeled as a multilayer perceptron (MLP), is trained with algorithms to learn representations from data sets without any manual design of feature extractors. It is well known that the training algorithm is one of the pillars behind the success of DL. Traditional deep learning methods first construct a loss function (e.g. mean square error (MSE), cross-entropy) and then iteratively update parameters through back propagation (BP) and stochastic gradient descent (SGD). Furthermore, to mitigate the computational load in DNN inference for large models, researchers have proposed several model compression techniques. Early regularization methods generate networks with random sparse connectivity, requiring high-dimensional matrices. Group sparse regularization has been introduced to eliminate redundant neurons, features and filters [13, 14]. A recent work has addressed neuron-wise, feature-wise and filter-wise groupings within a single sparse regularization term [15].
However, the traditional deep learning and model compression methods have several drawbacks. For example, for regularization-based pruning methods, it is difficult to achieve the exact compression ratio after training. Another drawback is their tendency to be overconfident in their predictions, which can be problematic in applications such as autonomous driving and medical diagnostics [38, 47, 33], where silent failure can lead to dramatic outcomes. To overcome the problems, Bayesian deep learning has been proposed, allowing for uncertainty quantification [19]. Bayesian deep learning formulates DNN training as a Bayesian inference problem, where the DNN parameters with a prior distribution serve as hypotheses, and the training set consists of features and labels . Calculating the exact Bayesian posterior distribution for a DNN is extremely challenging, and a widely used method is variational Bayesian inference (VBI), where a variational distribution with parameters is proposed to approximate the exact posterior [36]. However, most VBI algorithms still rely on SGD for optimizing variational distribution parameters , where loss function is often defined as the Kullback-Leibler divergence between and [36, 42].
The abovementioned training methods are all based on SGD, and thus have several limitations, including vanishing and exploding gradients [9, 10], the risk of getting stuck in suboptimal solutions [11], and slow convergence. Although there have been attempts to address these issues through advanced optimization techniques like Adam [7], the overall convergence remains slow for high training accuracy requirements, which limits the application scenarios of SGD-based DL. To avoid drawbacks of SGD, [27] utilizes message-passing algorithms, e.g. Belief Propagation (BP), BP-Inspired (BPI) message passing, mean-field (MF), and approximate message passing (AMP) for training. The experiments show that those message-passing based algorithms have similar performance, and are slightly better than SGD based baseline in some cases. However, the existing message-passing algorithms in [27] cannot achieve efficient model compression and may have numerical stability issues.
In recent years, federated learning is becoming a main scenario in deep learning applications with the development of computation power of edge devices. Federated learning (FL) is a machine learning paradigm where the clients train models with decentralized data and the central server handles aggregation and scheduling. Modern federated learning methods typically perform the following three steps iteratively [37].
1. Broadcast: The central server sends current model parameters and a training program to clients.
2. Local training: Each client locally computes an update to the model by executing the training program, which might for example run SGD on the local data.
3. Aggregation: The server aggregates local results and update the global model using e.g., the federated averaging (FedAvg) [8] or its variations [39, 35, 48].
However, most existing federated learning algorithms inherent abovementioned drawbacks because the local training still relies on the traditional deep learning methods.
To overcome the drawbacks of existing deep learning, model compression and federated learning methods, we propose a novel message passing based Bayesian deep learning algorithm called Expectation Maximization and Turbo Deep Approximate Message Passing (EM-TDAMP). The main contributions are summarized as follows.
-
•
We propose a novel Bayesian deep learning algorithm EM-TDAMP to enable efficient learning and structured compression for DNN: Firstly, we formulate the DNN learning problem as Bayesian inference of the DNN parameters. Then we propose a group sparse prior distribution to achieve efficient neuron-level pruning during training. We further incorporate zero-mean Gaussian noise in the likelihood function to control the learning rate through noise variance. The proposed Bayesian deep learning algorithm EM-TDAMP is based on expectation maximization (EM) framework, where E-step estimates the posterior distribution, and M-step adaptively updates hyperparameters. In E-step, we cannot directly apply the standard sum-product rule due to the existence of many loops in the DNN factor graph and the high computational complexity. Although various approximate message passing methods have been proposed to reduce the complexity of message passing in the compressed sensing literature [51, 52], to the best of our knowledge, there is no efficient message passing algorithm available for training the DNN with both multiple layers and structured sparse parameters. Therefore, we propose a new TDAMP algorithm to realize the E-step, which iterates between two Modules: Module B performs message passing over the group sparse prior distribution, and Module A performs deep approximate message passing (DAMP) over the DNN using independent prior distribution from Module B. The proposed EM-TDAMP overcomes the aforementioned drawbacks of SGD-based training algorithms, showing faster convergence and superior inference performance in simulations. It also improves the AMP based training methods in [27] in several aspects: we introduce group sparse prior and utilize turbo framework to enable structured model compression; we propose zero-mean Gaussian noise at output and construct a soft likelihood function to ensure numerical stability; we update prior parameters and noise variance via EM to accelerate convergence.
-
•
We propose a Bayesian federated learning framework by extending the EM-TDAMP algorithm to federated learning scenarios: The proposed framework also contains the above mentioned three steps (Broadcast, Local training, Aggregation). In step 1 (Broadcast), the central server broadcasts hyperparameters in prior distribution and likelihood function to clients. In step 2 (Local training), each client performs TDAMP to compute local posterior distribution. In step 3 (Aggregation), the central server aggregates local posterior parameters and updates hyperparameters via EM. Compared to the conventional FedAvg [8], the proposed Bayesian federated learning framework achieves more structured sparsity and reduces communication rounds as shown in simulations.
The rest of the paper is organized as follows. Section II presents the problem formulation for Bayesian deep learning with structured model compression. Section III derives the EM-TDAMP algorithm and discusses various implementation issues. Section IV extends the proposed EM-TDAMP to federated learning scenarios. Section V details the application of EM-TDAMP to Boston housing price prediction and handwriting recognition. Finally, the conclusion is given in Section VI.
II Problem Formulation for Bayesian Deep Learning
II-A DNN Model and Standard Training Procedure
A general DNN consists of one input layer, multiple hidden layers, and one output layer. In this paper, we focus on feedforward DNNs for easy illustration. Let be a DNN with layers that maps the input vector to the output vector with a set of parameters . The input and output of each layer, denoted as and respectively, can be expressed as follows:
where , and account for the weight matrix, the bias vector and the activation function in layer , respectively. As is widely used, we set as rectified linear units (ReLU) defined as:
| (1) |
For classification model, the output is converted into a predicted class from the set of possible labels/classes using the argmax layer:
where represents the output related to the -th label. However, the derivative of argmax activation function is discontinuous, which may lead to numerical instability. As a result, it is usually replaced with softmax when using SGD-based algorithms to train the DNN. In the proposed framework, to facilitate message passing algorithm design, we add zero-mean Gaussian noise on , which will be further discussed in Subsection II-B2.
The set of parameters is defined as . In practice, the DNN parameters are usually obtained through a deep learning/training algorithm, which is the process of regressing the parameters on some training data , usually a series of inputs and their corresponding labels . The standard approach is minimizing a loss function to find a point estimate of using the SGD-based algorithms. In regression models, the loss function is often defined as mean square error (MSE) on the training set as (2), and sometimes with a regularization term to penalize parametrizations or compress the DNN model as (3) if we choose an -norm regularization function to prune the DNN weights. It is also possible to use more complicated sparse regularization functions to remove redundant neurons, features and filters [13, 14]. However, the standard training procedure above has several drawbacks as discussed in the introduction. Therefore, in this paper, we propose a Bayesian learning formulation to overcome those drawbacks.
| (2) |
| (3) |
II-B Problem Formulation for Bayesian Deep Learning with Structured Model Compression
In the proposed Bayesian deep learning algorithm, the parameters are treated as random variables. The goal of the proposed framework is to obtain the Bayesian posterior distribution , which can be used to predict the output distribution (i.e., both point estimation and uncertainty for the output) on test data through forward propagation similar to that in training process. The joint posterior distribution can be factorized as (4):
| (4) |
The prior distribution is set as group sparse to achieve model compression as will be detailed in Subsection II-B1. The likelihood function is chosen as Gaussian/Probit-product to prevent numerical instability, as will be detailed in Subsection II-B2.
II-B1 Group Sparse Prior Distribution for DNN Parameters
Different applications often have varying requirements regarding the structure of DNN parameters. In the following, we shall introduce a group sparse prior distribution to capture structured sparsity that may arise in practical scenarios. Specifically, the joint prior distribution is given by
| (5) |
where represents the number of groups, represents the active probability for the -th group, represents the set consisting of indexes of in the -th group and represents the probability density function (PDF) of when active, which is chosen as a Gaussian distribution with expectation and variance denoted as in this paper. Here we shall focus on the following group sparse prior distribution to enable structured model compression.
Independent Sparse Prior for Bias Pruning
To impose simple sparse structure on the bias parameters for random dropout, we assume the elements have independent prior distributions:
where
represents the active probability, and and represent the expectation and variance when active.
Group Sparse Prior for Neuron Pruning
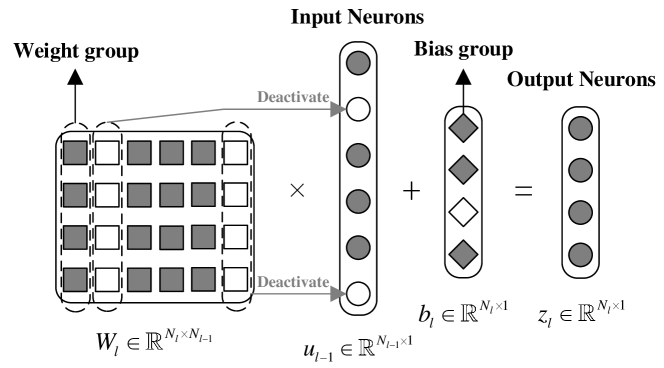
In most DNNs, a weight group is often defined as the outgoing weights of a neuron to promote neuron-level sparsity. Note that there are a total number of input neurons and hidden neurons in the DNN. In order to force all outgoing connections from a single neuron (corresponding to a group) to be either simultaneously zero or not, we divide the weight parameters into groups, such that the -th group for corresponds to the weights associated with the -th neuron. Specifically, for the -th weight group , we denote the active probability as , and the expectation and variance related to the -th element as and . The joint prior distribution can be decomposed as:
where
Note that a parameter corresponds to either a bias parameter or a weight parameter , and thus we have . For convenience, we define as a set consisting of for and for , which will be updated to accelerate convergence as will be further discussed later. Please refer to Fig. 1 for an illustration of group sparsity. It is also possible to design other sparse priors to achieve more structured model compression, such as burst sparse prior, which is widely used in the literature on sparse channel estimation [45, 34]. Specifically, the burst sparse prior introduces a Markov distributed sparse support vector to drive the active neurons in each layer to concentrate on a few clusters [45, 34]. The detailed derivation with burst sparse prior is omitted due to limited space.
II-B2 Likelihood Function for the Last Layer
In the Bayesian inference problem, the observation can be represented as a likelihood function for , where we define . Directly assume may lead to numerical instability. To avoid this problem, we add zero-mean Gaussian noise with variance on the output . The noise variance is treated as a hyperparameter that is adaptively updated to control the learning rate. In the following, we take regression model and classification model as examples to illustrate the modified likelihood function.
Gaussian Likelihood Function for Regression Model
For regression model, after adding Gaussian noise at output, the likelihood function becomes joint Gaussian:
| (6) |
where and represent the noise variance, the -th element in and , respectively.
Probit-product Likelihood Function for Classification Model
For classification model, we consider one-hot labels, where refers to the label for the -th training sample. Instead of directly using argmax layer [27], to prevent message vanishing and booming, we add Gaussian noise on for and obtain the following likelihood function which is product of probit function mentioned in [28]:
| (7) |
where we approximate as independent to simplify the message passing as will be detailed in Appendix -A2. Extensive simulations verify that such an approximation can achieve a good classification performance. Besides, we define , where represents the cumulative distribution function of the standardized normal random variable.
III EM-TDAMP Algorithm Derivation
III-A Bayesian deep learning framework based on EM
To accelerate convergence, we update hyperparameters in the prior distribution and the likelihood function based on EM algorithm [29], where the expectation step (E-step) computes the posterior distribution (4) by performing turbo deep approximate message passing (TDAMP) as will be detailed in Subsection III-B, while the maximization step (M-step) updates hyperparameters and by maximizing the expectation (8) taken w.r.t. the posterior distributions and as will be detailed in Subsection III-C.
| (8) |
III-B E-step (TDAMP Algorithm)
To compute the expectation in (8), the E-step performs TDAMP to compute the global posterior distribution and with prior distribution and the likelihood function . In order to accelerate convergence for large datasets , we divide into minibatches, and for , we define with . In the following, we first elaborate the TDAMP algorithm to compute the posterior distributions for each minibatch . Then we present the PasP rule to update the prior distribution .
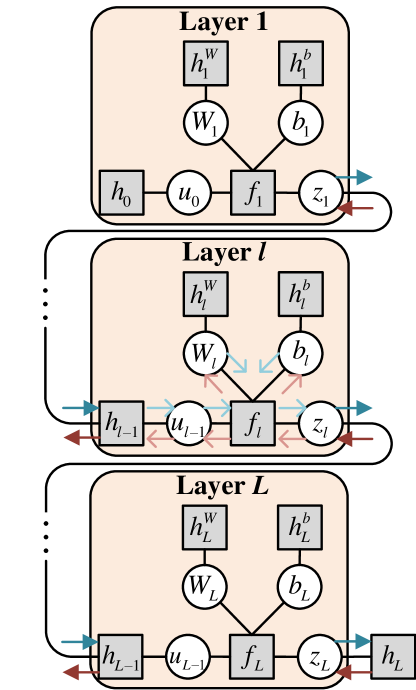
III-B1 Top-Level Factor Graph
The joint PDF associated with minibatch can be factorized as follows:
| (9) |
where for , we denote by , and thus:
Based on (9), the detailed structure of is illustrated in Fig. 2, where the superscript/subscript is omitted for conciseness because there is no ambiguity.
| Factor | Distribution | Functional form |
|---|---|---|
Each iteration of the message passing procedure on the factor graph in Fig. 2 consists of a forward message passing from the first layer to the last layer, followed by a backward message passing from the last layer to the first layer. However, the standard sum-product rule is infeasible on the DNN factor graph due to the high complexity. We propose DAMP to reduce complexity as will be detailed in Subsection III-B3. DAMP requires the prior distribution to be independent, so we follow turbo approach [25] to decouple the factor graph into Module and Module to compute messages with independent prior distribution and deal with group sparse prior separately. Notice that turbo framework we utilize is the same as EP [44, 43, 50] in most inference problems as illustrated in [49]. However, in this article, the two frameworks are not equivalent because EP needs to project the posterior distribution and extrinsic messages as Gaussian, while we apply standard sum-product rule in Module without projection. As such, the turbo framework can achieve slightly better performance than EP for the problem considered in this paper.
III-B2 Turbo Framework to Deal with Group Sparse Prior
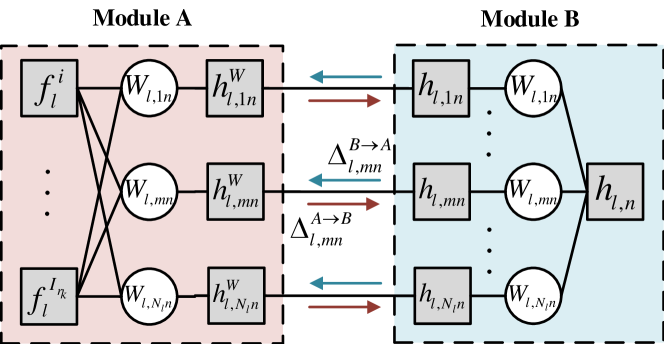
To achieve neuron-level pruning, each weight group is a column in weight matrix as discussed in Subsection II-B1. Specifically, we denote the -th column in by , where , and the corresponding factor graph is shown in Fig. 3. The TDAMP algorithm iterates between two Modules and . Module consists of factor nodes that connect the weight parameters with the observation model, weight parameters , and factor nodes that represent the extrinsic messages from Module denoted as . Module consists of factor node that represents the group sparse prior distribution, parameters , and factor nodes that represent the extrinsic messages from Module denoted as . Module updates the messages by performing DAMP algorithm with observations and independent prior distribution from Module . Module updates the independent prior distributions for Module by performing sum-product message passing (SPMP) algorithm over the group sparse prior. In the following, we elaborate Module and Module .
III-B3 DAMP in Module
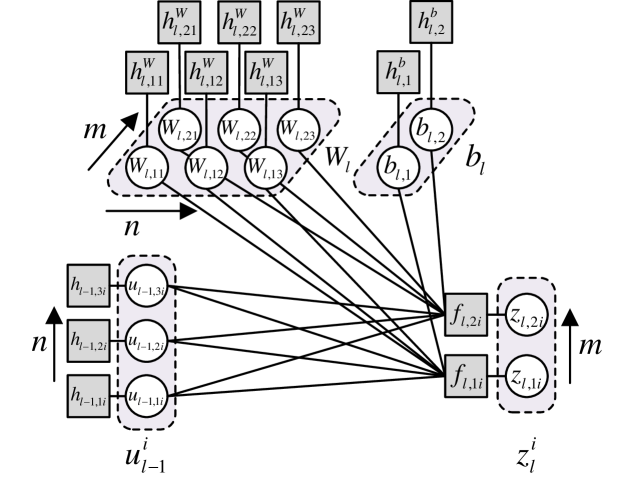
We compute the approximated marginal posterior distributions by performing DAMP. Based on turbo approach, in Module , for , the prior factor nodes for weight matrices represent messages extracted from Module :
The factor graph for the -th layer in is shown in Fig. 4, where and represent the -th element in and -th element in , respectively.
| Factor | Distribution | Functional form |
|---|---|---|
In the proposed DAMP, the messages between layers are updated in turn. For convenience, in the following, we denote by the message from node to , and by the marginal log-posterior computed at variable node .
In forward message passing, layer output messages with input messages :
and for ,
In backward message passing, layer output messages with input messages :
and for ,
Notice that the factor graph of a layer as illustrated in Fig. 4 has a similar structure to the bilinear model discussed in [31]. Therefore, we follow the general idea of the BiG-AMP framework in [31] to approximate the messages within each layer. The detailed derivation is presented in the supplementary file of this paper, and the schedule of approximated messages is summarized in Algorithm 1. In particular, the messages are related to nonlinear steps, which will be detailed in Appendix -A.
III-B4 SPMP in Module
Module further exploits the structured sparsity to achieve structured model compression by performing the SPMP algorithm. Note that Module has a tree structure, and thus the SPMP is exact. For , the input factor nodes for Module are defined as output messages in Module :
Based on SPMP, we give the updating rule (10) for the output message as follows:
| (10) |
where
The posterior distribution for is given by (11), which will be used in Subsection III-B5 to update the prior distribution.
| (11) |
where
III-B5 PasP Rule to Update Prior Distribution
To accelerate convergence and fuse the information among minibatches, we update the joint prior distribution after processing each minibatch. Specifically, after updating the joint posterior distribution based on the -th batch, we set the prior distribution as the posterior distribution. The mechanism is called PasP (12) mentioned in [27]:
| (12) |
where the posterior distributions for biases are computed through DAMP in Module , while the posterior distributions for weights are computed through (11) in Module . By doing so, the information from the all the previous minibatches are incorporated in the updated prior distribution. In practice, plays a role similar to the learning rate in SGD and is typically set close to 1 [27]. For convenience, we fix in simulations.
III-C M-step
In the M-step, we update hyperparameters and in the prior distribution and the likelihood function by maximizing and respectively, where the expectation is computed based on the results of the E-step as discussed above.
Updating rules for prior hyperparameter
We observe that the posterior distribution computed through TDAMP can be factorized in the same form as , thus maximizing is equivalent to update as the corresponding parameters in . However, directly updating the prior sparsity parameters s based on EM cannot achieve neuron-level pruning with the target sparsity . It is also not a good practice to fix throughout the iterations because this usually slows down the convergence speed as observed in the simulations. In order to control the network sparsity and prune the network during training without affecting the convergence, we introduce the following modified updating rules for s. Specifically, after each M-step, we calculate , which represents the number of weight groups that are highly likely to be active, i.e.,
where is certain threshold that is set close to 1. If exceeds the target number of neurons , we reset s as follows:
where is the initial sparsity. Extensive simulations have shown that this method works well.
Updating rules for noise variance
We take regression model and classification model as examples to derive the updating rule for .
For regression model (6), by setting the derivative for w.r.t. equal to zero, we obtain:
| (13) |
Then can be approximated as follows:
| (15) |
where we approximate as a Gumbel distribution with location parameter and scale parameter . Based on moment matching, we estimate and as follows:
where is Euler’s constant, and we define using (14) as follows:
| (16) |
The effectiveness of this approximation will be justified in Fig. 8 and Fig. 9 in the simulation section. To solve the optimal based on (15), we define a special function
which can be calculated numerically and stored in a table for practical implementation. Then the optimal is given by
Considering the error introduced by the above approximation, we use the damping technique [31] with damping factor 0.5 to smooth the update of in experiments:
| (17) |
Compared to numerical solution for , the proposed method greatly reduces complexity. Experiments show that the method is stable as will be detailed in Subsection V-B.
III-D Summary of the EM-TDAMP Algorithm
To sum up, the proposed EM-TDAMP algorithm is implemented as Algorithm 1, where represents maximum iteration number.
Input: dataset .
Output:
Initialization: Hyperparameters , ,
,
, .
IV Extension of EM-TDAMP to Federated Learning Scenarios
IV-A Outline of Bayesian Federated Learning (BFL) Framework
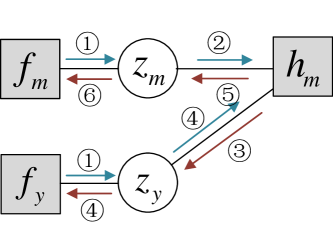
In this Section, we consider a general federated/distributed learning scenario, which includes centralized learning as a special case. There is a central server and clients, where each client possesses a subset of data (local data sets) indexed by : with , and . The process of the proposed BFL framework contains three steps as illustrated in Fig. 5. Firstly, the central server sends the prior hyperparameters and the likelihood hyperparameter (i.e., noise variance) to clients to initialize local prior distribution and likelihood function , where represents the output corresponding to the local data . Afterwards, the clients parallelly compute local posterior distributions and by performing turbo deep approximate message passing (TDAMP) as detailed in Subsection III-B and extract local posterior parameters and for uplink communication. Lastly, the central server aggregates local posterior parameters to update hyperparameters and by maximizing the expectation in (8) as will be detailed in Subsection IV-B, where we define local posterior parameters and approximate as function of .
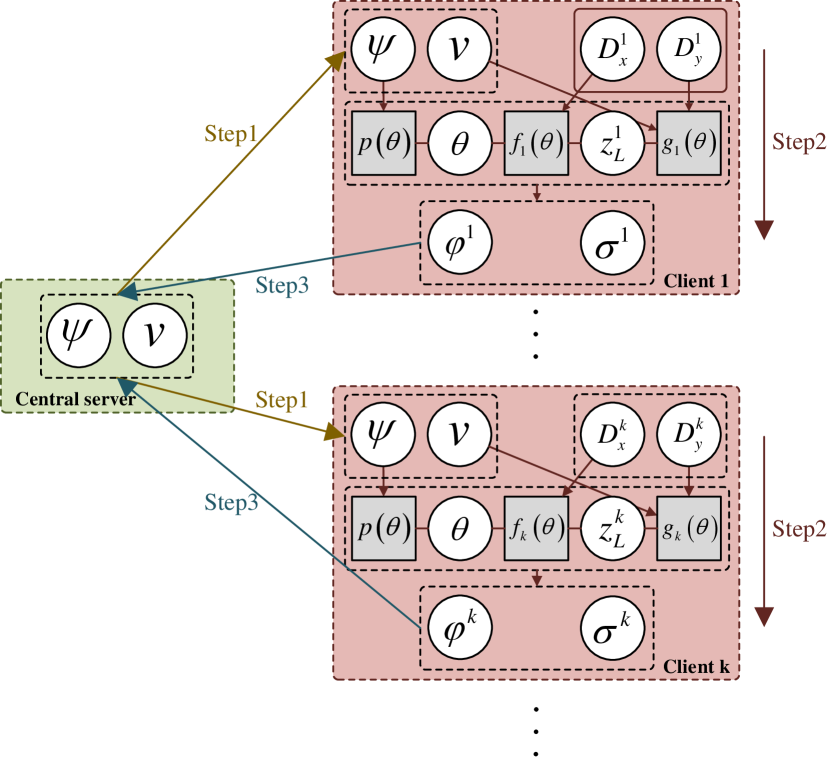
IV-B Updating Rules At the Central Server
In the proposed EM-based BFL framework, the central server computes the global posterior distributions and by aggregating the local posterior distributions in the E-step, and update the hyperparameters by maximizing the objective function (8) in the M-step. The specific aggregation mechanism and updating rules are elaborated as follows:
IV-B1 Aggregation Mechanism for and
Aggregation Mechanism for
We approximate as the weighted geometric average of local posterior distributions [40]:
| (18) |
where .
The proposed weighted geometric average of in (18) is more likely to approach the global optimal posterior distribution compared to the widely used weighted algebraic average (19):
| (19) |
For easy illustration of this point, we consider a special case when all the local posterior distributions are Gaussian (note that Gaussian is a special case of the Bernoulli-Gaussian). The posterior distribution aggregated through weighted geometric average (WGA) (18) is still Gaussian, whose expectation is the average of local posterior expectations weighted by the corresponding variances as in (20), while the posterior distribution aggregated through weighted algebraic average (WAA) (19) is Gaussian mixture, whose expectation is simple average of local posterior expectations as in (21). Therefore, WGA is more reliable compared with WAA because it utilizes the local variances for posterior expectation aggregation, which is consistent with the experiment results in [40].
| (20) |
| (21) |
The WGA based aggregation in (18) can also be explained from a loss function perspective. In Bayesian learning, we estimate parameters based on MAP, which can also be interpreted as minimizing a loss function if we define as negative log-posterior :
Note that in (2) and in (3) are special cases of . Specifically, after setting as , if we set as uniform distribution (i.e., is constant), becomes , while if we set as Laplace distribution (i.e., ) with , becomes . Therefore, can be seen as a loss function in Bayesian learning algorithms.
In federated learning algorithms, the global loss function is normally formulated as weighted sum of loss functions at clients, i.e. (22) as used in [40]:
| (22) |
where negative log-posterior loss function is used in Bayesian framework. The loss function aggregation in (22) is equivalent to the weighted geometric average aggregation mechanism in (18), which provides another justification for WGA.
The specific derivation for parameters in according to (18) is detailed in the supplementary file.
Aggregation Mechanism for
We assume are independent and approximate as
| (23) |
which is reasonable since is mainly determined by the -th local data set that is independent of the other local data sets . The local posterior distribution is the output of DAMP, which is approximated as the product of Gaussian marginal posterior distributions (24):
| (24) |
as detailed in the supplementary file. By plugging (24) into (23), we achieve the global posterior distribution for .
IV-B2 Updating Rules for and
Updating Rules for
As detailed in the supplementary file, the aggregated global posterior distribution can be factorized in the same form as , thus maximizing is equivalent to update as the corresponding parameters in . In the supplementary file, we define as local posterior parameters for uplink communication and give the function of w.r.t. .
Updating Rules for
In federated learning, based on (23), the expectation can be written as:
where the expectation is w.r.t. (23), which can be computed based on local posterior distributions (24). In practice, for , the maximum point w.r.t. can be expressed as a function of local posterior parameters. This means that the clients only need to send a few posterior parameters denoted as instead of the posterior distributions to the central server. In the following, we take regression model and classification model as examples to derive the updating rule for and define parameters at client to compress parameters in uplink communication.
IV-C Summary of the Entire Bayesian Federated Learning Algorithm
The entire EM-TDAMP Bayesian federated learning algorithm is summarized in Algorithm 2, where represents maximum communication rounds.
Input: Training set .
Output: .
V Performance Evaluation
In this section, we evaluate the performance of the proposed EM-TDAMP through simulations. We consider two commonly used application scenarios with datasets available online: the Boston house price prediction and handwriting recognition, which were selected to evaluate the performance of our algorithm in dealing with regression and classification problems, respectively.
We consider group sparse prior and compare to three baseline algorithms: AMP in [27] (Due to the message passing algorithms in [27] showing similar performance, we only add the AMP based training algorithm into comparison in the experiments), standard SGD, SGD with group sparse regularizer [13] and group SNIP (for fair comparison, we extend SNIP [32] to prune neurons). For convenience, we use Adam optimizer [7] for SGD-based baseline algorithms. We set damping factor , and utilize a random Boolean mask for pruning as in [27].
Two cases are considered in the simulations. Firstly, we consider centralized learning case to compare the EM-TDAMP with AMP in [27] and SGD-based algorithms. Furthermore, we consider federated learning case to prove the superiority of the aggregation mechanism mentioned in Subsection IV-B1, compared to SGD-based baseline algorithms with widely-used FedAvg algorithm [8] for aggregation.
Before presenting the simulation results, we briefly compare the complexity. Here we neglect element-wise operations and only consider multiplications in matrix multiplications, which occupy the main running time in both SGD-based algorithms and the proposed EM-TDAMP algorithm. It can be shown that both SGD and EM-TDAMP require multiplications per iteration, and thus they have similar complexity orders.
In the following simulations, we will focus on comparing the convergence speed and converged performance of the algorithms. Specifically, we will show loss on the test data during training process to evaluate the convergence speed (group SNIP becomes standard SGD when , and thus we set to show the training process) and also show the converged performance under varying sparsity/pruning ratios to compare the proposed algorithm with baseline algorithms comprehensively. To achieve the target group sparsity for baseline algorithms, we need to manually prune the parameter groups based on energy after training [7]. When calculating the loss (NMSE for regression model and error for classification model) on test data for the proposed EM-TDAMP, we fix the parameters as posterior expectations (i.e., we use MMSE point estimate for the parameters). Each result is averaged on 10 experiments.
V-A Description of Models
V-A1 Boston Housing Price Prediction
For regression model, we train a DNN based on Boston housing price dataset. The training set consists of 404 past housing price, each associated with 13 relative indexes for prediction. For convenience, we set the batchsize as 101 in the following simulations. The test dataset contains 102 data. We set the architecture as follows: the network comprises three layers, including two hidden layers, each with 64 output neurons and ReLU activation, and an output layer with one output neuron. Before training, we normalize the data for stability. We evaluate the prediction performance using the normalized mean square error (NMSE) as the criterion.
V-A2 Handwriting Recognition
For classification model, we train a DNN based on MNIST dataset, which is widely used in machine learning for handwriting digit recognition. The training set consists of 60,000 individual handwritten digits collected from postal codes, with each digit labeled from 0 to 9. The images are grayscale and represented as pixels. In our experiments, we set the batch size as 100. The test set consists of 10,000 digits. Before training, each digit is converted into a column vector and divided by the maximum value of 255. We use a two-layer network, where the first layer has 128 output neurons and a ReLU activation function, while the second layer has 10 output neurons. After that, there is a softmax activation function for the baseline algorithms and Probit-product likelihood function for the proposed algorithm. We will use the error on test data to evaluate the performance.
V-B Simulation Results
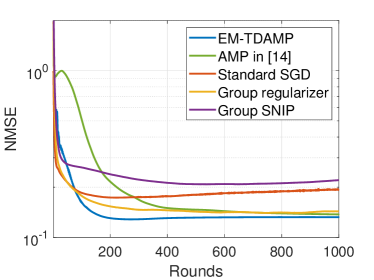
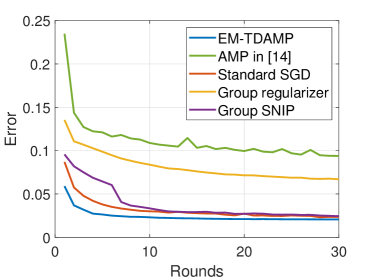
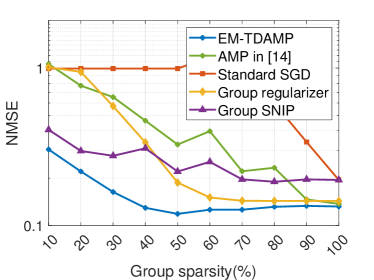
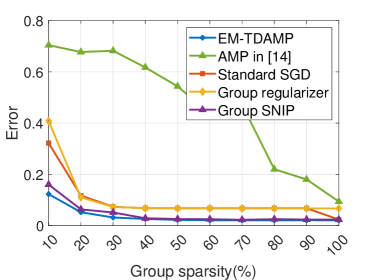
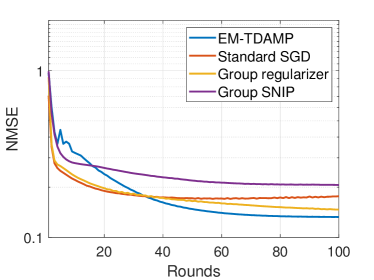
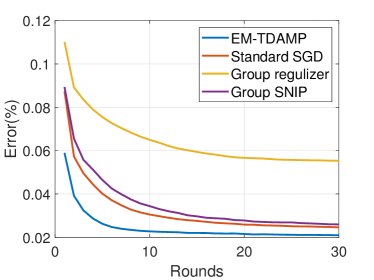
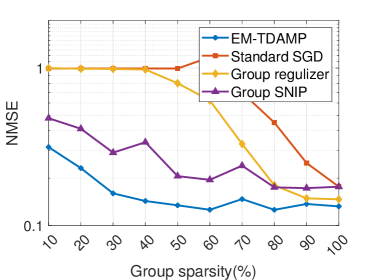
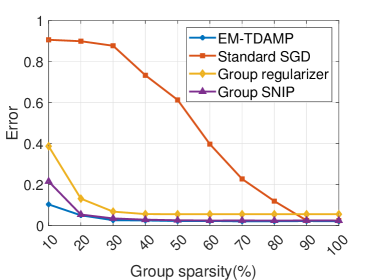
We start by evaluating the performance of EM-TDAMP in a centralized learning scenario. The training curves and test loss-sparsity curves for both regression and classification models are depicted in Fig. 6 and Fig. 7. Fig. 6 shows the training curve of the proposed EM-TDAMP and baselines, where we set , i.e. Gaussian prior (Bernoulli-Gaussian prior in (5) becomes Gaussian when ) for EM-TDAMP. The results show the proposed EM-TDAMP achieves faster training speed and also the best performance after enough rounds compared to Adam and AMP in [27]. There are two main reasons. First, compared to Adam, message passing procedure updates variance of the parameters during iterations, which makes inference more accurate after same rounds, leading to faster convergence. Second, the noise variance can be automatically learned based on EM algorithm, which can adaptively control the learning rate and avoid manually tuning of parameters like Adam. AMP in [27] does not design flexible updating rules for noise variance during iterations and sets a fixed damping factor to control the learning rate, leading to numerical instability and slow convergence in experiments. Fig. 7 shows the test loss of the algorithms at different sparsity, where sparsity refers to the ratio of neurons remain. From the results at (on the right edge of the figures) we can see EM-TDAMP with Gaussian prior performs better than AMP in [27] and Adam after convergence when pruning is not considered, which is consistent with the training curve in Fig. 6. Then, as the compression ratio becomes higher (from right points to left points), the performance gap between EM-TDAMP and baselines becomes larger, because the proposed EM-TDAMP prunes the groups based on sparsity during training, which is more efficient than baseline methods that prune based on energy or gradients.
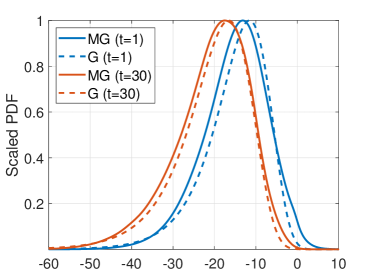
Next, we verify the efficiency of the updating rule for noise variance in classification model discussed in Subsection III-C. The Gumbel approximation (15) is illustrated in Fig. 8, where we compare the distributions when and . Since scaling will not affect the solution for noise variance (15), we scale the distributions to set the maximum as 1 and only compare the shapes. We observe that both distributions have similar skewed shapes.
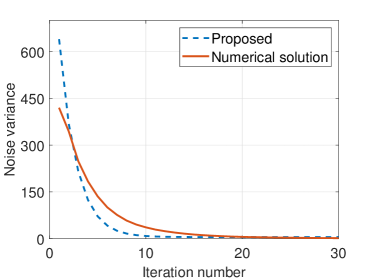
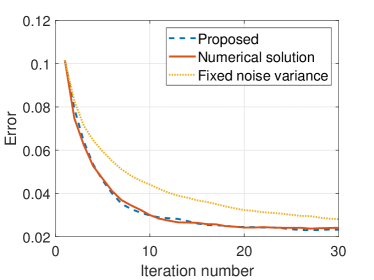
Furthermore, in Fig. 9, we compare the training performance achieved by different noise variance updating methods, where we set a large initialization to enhance the comparison during iterations. From Fig. 9a, we observe that the proposed updating rule is stable and can update noise variance similar to the numerical solution. Fig. 9b shows the proposed method achieves comparable training speed to the numerical solution, and both outperform the fixed noise variance case.
In the subsequent experiments, we consider federated learning cases to evaluate the aggregation mechanism. For convenience, we allocate an equal amount of data to each client, i.e., for . In Boston housing price prediction and handwriting recognition tasks, we set and , respectively. To reduce communication rounds, we set in both cases ( refers to the number of TDAMP inner iterations with fixed hyperparameters at each client in each round). The training curves and test loss-sparsity curves are shown in Fig. 10 and Fig. 11, respectively. Similar to the previous results, EM-TDAMP performs best among the algorithms, which proves the efficiency of the proposed aggregation method.
VI Conclusions
In this work, we propose an EM-TDAMP algorithm to achieve efficient Bayesian deep learning and compression, and extend EM-TDAMP to federated learning scenarios. In problem formulation, we propose a group sparse prior to promote neuron-level compression and introduce Gaussian noise at output to prevent numerical instability. Then, we propose a novel Bayesian deep learning framework based on EM and approximate message passing. In the E-step, we compute the posterior distribution by performing TDAMP, which consists of a Module to deal with group sparse prior distribution, a Module to enable efficient approximate message passing over DNN, and a PasP method to automatically tune the local prior distribution. In the M-step, we update hyperparameters to accelerate convergence. Moreover, we extend the proposed EM-TDAMP to federated learning scenarios and propose a novel Bayesian federated learning framework, where the clients compute the local posterior distributions via TDAMP, while the central server computes the global posterior distribution through aggregation and updates hyperparameters via EM. Simulations show that the proposed EM-TDAMP can achieve faster convergence speed and better training performance compared to well-known structured pruning methods with Adam optimizer and the existing multilayer AMP algorithms in [27], especially when the compression ratio is high. Besides, the proposed EM-TDAMP can greatly reduce communication rounds in federated learning scenarios, making it attractive to practical applications. In the future, we will apply the proposed EM-TDAMP framework to design better training algorithms for more general DNNs, such as those with convolutional layers.
-A Nonlinear Steps
In this section, we mainly discuss the updating rules of when related to nonlinear factors. Here we only provide the derivation for the messages, while the specific updating rules for expectation and variance will be detailed in the supplementary file.
-A1 ReLU Activation Function
ReLU is an element-wise function defined as (1). In this part, we give the updating rules for posterior messages of and for when is ReLU. Based on sum-product rule, we obtain:
where for convenience, we omit the subscript and define as step function.
-A2 Probit-product Likelihood Function
Here, we briefly introduce the message passing related to output for in classification model. The factor graph of Probit-product likelihood function (7) is given in Fig. 12, where we omit for simplicity.
Firstly, to deal with for , we define
where is a skew-normal distribution, and will be approximated as Gaussian based on moment matching. Then,
is also approximated as logarithm of Gaussian. Next, based on sum-product rule, we obtain:
At last, for , we approximate
as logarithm of Gaussian based on moment matching again.
References
- [1] T. Li, A. K. Sahu, A. Talwalkar, and V. Smith, “Federated learning: Challenges, methods, and future directions,” IEEE Signal Processing Magazine, vol. 37, no. 3, pp. 50–60, 2020.
- [2] W. Oh and G. N. Nadkarni, “Federated learning in health care using structured medical data,” Advances in Kidney Disease and Health, vol. 30, no. 1, pp. 4–16.
- [3] A. Nguyen, T. Do, M. Tran, B. X. Nguyen, C. Duong, T. Phan, E. Tjiputra, and Q. D. Tran, “Deep federated learning for autonomous driving,” in 2022 IEEE Intelligent Vehicles Symposium (IV), pp. 1824–1830.
- [4] G. Ananthanarayanan, P. Bahl, P. BodÃk, K. Chintalapudi, M. Philipose, L. Ravindranath, and S. Sinha, “Real-time video analytics: The killer app for edge computing,” Computer, vol. 50, no. 10, pp. 58–67.
- [5] W. Y. B. Lim, N. C. Luong, D. T. Hoang, Y. Jiao, Y.-C. Liang, Q. Yang, D. Niyato, and C. Miao, “Federated learning in mobile edge networks: A comprehensive survey,” IEEE Communications Surveys & Tutorials, vol. 22, no. 3, pp. 2031–2063.
- [6] S. Ruder, “An overview of gradient descent optimization algorithms,” CoRR, vol. abs/1609.04747, 2016.
- [7] D. P. Kingma and J. Ba, “Adam: A method for stochastic optimization,” in 3rd International Conference on Learning Representations, ICLR 2015, San Diego, CA, USA, May 7-9, 2015, Conference Track Proceedings, 2015.
- [8] B. McMahan, E. Moore, D. Ramage, S. Hampson, and B. A. y Arcas, “Communication-efficient learning of deep networks from decentralized data,” in Proceedings of the 20th International Conference on Artificial Intelligence and Statistics, AISTATS 2017, 20-22 April 2017, Fort Lauderdale, FL, USA, ser. Proceedings of Machine Learning Research, vol. 54. PMLR, 2017, pp. 1273–1282.
- [9] B. Hanin, “Which neural net architectures give rise to exploding and vanishing gradients?” in Advances in Neural Information Processing Systems, vol. 31, 2018.
- [10] S. Hochreiter, “The vanishing gradient problem during learning recurrent neural nets and problem solutions,” Int. J. Uncertain. Fuzziness Knowl. Based Syst., vol. 6, no. 2, pp. 107–116, 1998.
- [11] A. Choromanska, M. Henaff, M. Mathieu, G. B. Arous, and Y. LeCun, “The loss surfaces of multilayer networks,” in Proceedings of the Eighteenth International Conference on Artificial Intelligence and Statistics, AISTATS 2015, San Diego, California, USA, May 9-12, 2015, vol. 38.
- [12] M. Yuan and Y. Lin, “Model selection and estimation in regression with grouped variables,” Journal of the Royal Statistical Society: Series B (Statistical Methodology), vol. 68, no. 1, pp. 49–67, Feb. 2006.
- [13] S. Scardapane, D. Comminiello, A. Hussain, and A. Uncini, “Group sparse regularization for deep neural networks,” Neurocomputing, vol. 241, pp. 81–89, Jun. 2017.
- [14] S. Kim and E. P. Xing, “Tree-guided group lasso for multi-response regression with structured sparsity, with an application to eqtl mapping,” The Annals of Applied Statistics, vol. 6, no. 3, pp. 1095–1117.
- [15] K. Mitsuno, J. Miyao, and T. Kurita, “Hierarchical group sparse regularization for deep convolutional neural networks,” 2020 International Joint Conference on Neural Networks (IJCNN), pp. 1–8, 2020.
- [16] G. Litjens, T. Kooi, B. E. Bejnordi, A. A. A. Setio, F. Ciompi, M. Ghafoorian, J. A. W. M. van der Laak, B. van Ginneken, and C. I. Sánchez, “A survey on deep learning in medical image analysis,” Medical Image Analysis, vol. 42, pp. 60–88, Dec. 2017.
- [17] J. Kocic, N. S. Jovicic, and V. Drndarevic, “An end-to-end deep neural network for autonomous driving designed for embedded automotive platforms,” Sensors, vol. 19, no. 9, p. 2064, 2019.
- [18] X. Jiang, M. Osl, J. Kim, and L. Ohno-Machado, “Calibrating predictive model estimates to support personalized medicine,” Journal of the American Medical Informatics Association: JAMIA, vol. 19, no. 2, pp. 263–274, 2012.
- [19] H. Wang and D. Yeung, “A survey on bayesian deep learning,” ACM Comput. Surv., vol. 53, no. 5, pp. 108:1–108:37, 2021.
- [20] J. L. Puga, M. Krzywinski, and N. Altman, “Bayesian networks,” Nature Methods, vol. 12, no. 9, pp. 799–800, Sep. 2015.
- [21] J. T. Springenberg, A. Klein, S. Falkner, and F. Hutter, “Bayesian optimization with robust bayesian neural networks,” in Advances in Neural Information Processing Systems, vol. 29, 2016.
- [22] T. M. Fragoso and F. L. Neto, “Bayesian model averaging: A systematic review and conceptual classification,” International Statistical Review, vol. 86, no. 1, pp. 1–28, Apr. 2018.
- [23] M. Rani, S. B. Dhok, and R. B. Deshmukh, “A systematic review of compressive sensing: Concepts, implementations and applications,” IEEE Access, vol. 6, pp. 4875–4894, 2018.
- [24] A. Montanari, Graphical models concepts in compressed sensing. Cambridge University Press, 2012, pp. 394–438.
- [25] J. Ma, X. Yuan, and L. Ping, “Turbo compressed sensing with partial dft sensing matrix,” IEEE Signal Processing Letters, vol. 22, no. 2, pp. 158–161, 2015.
- [26] P. Simard, D. Steinkraus, and J. Platt, “Best practices for convolutional neural networks applied to visual document analysis,” in Seventh International Conference on Document Analysis and Recognition, 2003. Proceedings., Aug. 2003, pp. 958–963.
- [27] C. Lucibello, F. Pittorino, G. Perugini, and R. Zecchina, “Deep learning via message passing algorithms based on belief propagation,” Machine Learning: Science and Technology, vol. 3, no. 3, p. 035005, Sep. 2022.
- [28] P. McCullagh, “Generalized linear models,” European Journal of Operational Research, vol. 16, no. 3, pp. 285–292, Jun. 1984.
- [29] T. Moon, “The expectation-maximization algorithm,” IEEE Signal Processing Magazine, vol. 13, no. 6, pp. 47–60, 1996.
- [30] L. Liu and F. Zheng, “A bayesian federated learning framework with multivariate gaussian product,” CoRR, vol. abs/2102.01936, 2021.
- [31] J. T. Parker, P. Schniter, and V. Cevher, “Bilinear generalized approximate message passing—part i: Derivation,” IEEE Transactions on Signal Processing, vol. 62, no. 22, pp. 5839–5853, Nov. 2014.
- [32] N. Lee, T. Ajanthan, and P. H. S. Torr, “Snip: single-shot network pruning based on connection sensitivity,” in 7th International Conference on Learning Representations, ICLR 2019, New Orleans, LA, USA, May 6-9, 2019, 2019.
- [33] A. A. Abdullah, M. M. Hassan, and Y. T. Mustafa, “A review on bayesian deep learning in healthcare: Applications and challenges,” IEEE Access, vol. 10, pp. 36 538–36 562, 2022.
- [34] X. Bai and Q. Peng, “A probabilistic model based-tracking method for mmwave massive MIMO channel estimation,” IEEE Trans. Veh. Technol., vol. 72, no. 12, pp. 16 777–16 782, Dec. 2023.
- [35] C. Briggs, Z. Fan, and P. Andras, “Federated learning with hierarchical clustering of local updates to improve training on non-iid data,” in 2020 International Joint Conference on Neural Networks (IJCNN), Jul. 2020, pp. 1–9.
- [36] L. V. Jospin, H. Laga, F. Boussaid, W. Buntine, and M. Bennamoun, “Hands-on bayesian neural networks—a tutorial for deep learning users,” IEEE Comput. Intell. Mag., vol. 17, no. 2, pp. 29–48, May 2022.
- [37] P. Kairouz, H. B. McMahan, B. Avent et al., “Advances and open problems in federated learning,” Found. Trends Mach. Learn., vol. 14, no. 1-2, pp. 1–210, 2021.
- [38] S. Kuutti, R. Bowden, Y. Jin, P. Barber, and S. Fallah, “A survey of deep learning applications to autonomous vehicle control,” IEEE Trans. Intell. Transp. Syst., vol. 22, no. 2, pp. 712–733, Feb. 2021.
- [39] T. Li, A. K. Sahu, M. Zaheer, M. Sanjabi, A. Talwalkar, and V. Smith, “Federated optimization in heterogeneous networks,” Proceedings of Machine Learning and Systems, vol. 2, pp. 429–450, Mar. 2020.
- [40] L. Liu, X. Jiang, F. Zheng, H. Chen, G.-J. Qi, H. Huang, and L. Shao, “A bayesian federated learning framework with online laplace approximation,” IEEE Trans. Pattern Anal. Mach. Intell., vol. 46, no. 1, pp. 1–16, Jan. 2024.
- [41] ——, “A bayesian federated learning framework with online laplace approximation,” IEEE Trans. Pattern Anal. Mach. Intell., vol. 46, no. 1, pp. 1–16, Jan. 2024.
- [42] M. Magris and A. Iosifidis, “Bayesian learning for neural networks: An algorithmic survey,” Artif. Intell. Rev., vol. 56, no. 10, pp. 11 773–11 823, Oct. 2023.
- [43] X. Meng and J. Zhu, “Bilinear adaptive generalized vector approximate message passing,” IEEE Access, vol. 7, pp. 4807–4815, 2019.
- [44] X. Meng, S. Wu, and J. Zhu, “A unified bayesian inference framework for generalized linear models,” IEEE Signal Process. Lett., vol. 25, no. 3, pp. 398–402, Mar. 2018.
- [45] M. Rashid and M. Naraghi-Pour, “Clustered sparse channel estimation for massive MIMO systems by expectation maximization-propagation (EM-EP),” IEEE Trans. Veh. Technol., vol. 72, no. 7, pp. 9145–9159, Jul. 2023.
- [46] S. Ray and B. Lindsay, “The topography of multivariate normal mixtures,” The Annals of Statistics, vol. 33, Mar. 2006.
- [47] D. Wang, F. Weiping, Q. Song, and J. Zhou, “Potential risk assessment for safe driving of autonomous vehicles under occluded vision,” Scientific Reports, vol. 12, Mar. 2022.
- [48] C. Zheng, S. Liu, Y. Huang, W. Zhang, and L. Yang, “Unsupervised recurrent federated learning for edge popularity prediction in privacy-preserving mobile-edge computing networks,” IEEE Internet Things J., vol. 9, no. 23, pp. 24 328–24 345, Dec. 2022.
- [49] J. Zhu, “A comment on the "a unified bayesian inference framework for generalized linear models",” Apr. 2019.
- [50] J. Zhu, C.-K. Wen, J. Tong, C. Xu, and S. Jin, “Grid-less variational bayesian channel estimation for antenna array systems with low resolution adcs,” IEEE Trans. Wirel. Commun., vol. 19, no. 3, pp. 1549–1562, Mar. 2020.
- [51] J. Ziniel, P. Schniter, and P. Sederberg, “Binary linear classification and feature selection via generalized approximate message passing,” IEEE Trans. Signal Process., vol. 63, no. 8, pp. 2020–2032, Apr. 2015.
- [52] Q. Zou, H. Zhang, and H. Yang, “Multi-layer bilinear generalized approximate message passing,” IEEE Trans. Signal Process., vol. 69, pp. 4529–4543, 2021.