Bayesian inversion for the filtered flow at the Earth’s Core Mantle Boundary
Abstract
The inverse problem which consists of determining the flow at the Earth’s Core Mantle Boundary according to an outer core magnetic field and secular variation model, has been investigated through a Bayesian formalism. To circumvent the issue arising from the truncated nature of the available fields, we combined two modelization methods. In the first step, we applied a filter on the magnetic field to isolate its large scales by reducing the energy contained in its small scales, we then derived the dynamical equation, referred as filtered frozen flux equation, describing the spatio-temporal evolution of the filtered part of the field. In the second step, we proposed a statistical parametrization of the filtered magnetic field in order to account for both its remaining unresolved scales and its large scale uncertainties. These two modelization techniques were then included in the Bayesian formulation of the inverse problem. To explore the complex posterior distribution of the velocity field resulting from this development, we numerically implemented an algorithm based on Markov Chain Monte Carlo methods. After evaluating our approach on synthetic data and comparing it to previously introduced methods, we applied it on real data for the single epoch .
I Introduction
The core magnetic field (MF) of the Earth is sustained by the dynamo action taking place in its outer core. Here, the variations in chemical composition and in temperature of the liquid metal allows convection to develop. Since the fluid is electrically conducting, it interacts non-linearly with the magnetic field. While the flow is advecting the MF, this latter is constraining the fluid motions through the Lorentz forces. The evolution of the fluid velocity field (VF) and the magnetic field are therefore entirely connected to one another through energy exchanges between them.
Studying such a system is difficult in many aspects. From a numerical point of view, simulating directly the dynamic of the outer core is a challenging task. Because of the strong regime of turbulence that the magnetohydrodynamic (MHD) flow exhibits, the separation between the smallest and the largest scales of the system is extremely broad. Yet, to properly describe the evolution of both the VF and the MF, all these scales should be considered in simulations since they interact non-linearly together. But this is, with the actual computation power available, impossible.
From an experimental point of view, observing directly the evolution of the outer core is also impossible. Nevertheless, measurements of the MF from ground observatories or satellites may allow to indirectly infer some dynamical properties of the flow and the MF in the core. In particular, because of the low conductivity of the mantle (Velímský (2010)), a knowledge of the core MF at the Earth’s surface is sufficient to evaluate it at the level of the core-mantle boundary (CMB). At this very specific location, the MF is coupled to the outer core VF through the frozen flux equation (a simplified version of the induction equation introduced by Roberts and Scott (1965), and in which the diffusion effects are neglected). By inverting this equation it is therefore possible to evaluate the VF at the CMB. Unfortunately, the problem is ill-posed for different reasons. First, the two components of the velocity field are connected to the radial component of the secular variation (SV) through a unique equation. Then, the available secular variation given by MF models such as GRIMM 2 of Lesur et al. (2010) is only resolved at large scales whereas any scale of the velocity field can contribute to this resolved SV. Finally, as it is the case for the SV, only the large scale core MF can be determined at the Earth surface, yet interactions between the unknown small scale MF with the VF can generate large scale SV (see Eymin and Hulot (2005)).
As shown by Backus (1968), to resolve the non-uniqueness of the velocity field in this inverse problem, constraints have to be imposed to the flow behavior. Different formulations have been proposed over the past decades. This includes tangential-geostrophy, tangential-magnetostrophy, columnar flow, helical flow, or purely toroidal flow (see Holme (2007) and Finlay et al. (2010) for an exhaustive review of the different constraints usually applied and their physical implications). Nevertheless, these physical constraints are not sufficient to provide a unique flow solution (see Chulliat and Hulot (2000) and references therein), and additional regularization assumptions have to be introduced in the problem (see Holme (2007)).
Although identified for more than twenty years (Hulot et al. (1992)), it is only recently that the effects of the unknown small scale MF on the large scale SV have been modeled in the inversion of the Frozen Flux approximation. In particular two methods have given promising results, namely the ensemble approach of Gillet et al. (2009), and the iterative method of Pais and Jault (2008). The philosophy of these two approaches is quite distinct from one another. Whereas in the method of Gillet et al. (2009) an ensemble of magnetic field containing small scales is generated and directly used to evaluate an ensemble of velocity field, in the method of Pais and Jault (2008) the effects of the unknown magnetic field is transposed into a modeling error which is iteratively estimated. In this study, we propose a development of these approaches in the context of Bayesian modeling. The article is therefore constructed in the following manner.
In section II, after describing the principle of derivation of the Frozen Flux equation, we recall the issue raised in the inversion of this equation by the truncated nature of the available MF. We then describe how to isolate the large scales of the MF and present the approximated dynamical equation, referred as Filtered Frozen Flux (FFF) equation, which determines the evolution of these large scales. At the end of the section we present how to formulate the inverse problem in a Bayesian framework when variations of the MF around the prescribed one are allowed to occur. In section III tests on synthetic data are performed. In the first one, we evaluate the improvement brought by using the FFF equation in the inverse problem. In the second test, the Bayesian formalism developed in section II is considered to recover the velocity field from a set of artificially generated data, and the results are compared to the flow obtained with three other approaches. The methodology we developed is then used to determine the velocity field and its underlying uncertainties for the epoch . Finally we present our conclusions in section IV.
II Governing equations
II.1 The Frozen-Flux approximation
In this section we introduce briefly the hypothesis necessary to derive the Frozen Flux approximation. For a more detailed description see Holme (2007).
Outside the core, the geodynamo’s MF is irrotational, it can therefore be expressed through a potential according to the relation:
| (1) |
As mentioned previously, the low conductivity of the mantle (Velímský (2010)) allows to evaluate the MF and therefore its radial component at the level of the core mantle boundary. There its evolution is prescribed by the induction equation:
| (2) |
with the horizontal divergence operator, the two-dimensional velocity field, the magnetic diffusivity, and a radial unitary vector. Because for the Earth, on short period of time the dissipation effects are dominated by advection effects (see Holme (2007)) and since our study is limited to single epoch inversion, the fluid can be considered as a perfect conductor. Roberts and Scott (1965) showed that under this assumption, known as the Frozen Flux (FF) approximation, the induction equation can be simplified as:
| (3) |
II.2 The unresolved scale issue
To perform a consistent inversion of the Frozen-Flux equation at the CMB, in addition to imposing a certain behavior to the flow and to regularizing it (see Holme (2007); Finlay et al. (2010)), every scale composing the secular variation and the magnetic field have to be known. Unfortunately, in the actual models describing the spatio-temporal evolution of the Earth’s magnetic field derived from satellite and observatory data, the resolution of both the SV and the MF is limited. For the GRIMM 2 model of Lesur et al. (2010), for example, the fields do not excess the degree when expanded in spherical harmonics. So if corresponds to the spherical harmonics (SH) coefficient at degree and order associated with the scalar potential , such as:
| (4) |
where is the core radius, and is the Schmidt semi-normalized SH, then according to equation (1), the available MF , and its unknown part are respectively given by:
| (5) | |||||
| (6) |
with the cut-off scale (which is equal to for the MF provided by the GRIMM 2 model). Note that the total radial component of the MF corresponds to the sum of these two quantities.
To account for the truncated nature of the available MF and SV, the Frozen Flux approximation has to be rewritten as:
| (7) | |||||
| (8) |
where the advection term, on the right hand side of equation (8), is decomposed into two parts, one depending on the resolved magnetic field and the other function of the undetermined field. Hulot et al. (1992) were the first to highlight the issue raised by the unknown part of the MF in the inversion of the FF equation. Nevertheless, because at this epoch the uncertainties on SV measurements were large, the contribution of the term could be neglected in the inverse problem. The recent increase in quality of both the measurements and models describing the evolution of the core MF (see Hulot et al. (2002)) invalidate this latter statement, and Eymin and Hulot (2005) showed that the unresolved part of the MF could not be neglected anymore.
II.3 Parametrization of the unresolved magnetic field
To model the effects of the unresolved part of the magnetic field on the large scale secular variation, assumptions on this unknown field behavior have to be made. In particular one can prescribe to it a certain energy spectrum. This operation can be performed, for instance, by extrapolating the spectrum associated with the resolved scales which is defined by:
| (9) |
The resulting spectrum can then be used to statistically model the unknown MF . Following the development of Hulot et al. (1992) where the field is assumed to be isotropically distributed, the covariance of the coefficients is directly proportional to the extrapolated spectrum through the relation:
| (10) |
where corresponds to the mathematical expectation.
The issue with such a modelization is that no universal spectrum of the geodynamo’s MF at the core mantle boundary is available. Nevertheless, different formulations have been proposed over the past decades, but unfortunately most of them strongly differ from one another. An illustration of this statement is given in figure 1 where the spectrum of the MF prescribed by the GRIMM 2 model for the epoch (between SH degree ) together with three different extrapolations (thin lines) are plotted. In this example, the laws derived by Buffett and Christensen (2007), Roberts et al. (2003) and Voorhies (2004) were used to extrapolate the resolved scale spectrum. They respectively read:
| (11) | |||||
| (12) | |||||
| (13) |
with and . The constants , and were determined by fitting the resolved magnetic field spectrum between the degree .
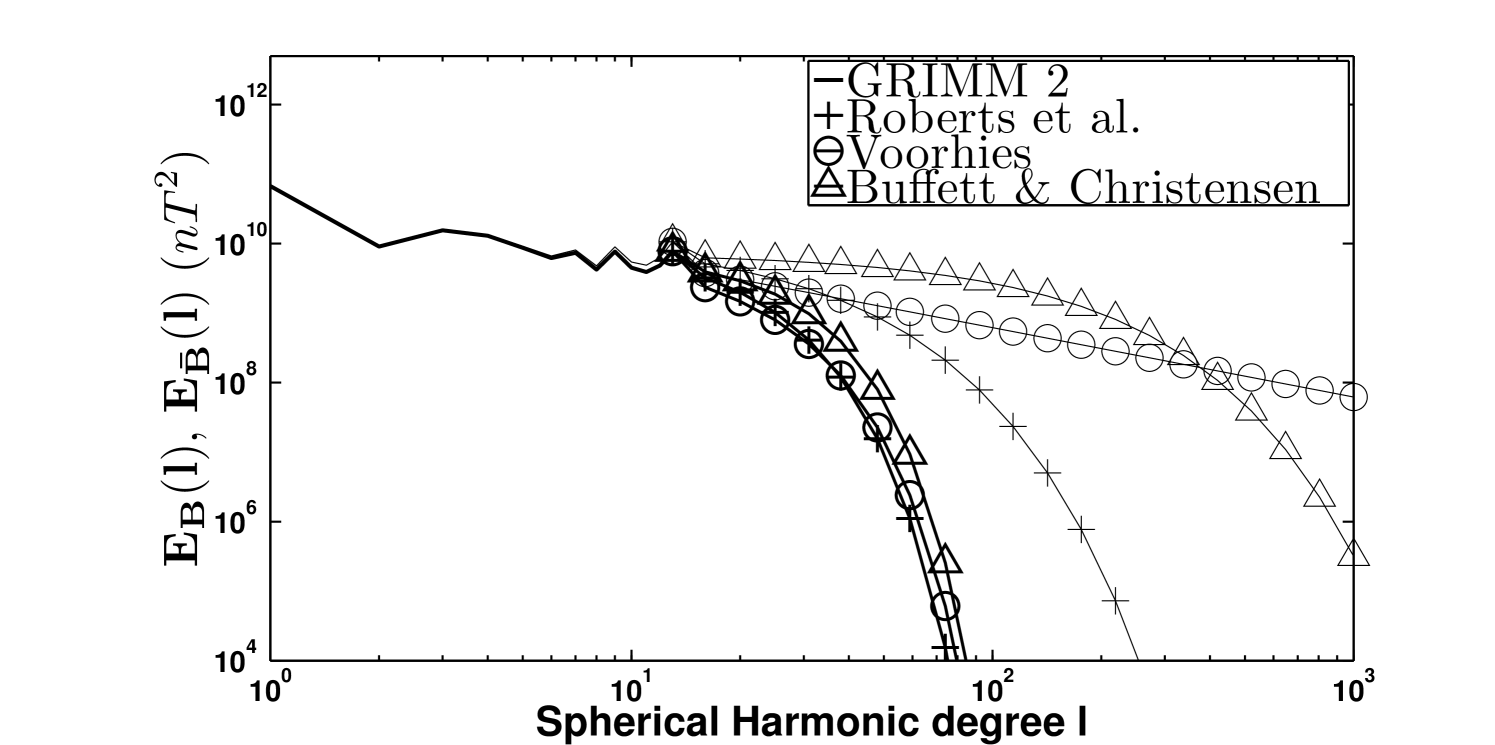
As it is confirmed in figure 1 the three extrapolated spectra are presenting distinct behaviors. Furthermore, the law proposed by Buffett and Christensen (2007) predicts a strong concentration of energy at small scales. If this latter formulation was to be the closest one from reality, the unresolved MF would have to be modeled at very high degree (up to ), which is nowadays numerically impossible. We propose therefore to reduce the impact of the small scale magnetic field on the large scale secular variation by applying a filter on the magnetic field and by determining the dynamical equation governing the evolution of the resulting filtered field.
II.4 Filtering of the fields
As it is the case for the Earth’s dynamo, the degree of turbulence in astrophysical or geophysical systems is most of the time extremely high. This implies that the fields are populated by a great variety of scales. Capturing all these scales in observations or in numerical simulations is usually impossible. Therefore, focusing on the large scales, and their dynamics, is probably the best solution to study such systems. This approach has been widely followed in the context of hydrodynamic (HD) and magnetohydrodynamic (MHD) turbulence (see Sagaut (2006); Lesieur (2008); Baerenzung et al. (2008a, b); Fabre and Balarac (2011)). To extract the large scales from a given field, one has to filter it. In HD or MHD turbulence three different filters are generally used, the top-hat or the Gaussian filter for studies in Cartesian space, or the sharp cut-off filter in spectral space. While the top-hat or Gaussian filter are continuous filters, the cut-off filter truncate the field above a certain predefined scale. In spherical coordinates the top-hat filter is usually preferred (Sun and Su (2007)) since until recently no equivalent of the Gaussian filter existed for such geometries (see however Bülow (2004) ). In our study, we decided to consider the isotropic filter developed by Bülow (2004). The principle of derivation of this filter is detailed in appendix A. Applying this filter to a scalar field leads to:
| (14) |
where is the filtered field, the symbol denotes the convolution product over the sphere between convolution kernel and the scalar field . According to the convolution theorem (see Driscoll and Healy (1994)), in spectral space equation (14) becomes:
| (15) |
where and are respectively the filtered and the total SH coefficients associated with , and is convolution kernel expressed in spectral space at degree . Since for the filter developed by Bülow (2004), is zonal, only its coefficients at order are different from zero. As shown in appendix A equation (101), equation (15) can be expressed as:
| (16) |
where corresponds to the filter width. With this formulation one can directly connect the spectrum of the scalar field to the spectrum of its filtered part as:
| (17) |
We then applied this filter to the three different extrapolated spectra presented in the previous section (see equations (11)-(13)). In figure 1 the non filtered (thin lines), and the filtered (thick lines) spectra are plotted. The width of the filter has been set to km in order to preserve the large scale fields and to suppress the small scale ones. One can observe that most of the energy that was contained in the small scales of the initial fields has now vanished in the filtered fields. Furthermore, the variations between the different extrapolated filtered spectra are now much less pronounced than in the non filtered case.
II.5 The Filtered Frozen-Flux (FFF) approximation
Applying the spatial filter presented in the preceding section to the velocity and the magnetic field allows to decompose them into an averaged part and , and a fluctuating part and such as:
| (18) | |||||
| (19) |
Since the spatial filter considered here is homogeneous and time invariant, it commutes with all the differential operators encountered in the induction equation. Therefore applying this filter to the Frozen Flux approximation (equation (3)) leads to:
| (20) |
Following the decomposition introduced by Leonard (1974), the part of the subgrid stress tensor which allows interactions between the tangential components of the velocity field and the radial component of the MF reads:
| (21) |
Now equation (20) can be rewritten as:
| (22) |
The subgrid stress tensor , through the averaged product , incorporates interactions between averaged and fluctuating part of the fields, thus equation (22) is not closed in the sense that it does not only contains large scale quantities. To close this equation, expressions of the fluctuating quantities depending on the averaged ones have to be derived.
As mentioned in appendix A, the filtered velocity and magnetic field are both solutions of the diffusion equations:
| (23) | |||||
| (24) | |||||
| (25) |
where the filtered and total fields are respectively and , and and , and the product between and the two diffusion coefficients and determines the width of the filter. Note that since is the diffusion coefficient applied to each term of the Frozen Flux equation it has to be applied to the MF but not necessarily to the VF. To link fluctuating to filtered fields, Taylor expansions at the first order in of , , and , using relations (23) to (25) are performed, leading to:
| (26) | |||||
| (27) | |||||
| (28) |
By analogy to the usual Gaussian filters used in Large Eddy Simulations, one can define the following characteristic lengths:
| (29) | |||||
| (30) |
Letting , injecting equations (26) and (27) into equation (28), and keeping only the first order terms, one gets:
| (31) |
which can be reduced to:
| (32) |
So the subgrid stress tensor in its approximated closed form reads:
| (33) |
The Filtered Frozen Flux equation can now be written for the filtered secular variation truncated at degree as:
| (34) |
with .
In our study, the extrapolated filtered magnetic field is extended up to the spherical harmonic degree . Above this scale, the filtered magnetic field (for km) is extremely weak (see figure 1) and its influence on the large scale secular variation is neglected.
II.6 Bayesian formulation of the inverse problem
The problem of determining the velocity field at the CMB knowing the exact MF and the SV together with its uncertainties is an ill-posed inverse problem: in a discrete approximation, the number of unknown is twice as large as the number of equations. One of the most common methods to tackle this problem consists in minimizing an energy functional composed of two main terms; a quantity measuring the discrepancies between the model and the data, balanced, through a regularization parameter, with a quantity expressing a prior knowledge on the expected solution. This method has been widely used to evaluate the flow at the CMB and for a review of the different parametrization employed see Holme (2007).
Another option consists in formulating the problem in a Bayesian framework. The solution becomes then the full posterior distribution of the velocity field given the secular variation. This method allows the estimation of a model for the flow together with the quantification of its uncertainties.
When variations around the prescribed MF are allowed to occur, the inverse problem becomes more complicated. For models of the Earth’s core MF derived from satellite or observatory data, the nature of these variations is diverse. At large scales they can be due to a leakage of the external and lithospheric field into the core field, whereas at small scales, the entire MF is undetermined because of the dominance of the lithospheric field at the Earth’s surface. Recent models such as GRIMM 2 (Lesur et al. (2010)) are able to separate at large scales (between SH degree ) the external from the core field, but not the lithospheric field from the core field. As a consequence, the large scale lithospheric field becomes a source of uncertainty on the geodynamo’s MF.
To parametrize the unresolved part of the MF in the inverse problem different approaches have been recently developed. This includes the ensemble method of Gillet et al. (2009) and the iterative algorithm of Pais and Jault (2008). In this study we propose to extend these methods to the context of Bayesian modeling, following the development of Jackson (1995). Furthermore, in addition to parametrizing the unresolved MF, we also consider the uncertainties on the large scale MF due to the lithospheric field.
II.6.1 CMB velocity distribution
From now on, in order to simplify the notations, the filtered MF and VF as well as the filtered and truncated SV will be written as:
| (35) | |||||
| (36) | |||||
| (37) |
In this section, the distribution we want to characterize is the posterior distribution of the velocity field given the secular variation . But since we want to account for the unknown small scale magnetic field together with the uncertainties on the large scale field, this distribution cannot be expressed directly. Nevertheless, it can be obtained by marginalizing the joint posterior distribution of the velocity field and the magnetic field as following:
| (38) |
According to Bayes (1763) the distribution on the right hand side of relation (38) can be decomposed into:
| (39) |
with the joint prior distribution of the VF and the MF, the distribution of the SV, which is constant with respect to both and , and finally the likelihood distribution. Because and are a priori assumed to be independent random variables their joint distribution can be split into two distributions such as:
| (40) |
The prior distribution of the VF is assumed to be Gaussian with the following general form:
| (41) |
with the dimension of the VF vector, which in our case is twice as large as the dimension of the MF and SV, and the velocity covariance matrix chosen to enforce the spatial smoothness of the flow. For this purpose we impose that:
| (42) | |||||
The right hand-side of equation (42) is composed of two different norms on , namely the Bloxham’s ”strong norm” (Bloxham (1988); Jackson et al. (1993)) for the first one and the standard -norm for the second one. The domain of integration is the surface of the sphere describing the CMB, and the balance factor is chosen to be small enough not to modify the correlation length induced by the Bloxham norm. Furthermore, the covariance is rescaled such as the averaged standard deviation of the velocity field intensity is km/yr. This implies that at any location of the core-mantle boundary, the probability for the flow intensity to excess the value of km/yr, an upper limit calculated by Finlay and Amit (2011), is of the order of .
As for the velocity field, the magnetic field is also assumed to be normally distributed, but with a mean corresponding to the resolved MF, and a covariance . Its prior distribution can therefore be expressed as:
| (43) |
In this equation the two parts of the MF have different behaviors. The truncated field is taken from the GRIMM 2 model with whereas the unknown MF is characterized by the averaged value . Since in the GRIMM 2 model, the core field and the litospheric field are overlapping at large scales, this latter field can be viewed as a source of uncertainties on . We propose therefore to use the theoretical spectrum of the litospheric field given by Thebault and Vervelidou (2013) to build the covariance matrix for the resolved scales magnetic field. This spectrum reads:
| (44) |
with the averaged crust magnetization, km the equivalent magnetized layer thickness, and the constants , , and km. The two functions and are given by:
Letting the truncated MF being linked to its spectral counterpart through the relation , where the operator projects the coefficients in physical space, and the operator filters the field, and assuming that the litospheric field is isotropically distributed, the covariance of the truncated MF is:
| (45) | |||||
| (46) | |||||
| (47) |
where are the spherical harmonics coefficients associated with .
The extrapolated SH coefficients of the MF are assumed to individually have a mean and a variance depending on the extrapolated spectrum from Buffett and Christensen (2007) as shown in equation (10). Therefore, in physical space, the MF also has a mean at any spatial location and a covariance given by:
| (48) |
By combining with , one gets the total covariance for the MF.
The last distribution to characterize is the likelihood distribution which measures the discrepancies between the model (the Filtered Frozen Flux equation) and the data (the secular variation). It reads:
| (49) |
where the operator , when applied to , allows to calculate the non linear term of the filtered Frozen Flux equation , and the covariance matrix is the SV posterior covariance of the GRIMM 2 model.
All the distributions entering the velocity field posterior distribution being detailed, this latter can be evaluated. The integral given in equation (38) has already been calculated by Jackson (1995), so we only present the result which reads:
| (50) | |||||
| (51) |
with:
| (52) | |||||
| (53) | |||||
| (54) |
By multiplying the density (51) with the prior distribution (41) one gets the posterior distribution:
Since this expression does not allow to easily apprehend the effects arising from the modelization of the MF variations on the posterior distribution of the velocity field, we decided to rewrite it into a more intuitive form. It reads:
| (56) | |||||
| (57) |
This formulation is very similar to the posterior distribution of the velocity field in the case where the magnetic field is exactly know. Indeed this latter distribution can be obtained by simply replacing the covariance matrix by . One can therefore observe that accounting for the small scale magnetic field and the lithospheric field when formulating the inverse problem in a Bayesian framework leads to an increase of the secular variation uncertainties through the quantity . Because of the dependency of this latter term on the velocity field , the maximum of the posterior distribution cannot be analytically calculated as already mentioned by Jackson (1995). Nevertheless, it is numerically possible to extract the main statistical characteristics of this posterior distribution using a Markov Chain Monte Carlo method (see Mosegaard and Rygaard-Hjalsted (1999); Rygaard-Hjalsted et al. (2000)). The algorithm we chose to explore the posterior distribution and the results we obtained are presented in the next section.
III Numerical method and results
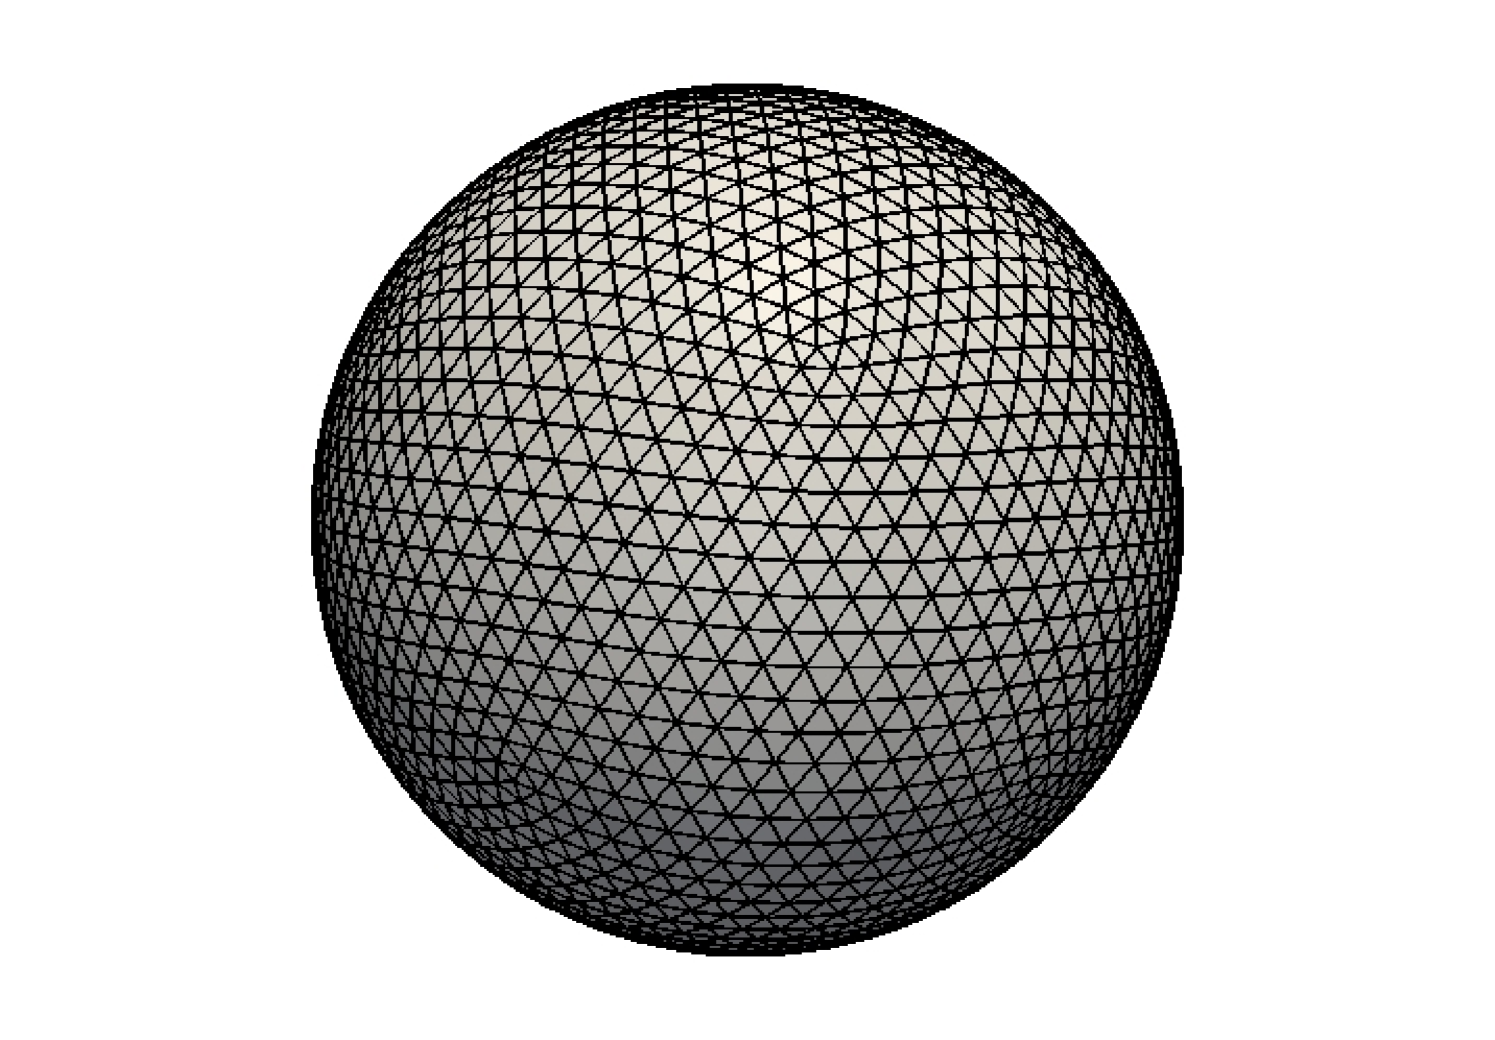
The SV, MF and VF are expressed in physical space, therefore the surface of the CMB has been discretized by recursively dividing an initial icosahedron (see figure 2). The grid construction and its properties, as well as the approximation of the differential operators are explicited in appendix B.
Given that the grid is composed of nodes, the vectors , , and are given by:
III.1 Evaluation of the Filtered Frozen flux model
To evaluate the FFF model, an inversion of this equation was performed using GRIMM 2 as well as artificially generated data. The large scale magnetic field was taken from the GRIMM 2 model at the epoch , whereas the small scales were randomly generated for SH degree lying between and according to the exponential law (11). The MF was then filtered (with km) such as its smallest scales, which cannot be properly represented on the grid, exhibited a low energy level. This MF is referred as . To create a SV associated with this MF, we drew randomly a velocity field and used it to advect the MF with the FF equation (3). The velocity field was decomposed into a poloidal and a toroidal part such as:
| (58) |
In spectral space, the spherical harmonics coefficients for the poloidal and toroidal field respectively read and . In order to promote interactions between small and large scales, and were extended up to spherical harmonic degree with the following statistical properties:
| (59) |
| (60) | |||||
| (61) | |||||
| (62) |
where is a normalization constant. The choice of a power law imposed onto the poloidal and toroidal field correlation allowed to generate a flow with similar statistical properties than a two-dimensional turbulent flow (see Sukoriansky et al. (2002)).
To directly simulate the advection of the MF, a fourth order Runge-Kutta scheme had been implemented. The integration time was taken to be year, and the computation was performed on a grid refined times (with nodes).
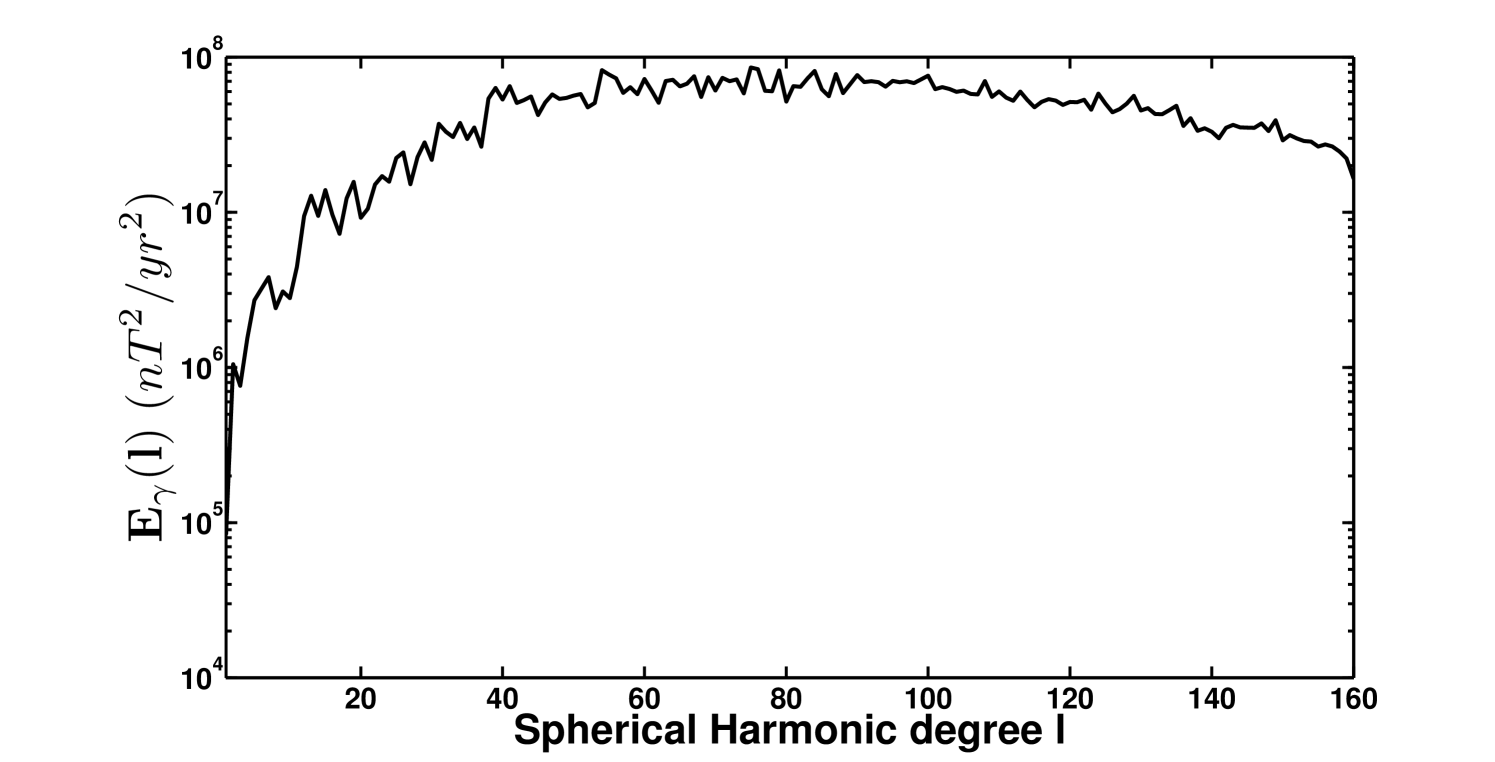
In figure 3, the spectrum of the resulting secular variation is plotted. As it can be observed, the energy of the SV is maximum at scales lying between and indicating that the MF is strongly affected by the velocity field at these scales.
To mimic the situation encountered when using models fitting satellite data where both the MF and SV cannot be entirely taken into account, the artificial fields were truncated at degree 40. The resulting MF and SV are respectively referred as and . These fields were then used as an input for the inversion of the FFF equation. Two different filter widths were tested, km, and km. In the latter case the equation reduces then to the usual FF approximation. Since the statistical properties of the velocity field were exactly known, they were directly injected in the prior information . No measurement errors on the secular variation and the magnetic field had been generated, therefore the likelihood and the MF prior distributions respectively read:
| (63) | |||||
| (64) |
Multiplying together these two distributions and marginalizing the result with respect to leads to:
| (65) |
with the subgrid stress tensor evaluated with . The posterior distribution of the velocity field is then proportional to:
| (66) |
The Bayesian formulation of the problem being described, the discrete velocity field that maximizes the posterior distribution could be determined for the two cases. To do this, a particular solution of the equation was calculated. In addition, the null space of the operator defined such as was parametrized. The final solution corresponded then to the sum of the particular solution with the null-space one which minimized the prior information on the VF. The grid used to realize the computation was composed of nodes (approximately times less than the one taken to advect the MF). For the results to be comparable, the three different velocity fields were truncated at SH degree . Furthermore the artificially generated field as well as the field obtained by inverting the FF approximation (), were filtered with km.
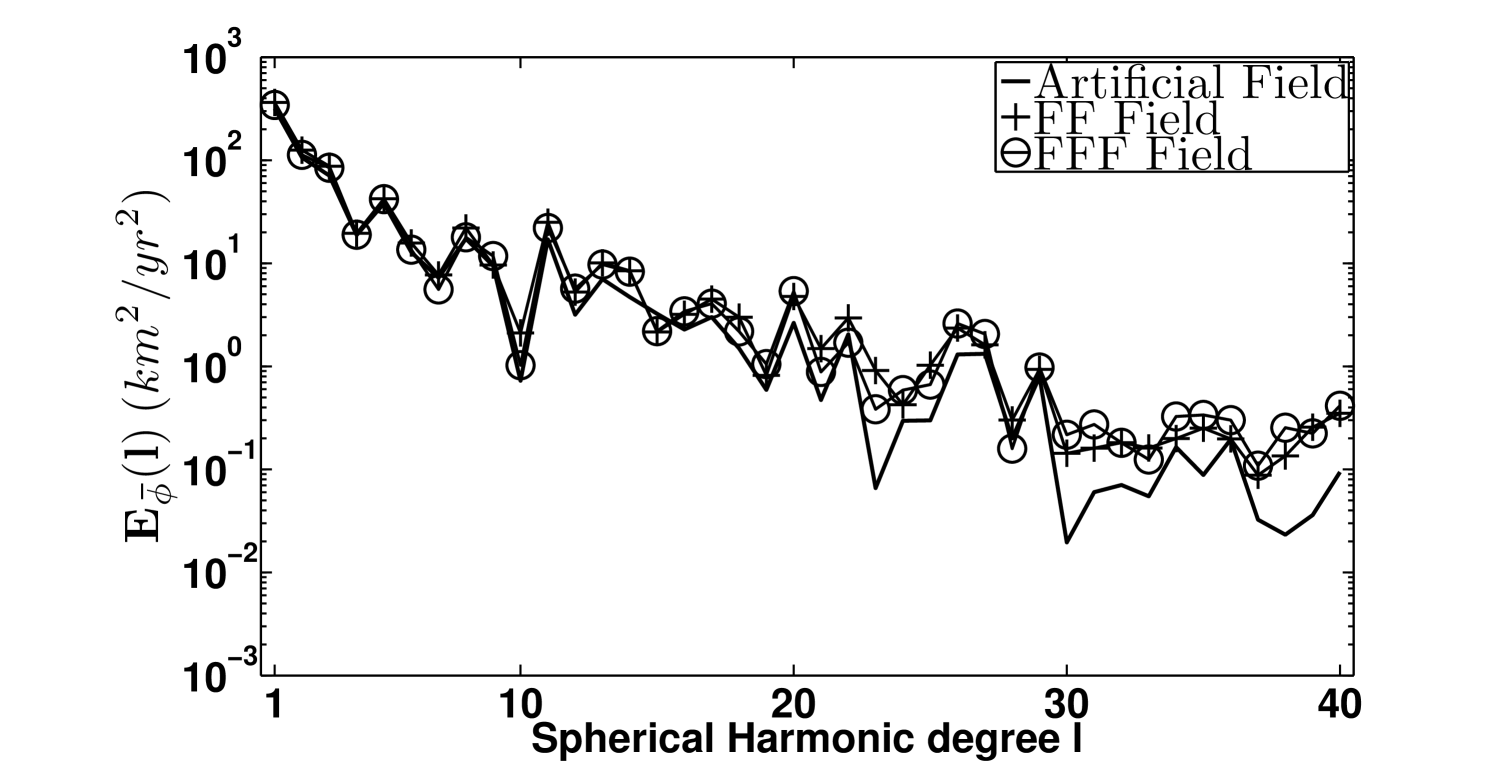
On the left side of figure 4 the poloidal and toroidal spectra respectively defined by:
| (67) | |||||
| (68) |
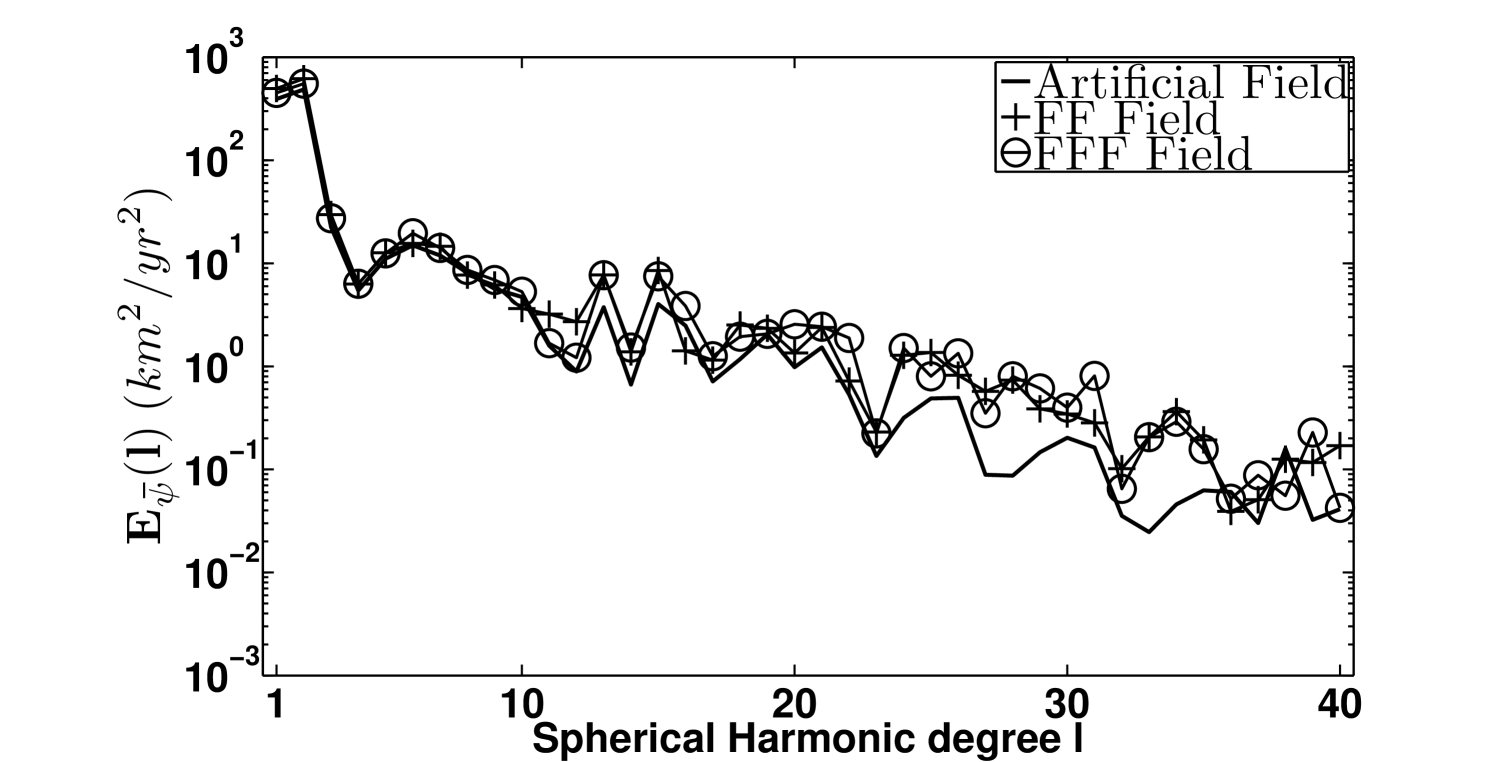
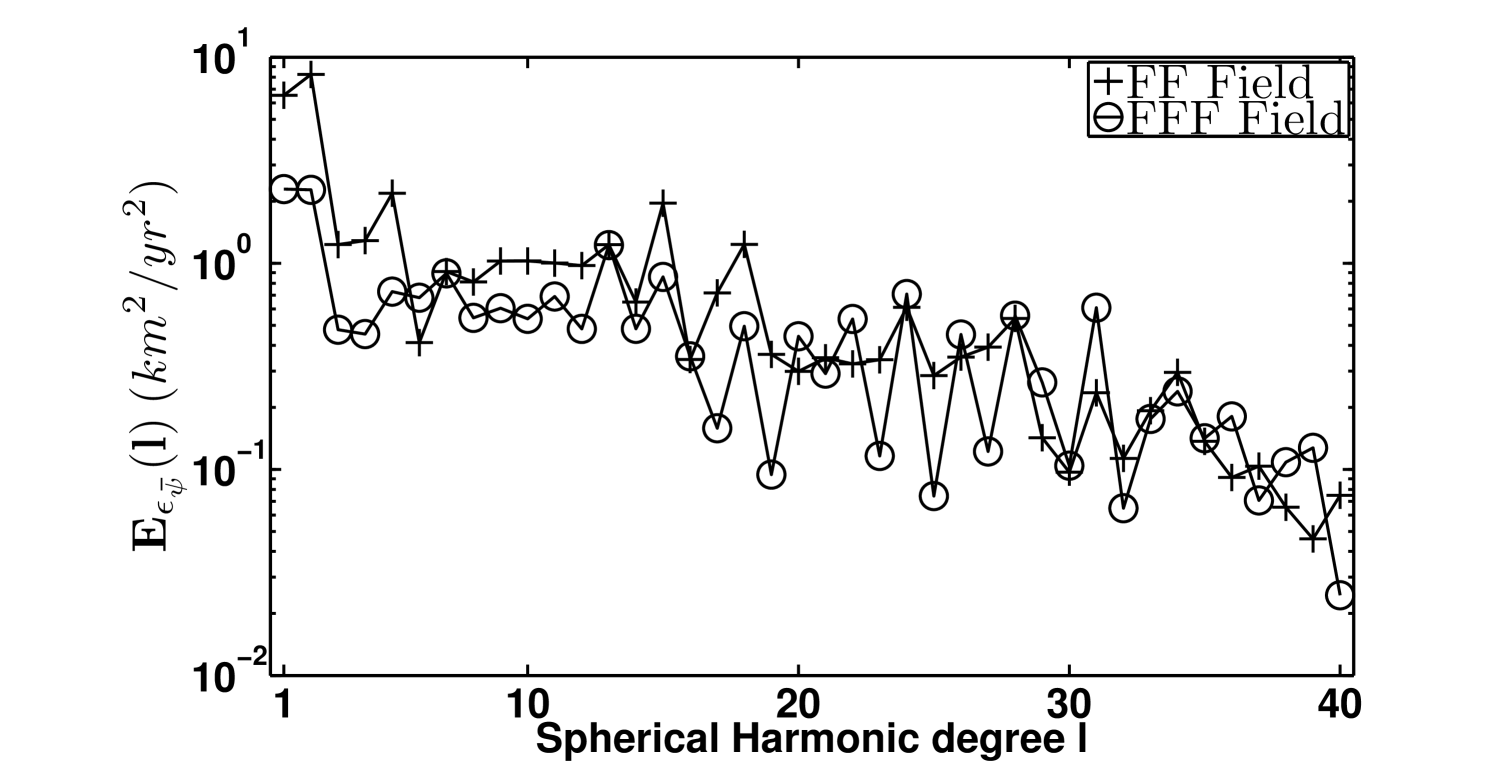
are plotted for the three velocity fields. The behavior of the spectra associated with the artificial field (full line) is correctly reproduced at large scale () by both the FF (crosses) and the FFF (circles) flow models, whereas at SH degree close to the cutoff , the discrepancies between the exact spectra and the spectra of the inverted fields become larger. Nevertheless, the spectra of the difference between exact and inverted fields, displayed on the right side of figure 4, show that the use of the FFF equation allows to reproduce more accurately the artificial field at almost any scale.
To quantify the spatial error of the two inverted fields, the following quantities were computed:
| (69) | |||||
| (70) | |||||
| (71) |
where the integration domain is the surface of the CMB, is the exact filtered velocity field, and are respectively the filtered velocity field obtained by inverting the FF and the FFF equations. The result of these computations shows that although the energy associated to the error fields is weak in comparison to the total energy of the exact flow, performing an inversion of FFF approximation reduces the global error on the VF.
III.2 Sampling of the velocity posterior distribution
In this part we present a method to sample the posterior distribution given in equation (56). Since this distribution exhibits a complex form with respect to the velocity field , directly drawing sample from it is impossible. Nevertheless, by building an appropriate Markov Chain on the VF one can map the distribution (for a complete description of Markov Chain Monte Carlo methods see Gamerman and Lopes (2006)). For this study we chose an algorithm of the Metropolis-Hastings type to construct the chain. The principle of the method is the following:
-
(a)
in the initial step, a VF with is generated. No particular property have to be imposed on this field, but choosing a field which is as close as possible to the one maximizing the target distribution will allow the chain to converge faster.
-
(b)
from a field is constructed according to some arbitrary transition kernel .
-
(c)
the next step consists in accepting or rejecting the move from to . Therefore, an acceptance probability is defined. In the case of the Metropolis-Hastings algorithm this probability is expressed as:
(72) -
(d)
the process returns then to step (b) with if the move from to is accepted, and with otherwise.
The ensemble is then assumed to be representative of the posterior distribution, once its averaged field as converged towards a fixed vector.
Note that this algorithm has already been employed by Mosegaard and Rygaard-Hjalsted (1999); Rygaard-Hjalsted et al. (2000) for sampling the posterior distribution given in equation (II.6.1), but with a different parametrization of the magnetic field and the velocity field. In particular, only the uncertainties on the large scale MF were considered in these two studies.
As already mentioned previously, analytically calculating the maximum of the posterior distribution is not feasible. We therefore decided to approximate it by taking the averaged VF of the ensemble generated by the Markov Chain, such as:
| (73) |
III.2.1 Evaluation and comparison of the method with artificial data
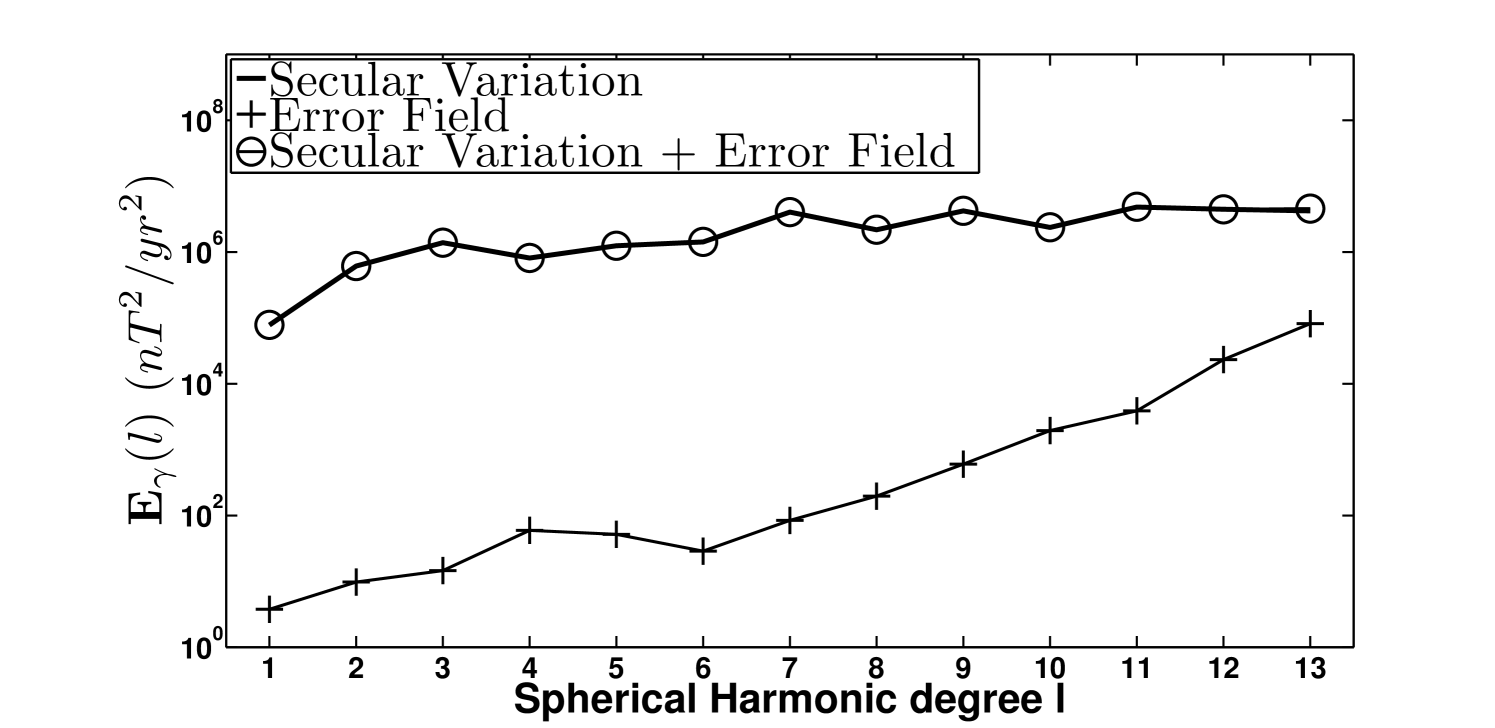
To evaluate our method, we created an artificial set of data, and performed the inversion of the FFF equation using these data. We also compared our results to the ones obtained with alternative approaches. The construction of the synthetic fields was performed as following:
-
Artificial magnetic field
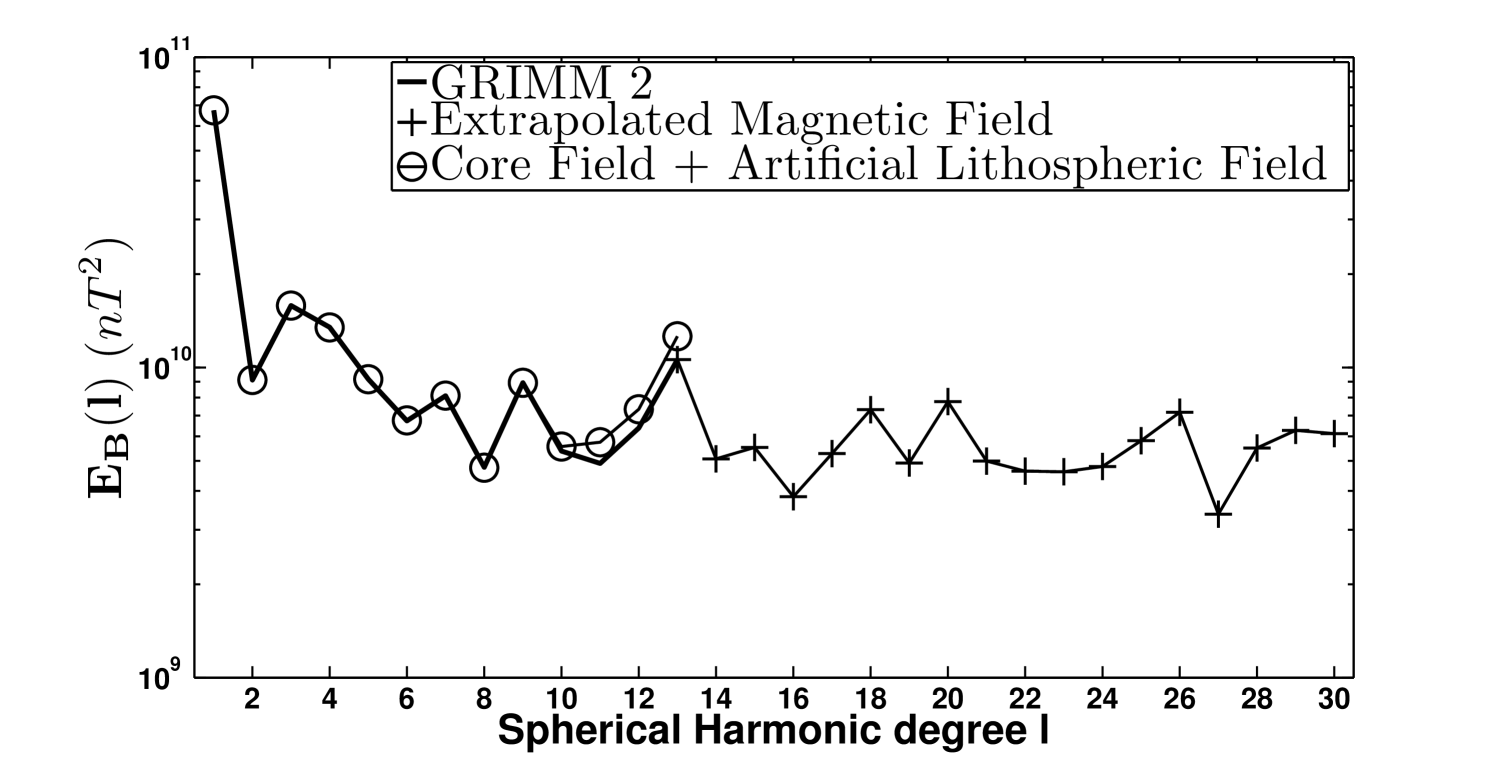
The large scale MF (between spherical harmonic degree ) was taken from the GRIMM 2 model at the epoch . Its spectrum (the thick black line in the top of figure 5) was then extrapolated up to degree according to the formulation (11) of Buffett and Christensen (2007). From this small scale spectrum, and under the assumption of isotropy and mean of the field, a MF was randomly generated and added to the GRIMM 2 large scale field. In figure 5 (top) the spectrum of the small scale MF is represented by the plus symbols.
-
Artificial velocity field
The coefficients, in spectral space, of the poloidal () and toroidal () fields were assumed to be isotropically distributed with a mean and a covariance derived from the following power law spectrum:
(74) where the value of the amplitude was chosen such as the averaged velocity intensity at the CMB was of km.yr-1. A velocity field extending up to degree was then randomly drawn accordingly to these statistical properties.
-
Artificial secular variation
The next step of this evaluation was to recover the velocity field according to the magnetic field and the secular variation. But for this inverse problem to be more realistic, uncertainties were added to the data. A large scale lithospheric field () was randomly generated accordingly to the theoretical spectrum of Thebault and Vervelidou (2013) (see equation 44) and added to the artificial MF. This contaminated field was then truncated at degree . It is referred as and its energy spectrum is plotted on top of figure 5 with circles. The uncertainties on the secular variation were built by randomly drawing a field from a Gaussian distribution with a mean and a covariance given by the posterior covariance matrix of the GRIMM 2 secular variation . The resulting field was then superimposed on the artificial field. The spectrum associated with the total SV is shown with circles on the bottom of figure 5.
Except for the prior distribution of the velocity field , all the distributions derived in section II.6.1 are consistent to describe the posterior distribution of the velocity field in this test. We recall that they read:
| (75) | |||||
| (76) |
where corresponds to the normal distribution centered in and with covariance , and is the covariance of the MF in which are included the uncertainties due to the lithospheric field and the modelization of the unresolved MF. For this evaluation phase, the prior distribution of the VF was given by:
| (77) |
with the covariance of the VF derived from the power laws (74).
The estimation of the flow with respect to the artificial MF and SV was then realized with the four algorithms presented below.
-
MCMC method
In this approach the full posterior distribution of the velocity field is explored with the Metropolis-Hastings algorithm described in the beginning of the section. The transition kernel entering the algorithm (step b) is derived from the prior distribution of the VF as following:
(78) where the factor allows to rescale the covariance in order to limit the distance of the move from one field to the other. Since this kernel is symmetric with respect to and , the acceptance probability of equation (72) reduces to:
(79) The initial field was set to and an ensemble of VF was generated. We then approximated the flow maximizing the posterior distribution through the averaging operation:
(80) -
Least square method
In this method, the magnetic field is assumed to be exactly known such as:
(81) As a consequence, the posterior distribution of the velocity field becomes proportional to:
(82) where is the operator allowing to evaluate the non linear term of the FFF equation when it is applied to . The maximum of this distribution can be calculated analytically and corresponds to the usual least square solution:
(83) -
Ensemble method
This approach was developed by Gillet et al. (2009) and consists in generating an ensemble of magnetic field and calculating their associated velocity field. In this test, the ensemble of MF was randomly drawn from the distribution given in equation (76). In total we generated magnetic fields (with ) extending up to degree . Each velocity field were then determined by the relation:
(84) where the operator now depends on each realization of the magnetic field. The flow solution of the complete inverse problem is given by:
(85) -
Iterative method
In this approach, Lesur et al. (2013) proposed to determine the CMB velocity field through the following iterative process:
(86) where is the index of the iteration, and the covariance is given by:
(87) with the operator depending on the velocity field , and which allows to evaluate the non linear term of the FFF equation when it is applied to . In the numerical implementation of this method, the initial field was taken as the one solution of the least square approach.
Note that this algorithm provides an estimation of the maximum of the posterior distribution given in equation (56) if the quantity is assumed to vary slowly with respect to .
In the previous section we mentioned the algorithm of Pais and Jault (2008) which also allows to take into account the variations of the MF in the inverse problem. We decided not to implement it in this evaluation since it is an approximation of the method proposed by Lesur et al. (2013).
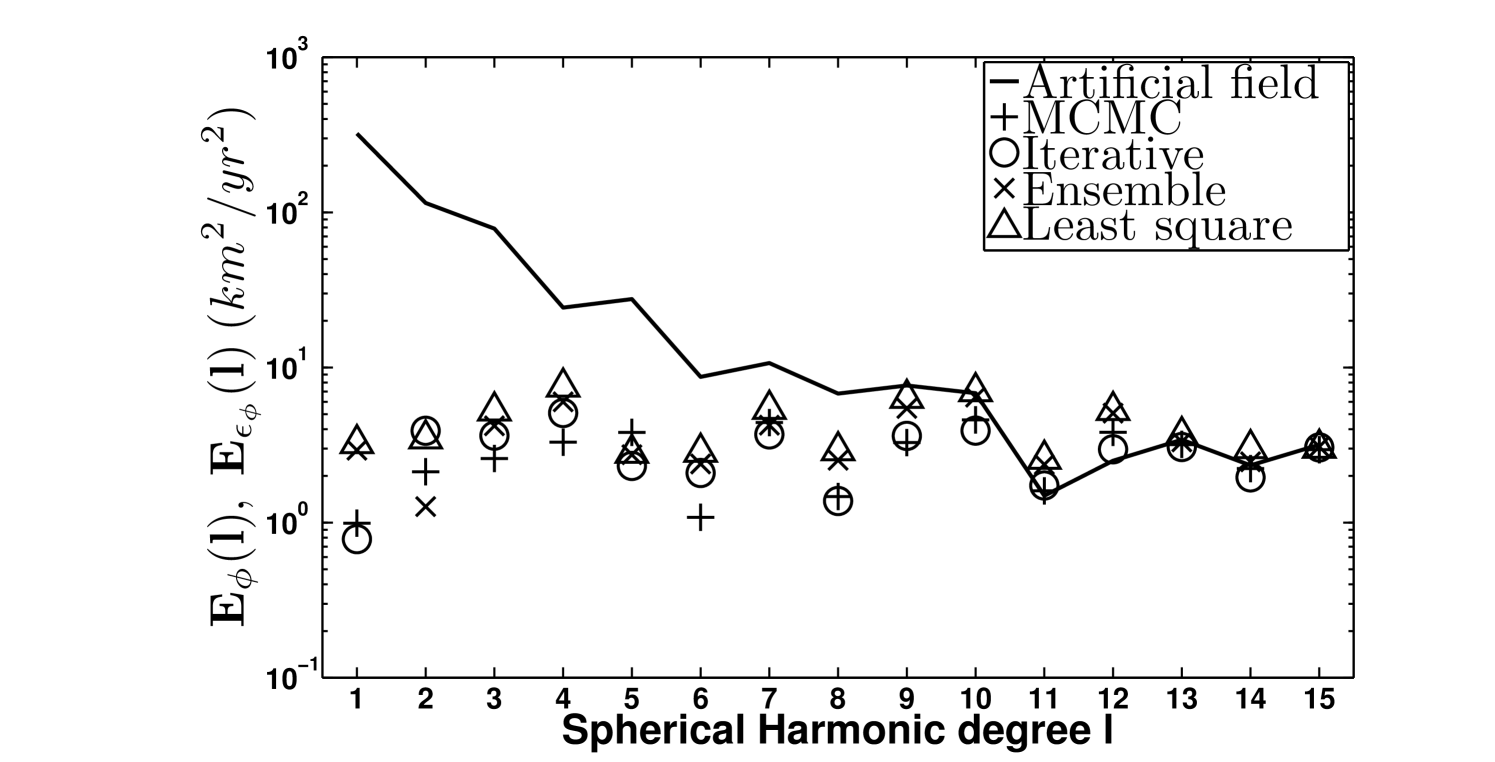
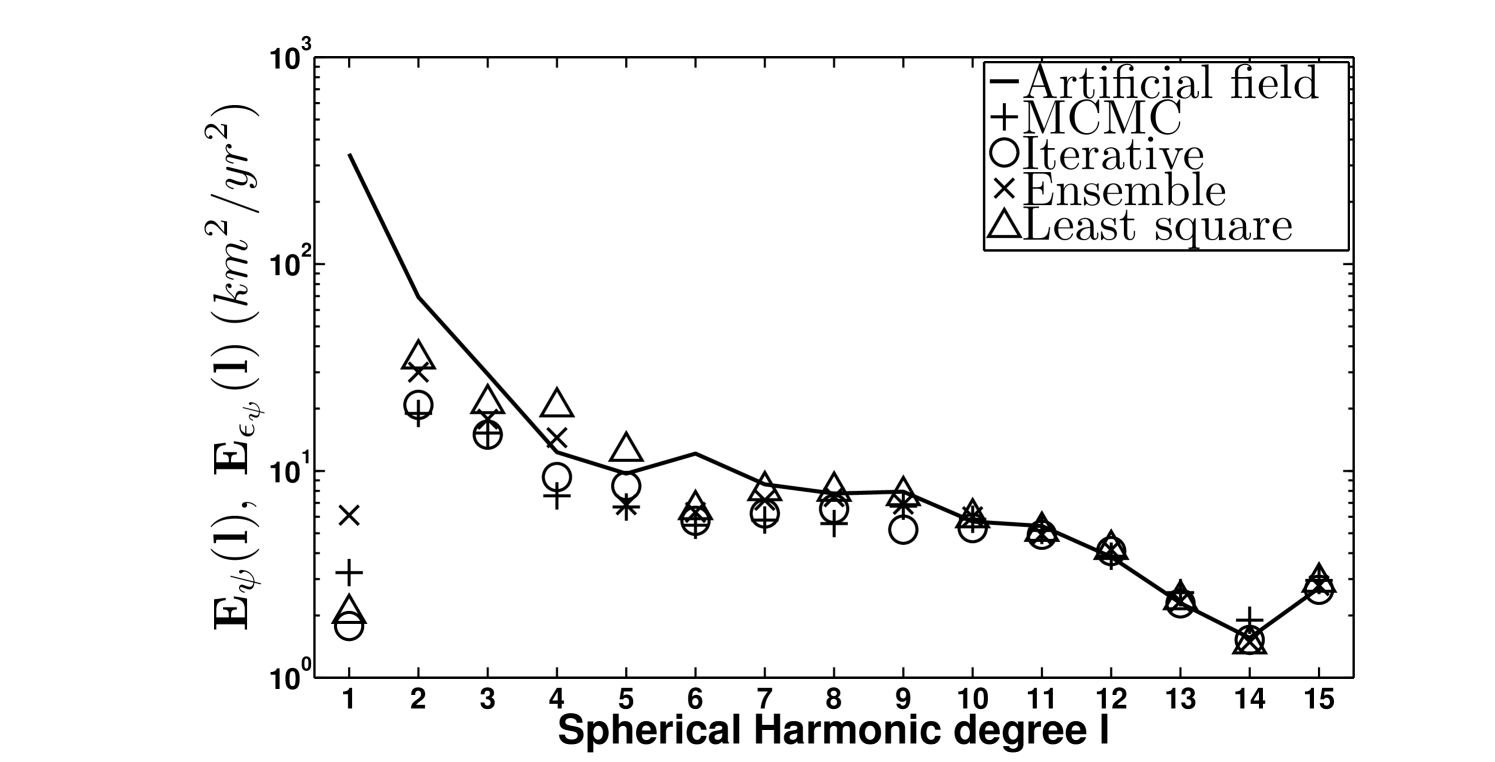
To compare the different approaches, the artificial velocity field is decomposed into a toroidal () and a poloidal () field, with and their respective spectral counterpart. The same operation is performed on the velocity fields given by the four inversion methods. Their toroidal and poloidal parts are then referred as and in physical space, and and in spectral space.
To measure the accuracy, scale by scale, of the various fields, we define the poloidal and toroidal error fields as:
| (88) | |||||
| (89) |
and their associated energy spectra:
| (90) | |||||
| (91) |
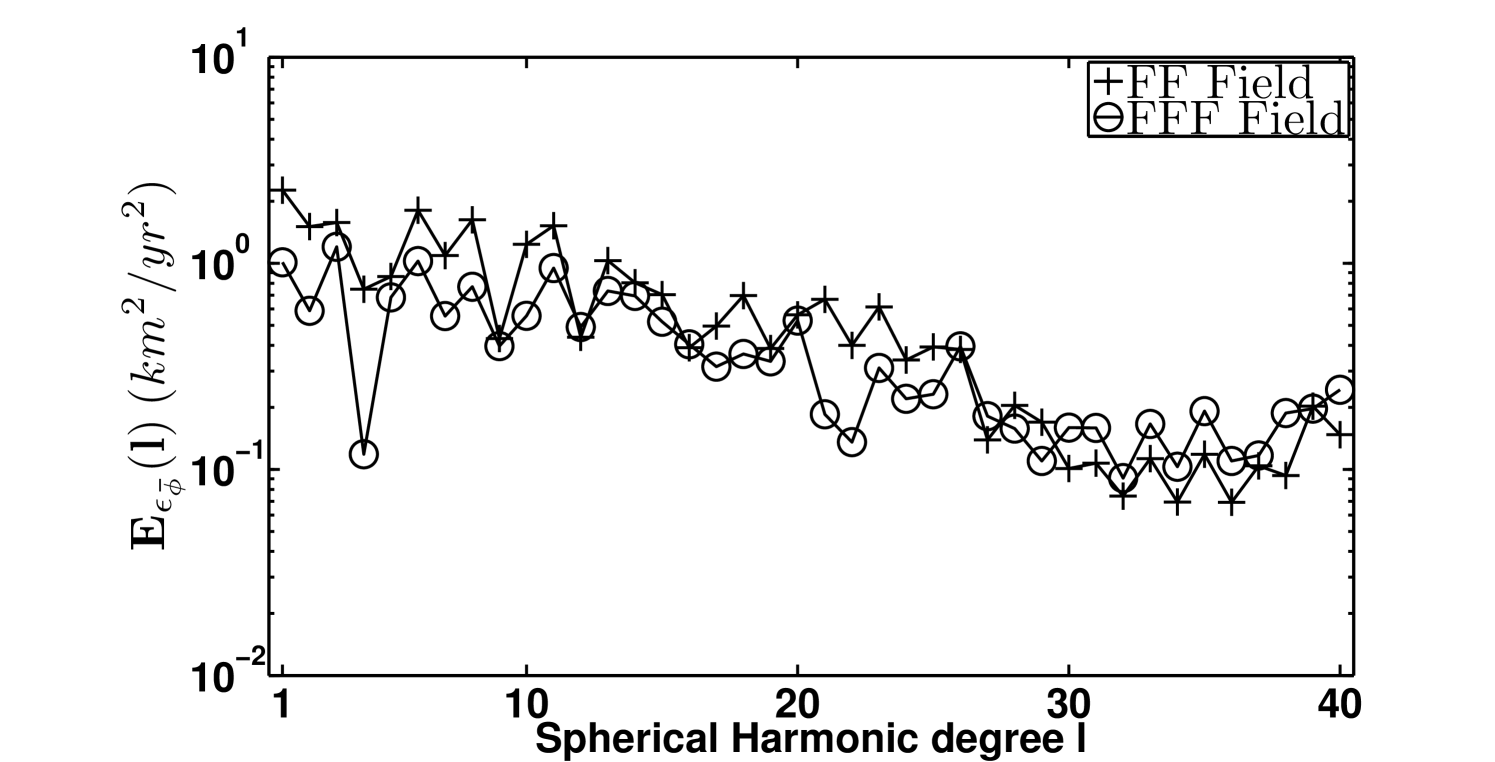
In figure 6 the spectra of the error fields (symbols) are plotted together with the poloidal and toroidal spectra of the artificial velocity field (solid lines). The first observation one can make is that above the SH degree , the energy associated with the poloidal and toroidal error is of the same order than the energy of the artificial fields. This implies that above this degree, the estimation of the flow is not reliable whatever the method employed to determine it. At large scale, the performance of the different approaches varies strongly. Whereas the flow obtained with the least square method (triangles) is the one which deviates the most from the artificial flow, the velocity fields evaluated with the iterative method (circles) and the MCMC algorithm (plus symbols) are the ones presenting the lowest error intensities. In between, in terms of accuracy, lies the ensemble method (crosses). It can be noted that at degree and between and for respectively the ensemble and the least square method, the energy associated with the toroidal error field is larger than the energy of the artificial field itself. This is not the case anymore when using the iterative or MCMC approaches.
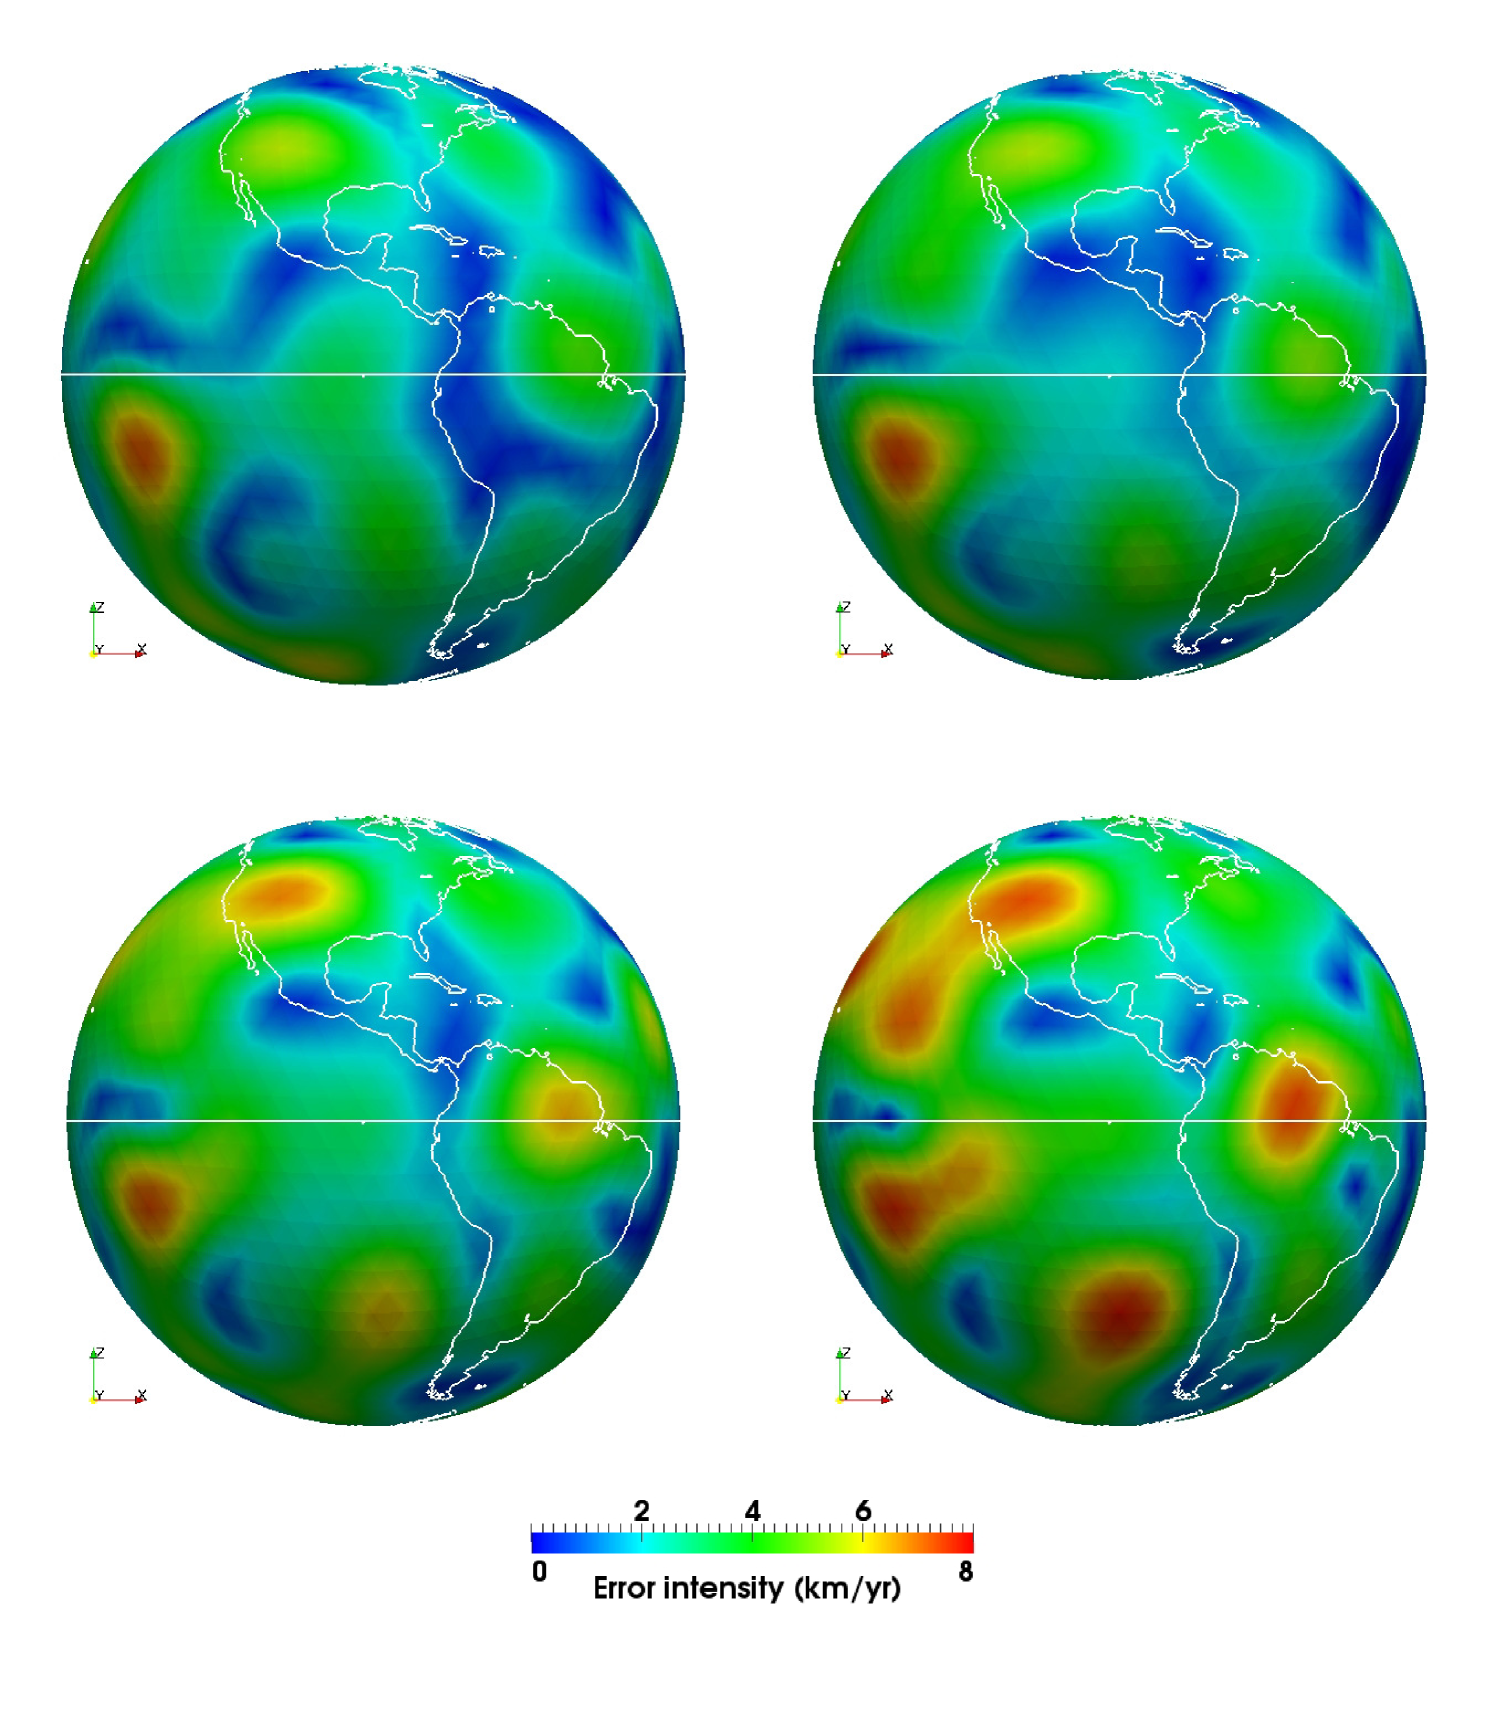
To evaluate the different models in physical space, the coefficients associated with the poloidal and toroidal error fields (equations 88-89) were truncated at degree , since at smallest scales the uncertainties are maximal, and projected in real space. Figure 7 shows the intensity of these fields at the level of America for the four approaches. Although the locations of the errors are similar, their intensities differs strongly from one flow to the other. A computation of the averaged energy associated with the poloidal and toroidal error fields (see table LABEL:tableError) shows that globally the best approximation of the artificial velocity field is provided by the MCMC algorithm, followed in order by the iterative, ensemble and least square methods. Note that the differences between the MCMC and iterative approach are very low, and since the computation time required to sample the full posterior distribution is much larger than the one to approximate its maximum using the iterative method, if one wants to determine the flow without its underlying uncertainties, using the algorithm of Lesur et al. (2013) is certainly more appropriate.
| MCMC | Iterative | Ensemble | Least square | |
|---|---|---|---|---|
| Poloidal Field | ||||
| Toroidal Field |
Since the MCMC algorithm provides an information on the flow uncertainties, we extracted the standard deviation of the velocity intensity , from the variance as following:
| (92) |
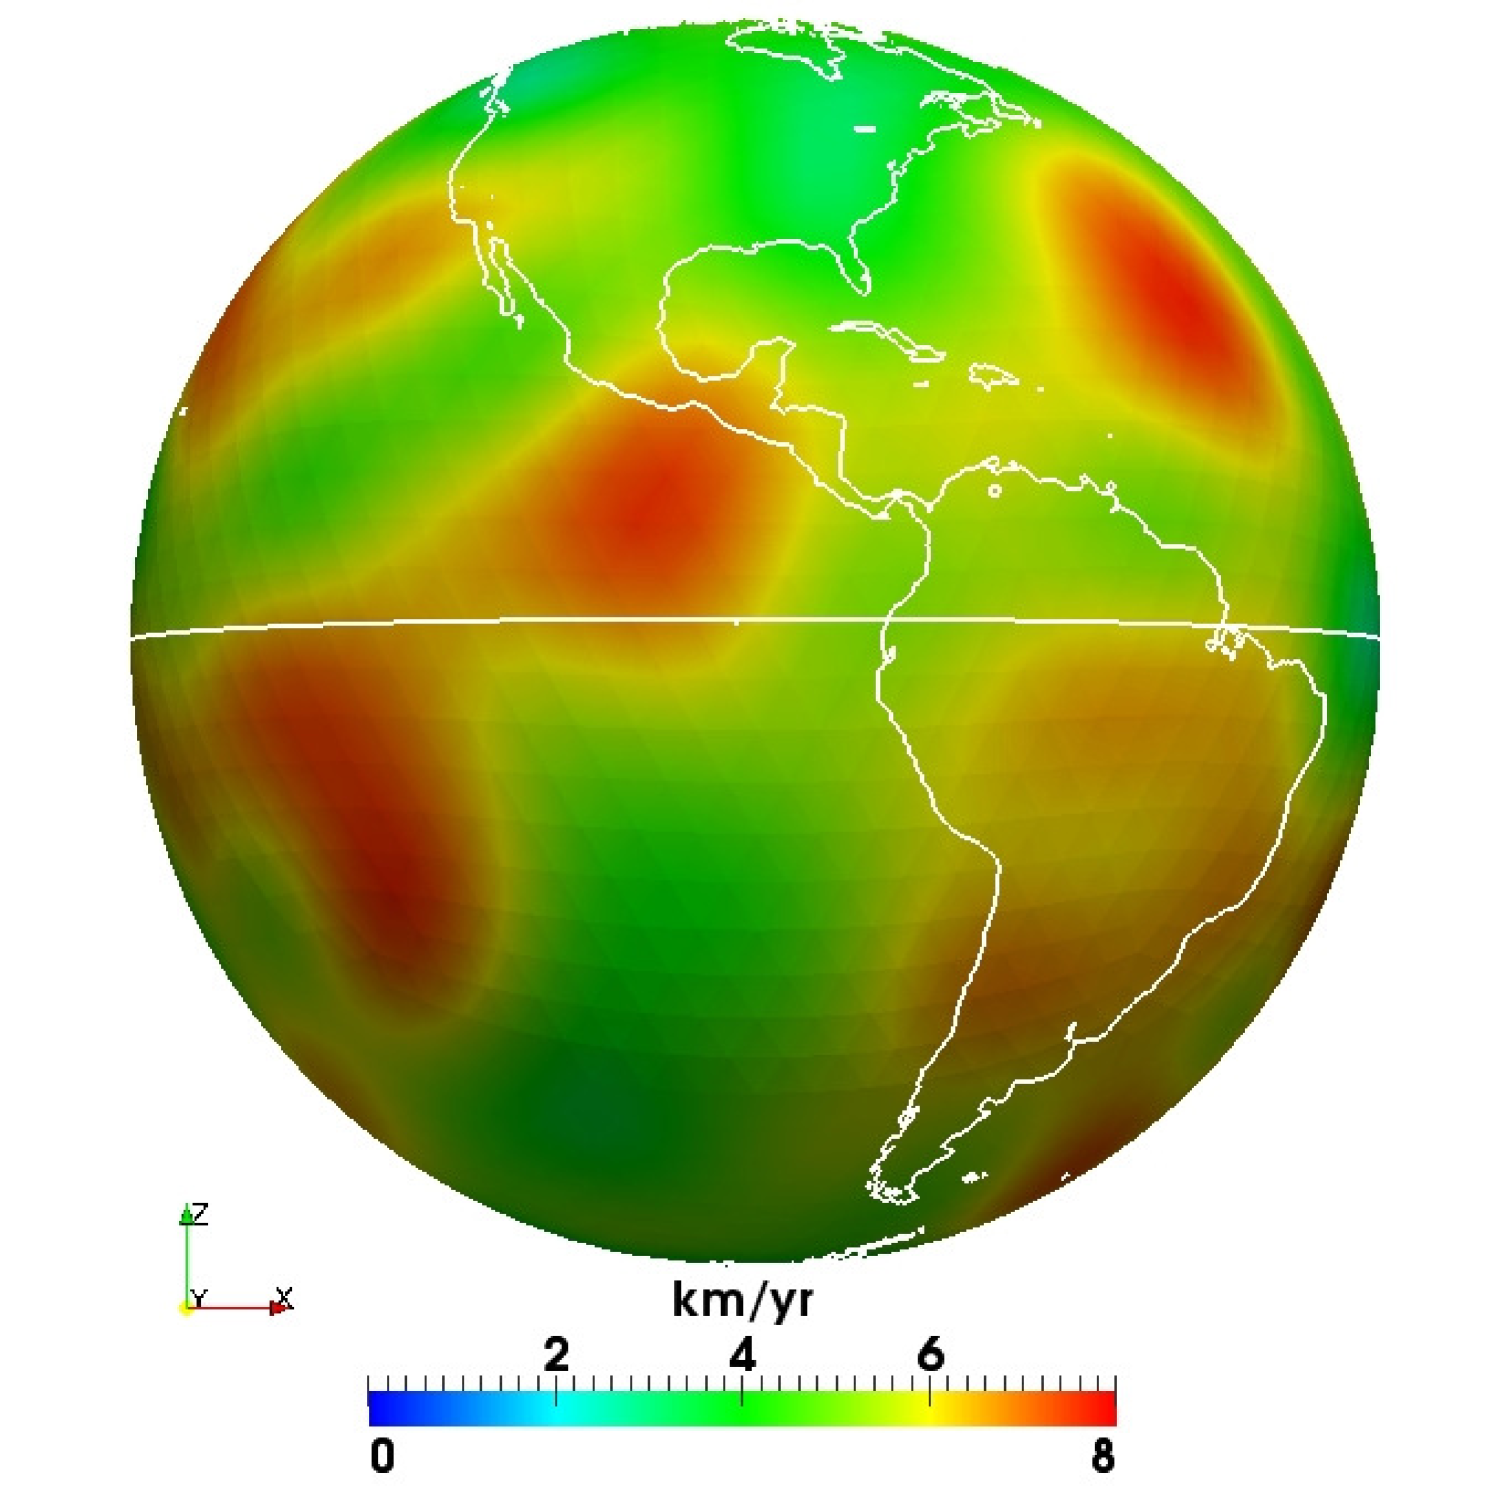
where the term means that only the diagonal elements of the matrix lying within the brackets are kept. At each node of the discrete CMB, the VF is composed of a polar and an azimuthal component, so to get the variance associated with the velocity intensity , the variance of each component has to be summed up. In figure 8 the quantity , corresponding to the confidence interval on the flow intensity, is displayed at the level of . This picture presents a pessimistic view of the uncertainties to be expected when evaluating the flow maximizing the posterior distribution. Because the probability for the real flow to lie within the tails of the posterior distribution is very low, the predicted error will globally be larger than the effective one. Nevertheless, locations where the differences between the solution flow and the real one are important corresponds to areas of high posterior variance.
Finally, we wanted to measure the impact of the velocity field prior information on the solution of the inverse problem. We therefore realized a simulation with the iterative algorithm of Lesur et al. (2013), in which only the covariance matrix of the velocity field of equation (87) has been modified. Instead of being the covariance imposed to generate the artificial velocity field, this latter was replaced by the covariance defined in equation (42) and derived from the Bloxham’s ”strong norm”. We then calculated, as previously, the averaged energy of the error field using the velocity field we obtained. It is of kmyr-2 and kmyr-2 for respectively the poloidal and toroidal part of the error. This shows us that the choice of the prior information on the velocity field influences in a significant manner the results of the inverse problem. Nevertheless, it can be noticed that the intensity of the error in this case remains lower than the intensity of the error for the flow resulting from the least square approach, showing the importance of modeling the possible variations of the MF.
III.2.2 Application of the MCMC algorithm for the epoch 2005.0
In the simulation we realized, the MF and the SV as well as the covariance for the SV, are given up to SH degree by the GRIMM 2 model of Lesur et al. (2010) for the epoch . For the magnetic field, the covariance associated with its large scales () is derived from the theoretical spectrum of the litospheric field of Thebault and Vervelidou (2013) as shown in equations (44)-(47), whereas the extrapolation of the MF spectrum proposed by Buffett and Christensen (2007) is used to build the covariance matrix of the small scale MF () as presented in equation (48). The velocity field is extended up to SH degree , and its prior distribution is given by the relation (41). The width of the filter has been set to km, and the initial field of the Markov chain , is the velocity field solution of the least square approach:
| (93) |
with .
As for the synthetic test of section III.2.1, the transition kernel was derived from the prior distribution of the VF as shown in equation (78).
The Metropolis-Hastings algorithm was then numerically simulated on a discrete CMB refined 4 times. An ensemble of VF mapping the posterior distribution have been generated. The velocity field maximizing the posterior, is approximated by taking the average field of the ensemble we created.
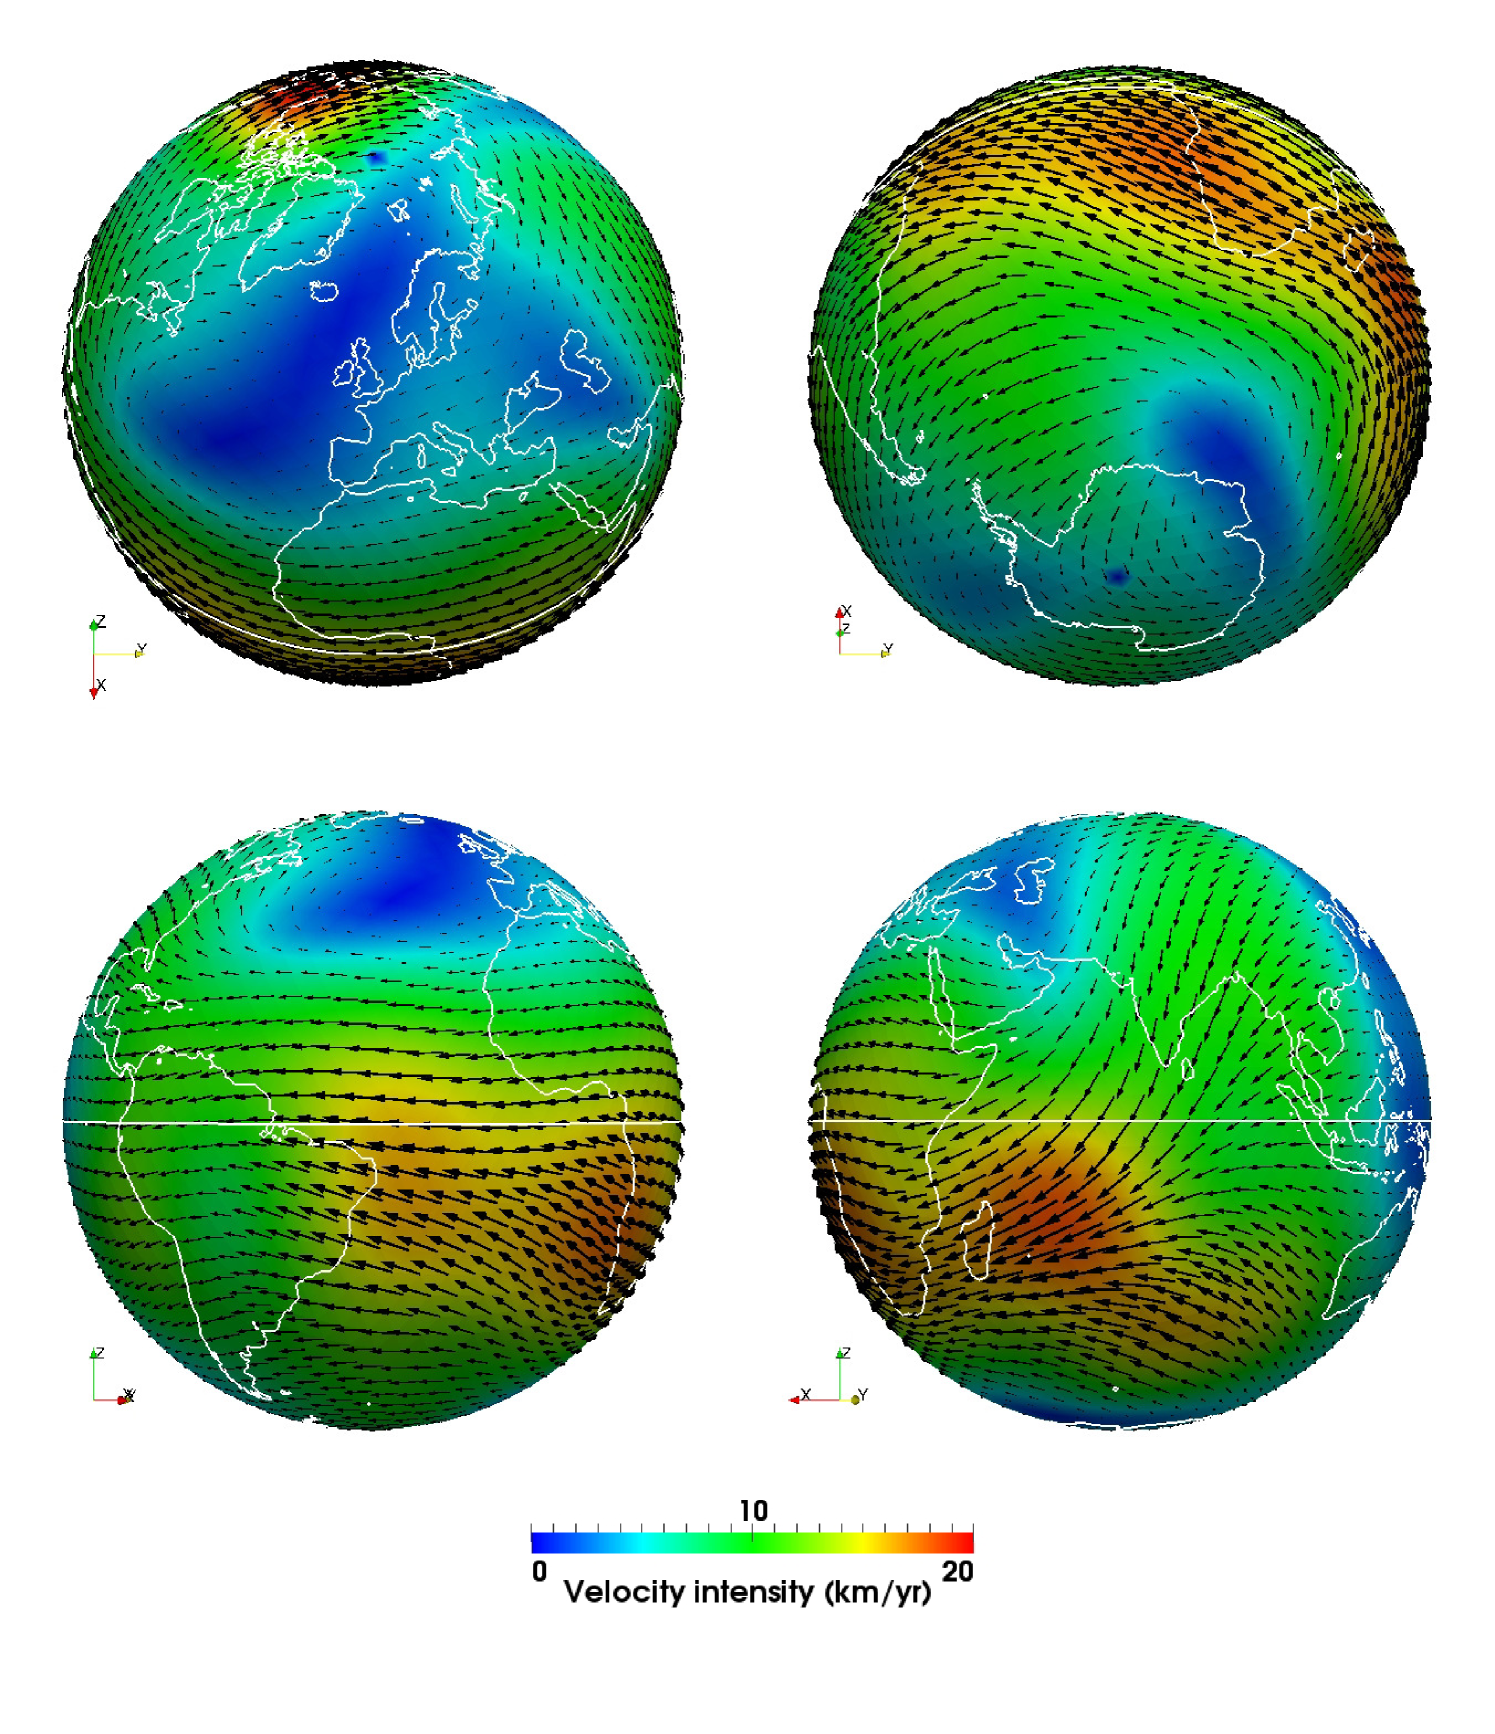
In figure 9, the vector field and its intensity are displayed in different locations of the core mantle boundary. Many features of the flow we obtained have already been reported in previous studies. In particular, the eccentric and planetary scale anticyclonic gyre observed by Pais and Jault (2008) and Gillet et al. (2009) is also present in the flow we calculated. This observation reinforces the hypothesis that the fluid motions in the outer core can be well-described by the compressible quasi-geostrophic assumption, a constraint a priori applied in both studies. Nevertheless, according to our results, deviations from quasi-geostrophy (QG) have also to be expected. Indeed, under this hypothesis, the flow is forced to be symmetric with respect to the equator outside the tangential cylinder, a condition which is not fulfilled everywhere in our case. Although the symmetric part of the velocity field is dominant in our simulation ( of the energy of the total VF is concentrated in its symmetric components) certain patterns, such as the flow crossing the equator below India or the larger intensity of the westward drift in the southern hemisphere are violating this property. The flow we obtained also exhibits a much smoother spatial behavior than the ones presented by Pais and Jault (2008); Gillet et al. (2009). This is certainly due to the choice we made to characterize a priori the velocity field. Through the Bloxham’s ”strong norm”, we imposed a very steep spectrum (in ) to both the poloidal and toroidal field, as a consequence the intermediate scales of the VF were probably over-damped in our simulation.
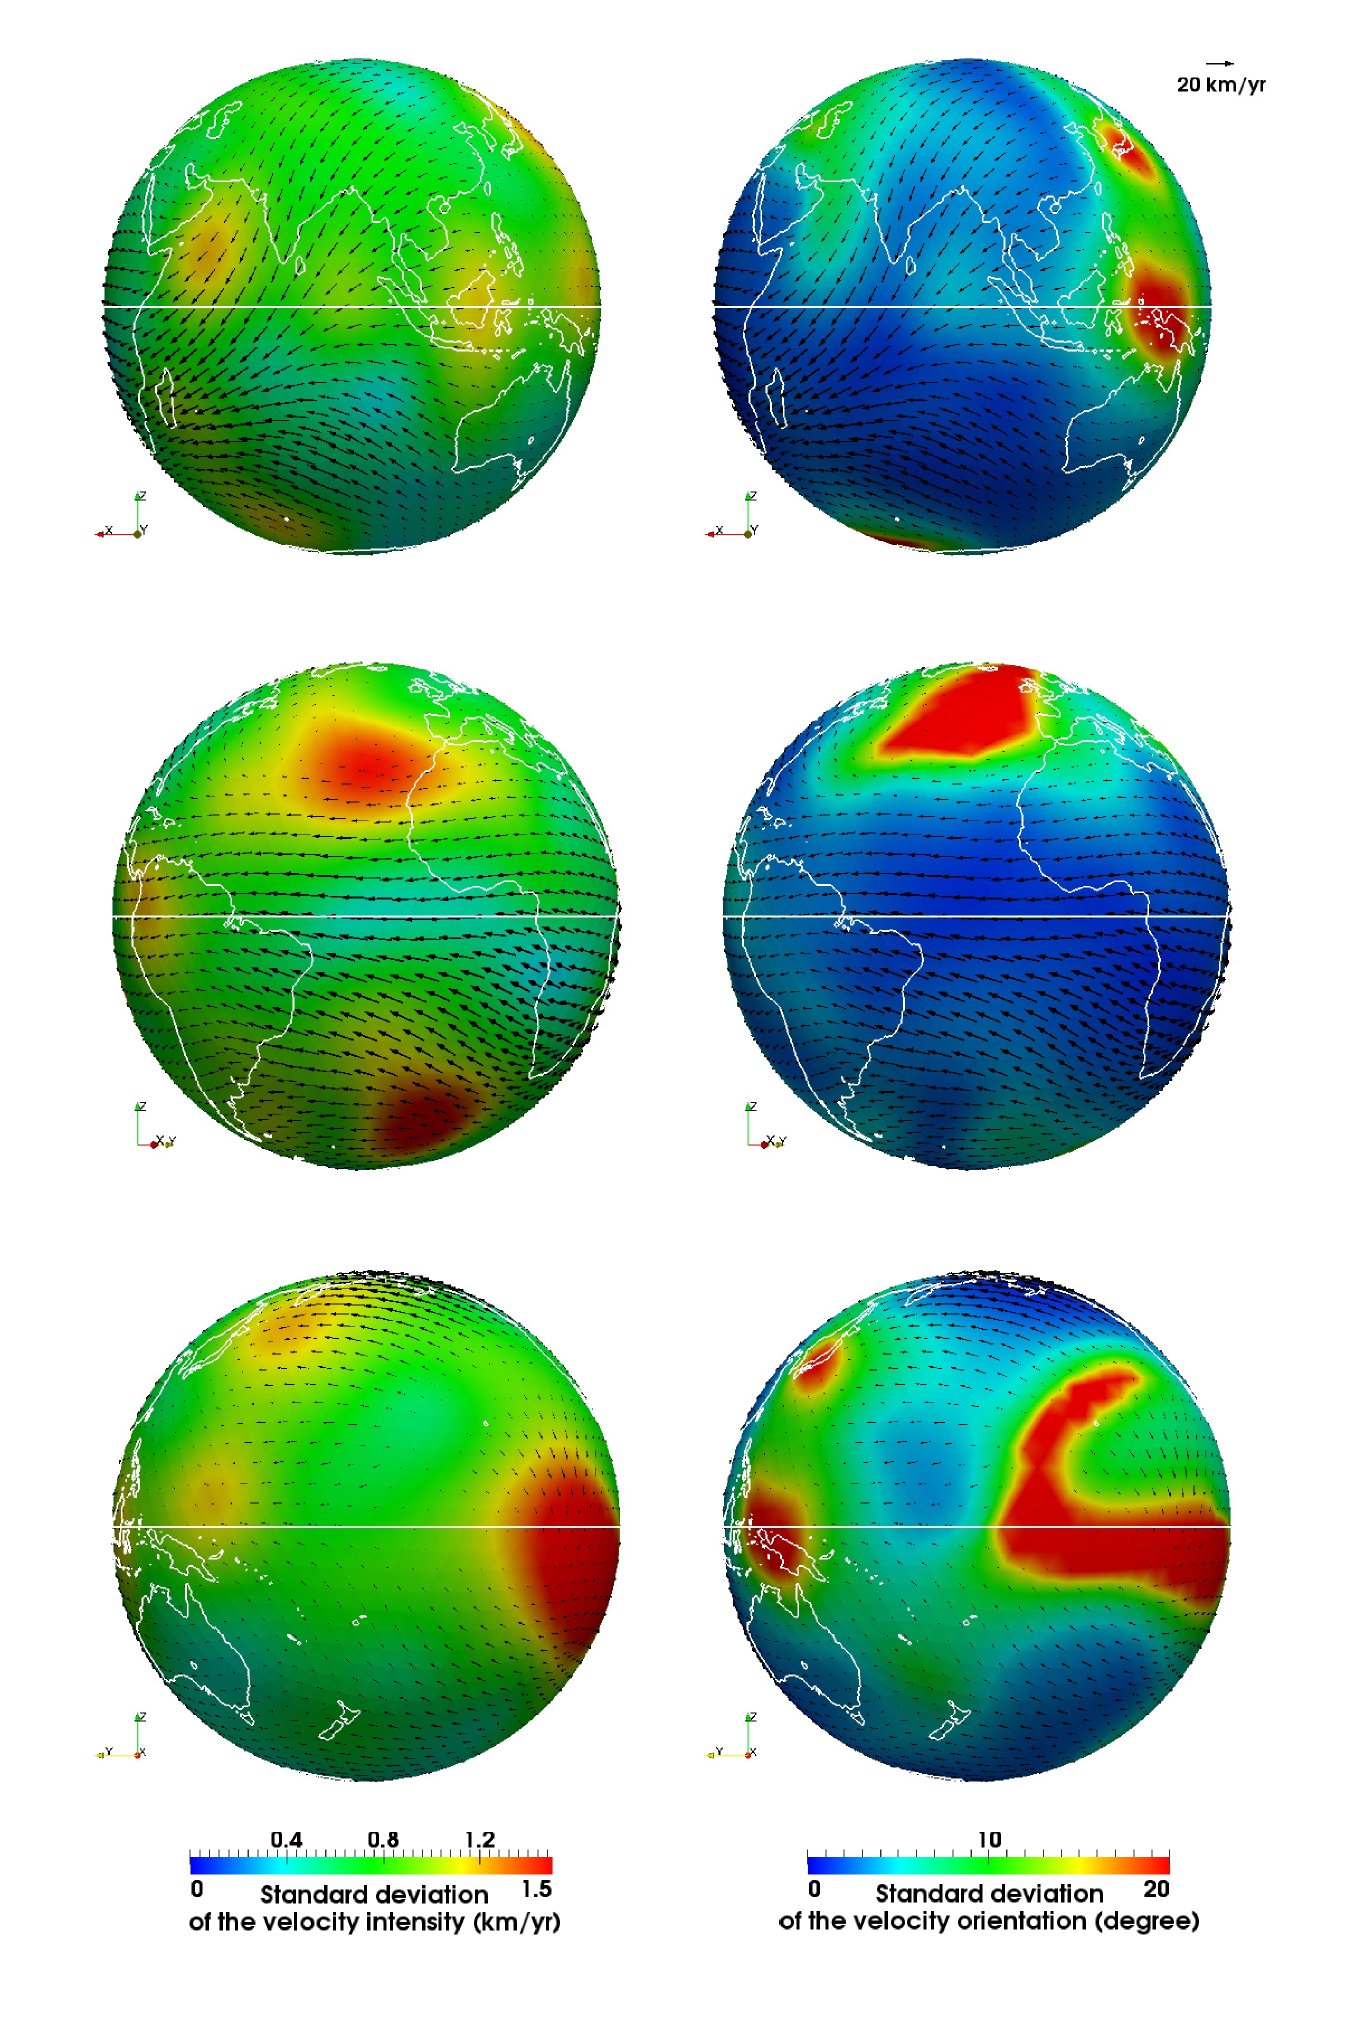
Possessing the full posterior distribution of the VF allows to extract many useful information on the flow. In particular the uncertainties on the velocity field intensity and orientation (with respect of course to the prescribed modelization) can be evaluated at any spatial location on the grid. To compute the standard deviation of the velocity field intensity we followed the protocol given in section III.2.1, whereas the standard deviation of the velocity orientation , is derived from the formula:
| (94) |
where is the angle, in degree, between the velocity field and . The quantities and , are displayed in figure 10 (on the left for the and on the right for the ). This figure first shows that a strong (resp. weak) uncertainty on the intensity coincides with a strong (resp. weak) uncertainty on the orientation of the flow. Secondly one can notice that the uncertainties are not homogeneously distributed on the surface of the CMB. While the planetary scale eccentric gyre seems to be very robust, the VF at the level of the Pacific ocean is much more uncertain. It is known that in this latter area the magnetic field activity is moderate (Hulot et al. (2002)). As a consequence the secular variation is low, and its associated uncertainties, due to the inaccuracy of the measurements and to the interactions between the unresolved MF and the VF, may be larger than the signal itself. It is therefore very difficult to evaluate the velocity field in this region. Nevertheless, this maps shows that there is a large part east of Australia and around the longitude of New-Zealand where the VF can be accurately estimated. Another particular feature can be noticed at the level of the North-Atlantic ocean, where the uncertainties on both the flow intensity and orientation are very large. As already questioned by Finlay et al. (2010), the robustness of the clockwise gyre usually observed in this area by models assuming Tangential-Geostrophy seems to be very weak according to our results.
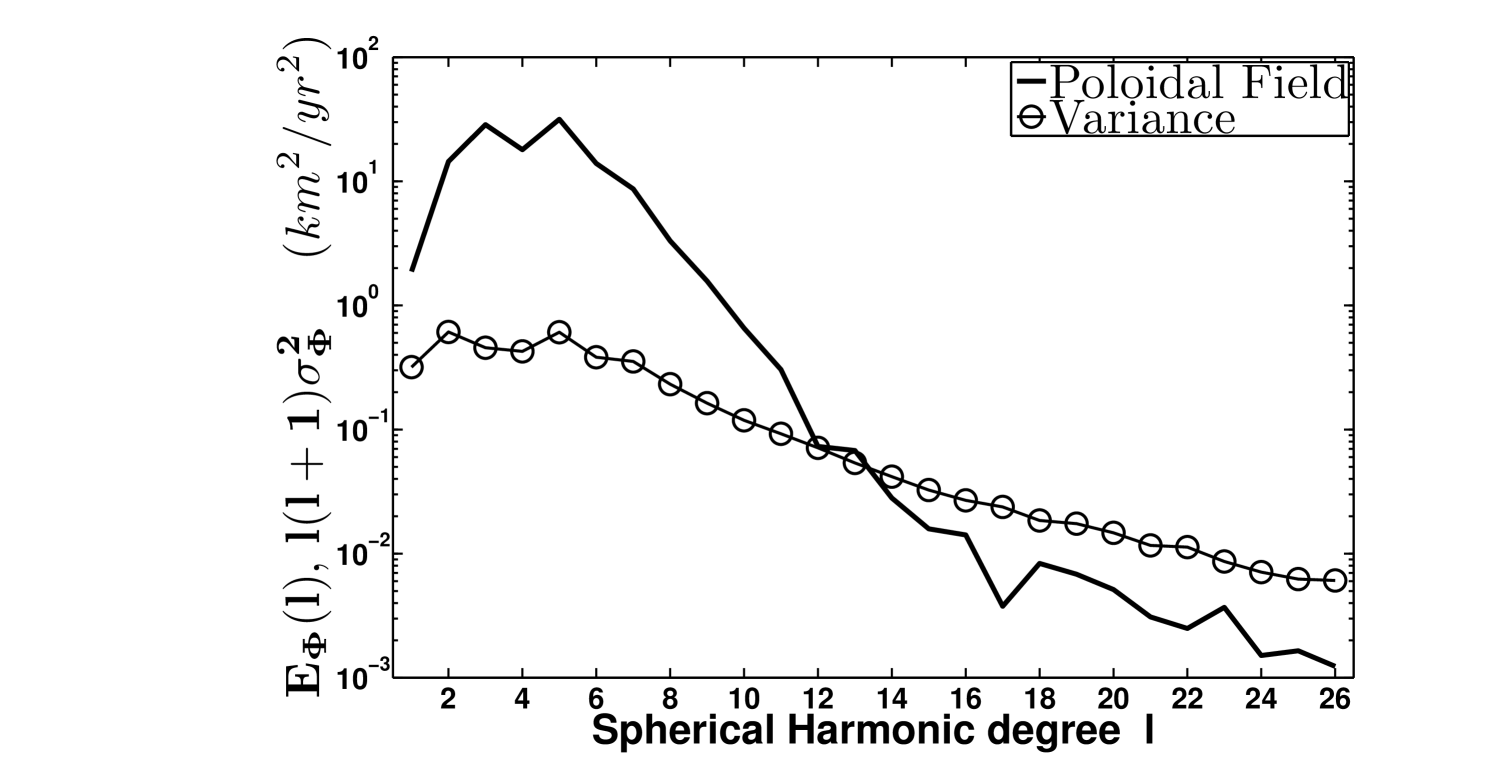
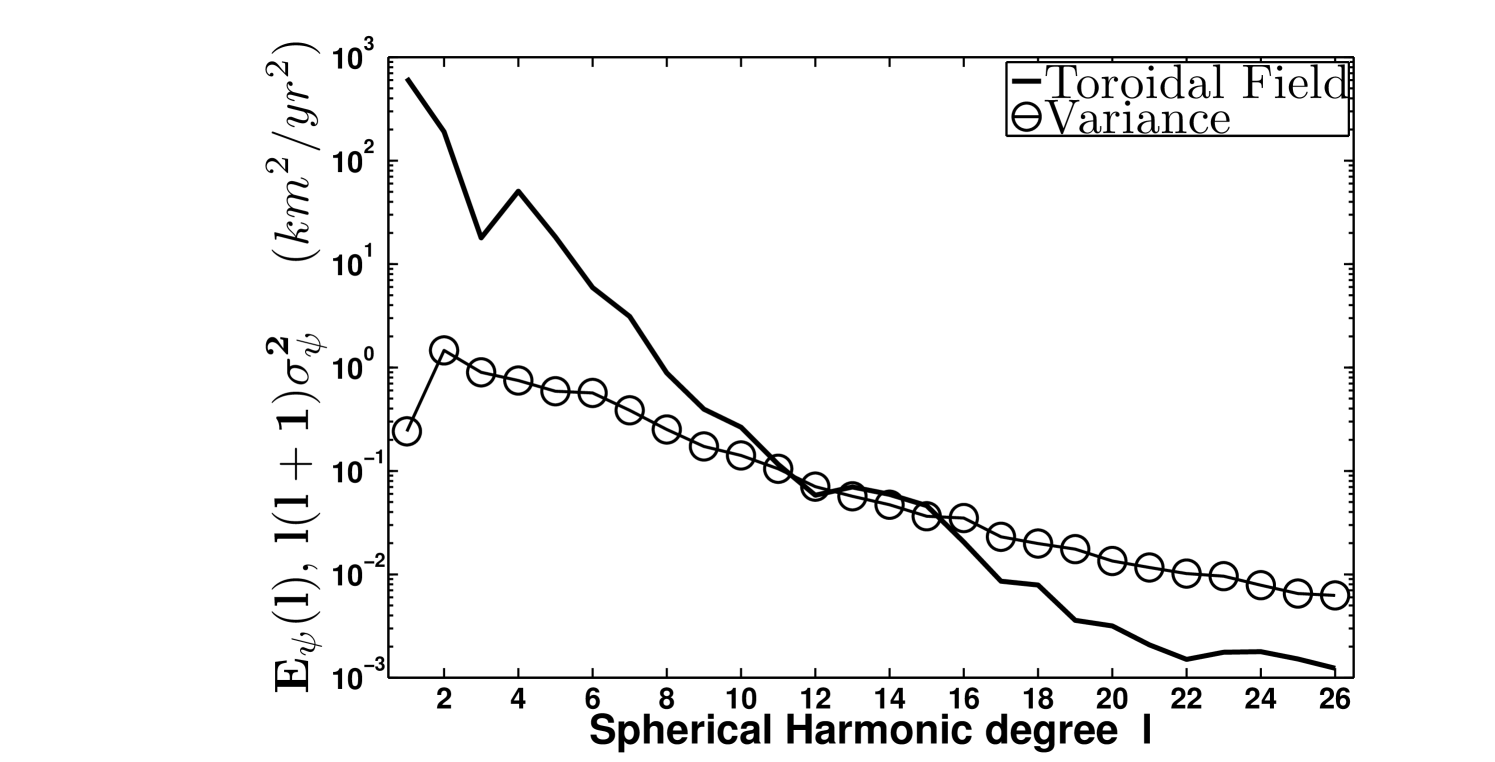
Since we are using truncated MF and SV it may be interesting to investigate the spectral properties of the posterior VF. The poloidal and toroidal part of the VF are expanded in spherical harmonics. The resulting fields are respectively referred as and . The same operation is performed on , with and its poloidal and toroidal SH coefficients. In figure 11 are plotted the spectra associated with and as well as the variance on these coefficient summed up over the order and rescaled by the factor . We can observe that the largest scales of the flow are dominated by the toroidal field. A computation of the poloidal and toroidal energy shows that more than of the total energy is of toroidal nature. The other information which can be extracted from figure 11 is that, as for the synthetic test we realized previously, above the SH degree , the intensity of the flow uncertainties becomes larger than the intensity of the flow itself. As a consequence the evaluation of the small scale velocity field cannot be considered as reliable.
It has to be emphasized that all the results we obtained are conditioned by the choice of the prior information imposed to the flow, and should not be considered as absolute. In particular the globally low level of uncertainties on the flow solution is certainly a consequence of the strong regularization we employed.
IV Conclusions
In this study we have presented a new method to determine the velocity field at the Earth’s core mantle boundary according to an outer core magnetic field and secular variation model. We showed that using an appropriate dynamical equation to prescribe the large scale magnetic field evolution in the inverse problem, permitted to reduce the modeling errors arising from the truncated nature of the available fields. We also demonstrated that the Bayesian formalism we developed to account for the large scale uncertainties on the magnetic field and to model the unresolved small scale MF, allowed to properly describe the inverse problem as soon as the information introduced a priori were accurate. Through the evaluation of our method and the comparison with other approaches, we could indirectly confirm that the unresolved part of the magnetic field contributed significantly to the observed secular variation, and that its modelization was necessary to obtain a more accurate description of the flow at the core mantle boundary.
When we applied our method to real data, provided by the GRIMM 2 model for the epoch , we could recover many features of the flow already observed in previous studies where a different prior information on the velocity field had been considered. In particular we could retrieve the planetary-scale eccentric gyre characteristic of flow evaluated under the compressible quasi-geostrophy assumption (see Pais and Jault (2008); Gillet et al. (2009)). Nevertheless, according to our simulation, the flow is crossing the equator below India and the intensity of the westward drift is the larger in the southern hemisphere, indicating that the equatorial symmetry imposed by the quasi-geostrophy hypothesis is broken. Through this observation one can conclude that deviations from quasi-geostrophy should be allowed to occur when this latter constraint is imposed in the inverse problem. Another specificity of the velocity field we obtained is its very smooth spatial behavior. This property is certainly induced by the prior distribution of the velocity field we chose, since this latter imposes a very steep spectrum to both the poloidal and toroidal part of the velocity field.
Finally, thanks to the ensemble of velocity field we generated to map the posterior distribution, we could evaluate the uncertainties associated with the flow solution of the inverse problem. According to our results, whereas on the one hand, the robustness of the flow is questioned in many area, and particularly in almost the entire Pacific ocean, and in the northern part of the Atlantic ocean, on the other hand, the planetary-scale eccentric gyre seems to be a very robust structure. From the evaluation of the uncertainties in spectral space, we concluded that the flow at the CMB could only be accurately estimated at large scales (between spherical harmonics degree and ).
Appendix A Spherical diffusion
In Cartesian space, applying a Gaussian filter to a scalar or a vector field, or letting the field evolve through a diffusion process can be interpreted as being similar operations. Indeed, the kernel of the Gaussian filter is:
| (95) |
where corresponds to the spatial dimension, is the filter width, and is a constant usually set to . The solution of the diffusion equation:
| (96) |
where is a diffusion coefficient and the time, is the convolution between the scalar field , and the Green function:
| (97) |
So if one sets , diffusing a scalar field through equation (98) is equivalent to filtering that field with the convolution kernel expressed in (95). Based on this observation, Bülow (2004) derived a Gaussian-like filter on the surface of a sphere of radius , by determining the convolution kernel of the spherical diffusion equation:
| (98) |
which reads:
| (99) |
where is the spherical harmonic of degree and order . So in spectral space, the filtering operation of a scalar field expanded in spherical harmonics:
| (100) |
simply reduces to the operation:
| (101) |
Appendix B Discretization of the Core Mantle Boundary
B.1 Construction of the grid
The grid describing the Core Mantle Boundary is obtained by recursively subdividing an initial icosahedron as explained in Baumgardner and Frederickson (1985); Stuhne and Peltier (1999). For each grid refinement procedure, a node is added in the middle of the geodesic arc linking every two neighboring points. The refinement degree of the grid corresponds to the number of time this procedure has been applied. Therefore corresponds to the icosahedron itself which possess nodes, and spherical triangle cells. As the refinement degree increases, the number of grid points and cells increases as:
| (102) | |||||
| (103) |
To approximate differential operators, a Voronoi-based finite volume method is chosen. This approach has been widely used in advection-diffusion problems such as in Heikes and Randall (1995); Lazarov et al. (1996); Satoh et al. (2008) and has proven to be efficient to tackle these kind of problems. Since in finite volume methods, differential operators are converted to surface integrals, control volumes (or Voronoi cells) surrounding each grid points have to be defined.
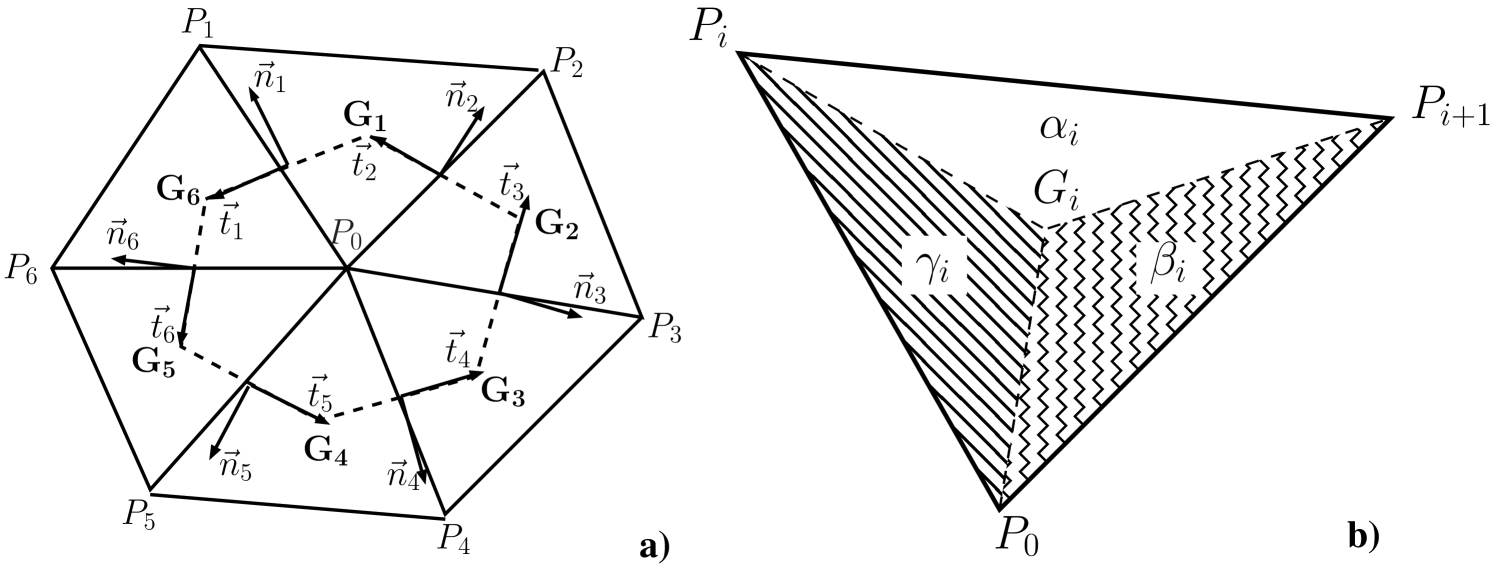
As shown in figure 12 a), each grid point is surrounded by (or when the point corresponds to a generator of the initial icosahedron) nodes in its direct neighborhood. From this cluster of node, one can build an ensemble of spherical triangle cells all connected together by the common vertex . Taking the gravity center of each cell allow then to draw a hexagonal (or pentagonal) volume control around the central node .
Tomita et al. (2001); Du et al. (2003b) have shown that moving the grid points in a manner that they coincide with the gravity center of their control volume, allows to improve the accuracy of the differential operators to the second-order. The procedure employed here is the Constrained Centroidal Voronoi Tessellations(CCVT) developed by Du et al. (2003a). The principle of this procedure as we implemented it, known as the Lloyd’s method, is the following:
-
(1)
starting with an initial distribution of nodes on the sphere, taken here as the different subdivision of the icosahedron, as explained previously in this part.
-
(2)
building the Voronoi cells associated with each grid point.
-
(3)
moving each node to the gravity center of the cell it is belonging to.
-
(4)
returning to Step 2 until some convergence criteria is reached. In our case, we imposed that the averaged geodesic distance between the node and the gravity center of the Voronoi cell has to be smaller than .
B.2 Approximation of the differential operators
The horizontal divergence and curl applied to a vector field , and the gradient applied to a scalar field can be expressed in their integral form as:
| (104) | |||||
| (105) | |||||
| (106) |
where the control surface as an area , delimited by the contour , and the unit tangential and normal vector to the contour are respectively and .
On the discrete sphere, vector and scalar fields are known on the nodes, therefore, to differentiate them, one need to approximate them on the contour of the Voronoi cells. First the different quantities are evaluated on the corners of the cells:
| (107) | |||||
| (108) |
where the areas , , are shown in figure 12 b).
Then, following the notation of figure 12 a) the discrete approximation of the different differential operators becomes:
where corresponds to the area of the control volume, is the geodesic length between the points and , and is the number of vertices of the control volume. Note that when the subscript then .
References
- Velímský (2010) J. Velímský, Physics of the Earth and Planetary Interiors 180, 111 (2010).
- Roberts and Scott (1965) P. H. Roberts and S. Scott, Journal of Geomagnetism and Geoelectricity 17, 137 (1965).
- Lesur et al. (2010) V. Lesur, I. Wardinski, M. Hamoudi, and M. Rother, Earth, Planets, and Space 62, 765 (2010).
- Eymin and Hulot (2005) C. Eymin and G. Hulot, Physics of the Earth and Planetary Interiors 152, 200 (2005).
- Backus (1968) G. E. Backus, Royal Society of London Philosophical Transactions Series A 263, 239 (1968).
- Holme (2007) R. Holme, in Treatise on Geophysics, edited by E. in Chief:Gerald Schubert (Elsevier, Amsterdam, 2007), pp. 107 – 130, ISBN 978-0-444-52748-6.
- Finlay et al. (2010) C. C. Finlay, M. Dumberry, A. Chulliat, and M. A. Pais, Space Science Reviews 155, 177 (2010).
- Chulliat and Hulot (2000) A. Chulliat and G. Hulot, Physics of the Earth and Planetary Interiors 117, 309 (2000).
- Hulot et al. (1992) G. Hulot, J. L. L. Mouël, and J. Wahr, Geophysical Journal International 108, 224 (1992).
- Gillet et al. (2009) N. Gillet, M. A. Pais, and D. Jault, Geochemistry, Geophysics, Geosystems 10, Q06004 (2009).
- Pais and Jault (2008) M. A. Pais and D. Jault, Geophysical Journal International 173, 421 (2008).
- Hulot et al. (2002) G. Hulot, C. Eymin, B. Langlais, M. Mandea, and N. Olsen, Nature 416, 620 (2002).
- Buffett and Christensen (2007) B. A. Buffett and U. R. Christensen, Geophysical Journal International 171, 145 (2007).
- Roberts et al. (2003) P. H. Roberts, C. Jones, and A. Calderwood, Earth’s Core and Lower Mantle pp. 100–129 (2003).
- Voorhies (2004) C. V. Voorhies, Journal of Geophysical Research 107, 5034 (2004).
- Sagaut (2006) P. Sagaut, Large Eddy Simulation for Incompressible Flows: An Introduction, Scientific Computation (Springer, 2006), ISBN 9783540263449.
- Lesieur (2008) M. Lesieur, Turbulence in Fluids, Fluid Mechanics and Its Applications (Springer, Berlin, 2008), ISBN 1402064357, 9781402064357.
- Baerenzung et al. (2008a) J. Baerenzung, H. Politano, Y. Ponty, and A. Pouquet, Physical Review E 77, 046303 (2008a), eprint 0707.0642.
- Baerenzung et al. (2008b) J. Baerenzung, H. Politano, Y. Ponty, and A. Pouquet, Physical Review E 78, 026310 (2008b), eprint 0803.4499.
- Fabre and Balarac (2011) Y. Fabre and G. Balarac, Physics of Fluids 23, 115103 (2011).
- Sun and Su (2007) O. S. Sun and L. K. Su, in APS Division of Fluid Dynamics Meeting Abstracts (2007), p. K6.
- Bülow (2004) T. Bülow, Transactions on Pattern Analysis and Machine Intelligence 26 (2004).
- Driscoll and Healy (1994) J. R. Driscoll and D. M. Healy, Advances in Applied Mathematics 15, 202 (1994).
- Leonard (1974) A. Leonard, in Turbulent Diffusion in Environmental Pollution (1974), pp. 237–248.
- Jackson (1995) A. Jackson, Physics of the Earth and Planetary Interiors 90, 145 (1995).
- Bayes (1763) T. Bayes, Phil. Trans. of the Royal Soc. of London pp. 370–418 (1763).
- Bloxham (1988) J. Bloxham, Geophysical Research Letters 15, 585 (1988).
- Jackson et al. (1993) A. Jackson, J. Bloxham, and D. Gubbins, Washington DC American Geophysical Union Geophysical Monograph Series 72, 97 (1993).
- Finlay and Amit (2011) C. C. Finlay and H. Amit, Geophysical Journal International 186, 175–192 (2011).
- Thebault and Vervelidou (2013) E. Thebault and F. Vervelidou, submitted to Physics of the Earth and Planetary Interiors (2013).
- Mosegaard and Rygaard-Hjalsted (1999) K. Mosegaard and C. Rygaard-Hjalsted, Inverse Problems 15, 573 (1999).
- Rygaard-Hjalsted et al. (2000) C. Rygaard-Hjalsted, K. Mosegaard, and N. Olsen, in Methods and Applications of Inversion, edited by P. Hansen, B. Jacobsen, and K. Mosegaard (Springer Berlin Heidelberg, 2000), vol. 92 of Lecture Notes in Earth Sciences, pp. 255–275, ISBN 978-3-540-65916-7, URL http://dx.doi.org/10.1007/BFb0010296.
- Sukoriansky et al. (2002) S. Sukoriansky, B. Galperin, and N. Dikovskaya, Physical Review Letters 89, 124501 (2002).
- Gamerman and Lopes (2006) D. Gamerman and H. F. Lopes, Markov Chain Monte Carlo: Stochastic Simulation for Bayesian Inference, Chapman and Hall/CRC Texts in Statistical Science Series (Taylor & Francis, 2006), ISBN 9781584885870.
- Lesur et al. (2013) V. Lesur, I. Wardinski, and K. Whaler, in IAGA Scientific Assembly (2013).
- Baumgardner and Frederickson (1985) J. R. Baumgardner and P. O. Frederickson, SIAM Journal on Numerical Analysis 22, 1107 (1985).
- Stuhne and Peltier (1999) G. R. Stuhne and W. R. Peltier, Journal of Computational Physics 148, 23 (1999).
- Heikes and Randall (1995) R. Heikes and D. A. Randall, Monthly Weather Review 123, 1862 (1995).
- Lazarov et al. (1996) R. Lazarov, P. Mishev, and P. Vassilevski, Journal of Numerical Analysis 33, 31 (1996).
- Satoh et al. (2008) M. Satoh, T. Matsuno, H. Tomita, H. Miura, T. Nasuno, and S. Iga, Journal of Computational Physics 227, 3486 (2008).
- Tomita et al. (2001) H. Tomita, M. Tsugawa, M. Satoh, and K. Goto, Journal of Computational Physics 174, 579 (2001).
- Du et al. (2003b) Q. Du, M. Gunzburger, and L. Ju, Computational Methods in Applied Mechanics and Engineering 192, 3933 (2003b).
- Du et al. (2003a) Q. Du, M. Gunzburger, and L. Ju, Journal of Scientific Computation 24, 1488 (2003a).