Beyond the adiabatic limit in systems with fast environments:
a -leaping algorithm
Abstract
We propose a -leaping simulation algorithm for stochastic systems subject to fast environmental changes. Similar to conventional -leaping the algorithm proceeds in discrete time steps, but as a principal addition it captures environmental noise beyond the adiabatic limit. The key idea is to treat the input rates for the -leaping as (clipped) Gaussian random variables with first and second moments constructed from the environmental process. In this way, each step of the algorithm retains environmental stochasticity to sub-leading order in the time scale separation between system and environment. We test the algorithm on several toy examples with discrete and continuous environmental states, and find good performance in the regime of fast environmental dynamics. At the same time, the algorithm requires significantly less computing time than full simulations of the combined system and environment. In this context we also discuss several methods for the simulation of stochastic population dynamics in time-varying environments with continuous states.
I Introduction
The modelling of dynamical systems in biology and other disciplines necessarily requires simplifying assumptions and a level of coarse graining. If all processes we know about are included, then the model becomes so complicated that it cannot be simulated or analysed. Even if simulation or analysis is possible further study of such a model will rarely be enlightening. Excessive detail makes hard to identify the key mechanisms at work and to understand what model components are responsible for these mechanisms. At the same time, some element of realism must be maintained. The model must not be so stylised to miss the key ingredients and behaviour it is meant to capture. The principal challenge, therefore, is to find the right level of detail, given the intended purpose.
The choice between stochastic and deterministic modelling approaches is one aspect of this discussion. If more detailed stochastic models mark one end of the spectrum, then many traditional models in mathematical biology or chemistry sit at the opposite end. These models are often built on a small number of ordinary or partial differential equations (e.g. Murray (2002, 2003)). This deterministic approach is valid if one can assume that the same initial conditions will always lead to the same outcome. For many applications involving very large systems this is a perfectly sensible approach.
However, it is now also universally recognised that stochasticity in the time-evolution of many systems is key in shaping the outcome, see e.g. Goel and Richter-Dyn (2004); Ewens (2004); Traulsen and Hauert (2010). Consequently a number of analytical and computational methods has been developed for the study of stochastic systems. One focus is on systems with discrete interacting individuals. What these individuals represent depends on the context, they could be members of different species in population dynamics, individual animals or humans in models of an epidemic, or molecules in chemical reaction systems Goel and Richter-Dyn (2004); Castellano et al. (2009); Keeling and Rohani (2008); Kampen (2007).
One particular point of interest within this class of individual-based systems are models operating in a time-dependent environment. This environment is not part of the system proper, but its state has an effect on what happens in the system. In a model of a population of bacteria for example, the reproduction or death rates could depend on external conditions such as the availability of nutrients or the presence of toxins Acar et al. (2008); Patra and Klumpp (2015). In population dynamics, the carrying capacity could vary in time Wienand et al. (2017, 2018); Taitelbaum et al. (2020), and in epidemics the infection rate is subject to seasonal changes Black and McKane (2010). The focus of our paper is on such individual-based models in time-varying external environments.
Analytical approaches to stochastic systems with discrete individuals usually start from the chemical master equation. In limited cases direct solution is possible, for example using generating functions. However, this is the exception, and a number of approximation schemes have consequently been developed. These include Kramers–Moyal and system-size expansions, leading to Fokker–Planck equations and descriptions in terms of stochastic differential equations Kampen (2007); Gardiner (2004). These schemes sacrifice the granularity of a discrete-agent system, and instead describe the dynamics in terms of continuous densities. This approach can be successful in particular for large populations. Any particular event then only results in a small change in the composition of the population relative to its size. Individual-based approaches and descriptions based on deterministic differential equations been extended to models of population dynamics in switching environments, for a selection of work see Kussell and Leibler (2005); Kepler and Elston (2001); Thattai and Van Oudenaarden (2004); Swain et al. (2002); Assaf et al. (2013a); Duncan et al. (2015); Assaf et al. (2013b); Ashcroft et al. (2014); Wienand et al. (2017); West et al. (2018); Assaf et al. (2008); Hufton et al. (2019a).
There are however situations in which one would rather avoid giving up the discrete nature of the population. For example, granularity is crucial for extinction processes (the number of individuals of the species about to go extinct is small by definition). In other situations the population may not be large enough to warrant a description in terms of continuous densities. For example, copy numbers in genetic circuits can be of the order of tens to hundreds (see e.g. Eldar and Elowitz (2010)), and it is difficult to justify a continuum limit. It then becomes necessary to carry out numerical simulations of the discrete individual-based process. The method of choice is the Gillespie algorithm (Gillespie, 1976, 1977), generating a statistically accurate ensemble of sample paths of the continuous-time dynamics.
In most applications the rate of events scales with the size of the population so that each individual experiences an number of reactions per unit time. The Gillespie method then runs into difficulties when the population is large, and with it the number of reactions per unit time. The computational cost of generating sample paths to up the desirable end point can then become very high. Similarly, a time scale separation between the dynamics in the population and the environment may make simulations challenging. If the environment is very fast compared to the population, a significant number of environmental events needs to be executed between events in the population. This aggravates the above limitations for large populations, and simulations can become problematic even for intermediate population sizes. One possible approach to this consists of assuming that the environment is ‘infinitely’ fast compared to the population. This is known as quasi steady state approximation Bowen et al. (1963); Segel and Slemrod (1989), or the ‘adiabatic limit’ Lin and Buchler (2018a); Hufton et al. (2019a). For related work see also Newby and Bressloff (2010); Ashcroft et al. (2014); Bressloff (2016, 2017a, 2017b). If this limit is taken then the environmental dynamics can be ‘averaged out’, and effective reaction rates can be used for the population. While computationally convenient, this approach discards any stochasticity from the environmental process. This sets another limitation, in particular when it is not valid to assume that the environment is infinitely fast compared to the population.
The objective of this work is therefore to design and test an algorithm for systems with fast environmental dynamics, but which also captures some elements of the environmental noise. We call this discrete-time algorithm FE – -leaping for fast environments. It is built on the ideas of the conventional -leaping algorithm (Gillespie, 2001), but with modifications such as to preserve elements of the stochasticity of the environmental process. To do this, we assume that the environment is fast compared to the population, but not infinitely fast. More precisely, in each step of the algorithm we take into account sub-leading contributions in the time-scale separation.
The key new element of our algorithm is how we deal with the environment. We do not take the adiabatic limit, instead we treat the reaction rates in the population as random variables during each step. The rates are drawn from a distribution at the beginning of each step, and then remain fixed during the time step. The distribution of rates can change from one step to the next, and is constructed to reflect statistical features of the original environmental dynamics.
Each step of the FE algorithm consists of two parts: First a realisation of reaction rates is drawn from the appropriate distribution. Then a conventional -leaping step is carried out with these rates. The core of our paper consists of the construction of the ‘appropriate distribution’ for the reaction rates. These ideas were introduced in a previous work Hufton et al. (2019b) for a simple case of a two-species birth-death process in an environment which can take two discrete states. In the present paper we develop this further. We develop and test a more general algorithm for environments with more than two discrete states. As we will show, the algorithm can also be extended to continuous environmental dynamics.
The remainder of the paper is organised as follows. In Sec. II we describe the general setup of the type of system we simulate. We also outline the general principles of the FE algorithm. In Sec. III we then make the necessary preparations for the introduction of the algorithm. In particular, we compute the statistics of reaction rates which are fed into the conventional -leaping step. We then describe the algorithm in detail. In Sec. IV, we test the FE algorithm in different models with discrete environmental states. In Sec. V, we then describe how the FE algorithm can be used when the environment takes continuous states. Specifically, we consider an Ornstein-Uhlenbeck process. In this context we also describe how known algorithms can be adapted to simulate continuous environments. Finally, we provide a discussion of our results and overall conclusions in Sec. VII.
II Model setup and general principles of the algorithm
II.1 Model definitions and notation
We look at systems composed of discrete individuals. We will refer to this synonymously as the ‘system proper’, or ‘the population’. Each of the individuals is of one of species (or types), labelled . We write for the number of individuals of species in the population, and . The system evolves in an external environment, whose state we write as . These states are time dependent, and can either take discrete values or be continuous.
The dynamics in the population proceeds through reactions . Each of these reactions converts a number of individuals from one type into another. Time in the model is continuous, and we assume that the dynamics is Markovian. We then write for the rate of reaction if the environment is in state and the population in state . The stoichiometric coefficient indicates how the number of individuals of type changes when a reaction of type occurs. Each is an integer, which can be negative, zero, or positive. We write . The rates and the stoichiometric coefficients fully specify the dynamics of the population when the environment is in state .
The state of the environment undergoes a Markovian stochastic process, governed by a master equation if states are discrete or by a stochastic differential equation in the case of continuous environmental states. These dynamics can depend on the state of the population . If the environmental states are discrete we write for the probability of finding the environment in state at a particular point in time, given that units of time earlier it was in state . If the environment is continuos then is a probability density for (at given ). We call the transition kernel of the environmental process. We write for the stationary distribution of the environmental dynamics. For discrete environmental states the entries denote the probability of finding the system in state in the stationary state. For continuous environments is the stationary probability density for .
II.2 General principles of the -leaping algorithm for systems in fast environments
A conventional reaction system (without external environment) is governed by a chemical master equation of the form
| (1) |
The notation is as in Sec. II.1, the only difference is that there is no subscript , as there is no environment. Sample paths entail events (reactions) which can occur at any point in continuous time, separated by exponentially distributed random waiting times. In each such event the state of the system changes, and accordingly the reaction rates can also change. Sample paths can be generated for example using the celebrated Gillespie algorithm (Gillespie, 1976, 1977).
The -leaping algorithm for such conventional reaction systems is built around the idea of keeping reaction rates constant over finite time steps of length Gillespie (2001). That is to say, if the state of the population is at time , then the assumption is made that this state and the rates do not change until the end of the time step. The algorithm does not account for potential changes of the rates as individual reactions occur, and instead directly ‘leaps’ to time . This is justified provided the so-called ‘leap condition’ is fulfilled Gillespie (2001): broadly speaking the time step must be sufficiently small so that the state in the continuous-time system does not change significantly in a time interval of length .
Making the approximation of constant in the time interval from to , the number of reactions of type that fire in this interval follows a Poissonian distribution with parameter . Accordingly, realisations of Poissonian random variables are drawn, and the corresponding numbers of each reactions are executed simultaneously. This generates a new state at time , with entries . The process then repeats with updated rates .
The idea of the -leaping algorithm we introduce for systems in external environments is similar. As in the conventional algorithm we discretise time, and keep the composition of the population fixed during each iteration. It is only updated at the end of each step. From now on we use for the duration of a step instead of .
The difference to the conventional case is the external environment. If the environmental state space is discrete then switches of the environment can in principle be simulated in continuous time along with the other reactions (using Gillespie algorithm (Gillespie, 1976, 1977)). They can also be dealt with by means of the conventional -leaping algorithm, again along with the other reactions. These are natural simulation approaches when the environment operates on a similar time scale as the reactions in the population. Not much can then be gained by distinguishing between environmental processes and the dynamics in the system proper.
If the environment is infinitely fast compared to the reactions in the population, then the environment reaches stationarity on very short time scales. One can average over environmental states, see for example Bowen et al. (1963); Segel and Slemrod (1989); Newby and Bressloff (2010); Bressloff and Newby (2014); Hufton et al. (2019b, a). If the environment is discrete, for example, we can use average rates
| (2) |
In the case of continuous environments the sum is to be replaced with an integral. These rates are functions of only, the environmental process has been averaged out. Noise from the environmental process plays no role in the dynamics if these average rates are used. This corresponds to making a quasi-stationary state approximation for the fast-moving environment Bowen et al. (1963); Segel and Slemrod (1989).
The aim of this paper is to go beyond this adiabatic limit, and to construct a -leaping algorithm which captures some elements of extrinsic noise. We focus on the limit of a fast, but not infinitely fast environmental dynamics.
Broadly speaking the FE algorithm is constructed around the idea of treating the reaction rates as stochastic variables in each discrete time step. These random variables represent the rates one obtains when averaging the environmental process over the time step . Assuming that the rate of change of the environment is finite these average rates will remain stochastic. In the limit of infinitely fast environments the deterministic limit in Eq. (2) is recovered, and there is no stochasticity from the environment.
To construct the random reaction rates for each step, we make an approximation: we use a Gaussian distribution for the rates, with means as in Eq. (2) and with variances and correlations derived from the original combined process of the population and environment. We describe this in detail in the next section.
III Construction of the FE algorithm for systems with discrete environments
III.1 Preliminary analysis of the environmental process
Here we assume the environmental states are discrete, . The dynamics of the environment is governed by the rates for transitions from to . The factor is introduced to control the time-scale separation between reactions in the population and the switching of the environment. We use the notation for the matrix with elements . We also set . The combined dynamics of population and environment are then described by the master equation
| (3) |
The rates can depend on the state of the population, . This means that and do not necessarily evolve in time independently. However, as mentioned above the state of the system is kept constant during each -leaping step. This in turn means that the transition rates for the environment also remain constant during each step.
We now focus on one such time step, starting at time and ending at . We assume that remains constant during this time interval. For the remainder of Sec. III.1 we suppress the potential dependence of on , although it is always implied. We write for the probability that the environment is in state at time . We then have the master equation
| (4) |
for the environmental dynamics. The stationary distribution for the environment is the solution of . If depends on , then will also be a function of . Assuming that the environmental process is irreducible this stationary distribution is unique for any one .
The stochastic matrix has one zero eigenvalue, which we write as . The remaining eigenvalues are denoted by . We then have . The corresponding (right) eigenvalues are written as (the eigenvector corresponding to eigenvalue ), and respectively for the remaining eigenvectors. These are all understood to be column vectors of length .
We note that the general solution of Eq. (4) can be written in the form
| (5) |
with coefficients determined by the initial condition at the beginning of the time step . More precisely these coefficients can be obtained from the linear system
| (6) |
We remark that there are coefficients, (). The system in Eq. (6) technically consists of equations, but these are not independent due to normalisation of the probabilities on the right-hand side.
Calculating the probability to find the environment in state at the end of the time step if it was in at the beginning of the step is now mainly a matter of computing the coefficients . We write for the value the coefficient takes when (i.e., when the system starts in state at the beginning of the step).
We then have
| (7) |
where is the -entry of the eigenvector of .
If the matrix depends on the population state , the parameters and can also depend on . For simplicity of notation we have not included this potential dependence in the above equations.
III.2 Time-averaged reaction rates as random variables
The -leaping algorithm proceeds in discrete time intervals of length . We continue to focus on one such interval . The state of the population at the beginning of the step is and we assume that this state does not change until the end of the interval. We do however take into account the fact that the state of environment can undergo changes in the interval from to . As a consequence, (at fixed is also a function of time.
We then introduce the time-averaged quantities
| (8) |
noting that the time average is over the duration of the time step only as opposed to a long-term asymptotic time average. Given that the time step is finite () and assuming that the environment fluctuates with finite rates (), the quantity is a stochastic variable as it depends on the realisation of the environmental process. In one given time interval, the rates for different will be correlated as they all derive from the same path of the environment. As we will show below, the fluctuations of the random variables in any one time step are inversely proportional to to leading order. In the limit the become deterministic.
We assume that the distribution for at the beginning of the time step is the stationary distribution . This is the case for example, if then environmental state is drawn from the stationary distribution at the beginning of the simulation. The distribution for is then also the stationary distribution at each time . Writing for the average over realisations of the environmental process, we then have
| (9) |
with as in Eq. (2).
However, () will generally be correlated with . Neglecting these means to operate in the adiabatic limit. We would like to retain some of these correlations. In order to compute second moments we first use Eq. (8). This leads to averages of the type , where and are two times in the interval from to . The second moments can then be expressed in terms of as follows
| (10) |
III.3 Description of the algorithm
Without loss of generality, we assume that only the rates for the reactions () depend on the environmental state .
The FE algorithm with time step proceeds as follows:
-
1.
Initiate the population in state . Set time to .
- 2.
-
3.
(i) First consider the reactions with rates dependent on the environment: Draw correlated Gaussian random numbers such that , and . If for any set .
(ii) For the remaining reactions set . These are the reactions with rates independent of the environment. -
5.
Draw independent Poissonians random numbers , , each with parameter .
-
6.
Update the state of the population, .
-
7.
Increment time by and go to 2.
We note that the mean of the in step 3(i) is of order , and their variance of order . Truncation of the will therefore only be required very rarely when .
Evaluating the expressions in Eqs. (2) and (13) in step 2 requires eigenvalues of the transition matrix for the environment, the eigenvectors, (including the stationary distribution ), and the coefficients for all . If the environmental process is independent of the state of the population (the are not functions of ), then these quantities do not depend on , and only need to be calculated once at the beginning.
IV Application of the FE algorithm to models with discrete environmental states
We now consider three examples of systems with discrete environmental states.
The first example (Sec. IV.1) is a genetic circuit. The role of the environment is here played by a process of binding and unbinding to promoters of the genes described by the model. Gene regulatory systems can exhibit time scale separation as discussed for example in Gunawardena (2014); Buchler et al. (2003); Lin and Buchler (2018b). Mathematically the model describes a population with two types of individuals and an environment with two states (bound/unbound). The environmental dynamics depends on the state of the population.
The second example (Sec. IV.2) is a toy model with two species in the population and three environmental states. The environmental process in this example is independent of the state of the population.
Sec. IV.3 finally focuses on a bimodal genetic switch with two species in the population, and an environmental process with three states, and with rates which depend on the state of the population.
IV.1 Genetic circuit: two system-independent environments, two species
This system models the dynamics of two genes, which produce two different regulatory proteins: X (a transcription factor) and Y (an inhibitor that titrates into an inactive complex). Specifically, we use the activator-titration circuit described in Lin and Buchler (2018a). The reactions are as follows:
| (14) |
where the denote states of the environment . These two environmental states represent situations in which a transcription factor is bound to the promoter of gene (state ), or no transcription factor is bound (), respectively. The first two reactions in Eq. (14) describe the production of the two proteins ( and ). The production rates are and . The former is independent of the environmental state, the latter explicitly depends on (i.e., on the presence or absence of a bound transcription factor). The reactions in the second line of Eq. (14) describe degradation of and , and the reaction in the third line captures titration. The binding and unbinding processes of the transcription factor are described by the reactions in the last line. The parameter in the reaction rates determines the typical number of particles in the system, for further details see Lin and Buchler (2018a). We write for the number of -particles in the system, and similarly is the number of -particles. One finds in the stationary state.
Mathematically, the model consists of two species in the population (with numbers of particles ), and two environmental states, . We therefore have . Eqs. (9) and (13) can be evaluated explicitly for this case, see also Hufton et al. (2019b). The only process affected by the state of the environment is the production of , with rate . This rate becomes a (clipped) Gaussian random variable in the FE algorithm, with first moment
| (15) |
and with variance
| (16) |
Further details of the derivation can be found in Appendix B.
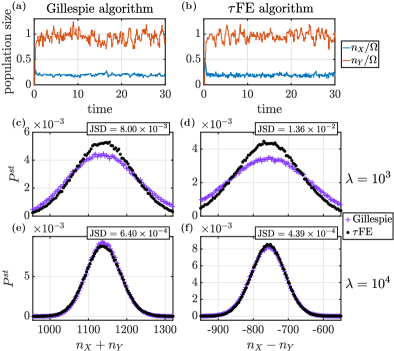
Simulation results for this model are shown in Fig. 1. In panels (a) and (b) we illustrate typical sample paths obtained from Gillespie simulations of the full model (population and environment), and from the FE algorithm, respectively. We also show the stationary distributions for the quantities and as obtained from both simulation algorithms. The distributions in panels (c) and (d) are for (i.e., moderately fast environmental dynamics), there are then remaining discrepancies between the FE algorithm and simulations of the full model. In panels (e) and (f) the time-scale separation is larger (). The agreement improves as indicated by the Jensen-Shannon divergence (JSD) Fuglede and Topsoe (2004); Lin (1991) given in the figure.
We note at this point that the average CPU time to run a sample path up to time with parameters as in Fig. 1 (e) and (f) is seconds for the Gillespie algorithm, and seconds for the FE algorithm (with a time step ). These average simulation times are obtained from ten runs. They indicate that the FE algorithm can significantly increase efficiency while producing results of the quality shown in Fig. 1. We stress that our primary interest is the relative comparison of computing times, and not on absolute simulation times 111For completeness, we add that simulations were performed on a MacBook Pro (Mid 2014), with processor 2.6 GHz Dual-Core Inter Core i5, and memory 8 GB 1600 MHz DDR3..
IV.2 Birth-death process: three environments, two species
Next, we consider a two-species birth-death process subject to an external environment which can be in one of three different states. This is a toy model chosen for illustration and does not represent any specific natural system. However, it captures elements of models of population dynamics.
The species in the population are labeled and , and the environmental states . Particles of type are produced with rate , and particles of type with rate . The subscript indicates explicit dependence on the state of the environment. Particles are removed with constant per capita rates and respectively. The parameter again sets the typical size of the population. We write and for the number of individuals of either species. The environmental states cycle stochastically through the sequence , with rate constants , and for the three transitions. Mathematically, the reactions in this model are
| (17) |
where as before denotes the environment. The rates and are constant parameters, independent of the population state.
Details of the calculation of the average rates and their second moments can be found in Appendix C. The average production rates for the two types of particles are
| (18) |
while the covariance takes the form
| (19) |
with
| (20) |
and , for . The variance , is obtained by replacing all instances of on the right-hand side of Eq. (19) with . The analog is obtained similarly by replacing with .
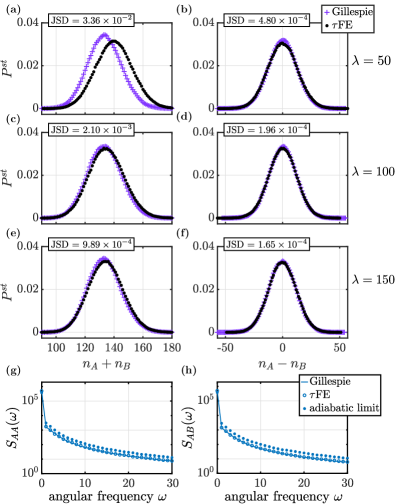
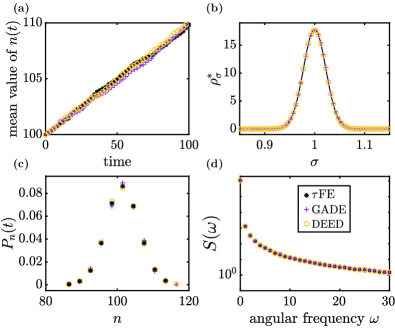
In Fig. 2 we report results from numerical simulations for this model, both from conventional Gillespie algorithm of the full systems of environment and population, and using the FE algorithm. Panels (a)–(f) show the stationary distributions of and . As seen from the data for example in panel (a) the FE algorithm displays deviations from Gillespie simulations of the full model when the environmental process is not sufficiently fast. We quantify these deviations again through the Jensen–Shannon divergence between the two distributions. The deviations reduce as the time scale separation is increased, i.e., when the environmental process becomes faster relative to the dynamics within the population.
In order to examine if the FE algorithm accurately reproduces dynamical features (i.e., properties of the system beyond the stationary distribution), we show spectral densities of the time series for and in Fig. 2(g) and (h). The spectral densities are defined as
| (21) |
where and are the Fourier transforms of and , respectively. The dagger denotes complex conjugation. The data from the FE algorithm (open symbols) in Fig. 2(g) and (h) compares well with spectra obtained from direct Gillespie simulations of the full model (solid lines). This shows the FE method indeed captures the dynamics of and . We also provide a comparison against the spectral densities obtained from conventional leaping simulations in the adiabatic limit, i.e., simulations with constant rates and for the production events [Eq. (18)]. These are shown as full markers in Fig. 2(g) and (h). One then finds more substantial systematic deviations. This is because environmental fluctuations are discarded in the adiabatic limit. The FE algorithm on the other hand captures the stochasticity of the environment to sub-leading order in in each iteration step.
IV.3 Bimodal genetic switch: three system-state dependent environments, two species
We now consider a model studied in Lin et al. (2018); Hufton et al. (2019a), describing a single gene with a promoter site which can bind to a total of up to molecules of protein. The number of protein molecules bound, , plays the role of the environment in this setting. The rate for transitions from to depends on the number of protein molecules. The reactions in this model can be summarised as follows,
| (22) |
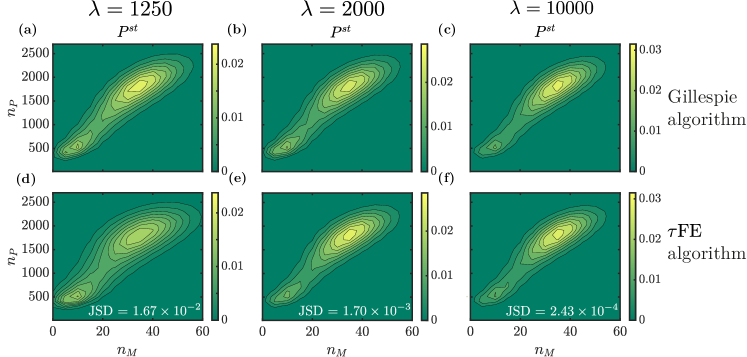
where and refer to molecules of mRNA and protein, respectively. The production rate for mRNA depends on the number of protein molecules bound to the promoter. We refer to Lin et al. (2018); Hufton et al. (2019a) for further details. In the following we write and for the numbers of particles of either type. One interesting feature of this model is that the distribution of the protein and mRNA populations can become bimodal, as illustrated in Fig. 3. This leads to bistability, with trajectories transitioning between the two modes of the joint distribution of and . Hence, the model describes a genetic switch.
In this model only the production rate of mRNA molecules is affected by the state of the environment. The average mRNA-production rate is found as
| (23) |
with . The second moment of the production rate takes the form
| (24) |
with
| (25) |
Details of the calculation leading to Eqs. (23) and (24) can be found in Appendix D.
Figure 3 shows the stationary joint distribution of the number of mRNA and protein molecules for different values of the time-scale separation parameter . The figure shows data from Gillespie simulations of the full model [panels (a)–(c)], and data from the FE algorithm [panels (d)–(f)]. The FE algorithm captures the distribution profile with two local maxima. For low values of (i.e., a relatively slow environmental process) the distribution obtained from FE tends to be wider than those from the Gillespie algorithm. The agreement improves for faster environments, as indicated again by the Jensen–Shannon distances in Fig. 3.
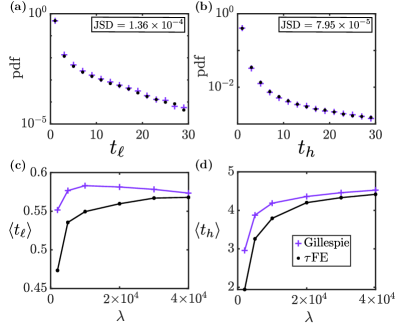
In Fig. 4, we show the distribution and means of the sojourn times and near the lower and higher modes of the stationary distribution. More precisely this is the time between entering and leaving a designated region around each of the modes. The lower maximum of the stationary distribution is sharper than the upper maximum (Fig. 3). Accordingly, we have chosen a smaller region at the lower mode than at the upper mode. For the lower mode, we use the region , which encloses the mode at . For the higher mode we use the region , enclosing the mode at .
The data shown in the figure is constructed from one long sample path (run until ), recording the points in time at which the system enters or leaves either region. Gillespie simulations operate in continuous time and the FE algorithm in discrete time. In order to remove any artefacts resulting from this difference, the same time resolution () is used in both algorithms for the measurement of arrival and departure times. Because the lower mode is sharper than the upper maximum and because the sizes of the two detection regions are different the sojourn time at the lower mode is found to be smaller than that at the higher mode, .
The distributions of sojourn times in Figs. 4 (a) and (b) indicate that the FE algorithm captures this dynamic quantity, provided the environmental process is sufficiently fast. This is confirmed in panels (c) and (d), where we show the mean sojourn times as a function of the relative speed of the environment compared to the population dynamics. As seen in both panels, the FE algorithm generates accurate measurements of the mean sojourn times and in the limit .
At the same time, stochastic effects due to the random environmental process are captured for large but finite . This can be seen in Fig. 4 (d): the mean sojourn time drops significantly as the environmental process becomes slower, and hence additional noise is injected into the population (there is no environmental noise in the adiabatic limit). While there are quantitative differences compared to exact simulations, the FE algorithm captures this reduction of . Panel (c) reveals that there are also limitations to the precision of the FE algorithm. The mean sojourn time near the lower mode is affected much less by a reduction of the time-scale separation parameter than the mean sojourn time at the upper mode. This indicates that the escape from this region is driven mostly by intrinsic noise rather than by environmental stochasticity. While the data from the two algorithms remains within approximately for sufficiently fast environmental dynamics () the FE algorithm is unable to capture the small rise of observed in Gillespie simulations for intermediate values of .
| Gillespie | FE | |
| 1250 | 1.35 | 0.04 |
| 2500 | 1.89 | 0.08 |
| 5000 | 2.62 | 0.17 |
| 10000 | 4.30 | 0.31 |
| 20000 | 7.77 | 0.57 |
In Table 1 we compare the the computing time required for both the Gillespie algorithm and the FE method for different values of . The data in the table is the CPU time required to generate one sample path up to time , averaged over ten runs. The model parameters are as in Figs. 3 and 4.
The full model comprises the reactions in the population and the environmental switching. The rates for the former reactions are independent of , the rates for the latter scale linearly in . Accordingly, one expects the computing time for Gillespie simulations of the full model to be linear in , with a non-zero intercept. The data in the table is consistent with this. We note that Gillespie algorithm does not require any time discretisation.
The running time for the FE algorithm depends on the choice of the time step. The time step in turn affects the accuracy of the outcome. If is large, then FE simulations are fast, but the approximation to the continuous-time full model becomes less good. On the other hand the time step must not be too small, as the construction of the algorithm requires sufficient averaging of the environmental process in each step [Eqs. (11)–(13)]. The time step for the FE algorithm in Figs. 3 and 4, and in Table 1 is chosen inversely proportional to . This is to ensure that each time step captures a sufficient number of switches of the environmental state. Accordingly, we expect the computing time for the FE algorithm to scale linearly in , with no intercept. Again, the running times we measured in our simulations are consistent with this expectation. Overall, Table 1 shows that the FE algorithm is able to generate data of the accuracy as in Figs. 3 and 4 while reducing the computing effort approximately ten fold compared to full Gillespie simulations.
V Numerical simulation of continuous-environmental systems
V.1 Setup
We turn now to systems which are subject to an environment with continuous states. Specifically, we follow Assaf et al. (2013a) and assume that the environmental state follows an Ornstein–Uhlenbeck process (see also Roberts et al. (2015); Assaf et al. (2013b)),
| (26) |
where is Gaussian white noise of unit amplitude, in particular . The parameter is the average value of in the long run, whilst controls the magnitude of noise. As before, the parameter indicates how quickly the environment changes relative to the dynamics in the population; is the equivalent of in the notation of Assaf et al. (2013a).
The probability distribution of finding the environment in state at time , given that was in state at time , can be obtained from the Fokker–Planck equation for the Ornstein–Uhlenbeck process, and is given by (see e.g. Klebaner (2005); Risken (1996))
| (27) |
For (and fixed) this quantity tends to the stationary distribution
| (28) |
We note that it is not a requirement for the FE algorithm that the environment follows an Ornstein–Uhlenbeck process. However, both functions and are required, as discussed in more detail below.
We proceed to describe how the FE algorithm can be implemented for models with continuous environments (Sec. V.2).
In the case of discrete environments, continuous-time sample paths of the full model can be generated using the conventional Gillespie algorithm. This is an exact procedure: the ensemble of these sample paths faithfully describes the statistics of the full model. In Sec. IV we have used this as a benchmark to test the FE algorithm. We are not aware of any analogous exact simulation method for models of discrete populations in a stochastic environment with continuous states. In order to test the FE algorithm we therefore compare outcomes against those from approximation methods to generate paths of the combined set of the population and the environment. Several such methods exist, we describe these in Sec. V.3. The tests of the FE algorithm against the baseline of these methods are described in Sec. VI.
V.2 Implementation of the FE algorithm for continuous environments
We proceed similar to discrete case in Sec. III, replacing the sums over in Eqs. (2) and (10) with integrals. We then have
| (29) |
and the relation for the second moments turns into
| (30) |
Depending on the form of the stationary distribution , the kernel and the rates the integrals in Eqs. (29) and (30) can be carried out, and closed-form analytical expressions can be obtained. In Sec. VI we explore a number of different examples, further scenarios are also discussed Appendix F. Once the average rates and the second moments are calculated, the FE algorithm is implemented as described in Sec. III.3.
V.3 Conventional simulation approaches for discrete populations in continuous environments
In this section we summarise ‘conventional’ approaches to simulating discrete Markovian systems subject to environmental dynamics with continuous states. By ‘conventional’ we mean methods which produce explicit (approximate) sample paths of the environmental process. This is in contrast to the FE algorithm, which generates paths only of the system proper.
V.3.1 Gillespie algorithm with discretised environmental states (GADE)
This approach is based on a discretisation of the space of environmental states, time remains continuous. Once such a discretisation for the environmental states is carried out, the combined states of the population and environment are also discrete. Simulations can be carried out using the conventional Gillespie method. We will refer to this method as GADE (Gillespie approach with discretised environment).
The key step in this approach is to find an appropriate dynamics in the space of discretised environmental states. We describe this in the context of the Ornstein–Uhlenbeck process in Eq. (26). We discretise the environmental state into integer multiples of , i.e., the environment takes states . Transitions from one state can only occur to states . The transition rates are constructed such that this discrete process recovers the continuous Ornstein–Uhlenbeck dynamics in the limit . The details of the construction are described in Appendix E, we here only report the main outcome. Specifically, the rates to transition from state to can be chosen as
| (31) |
This process can then be simulated using the standard Gillespie algorithm, along with the events in the population. We note that the rates need to be non-negative, i.e., we require , for all . In practice, this can be achieved by truncating the set of possible states . More precisely, we disallow transitions out of the region , with a given cutoff . Provided that is sufficiently large truncations will only be required rarely. Once a cutoff is chosen we must require to guarantee non-negativity of the . The variance of the Ornstein–Uhlenbeck process for is given by in the long run [Eq. (28)], so is a sensible choice. This results in maximum value for which is also proportional to .
V.3.2 Discrete-time simulation with explicit environmental dynamics (DEED)
Approximate sample paths of the combined system of population and environment can also be generated in a discrete-time simulation. We refer to this as DEED (discrete-time simulation with explicit environmental dynamics). The time step needs to be sufficiently small to capture the details of the environmental process with characteristic time scale . We therefore require . One possible implementation is as follows:
- 1.
-
2.
Use and to calculate the rates for .
-
3.
Provided is small enough, the are all less than one. To lowest order in they are the probabilities that a reaction of type occurs in the next . For each implement one reaction of this type with probability . With probability no reaction of type occurs. Executing all reactions that fire, one obtains .
-
4.
Increment time by , and go to step 1.
Step 3 disregards the possibility that a particular reaction fires multiple times during one time step. This is a valid approximation, provided that the are much smaller than one. As an alternative step 3 could be replaced by a conventional -leaping step. The number of reactions of type that fire is then a Poissonian random variable with parameter .
V.3.3 Thinning algorithm by Lewis
A population subject to a dynamic external environment with continuous state space can also be simulated using the so-called thinning algorithm by Lewis Lewis and Shedler (1979). This algorithm generates a statistically faithful ensemble of sample paths for Markovian systems with discrete states and transition rates with explicit external time dependence.
In the context of our model the population is such a system. If the environmental dynamics is independent of the population then realisations for the environment can be generated in advance independently from the population. For instance, sample solutions of the Ornstein-Uhlenbeck process in Eq. (26) could be generated. Each such realisation then determines a realisation of time-dependent rates for the population. The Lewis algorithm can then be used to produce sample paths for the population dynamics.
In practice, numerical approximation schemes are required to generate realisations for the environment. For example, Eq. (26) can be solved numerically using the Euler–Maruyama method, with time step . As discussed above this time step needs to be sufficiently small () to resolve the short-time features of the environmental process. The Lewis algorithm then uses this as an input and generates sample paths for the population in continuous time.
VI Application of the FE to continuous-environmental models
In this section we test the FE algorithm on a number of different examples of models with continuous environmental states. Simulation outcomes are compared against those from the algorithms described in Sec. V.3.
VI.1 Toy model: Population dynamics with production and removal rates proportional to
We first consider a production-removal process for a single species. The environmental state follows the Ornstein–Uhlenbeck process in Eq. (26). The corresponding transition kernel is given in Eq. (27), and the stationary distribution in Eq. (28). The production rate in the population is assumed to be , and the removal rate . These are not chosen with any particular natural system in mind, instead this example serves as an illustration (see also Appendix F for similar calculations for two related examples).
From (29) we obtain
| (32) |
The second moments of the rates and can be calculated from Eq. (30). We find
| (33) |
for the covariance. The expressions for the variances are similar, with suitable replacements and in the prefactor in Eq. (33). This covariance matrix and the means in Eq. (32) are then used in the FE algorithm.
| GADE | DEED | FE | |
| 28.47 | 3.84 | 0.79 | |
| 53.20 | 7.88 | 0.16 | |
| 288.30 | 40.91 | 0.08 | |
| 576.69 | 82.78 | 0.15 | |
| 3022.47 | 397.63 | 0.79 |
Figure 5 shows simulation results from the FE algorithm, as well as from the GADE and DEED schemes (Secs. V.3.1 and V.3.2 respectively). Panel (a) shows that all simulation methods result in linear growth (parameters are such that , i.e., the growth rate is always larger than the death rate). Panel (b) confirms that GADE and DEED both generate the correct statistics for the stationary distribution of the environmental process [the solid line is the Gaussian distribution in Eq. (28)]. In panel (c) we focus on a fixed time , and show that all three simulation methods results in very similar distributions for the number of individuals in the population at that time. Panel (d) finally shows a dynamic quantity, the Fourier spectrum of the time series , or equivalently the Fourier transform of the correlation function of . Again, all three simulation methods produce very similar results.
In Table 2 we compare the average computing time required by the different algorithms to generate a trajectory up to time . We show data for varying values of the typical time scale of the environmental process. GADE does not require any discretisation of time. For the DEED approach we use . For the FE method we choose . This is in-line with the requirements for DEED, and for FE. The choice of time steps will be discussed in further detail below.
The data in the table indicates that the simulation time scales approximately linearly with for all three algorithms tested, provided is sufficiently large. This is to be expected: The rates for the environmental events in the GADE simulations (Sec. V.3.1) scale as , and therefore dominate the events in the population for . Each typical Gillespie step then advances time by an amount proportional to , and such steps are required to reach the designated end time. A similar argument applies to the DEED algorithm (Sec. V.3.2) and for the FE algorithm: For both of these we use time steps , so again the number of iteration steps required scales as .
The key message from Table 2 is that, for the choice of time steps made in the table, the computing time required by the FE algorithm is substantially lower than that for the other two simulation methods. Given the linear dependence on , this increase in efficiency can be extrapolated to environments operating on time scales faster than the smallest time scale shown in the table (i.e., to the range ). We note that, due to the smaller time step, DEED produces a finer resolution of sample paths in time than FE. When we make our comparison we have average macroscopic quantities in mind (such as those in Fig. 5), and not necessarily the generation of individual paths with the highest possible resolution in time.
We now briefly discuss the choice of time steps for the FE method and for DEED. In principle, we could have increased or decreased the step for either method. This would then reduce or increase the computing time required to reach the designated end point. It might also affect the accuracy of the outcome. Our choice of for FE is motivated by the good agreement with GADE in Fig. 5, noting that GADE does not require any discretisation of time. Similarly, for the example discussed below in Sec. VI.2 good agreement with analytical predictions is found for this choice, see the regime of small in Fig. 6. Our conclusion is therefore that the FE algorithm is able to produce results of the accuracy as in Fig. 5 with computing times as reported in Table 2.
The DEED algorithm requires to be able to resolve the environmental dynamics. Our choice in Table 2 is well below this requirement, and the algorithm can in principle be speed up by choosing a larger time step. If we were to exhaust the limit and used for DEED then this would reduce the computing time by about a factor of one hundred in Table 2. For for this would mean a reduction from approximately seconds to seconds per sample path. Using this larger time step also results in noticeable deviations in measurements of the quantities in Fig. 5 from continuous-time GADE simulations. But even if we accept this and use the hundred fold larger time step for DEED the FE algorithm would remain approximately five times faster, requiring seconds per sample path at , see Table 2.
We have also conducted tests with Lewis’ thinning algorithm. To do this we have first generated sample paths of the Ornstein–Uhlenbeck process for the environment [Eq. (26)] using an Euler–Maruyama scheme. This is then fed into the Lewis’ algorithm for systems with time dependent rates. Given that the typical time scale of the environment is , the largest sensible time step for the Euler–Maruyama scheme is , similar to DEED. This choice minimises the computing time for the Lewis’ approach. We therefore use this time step to compare the efficiency of the Lewis’ approach with that of FE. We find that the thinning algorithm is considerably slower than the FE approach. For , for example, we obtain a simulation time of approximately seconds per run up to compared to seconds for FE (see Table 2).
VI.2 Genetic switch with Hill-like regulatory function
As a final example we consider a model of protein production subject to a continuous environment discussed in Assaf et al. (2013a). The model entails positive feedback, in that the presence of protein has the potential to increase production of protein. There is one single species in the model (protein), we write the number of protein molecules as . We also define , where is again a model parameter setting the typical size of the system. The production rate of protein is given by
| (34) |
where and are constants, and where is the Heaviside function. Protein molecules also decay with unit rate. In the absence of environmental influence (), the production rate is thus unity when , and when . For the mean re-scaled number of protein follows the rate equation
| (35) |
where time is measured in units of generations. We choose . Eq. (35) has three fixed points , where and are attractors, and is a repeller. Similar to Assaf et al. (2013a), we refer to and as the ‘low’ and ‘high’ states, respectively.
The environmental process modulates the production rate when . As in Assaf et al. (2013a) we asssume that follows an Ornstein-Uhlenbeck process of the form given in Eq. (26). The noisy system has the potential to switch between the ‘high’ and ‘low’ states. To test the performance of the FE algorithm, we focus on the mean switching time (MST) to transit from the high state to the low state. This time is studied and calculated in Assaf et al. (2013a), we denote it by . In simulations we start the system in the high state, and measure the first time the system reaches the low state.
Only the production of protein is affected by the state of the environment, we write , with as in Eq. (34). Inserting this in Eqs. (29) and (30), and after straightforward calculations, we obtain
| (36) |
and the second moment
| (37) |
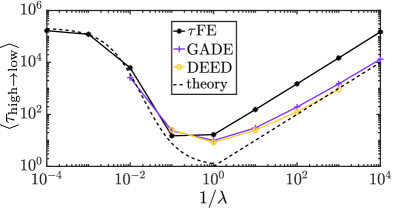
In Fig. 6 we show the MST measured in simulations using the different approaches described in in Sec. V. Assaf et al. Assaf et al. (2013a) report non-monotonous behaviour of the MST as a function of . As seen in Fig. 6 the FE algorithm reproduces this behaviour. For fast environmental dynamics (low ) the MST obtained from the FE algorithm is in good agreement with measurements obtained from the other simulation methods, and with the analytical approximations from Assaf et al. (2013a). The agreement extends over several decades of values of .
At the same time we observe that the FE algorithm requires significantly less computing time than the GADE or DEED approaches. For for example, we measured an average computing time of seconds to generate one run of the system up to time with the FE algorithm (). GADE required seconds, and DEED seconds (for a time step ).
We note that we have implemented DEED as described in Sec. V.3.2. In particular at most one reaction of each type can fire in each time step (step 3 of the algorithm). This requires a sufficiently small time step to ensure for all . This is achieved by our choice . Alternatively step 3 of the DEED algorithm could be replaced by a (conventional) -leaping step. Larger choices of the time step are then possible, up to the limit of to ensure that the environmental dynamics are captured appropriately. Focusing on we expect that increasing the time step by a factor of a thousand (from to ) would reduce the simulation time by at most a factor of a thousand for a -leaping version of DEED. This would result in a computing time of approximately for one simulation run up to instead of the seconds reported for DEED in the previous paragraph. This is comparable with the CPU time required by the FE algorithm ( seconds), but would resolve environmental fluctuations with lower accuracy. For example one observes systematic deviations for the stationary distribution of the environment in Fig. 5(b).
VII Discussion and conclusions
In summary, we have presented FE, a variant of the -leaping stochastic simulation algorithm for systems subject to fast environmental dynamics. Just like conventional -leaping the algorithm operates in discrete time. The rates of the reactions in the system proper are treated as constant during each time step, and the numbers of different reactions firing in one step have Poissonian statistics.
The key difference compared to conventional -leaping is the external environment. In the full continuous-time model reaction rates which depend on the environmental state fluctuate in time even when the state of the population does not change. An adiabatic approximation would consist of assuming an infinitely fast environment and of replacing the reaction rates by their means with respect to the stationary distribution of the environmental process. This is justified if the relaxation time scale of the environmental process is infinitely shorter than the time step of the simulation.
The FE algorithm goes beyond this approximation, and is based on time averages of reaction rates over the finite time step. For finite speeds of the environment these average rates are random variables. If the environmental dynamics is fast we can make a Gaussian approximation. The rates feeding into the -leaping step are clipped Gaussian random numbers designed to retain the first and second moments of the actual environmental dynamics. It is important to note that this not the same as drawing an environmental state from the stationary distribution , and then using the rates for the next -leaping step. Instead, the covariance matrix of the rates in Eq. (8) is calculated as described in Eqs. (10) for discrete environments, and in Eq. (30) for continuous environmental states.
The choice of time step for the FE algorithm requires careful consideration. On the one hand the time step must be long enough to justify the averaging procedure over the environmental dynamics and the Gaussian assumption for the reaction rates in the -leaping step. Broadly speaking must be sufficiently large (). At the same time the so-called leap condition for the -leaping part of the algorithm must be fulfilled (Gillespie, 2001). This means that the state of the system must not change significantly in each iteration step, as a constant state of the population is an assumption made in setting up the -leaping. Mathematically, this means that the change of the number of particles in the system in a time step must be much smaller than the typical number of particles in the system. Assuming that the stoichiometric coefficients do not scale with the system size this means that must be much smaller than . Noting that is of order in many applications we thus require that is much smaller than one. For and proportional to this condition is often relatively easy to meet in practice.
We have tested the FE algorithm on a number of systems with discrete and continuous environments. This includes examples of systems which can be addressed analytically and models motivated by applications in biology. Our tests focus on stationary distributions, but also dynamic features such as Fourier spectra of fluctuations or first-passage time distributions. In all cases we have tested the FE method produces good agreement with results from conventional simulation methods in the regime of fast environmental dynamics. This is the regime for which FE is designed. Naturally, quantitative deviations are found when the time scales of the environmental dynamics and system proper are insufficiently separated.
We stress that FE goes beyond simulations in the adiabatic limit, and is able to capture the dependence of macroscopic observables on the time scale separation, provided this dependence is sufficiently strong [see e.g. Figs. 4(d) and 6)]. At the same time our analysis also reveals limitations of the algorithm. If the dependence of observables on the time scale separation is weak such as in Fig. 4(c), then FE may not be able to fully resolve these dependencies. When the environment is fast the quantitative agreement with simulations of the full system is however still within approximately in the example in Fig. 4(c).
The computing time required for the FE algorithm to generate sample paths up to a designated end time is proportional to the inverse time step. The time step on the other hand is typically a multiple of the characteristic time scale of the environmental dynamics. This means that the computational effort scales approximately linearly in the time scale separation . In all cases we have tested we found that FE is considerably more efficient for the measurement of macroscopic quantities than alternative simulation algorithms.
In summary, we think the FE algorithm has passed the initial selection of tests presented in this paper. It provides an promising approach to probing the regime of fast environmental dynamics, and captures effects induced by extrinsic noise beyond the adiabatic limit. The algorithm is particularly valuable for systems in which the regime of intermediate time scale separation can be accessed with conventional simulation methods. The accuracy of the FE algorithm can then be assessed in this regime (an example can be found in Fig. 6). If the comparison is favourable, then it is justified to use FE in the regime of increasing time scale separation.
Acknowledgements
We would like to thank Yen Ting Lin (Los Alamos) for useful discussions and feedback on earlier versions of the manuscript. EBC acknowledges a President’s Doctoral Scholarship (The University of Manchester). TG acknowledges funding from the Spanish Ministry of Science, Innovation and Universities, the Agency AEI and FEDER (EU) under the grant PACSS (RTI2018-093732-B-C22), and the Maria de Maeztu program for Units of Excellence in R&D (MDM-2017-0711).
References
- Murray (2002) J. D. Murray, Mathematical Biology I. An Introduction, 3rd ed., Interdisciplinary Applied Mathematics, Vol. 17 (Springer, New York, 2002).
- Murray (2003) J. D. Murray, Mathematical Biology II: Spatial Models and Biomedical Applications, Interdisciplinary Applied Mathematics, Vol. 18 (Springer New York, 2003).
- Goel and Richter-Dyn (2004) N. S. Goel and N. Richter-Dyn, Stochastic Models in Biology (The Blackburn Press, 2004).
- Ewens (2004) W. Ewens, Mathematical Population Genetics 1 (Springer-Verlag, New York, 2004).
- Traulsen and Hauert (2010) A. Traulsen and C. Hauert, “Stochastic evolutionary game dynamics,” in Reviews of Nonlinear Dynamics and Complexity (Wiley-VCH Verlag GmbH and Co. KGaA, 2010) pp. 25–61.
- Castellano et al. (2009) C. Castellano, S. Fortunato, and V. Loreto, Reviews of Modern Physics 81, 591 (2009).
- Keeling and Rohani (2008) M. J. Keeling and P. Rohani, Modeling Infectious Diseases in Humans and Animals (Princeton University Press, 2008).
- Kampen (2007) N. V. Kampen, Stochastic processes in physics and chemistry (North Holland, 2007).
- Acar et al. (2008) M. Acar, J. T. Mettetal, and A. Van Oudenaarden, Nature Genetics 40, 471 (2008).
- Patra and Klumpp (2015) P. Patra and S. Klumpp, Physical Biology 12, 046004 (2015).
- Wienand et al. (2017) K. Wienand, E. Frey, and M. Mobilia, Physical Review Letters 119, 158301 (2017).
- Wienand et al. (2018) K. Wienand, E. Frey, and M. Mobilia, Journal of The Royal Society Interface 15, 20180343 (2018).
- Taitelbaum et al. (2020) A. Taitelbaum, R. West, M. Assaf, and M. Mobilia, Physical Review Letters 125, 048105 (2020).
- Black and McKane (2010) A. J. Black and A. J. McKane, Journal of Theoretical Biology 267, 85 (2010).
- Gardiner (2004) C. W. Gardiner, Handbook of stochastic methods for physics, chemistry and the natural sciences, 3rd ed., Springer Series in Synergetics, Vol. 13 (Springer-Verlag, Berlin, 2004).
- Kussell and Leibler (2005) E. Kussell and S. Leibler, Science 309, 2075 (2005).
- Kepler and Elston (2001) T. B. Kepler and T. C. Elston, Biophysical Journal 81, 3116 (2001).
- Thattai and Van Oudenaarden (2004) M. Thattai and A. Van Oudenaarden, Genetics 167, 523 (2004).
- Swain et al. (2002) P. S. Swain, M. B. Elowitz, and E. D. Siggia, Proceedings of the National Academy of Sciences (USA) 99, 12795 (2002).
- Assaf et al. (2013a) M. Assaf, E. Roberts, Z. Luthey-Schulten, and N. Goldenfeld, Physical Review Letters 111, 058102 (2013a).
- Duncan et al. (2015) A. Duncan, S. Liao, T. Vejchodskỳ, R. Erban, and R. Grima, Physical Review E 91, 042111 (2015).
- Assaf et al. (2013b) M. Assaf, M. Mobilia, and E. Roberts, Physical Review Letters 111, 238101 (2013b).
- Ashcroft et al. (2014) P. Ashcroft, P. M. Altrock, and T. Galla, Journal Royal Society Interface 11, 20140663 (2014).
- West et al. (2018) R. West, M. Mobilia, and A. M. Rucklidge, Physical Review E 97, 022406 (2018).
- Assaf et al. (2008) M. Assaf, A. Kamenev, and B. Meerson, Physical Review E 78, 041123 (2008).
- Hufton et al. (2019a) P. G. Hufton, Y. T. Lin, and T. Galla, Physical Review E 99, 032122 (2019a).
- Eldar and Elowitz (2010) A. Eldar and M. Elowitz, Nature 467, 167 (2010).
- Gillespie (1976) D. T. Gillespie, Journal of Computational Physics 22, 403 (1976).
- Gillespie (1977) D. T. Gillespie, The Journal of Physical Chemistry 81, 2340 (1977).
- Bowen et al. (1963) J. Bowen, A. Acrivos, and A. Oppenheim, Chemical Engineering Science 18, 177 (1963).
- Segel and Slemrod (1989) L. A. Segel and M. Slemrod, SIAM Review 31, 446 (1989).
- Lin and Buchler (2018a) Y. T. Lin and N. E. Buchler, Journal of The Royal Society Interface 15, 20170804 (2018a).
- Newby and Bressloff (2010) J. M. Newby and P. C. Bressloff, Bulletin of Mathematical Biology 72, 1840 (2010).
- Bressloff (2016) P. C. Bressloff, Physical Review E 94, 042129 (2016).
- Bressloff (2017a) P. C. Bressloff, Physical Review E 95, 012124 (2017a).
- Bressloff (2017b) P. C. Bressloff, Physical Review E 95, 012138 (2017b).
- Gillespie (2001) D. T. Gillespie, The Journal of Chemical Physics 115, 1716 (2001).
- Hufton et al. (2019b) P. G. Hufton, Y. T. Lin, and T. Galla, Physical Review E 99, 032121 (2019b).
- Bressloff and Newby (2014) P. C. Bressloff and J. M. Newby, Physical Review E 89, 042701 (2014).
- Hufton et al. (2016) P. G. Hufton, Y. T. Lin, T. Galla, and A. J. McKane, Physical Review E 93, 052119 (2016).
- Gunawardena (2014) J. Gunawardena, The FEBS Journal 281, 473 (2014).
- Buchler et al. (2003) N. E. Buchler, U. Gerland, and T. Hwa, Proceedings of the National Academy of Sciences (USA) 100, 5136 (2003).
- Lin and Buchler (2018b) Y. T. Lin and N. E. Buchler, Journal Royal Society Interface 15 (2018b).
- Fuglede and Topsoe (2004) B. Fuglede and F. Topsoe, in International Symposium on Information Theory, 2004. Proceedings. (2004) p. 31.
- Lin (1991) J. Lin, IEEE Transactions on Information Theory 37, 145 (1991).
- Note (1) For completeness, we add that simulations were performed on a MacBook Pro (Mid 2014), with processor 2.6 GHz Dual-Core Inter Core i5, and memory 8 GB 1600 MHz DDR3.
- Lin et al. (2018) Y. T. Lin, P. G. Hufton, E. J. Lee, and D. A. Potoyan, PLOS Computational Biology 14, 1 (2018).
- Roberts et al. (2015) E. Roberts, S. Be’er, C. Bohrer, R. Sharma, and M. Assaf, Physical Review E 92, 062717 (2015).
- Klebaner (2005) F. C. Klebaner, Introduction to stochastic calculus with applications (World Scientific Publishing Company, Singapore, 2005).
- Risken (1996) H. Risken, in The Fokker-Planck Equation (Springer, 1996) pp. 63–95.
- Maruyama (1955) G. Maruyama, Rendiconti del Circolo Matematico di Palermo 4, 48 (1955).
- Lewis and Shedler (1979) P. W. Lewis and G. S. Shedler, Naval Research Logistics Quarterly 26, 403 (1979).
Appendix A Second moments of rates
In this Appendix we calculate the second moments of the quantities () defined in Eq. (8). Without loss of generality we assume that the time interval in question starts at , the end point is then . Assuming the space of environmental states is discrete, we have
| (38) | |||||
In the first step we have applied the definition of the over-bar average [Eq. (8)]. In the third step we have carried out the average over realisations of the environmental process. In the last step we have renamed and in the second term. Therefore
| (39) |
Up to a shift of the start point of the time step, this is identical to Eq. (10).
As explained in Section V.2, the sums over become integrals when the environment takes continuous states. We then find Eq. (30).
When the environmental space is discrete, we can use Eq. (7) and find
| (40) |
Appendix B Further details for systems with two species and two environmental states
The case of two species and two environmental states () was studied in Hufton et al. (2019b), and a simple version of the FE algorithm was presented for this restricted case. We assume switches from state to state with rate , and from to with rate . The environmental transition matrix then becomes
| (41) |
whose eigenvalues are and . The respective eigenvectors take the form
| (42) |
where has been normalised to represent the stationary distribution for . The coefficients and are obtained from Eq. (6), for the initial conditions and . We find
| (43) |
Putting all together in Eq. (13), and after straightforward calculations we arrive at
| (44) |
where . The indices and stand for reactions affected by the environment. As explained in Section III.3, to simulate the FE algorithm we need to draw correlated Gaussian random numbers with means
| (45) |
for , and covariance matrix
| (46) |
One way to do this is by drawing independent Gaussian random numbers and with mean zero and unit variance, and then to set
| (47) |
with a matrix that fulfils , where denotes the transpose. This matrix is not unique. We use
| (48) |
Appendix C Birth-death process with two species and three environmental states
In the example in Sec. IV.2 we have the following transition matrix for the environmental process
| (49) |
The eigenvalues of this matrix are
| (50) |
with . The associated eigenvectors take the form
| (51) |
and
| (52) |
Using Eq. (6) and three sets of initial conditions (each concentrated on one environmental state) we find
| (53) |
as well as
| (54) |
and finally
| (55) |
Putting all together in Eqs. (2) and (13) and after further tedious but straightforward calculations, we arrive at the expressions in Eqs. (18) and (19).
In order to draw the correlated Gaussian random numbers and required for the -leaping step, we proceed as in Appendix B. We construct the covariance matrix [Eq. (46)] and then find a matrix such that . We then draw independent Gaussian random numbers and with mean zero and unit variance, and use an expresion analogous to that in Eq. (47) to obtain and . The matrix we use is
| (56) |
with and as given in Eq. (19), and
| (57) |
and
| (58) |
Appendix D Bimodal genetic switch
For the model in Sec. IV.3 the rates of the environmental transitions depend on the number of proteins in the population. We assume that remains constant during each -leaping step. The environmental transition matrix then becomes
| (59) |
with . The eigenvalues of this matrix are
| (60) |
while the associated eigenvectors take the form
| (67) |
Applying Eq. (6) for different initial conditions as above, we obtain
| (68) |
as well as
| (69) |
and finally
| (70) |
Putting this together in Eqs. (2) and (13) and after straightforward calculations, we arrive at the expressions in Eqs. (23) and (24).
Appendix E Gillespie algorithm with discretised environmental dynamics (GADE)
In this Appendix we briefly describe the constructions of the rates given in Eq. (31). They define a continuous-time dynamics on a discrete state space approximating the Ornstein–Uhlenbeck process in Eq. (26).
Matching the first moments of movements. We first look at the mean drift of , i.e., the mean change of per unit time. Suppose the environment is in a given state . The mean drift in the Ornstein–Uhlenbeck process [Eq. (26)] is then .
Suppose now the above discrete- process is in state . Then increases to with rate and decreases to with rate . The expected change (per unit time) is therefore .
We conclude that we need to impose
| (71) |
Matching the variance of movements. Next we look at the variance of movements of . For the Ornstein–Uhlenbeck process in Eq. (26) the second moment of movements (per unit time) is given by . In the discrete- process, the second moment of movements is . To match the Ornstein–Uhlenbeck process, we then need to impose
| (72) |
Appendix F Additional examples of production-removal processes in continuous environments
In this Appendix we include results for the variances and covariances for two further exemplar systems in which the environment follows the Ornstein–Uhlenbeck process in Eq. (26). We set for both examples. Both systems describe production and removal dynamics of a single species. In the first example, production and removal rates are proportional to when and zero otherwise. In the second example the rates are each proportional to . These examples are not used in the main paper, we report them here for completeness, as they may prove useful for future applications of the FE algorithm.
F.1 Rates
We look at the example , where is the Heaviside function, for and otherwise. For , we find
| (73) |
and
| (74) |
where Re() denotes the real part, and is the polylogarithm of order 2.
F.2 Rates
For this case (and setting again ), we find
| (75) |
and
| (76) |