Biases in the Facebook News Feed: a Case Study on the Italian Elections
Abstract
Facebook News Feed personalization algorithm has a significant impact, on a daily basis, on the lifestyle, mood and opinion of millions of Internet users. Nonetheless, the behavior of such algorithms usually lacks transparency, motivating measurements, modeling and analysis in order to understand and improve its properties. In this paper, we propose a reproducible methodology encompassing measurements and an analytical model to capture the visibility of publishers over a News Feed. First, measurements are used to parameterize and to validate the expressive power of the proposed model. Then, we conduct a what-if analysis to assess the visibility bias incurred by the users against a baseline derived from the model. Our results indicate that a significant bias exists and it is more prominent at the top position of the News Feed. In addition, we found that the bias is non-negligible even for users that are deliberately set as neutral with respect to their political views.
I Introduction
Online social networks (OSNs) are increasingly being used to share political opinion and news, particularly during election periods [24]. With almost 2 billion active users per month, Facebook is currently the largest OSN [10]. As any platform for media sharing, one of the core functions of Facebook is to organize the available information to improve user experience. To that aim, Facebook counts on a filtering and personalization product referred to as the News Feed algorithm [19].
In essence, the News Feed algorithm is a recommendation system that presents posts to users in their News Feed. However, unlike classical recommendation systems, e.g., for music and movies, the News Feed poses its own set of challenges. The News Feed needs to account for content continuously generated by multiple sources (publishers), and users typically do not provide explicit feedback about the recommendations. In addition, the News Feed algorithm may impact users that are usually unaware of its influence [16], e.g., by creating a filter bubble that reinforces the perceived users’ opinions [28]. Clearly, the News Feed algorithm influences the way political discourse is perceived, potentially creating biases towards sources and ultimately impacting how democracy works.
In this paper we take important steps towards measuring, modeling and analyzing the bias caused by the News Feed algorithm. We believe that a better understanding of the News Feed can be instrumental in the design of new filtering algorithms, which may eventually be actively controlled by users. Furthermore, obtaining this knowledge through public and reproducible measurements is key for increasing the awareness of users about the filtering of the content they consume.
The literature on the News Feed algorithm is vast, including measurements [9, 6, 7, 8], models [2, 12] and user awareness surveys [16]. Nonetheless, most of the prior work that quantifies the effect of OSNs on information diffusion [5, 4] relies on measurements obtained through restrictive non-disclosure agreements that are not made publicly available to other researchers and practitioners. As the data analyzed in such studies is very sensitive, and their sources are not audited, there are multiple potential factors and confounding variables that are unreachable to the general public. Our goal is to provide insights on the filtering that occurs in OSNs through a reproducible methodology and a dataset that we have made publicly available [1].
In this work, we propose a methodology that encompasses measurements and a model for the analysis of bias in OSNs. Our key contributions are summarized as follows.
A measurement methodology is introduced to publicly and transparently audit the OSN ecosystem, focusing on the Facebook News Feed algorithm. The methodology encompasses an Internet browser extension to autonomously and independently collect information on the posts presented to users by the News Feed algorithm (Section II). Such information is not available through the Facebook API.
Empirical findings are reported using data collected from a measurement campaign conducted during the 2018 Italian elections. We observed that the filtering algorithm tends to select information that is aligned with user’s perceived political orientation, this effect is more prominent at the topmost News Feed position and neutral users are also exposed to non-uniform filtering (Section III).
An analytical model is proposed to quantify the visibility and occupancy of publishers in the users News Feeds. The model allows us to conduct a what-if analysis, to assess the metrics of interest under different filtering mechanisms and is validated using data from the Italian election experiment (Section IV).
A model-based bias assessment is conducted using the Italian dataset. The dataset is used to parameterize the proposed model, and yields a baseline publisher visibility (i.e., without the influence of the News Feed algorithm). The measured visibility is then contrasted against the baseline to quantify the bias, i.e., how publishers’ occupancies are affected by user’s orientations as they are perceived by the News Feed algorithm (Section V).
II Measurement Methodology
The goal of our experiments is to assess the bias experienced by OSN users through a reproducible method. To this aim, we created controlled virtual users that have no social ties and that follow a preselected set of sources. By considering minimalistic user profiles, we can assess how preferences towards sources affect posts presented to users.
In what follows, we first introduce some basic terminology, followed by our data collection methodology, contrasting it against the state of the art. Finally, we present the metrics of interest which are evaluated in the remainder of this work.
II-A Terminology
Publisher is a source that publishes posts. Each publisher is associated to a public page, which contains all the posts published by that source.
News Feed is the personal page of a given Facebook user, which contains all the posts that Facebook suggests to that user, in an ordered list. We use the terms News Feed and timeline interchangeably. With some abuse of notation, News Feed also refers to the algorithm used by Facebook to recommend posts to users. The distinction between the ordered lists of posts and the algorithm used to fill such lists should be clear from the context.
A user who follows a publisher subscribes to that publisher to receive its posts. A user must follow a publisher to have post from the publisher’s page in the user’s News Feed. In our work, all bots follow the same set of preselected publishers.
A user who likes a page from a publisher automatically follows that page. A user likes a page to show general support for that page and its posts. In addition, a user can also like individual posts. In our work, users orientations are established by letting them like a subset of the preselected publishers, as well as posts from this subset of publishers.
II-B Data collection methodology
Next, we present our measurement methodology.
Select representative pages We preselect a set of representative public Facebook pages (publishers). This selection is subjective in nature, and must account for the classification of publishers into categories. In the case of political elections, representative pages include newspapers and the pages of the political parties.
Create representative virtual users We create representative virtual Facebook users which capture tendencies on the selected representative pages. Such users are also referred to as bots. Each bot follows all the preselected representative pages. In addition, each bot may have an orientation, which may be captured by one of a number of mechanisms provided by Facebook. For instance, a bot may 1) “like” a page, 2) “like” a post from a page or 3) “comment” posts from a page. We also consider a bot that does not have an orientation. We refer to it as undecided.
Collect snapshots and impressions Each bot kept open an Internet browser window (Firefox or Chrome) accessing the Facebook page. The bots were instrumented to collect data on the posts to which they were exposed. To that aim, a browser extension, named Facebook Tracking Exposed, or simply fbtrex [1] was developed. The extension auto-scrolls the Facebook window at pre-established instants of the day. Every auto-scroll produces a set of posts which are stored at a local database. Each set of posts is referred to as a snapshot. Typically, each bot is scheduled to collect thirteen snapshots per day. Each post appearing in a snapshot counts as a post impression. At each bot, Facebook Tracking Exposed collects all impressions and records their corresponding publisher, publication time, impression time, content, number of “likes” and number of shares.
Collect all published posts We also have a second dataset which contains the set of all posts published by the representative pages during the interval of interest, as provided by the Facebook API. This dataset is used to study what users would experience in the absence of filters, or in the presence of alternative filters.
Compute metrics of interest and analyze biases Bias is defined with respect to a baseline metric, which subsumes a model. A simple model is introduced in Section IV and the corresponding bias is reported in Section V.
Share datasets and scripts By sharing the datasets and scripts, we allow other researchers to reproduce the obtained results and to collect new data. We envision that the collective sampling and analysis of the News Feed is a key step towards building awareness and transparency.
II-C State of the art
Information about post impressions used to be available in a deprecated version of the Facebook API from 2015. In any case, that information was not necessarily reliable as recognized by Facebook itself [20]. For such reasons, we believe that fbtrex and the methodology described in this section constitute important building blocks to promote transparency in the Facebook ecosystem. Related work is further discussed in Section VI.
II-D Metrics of interest
Next, we define our key metrics of interest that will be obtained from the dataset generated by the experiment. We consider the top positions of the News Feed of each user. Let be the number of unique posts from publisher viewed at bot . Let be the number of snapshots taken by bot . Then, the measured effective arrival rate of publisher at bot is given by
| (1) |
Let be the number of impressions of publisher at bot . Let be the average number of posts of publisher in the top positions of the News Feed of bot . is given by
| (2) |
Let be the fraction of snapshots that contain at least one post from publisher in the top positions of the News Feed of user . We refer to and as the visibility and the occupancy of publisher at News Feed , respectively. The normalized occupancy is given by . The visibility and the normalized occupancy are two metrics of exposure of publishers. They can be interpreted as the probabilities that user sees a post of publisher if the user goes through all the posts in the News Feed or if he/she picks randomly a single post in the News Feed, respectively. In this paper, due to space limitations we focus primarily on the occupancy.
III Experimental Findings
Next, we report empirical findings on the 2018 Italian elections.
III-A Experimental setup
The Italian election was held on March 4th 2018, and our experiment was conducted between January 10, 2018 and March 6, 2018, encompassing the preparation for the election campaign and the reactions to its outcome.
We asked some Italian voters to select a set of thirty representative public Facebook pages, six for each of the following five political orientations: center-left, far-right, left, five-star movement (M5S) and right. Due to space limitations, the selection of representative pages is reported in our technical report.111http://bit.ly/2KfT3Hn The classification of publishers into political categories may obviously be questionable, but our focus in this paper is on the methodology rather than on specific political conclusions. Moreover, most of our results are detailed on a per-publisher basis.
Then, we created six virtual Facebook users. Recall that each bot followed all the thirty preselected pages. We gave to five bots a specific political orientation, by making each of them like pages from the corresponding publishers. The sixth bot is undecided, and does not like any page.
Each bot was scheduled to collect thirteen snapshots per day. Snapshots were collected once every hour, from 7 am to 7 pm (Italian local time). The collected snapshots and impressions, together with the set of all posts published by the thirty representative pages, obtained through Facebook API, constitute our dataset.
III-B Experimental findings
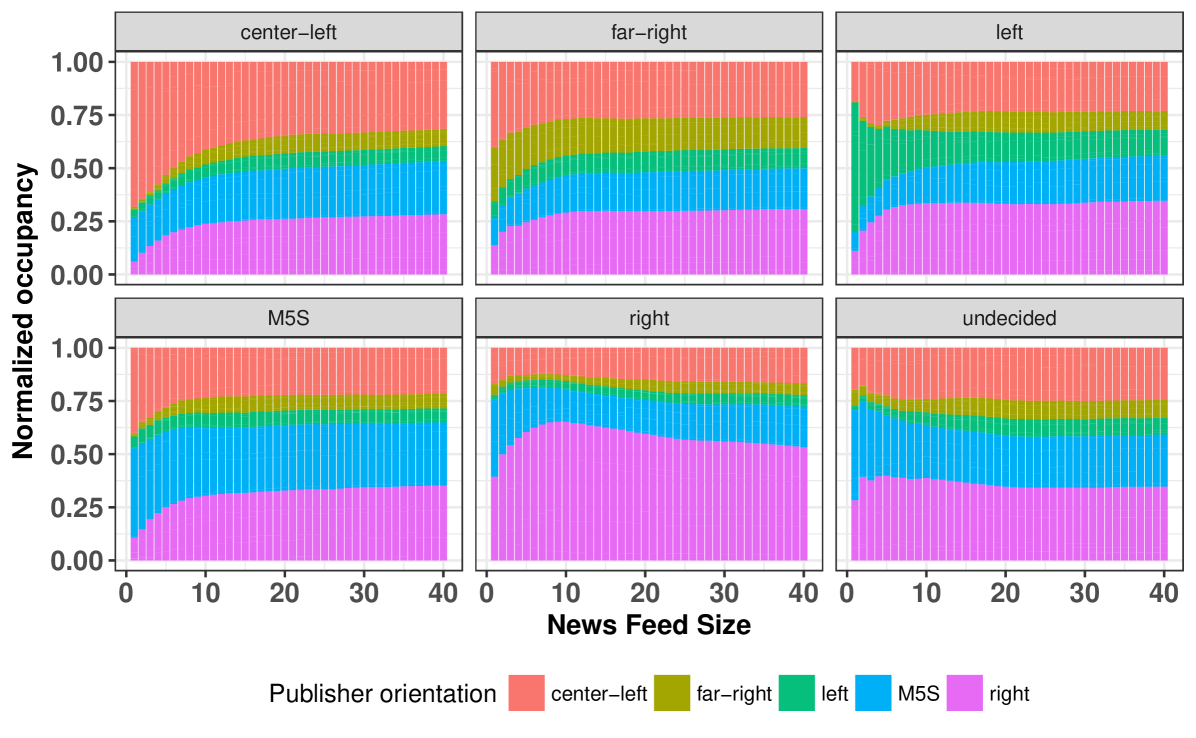
The effect of filtering is stronger at the topmost News Feed position
Figure 1 shows the normalized publisher occupancy as a function of the timeline size. The publishers are ordered and colored according to their political orientation. It can be seen that the occupancy concentration is higher at the topmost positions, and asymptotic values are reached when . The noteworthy bias on the topmost position is referred to in the literature as ranking bias [3] and must be placed under scrutiny, as there is a strong correlation between position and click rates [4, 14] .
Occupancy reflects orientation
Figure 1 also shows that the occupancies reflect the orientation of the bots. For instance, the News Feed of the bot with a center-left orientation was occupied mostly by center-left (red) publishers. As a notable exception, center-left posts were prevalent in the News Feed of the bot with a far-right orientation. Nonetheless, the occupancy of far-right posts in that bot was still the highest among all bots.
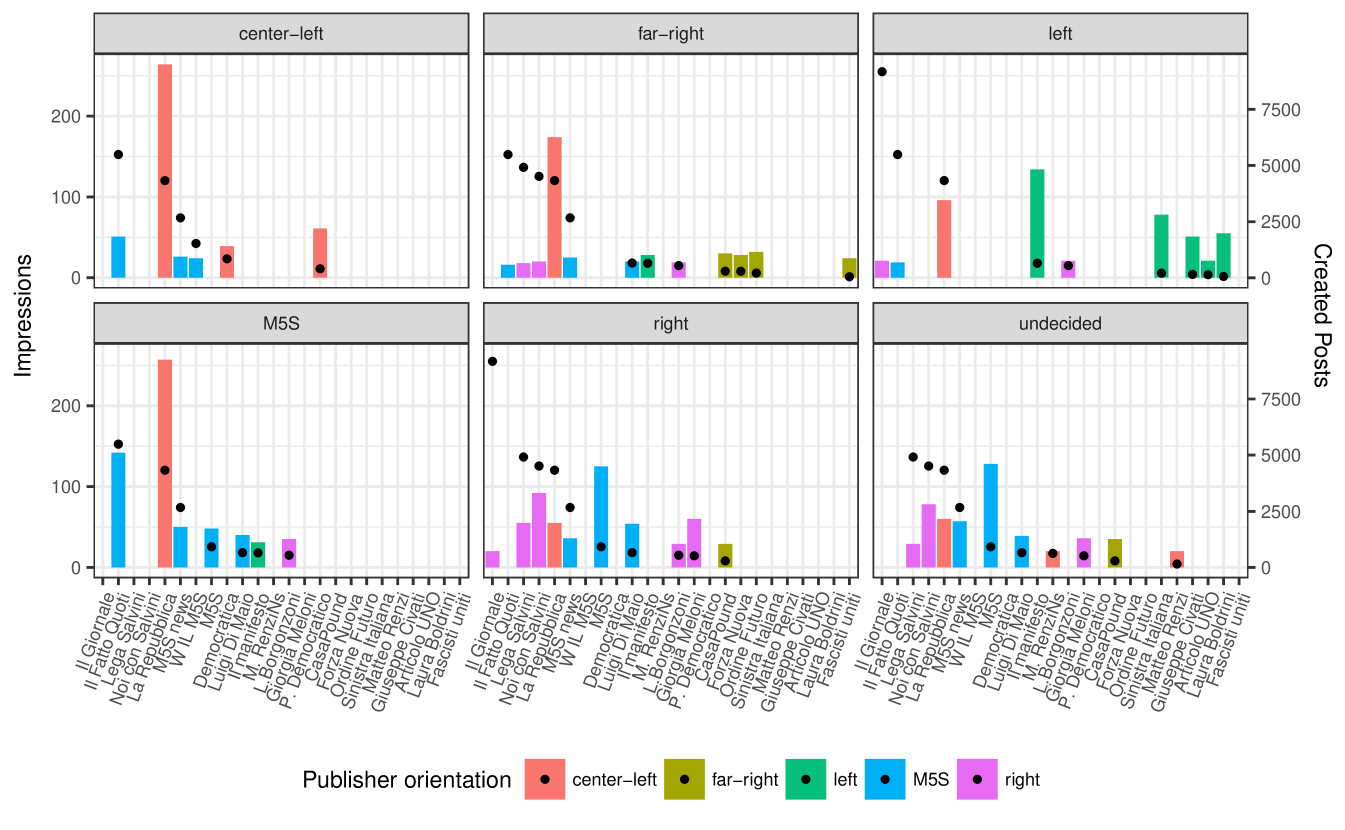
Noticeable publishers selection
The bars in Figure 2 show the total number of impressions per publisher in the topmost position of the News Feed of each bot (the color of the bars indicates the orientation). For the sake of readability, only publishers that achieved a normalized occupancy larger than are represented in this figure. The black dots correspond to the number of posts created by each publisher (the publishers are ordered by the number of posts created). Figure 2 shows that only a small subset of publishers are represented in topmost positions. For example, the center-left bot sees only posts from center-left and M5S publishers. Moreover, the number of impressions per publisher is not proportional to the number of posts the publisher created, a further indication of a filtering effect from News Feed algorithm.
Neutral users are also exposed to non-uniform filtering
It is worth noting that filtering affects also the “undecided” bot, with some publishers over-represented in the News feed.
IV News Feed Model
Model description
Next, we derive an analytical model for a FIFO implementation of the News Feed. We assume that a News Feed has slots, new posts are inserted at the top of the News Feed and each new arrival shifts older posts one position lower. A post is evicted from the News Feed when it is shifted from position .
Let be the set of users, and let be the set of publishers: denotes the set of publishers followed by user . Publisher publishes posts according to a Poisson process with rate . The total publishing rate is . Let be the effective arrival rate of posts published by in the News Feed of user . We denote by the aggregate rate of posts published in the News Feed of user , . We further let be the arrival rate of posts in the News Feed of user from all publishers other than , . All the variables used are summarized in Table I.
| Variable | description |
|---|---|
| -th publisher | |
| -th News Feed user | |
| post creation rate by publisher | |
| arrival rate of posts from at user | |
| total arrival rate of posts at user | |
| Metrics of interest as estimated by the model | |
| hit probability of publisher at user | |
| visibility of publisher at user | |
| occupancy of publisher at user | |
| Metrics of interest as obtained from measurements | |
| measured visibility of at | |
| measured occupancy of at | |
Metrics of interest
We consider the News Feed of user . Subscript is used to denote metrics computed using the analytical model. The visibility of publisher is given by , and the rationale goes as follows. After every new arrival, with probability the topmost post of publisher will be shifted down by one unit. After consecutive shifts, which occur with probability , publisher will not be visible at the News Feed of user . The occupancy of contents of publisher , in turn, follows from Little’s law and is given by
| (3) |
When we have . As the filtering effect is stronger on the topmost position (Section III), except otherwise noted, we let .
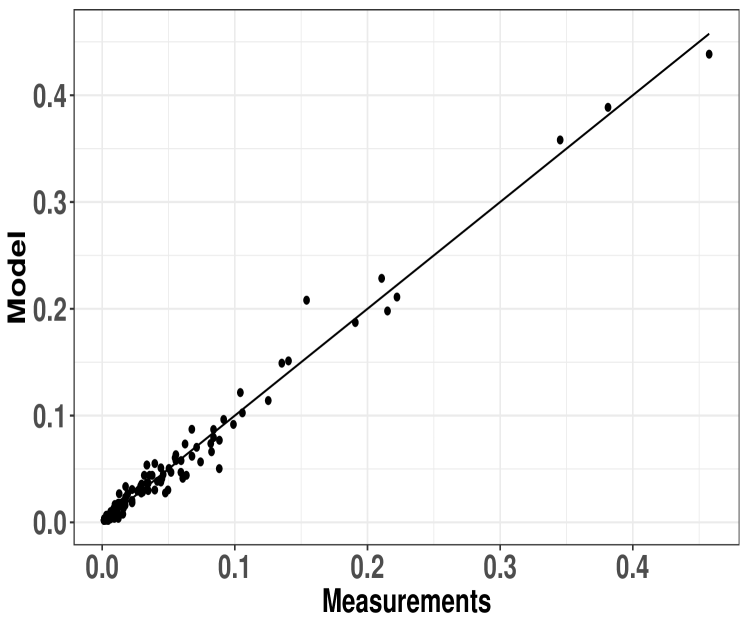
Model validation
A preliminary model validation using data from the 2018 Italian elections is now introduced. In Figure 3, each point corresponds to a publisher-user pair. A point indicates that, for the given pair, an occupancy estimated by the proposed model using eqs. (3) and (1) corresponds to a measured occupancy . Most of the points are close to the line, indicating the expressive power of the model. Note that to generate Figure 3 we relied on the effective arrival rates of posts, . Future work consists of inferring such rates directly from publishers and users profiles, e.g., using machine learning techniques.
V Quantifying Bias: A Model-Based Approach
We provide further insight on the influence of the News Feed personalization algorithm. To this aim, we propose a model-based bias analysis.
Recall that is the occupancy computed from (3), using the effective arrival rates of publisher at bot . Alternatively, let be the occupancy of publisher at bot in the unfiltered scenario wherein all posts published appear in the feed. is obtained from (3), letting and . We observe that is the same for all the users and we denote it simply as .
We define the bias as the difference between the two occupancies, i.e.
| (4) |
Note that the definition of bias is general, and can be coupled with different base-line models of occupancy. Utility-driven models of visibility, inspired by [11, 29, 25], are currently one of our subjects of study.
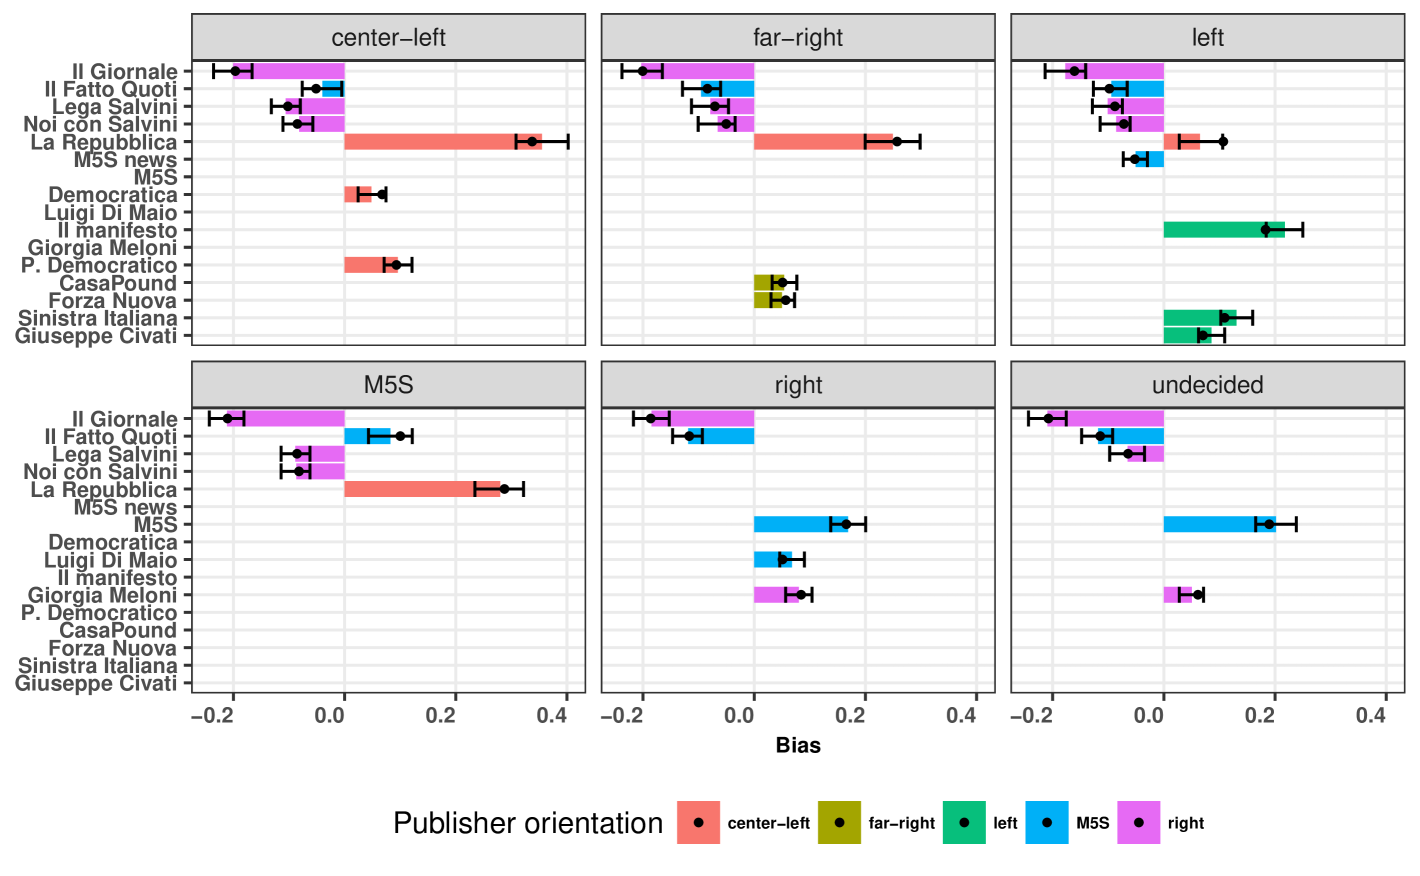
Figure 4 shows bias estimates obtained from the Italian elections experiment. Black dots indicate model predictions of bias, obtained directly from the measurements together with equation (4). We evaluated % confidence intervals for the bias using a bootstrapping model-free non-parametric resampling method. To this purpose, one thousand virtual experiments have been conducted. Each experiment consisted in sampling, with replacement, from the set of posts collected by fbtrex (to estimate confidence intervals for ) and from the set of posts obtained from the Facebook API dataset (to estimate confidence intervals for ). Bars and error bars show the average points and the boundaries of the 95% confidence intervals for the bias.
Figure 4 provides further insights on the findings reported in Section III. In particular, we observe a strong positive bias towards La Republica at the far-right and M5S bots and a strong negative bias towards Il Giornale at all bots. In addition, the bias experienced by the left-oriented user is particularly well aligned with its profile. Note also that there is a strong positive bias towards M5S posts at the undecided bot. M5S was the party with the largest number of votes in the 2018 Italian general election. We also observed that the bias profile of the undecided neutral user is similar to that of the right-oriented one.
VI Related Work
There is a vast literature on how the Facebook News Feed works, including topological aspects related to cascading structures and growth [22, 33, 9] and its effects on the creation of echo chambers and polarization [6, 7]. In this paper, we study the News Feed filtering impact on the dissemination of information, measuring and modeling the visibility of publishers and posts in the News Feed.
VI-A Public datasets and reproducible methodologies
The behavior of users searching for visibility was studied in [17, 8, 31]. Such studies are primarily based on small datasets. A notable exception is [4, 5], who considered a massive dataset provided by Facebook through restrictive non-disclosure agreements. Datasets to assess Facebook publishers’ visibilities are usually not made publicly available. Our work aims to contribute by filling that gap.
The proposed methodology meets the set of principles intended to ensure fairness in the evolving policy and technology ecosystem introduced by the ACM [21]: awareness, access and redness, accountability, explanation, data provenance, auditability, and validation and testing. We particularly focus on awareness, explanation and auditability, as we do not rely on the Facebook API to collect impressions.
VI-B Bias and visibility models
The awareness of users about the News Feed algorithm was evaluated in [18]. Eslami et al. reported that of the interviewed Facebook users were unaware of the News Feed algorithm. Users believed that every post from their friends and followed pages appeared in their News Feed.
The bias in algorithms, and forms to audit it, were investigated in [13, 30]. In [14] it was shown that search engine ranking manipulation can influence the vote of undecided citizens. This bias was further quantified in [26]. With the help of our model, we can quantify the bias in the Facebook News Feed.
News Feed models were previously proposed in [2, 12] and [29]. In this paper, we propose a simple News Feed model and validate it using real-world data. It is out of the scope of this paper to present a nuts-and-bolts perspective on how the Facebook News Feed works. Instead, our goal was to provide a simple model that can explain the occupancy and visibility of different publishers, given a reproducible measurement framework. As in any scientific experiment, we cope with a tradeoff between model expressive power and simplicity. In this preliminary work, we considered the simplest possible News Feed model, namely a FIFO model, that produces meaningful results.
The implications of the limited budget of attention of users in OSNs have been previously studied by Reiffers-Masson et al. [27] and Jiang et al. [23]. In these two papers, the authors consider the problem of optimally deciding what to post and to read, respectively. Such works are complementary to ours. To the best of our knowledge, none of the previous works considered the problem of inferring the visibility of publishers from News Feed measurements.
VII Discussion
FIFO model The proposed FIFO model is a preliminary step to capture News Feed dynamics. The stronger filtering at the topmost News Feed positions, that we observed in Section III, cannot be justified by FIFO operation. Nonetheless, this simple model already allows us to appreciate what kind of analysis can be conducted by combining measurements and analytical tools. We are currently working on a more complex model, e.g., to account for different residence times for different posts using time-to-live counters [11, 25, 29].
Small number of users Our experimental methodology encompasses a small number of bots (users), as each bot must go through a full Facebook account registration. In particular, in our case study we considered six bots. We believe that such bots already provide a representative perspective on the biases introduced by Facebook, and we use bootstrapping techniques to generate additional samples from our observations. Future work consists of increasing the number of bots to tens of bots, including bots with similar profiles to compare their impressions.
Compliance to Facebook policies Our methodology encompasses the creation of fake users, as we use a limited number of experimental Facebook accounts to follow and like public pages. Such accounts have a very low impact on the system, as they do not have real or virtual friends. To minimize potential harm, we remove our experimental Facebook accounts after we are done with our experiments.
VIII Conclusion
In this work, we proposed a framework for reproducible measurements and analysis of the Facebook News Feed algorithm. The framework encompasses an analytical model which enables quantitative what-if analysis to assess the bias introduced by the News Feed algorithm.
We were able to conclude that the algorithm tends to reinforce the orientation indicated by users about the pages they “like”, by filtering posts and creating biases among the set of followed publishers. The effects of filtering are stronger on the topmost position where only a fraction of the set of publishers followed by the users was represented. We observed that a neutral user that did not “like” any page was also exposed to a noticeable bias.
Facebook mission is to “give people the power to build community.” We believe that the measurements, model and tools presented in this work are one step further towards that goal, as they help evaluating algorithms’ transparency and promote user awareness about the filtering process they are submitted to. Ultimately, such awareness is key to protect and empower Facebook users, communities, society and democracy as a whole.
Acknowledgements
This work was partially funded by the Brazilian-French project THANES (co-sponsored by FAPERJ and INRIA). D. Menasché was also partly sponsored by a JCNE fellowship (FAPERJ), CNPq and CAPES.
References
- [1] C. Agosti. Facebook tracking exposed, 2018. https://facebook.tracking.exposed.
- [2] E. Altman, P. Kumar, S. Venkatramanan, and A. Kumar. Competition over timeline in social networks. In ASONAM, 2013.
- [3] Ricardo Baeza-Yates. Bias on the web. Communications of the ACM, 61(6):54–61, may 2018.
- [4] E. Bakshy, S. Messing, and L. Adamic. Exposure to ideologically diverse news and opinion on Facebook. Science, 348(6239), 2015.
- [5] Eytan Bakshy, Itamar Rosenn, Cameron Marlow, and Lada Adamic. The Role of Social Networks in Information Diffusion. 2012.
- [6] A. Bessi. Personality traits and echo chambers on Facebook. Computers in Human Behavior, 65:319 – 324, 2016.
- [7] A. Bessi, F. Zollo, M. Del Vicario, M. Puliga, A. Scala, G. Caldarelli, B. Uzzi, and W. Quattrociocchi. Users polarization on Facebook and Youtube. PloS one, 11(8), 2016.
- [8] T. Bucher. Want to be on the top? Algorithmic power and the threat of invisibility on Facebook. New Media & Society, 2012.
- [9] Justin Cheng, Jon Kleinberg, Jure Leskovec, David Liben-Nowell, Bogdan State, Karthik Subbian, and Lada Adamic. Do Diffusion Protocols Govern Cascade Growth? Icwsm, 2018.
- [10] Tech Cruch. Facebook now has 2 billion monthly users, 2017. https://techcrunch.com.
- [11] M. Dehghan, L. Massoulié, D. Towsley, D. Menasché, and Y. C. Tay. A utility optimization approach to cache design. In INFOCOM, 2016.
- [12] R. Dhounchak, V. Kavitha, and E. Altman. A viral timeline branching process to study a social network. In ITC, 2017.
- [13] Nicholas Diakopoulos. Algorithmic accountability reporting: On the investigation of black boxes. Tow Center for Digital Journalism A Tow/Knight Brief, pages 1–33, 2013.
- [14] Robert Epstein and Ronald E Robertson. The search engine manipulation effect (SEME) and its possible impact on the outcomes of elections. Proceedings of the National Academy of Sciences of the United States of America, 112(33):E4512–21, 2015.
- [15] Ziv Epstein, Blakeley H. Payne, Judy Hanwen Shen, Abhimanyu Dubey, Bjarke Felbo, Matthew Groh, Nick Obradovich, Manuel Cebrián, and Iyad Rahwan. Closing the AI knowledge gap. CoRR, abs/1803.07233, 2018.
- [16] Motahhare Eslami, Amirhossein Aleyasen, Karrie Karahalios, Kevin Hamilton, and Christian Sandvig. Feedvis: A path for exploring news feed curation algorithms. In Proceedings of the 18th ACM Conference Companion on Computer Supported Cooperative Work & Social Computing, pages 65–68. ACM, 2015.
- [17] Motahhare Eslami, Karrie Karahalios, Christian Sandvig, Kristen Vaccaro, Aimee Rickman, Kevin Hamilton, and Alex Kirlik. First I like it, then I hide it: Folk theories of social feeds. In Proceedings of the 2016 cHI conference on human factors in computing systems, pages 2371–2382. ACM, 2016.
- [18] Motahhare Eslami, Aimee Rickman, Kristen Vaccaro, Amirhossein Aleyasen, Andy Vuong, Karrie Karahalios, Kevin Hamilton, and Christian Sandvig. "I always assumed that I wasn’t really that close to [her]". CHI, pages 153–162, 2015.
- [19] Facebook. Controlling what you see in news feed. https://www.facebook.com/help/335291769884272, 2017.
- [20] Facebook. Graph api reference. http://bit.ly/2HB1vzq, 2018.
- [21] Simson Garfinkel, Jeanna Matthews, Stuart S. Shapiro, and Jonathan M. Smith. Toward algorithmic transparency and accountability. Communications of the ACM, 60(9):5–5, 2017.
- [22] Minas Gjoka, Maciej Kurant, Carter T. Butts, and Athina Markopoulou. Walking in facebook: A case study of unbiased sampling of OSNs. Proceedings - IEEE INFOCOM, 2010.
- [23] Bo Jiang, Nidhi Hegde, Laurent Massoulié, and Don Towsley. How to optimally allocate your budget of attention in social networks. In INFOCOM, pages 2373–2381. IEEE, 2013.
- [24] Jason J Jones, Robert M Bond, Eytan Bakshy, Dean Eckles, and James H Fowler. Social influence and political mobilization: Further evidence from a randomized experiment in the 2012 us presidential election. PloS one, 12(4):e0173851, 2017.
- [25] Frank Kelly. Charging and rate control for elastic traffic. European Transactions on Telecommunications, 8(1):33–37, 1997.
- [26] Juhi Kulshrestha, Motahhare Eslami, Johnnatan Messias, Muhammad Bilal Zafar, Saptarshi Ghosh, Krishna P Gummadi, and Karrie Karahalios. Quantifying Search Bias: Investigating Sources of Bias for Political Searches in Social Media. CSCW, pages 417–432, 2017.
- [27] Alexandre Reiffers Masson, Yezekael Hayel, and Eitan Altman. Posting behavior dynamics and active filtering for content diversity in social networks. IEEE transactions on Signal and Information Processing over Networks, 3(2):376–387, 2017.
- [28] E. Pariser. The Filter Bubble: How the New Personalized Web Is Changing What We Read and How We Think. 2011.
- [29] A. Reiffers-Masson, E. Hargreaves, E. Altman, W. Caarls, and D. Menasché. Timelines are Publisher-Driven Caches. SIGMETRICS PER (NetEcon 2016), 44(3):26–29, jan 2017.
- [30] Christian Sandvig, Kevin Hamilton, Karrie Karahalios, and Cedric Langbort. Auditing Algorithms: Research Methods for Detecting Discrimination. Intl. Comm. Assoc., pages 1–20, 2014.
- [31] Manya Sleeper, Rebecca Balebako, Sauvik Das, Amber Lynn McConahy, Jason Wiese, and Lorrie Faith Cranor. The post that wasn’t: exploring self-censorship on facebook. Proceedings of the 2013 conference on Computer supported cooperative work, page 793, 2013.
- [32] Sarah Tan, Rich Caruana, Giles Hooker, and Yin Lou. Detecting Bias in Black-Box Models Using Transparent Model Distillation. (1), 2017.
- [33] Johan Ugander, Brian Karrer, Lars Backstrom, and Cameron Marlow. The Anatomy of the Facebook Social Graph. CoRR, 2011.