Binomial Mixture Model With U-shape Constraint
Abstract
In this article, we study the binomial mixture model under the regime that the binomial size can be relatively large compared to the sample size . This project is motivated by the GeneFishing method [18], whose output is a combination of the parameter of interest and the subsampling noise. To tackle the noise in the output, we utilize the observation that the density of the output has a U shape and model the output with the binomial mixture model under a U shape constraint. We first analyze the estimation of the underlying distribution in the binomial mixture model under various conditions for . Equipped with these theoretical understandings, we propose a simple method Ucut to identify the cutoffs of the U shape and recover the underlying distribution based on the Grenander estimator [8]. It has been shown that when , the identified cutoffs converge at the rate . The distance between the recovered distribution and the true one decreases at the same rate. To demonstrate the performance, we apply our method to varieties of simulation studies, a GTEX dataset used in [18] and a single cell dataset from Tabula Muris.
1 Introduction
The binomial mixture model has received much attention since the late 1960s. In the field of performance evaluation, [19, 20, 32] utilized this model to address the problem of psychological testing. [38] used a two-component binomial mixture distribution to model the individual differences in children’s performance on a classification task. [9] employed a binomial finite mixture to model the number of credits gained by freshmen during the first year at the School of Economics of the University of Florence. In addition, the binomial mixture model is commonly applied to analyze population survey data in ecology. [30, 16, 27, 44] estimate absolute abundance while accounting for imperfect detection using binomial detection models. The binomial mixture model was also used to estimate bird and bat fatalities at wind power facilities [25].
Formally, we say is a random variable which has a binomial mixture model if
| (1.1) |
where is a bivariate measure of the binomial size and the success probability on . In the field of population survey in ecology, can be modeled as Poisson or negative binomial random variable while can be modeled as a beta random variable, linked to a linear combination of additional covariates by a logistic function [30, 16, 27, 44, 25]. Such models are always identifiable thanks to the parametric assumptions. In the field of performance evaluation, is always known and usually small (restricted by the intrinsic nature of the problem), thus (1.1) is reduced to
| (1.2) |
where is a probability distribution on . For instance, refers to the number of questions of a psychological test in [19, 20, 32]. When the univariate probability distribution corresponds to a finite point mass function (pmf), (1.2) is a binomial finite mixture model as in [38, 9]; when corresponds to a density (either parametric or nonparametric), (1.2) is a hierarchical binomial mixture model as in [19, 20, 32]. Such models suffer from an unidentifiability issue — only the first moments of can be identified even with unlimited sample size [36]; more identifiability details are discussed in Appendix A.
In this study, we are interested in a regime unlike that for performance evaluation where is known and small or that for population survey in ecology where is unknown. We study (1.2) with a known that can be as large as the magnitude of , which has not been investigated before in the literature. This study is motivated by the GeneFishing method [18], which is proposed to take care of extreme inhomogeneity and low signal-to-noise ratio in high-dimensional data. This method employs subsampling and aggregation techniques to evaluate the functional relevance of a candidate gene to a set of bait genes (the bait genes are pre-selected by experts concerning certain biological processes). Briefly speaking, it clusters a subsample of candidate genes and the bait genes repetitively. One candidate gene is thought of as functioning similarly to the bait genes if the former and the latter are always grouped during the clustering procedure. More details about GeneFishing can be found in Appendix B.
Mathematically, suppose there are objects (e.g., genes) and binomial trials (e.g., the number of clustering times which can be manually tuned). For each object, we assume it has a success probability (e.g., a rate reflecting how relevant one candidate gene is to the baits genes) that is i.i.d. sampled from an underlying distribution . Then, an observation (e.g., the times one candidate gene and the bait genes are grouped together) or (denoted as capture frequency ratio in GeneFishing, or CFR) is independently generated from the binomial mixture model (1.2). A discussion on the independence assumption is put in Appendix B.
Our goal is to estimate and infer the underlying distribution . When is sufficiently large, the binomial randomness plays little role, and there is no difference between and for estimation or inference purposes. In other words, the permission of a large alleviates the identifiability issue of the binomial mixture model. Thereby, a question naturally arises as follows.
-
Q1
For the binomial mixture model (1.2), what is the minimal binomial size so that any distribution estimators can work as if there is no binomial randomness?
We can reformulate Q1 in a more explicit way:
-
Q1’
Considering that the binomial mixture model (1.2) is trivially identifiable when , is there a minimal such that we can have an “acceptable” estimator of under various conditions:
-
•
General without additional conditions.
-
•
with a density.
-
•
with a continuously differentiable density.
-
•
with a monotone density.
-
•
If the above question can be answered satisfactorily, we can cast our attention back to the GeneFishing example. In [18], there remains an open question on how large should be so that the associated gene is labeled as a “discovery”. We have an important observation that can be leveraged towards this end: the histograms of appear in a U shape; see Figure 1. Hence, the second question we want to answer is
-
Q2
Suppose the underlying distribution has a U shape, how to make decisions based on the data generated from the binomial mixture model?


1.1 Main contributions
Our contributions are twofold, which correspond to the two questions raised above. One tackles the identifiability issue for the binomial mixture model when can be relatively large compared to . The other one answers the motivating question — how to select the cutoff for the output of GeneFishing.
1.1.1 New results for large in Binomial mixture model
Based on the results of [36] and [42], the only hope is to use a large if we want to solve, or at least alleviate, the identifiability issue for arbitrary mixtures of binomial distributions. When is sufficiently large, we show that regardless of the identifiability of the model (1.2), we can find an estimator of , according to the conditions on , such that the estimator locates in a ball of radius of in terms of some metrics such as distance and Kolmogorov distance, where is a decreasing function of . Specifically,
-
•
[Corollary of Theorem 1] For general , if the distance is used, then for the empirical cumulative distribution function, where is a positive constant that depends on .
-
•
[Corollary of Theorem 5] If has a bounded density and the Kolmogorov distance is used, then for the empirical cumulative distribution function, where only depends on the maximal value of the density of .
-
•
[Corollary of Theorem 8] If has a density whose derivative is absolutely continuous, and the truncated integrated distance is used, then for the histogram estimator, where only depends on the density of .
-
•
[Corollary of Theorem 10] If has a bounded monotone density and the distance is used, then for the Grenander estimator, where only depends on the density of .
1.1.2 The cutoff selection for GeneFishing
To model the CFRs generated by GeneFishing, we use the binomial mixture model with the U-shape constraint, under the regime where the binomial size can be relatively large compared to the sample size . With the theoretical understandings mentioned in Section 1.1.1, we propose a simple method Ucut to identify the cutoffs of the U shape and recover the underlying distribution based on the Grenander estimator. It has been shown that when , the identified cutoffs converge at the rate . The distance between the recovered distribution and the true one decreases at the same rate. We also show that the estimated cutoff is larger than the true cutoff with a high probability. The performance of our method is demonstrated with varieties of simulation studies, a GTEX dataset used in [18] and a single cell dataset from Tabula Muris.
1.2 Outline
The rest of the paper is organized as follows. Section 2 introduces the notation used throughout the paper. To answer Q1 (or more specifically, Q1’), Section 3 analyzes the estimation and inference of the underlying distribution in the binomial mixture model (1.2), under various conditions imposed on . Equipped with these analysis tools, we cast our attention back to the GeneFishing method to answer Q2. Section 4 first introduces a model with U-shape constraint, called BMU, to model the output of GeneFishing. The cutoffs of our interest are also introduced in this model. Then in the same section, we propose a non-parametric maximum likelihood estimation (NPMLE) method Ucut based on the Grenander estimator to identify the cutoffs and estimate the underlying U-shape density. We also provide a theoretical analysis of the estimator. Next, we apply Ucut to several synthetic datasets and two real datasets in Section 5. All the detailed proofs of the theorems mentioned in previous sections are in Appendix.
2 Notation
Denote by a probability distribution. Let and given , where is a positive integer; see Model (1.2) for details. If there is no confusion, we also use to represent the associated cumulative distribution function (CDF), i.e, . By denote the binomial mixture CDF for , i.e., .
Suppose there are samples independently generated from , i.e., . Correspondingly, we have independently. By and denote the empirical CDF of ’s and ’s, respectively. Specifically,
If has a density, define the Grenander estimator () for ’s (’s) as the left derivative of the least concave majorant of () evaluated at [8].
For a density , we use and to denote its maximal and minimal function values on the domain of . We use to denote the indicator function, and use , to denote the right and left limit of respectively.
3 Estimation and Inference of under Various Conditions
When is sufficiently large, behaves like , which implies that we can directly estimate the underlying true of the binomial mixture model (1.2). A natural question arises whether there exists a minimal binomial size so that the identifiability issue mentioned in Appendix A is not a concern. We investigate the estimation of general , with a density, whose density has an absolutely continuous derivative, and with a monotone density. We consider the empirical CDF estimator for the first two conditions, the histogram estimator for the third condition, and the Grenander estimator for the last condition. The investigations into the estimation of under various conditions provide us with the analysis tools to design and analyze the cutoff method for GeneFishing.
3.1 General
We begin with the estimation of , based on , without additional conditions except that is defined on . Towards this end, the empirical CDF estimator might be the first method that comes into one’s mind. It is easy to interpret using a diagram, and it exists no matter whether corresponds to a density, a point mass function, or a mixture of both.
To measure the deviation of the empirical CDF from , we use the distance with . The distance between two distributions and is defined as
The distance has two special cases that are easily interpretable from a geometric perspective. First, when , it looks at the cumulative differences between the two CDFs.The distance is known to be equivalent to the 1-Wasserstein () distance on , which is also known as the Kantorovich-Monge-Rubinstein metric. Second, when , it corresponds to the Kolmogorov-Smirnov (K-S) distance:
which measures the largest deviation between two CDFs. The K-S distance is a weaker notion of the total variation distance on (total variation is often too strong to be useful).
In the sequel, we study for supported on . Theorem 1 states that without any conditions imposed on , the distance between and is bounded by . One key to this theorem lies in the finite support of , which enables the usage of the Fubini’s theorem. Along with the Dvoretzky-Kiefer-Wolfowi (DKW) inequality [24], it implies that the distance between and is bounded by . Particularly, we have and .
Theorem 1 (The distance between / and )
For a general on , it follows that
where is a positive constant that depends on . It indicates that
where is another universal positive constant.
Proof By definition, it follows that
Note that
where is bounded in , and thus it is a sub-Gaussian random variable with the variance less or equal to [10]. The same argument applies to . Therefore, we have
where Equation holds by the Fubini’s theorem. Further, by noting that and using the DKW inequality, it follows that
Notwithstanding, Theorem 1 does not establish a useful bound for the K-S distance that corresponds to the distance — there remains a non-negligible constant which does not depend on . In fact, the K-S distance might evaluate the estimate of from a too stringent perspective. Proposition 2 shows that no matter how small is, there is an with a point mass function and a point such that is larger than a constant that is independent of . This result is attributed to the “bad” points with non-trivial masses like . Such a “bad” point gives rise to a sharp jump in , which cannot immediately catch up with due to the discretization nature of the binomial randomness. It leads to difficulty in recovering the underlying distribution of the binomial mixture model.
On the other hand, the distance with does not suffer from the issue of the K-S distance — it can be regarded as looking at an average of the absolute distance between and when the support of is finite. To be specific, even if there are “bad” points such that has a non-trivial difference, , this difference will diminish outside a small neighbor of of a width . Therefore, when taking the integral, the averaging distance decreases as grows. Furthermore, if has a density, the issue of “bad” points no longer exists for the K-S distance either. In this case, the K-S distance is an appropriate choice to measure the difference between and ; see Section 3.2 for details.
Proposition 2 ( can deviate in K-S far from with a pmf)
There exists an with a pmf, such that , where is a constant.
Proof Let be the delta function taking the mass at , where is an extremely small positive irrational number. Then by CLT, with probability about , is no larger than , where is the largest integer such that . Take any in . It follows that but . It implies that is larger than a constant that is independent of .
3.2 with a density
In this section, we focus on with a density so that the K-S distance can be employed. In addition, we stick to this metric partly because it is related to the Grenander estimator for monotone density estimation [8, 4], which constitutes our method for the GeneFishing cutoff selection; see Section 3.4 and Section 4.2.
To bound the K-S distance between and , i.e., , we just need to bound and by noticing that . By the DKW inequality, we have a tight bound
So it only remains to study the deviation of from . In Proposition 3, we show that when has a derivative bounded from both below and above, the K-S distance between and is bounded by from below and by from above.
Proposition 3 (Deviation of from with a density)
Suppose is a density function on with . It follows that
Proof For the lower bound, we have
For the upper bound, note that
thus
We have
Similarly, we have . So it follows that
Proposition 3 shows that the largest deviation of the binomial mixture CDF from the underlying CDF is at least the order and at most the order . In fact, the condition that is bounded can be relaxed to that is -integrable with using the Hölder inequality, but the rate will be correspondingly. Our result is the special case with . Moreover, with a density is a necessary condition for Proposition 3 — we have seen in Proposition 2 that if has a point mass function, the deviation of from cannot be controlled w.r.t .
Proposition 4 shows that there exist two simple distributions that respectively attain the lower bound and the upper bound. On the other hand, Proposition 3 can be further improved: if the underlying density is assumed to be smooth, the upper bound is lowered to ; see Proposition 7 in Section 3.3.
Proposition 4 (Tightness of Proposition 3)
The upper bound and the lower bound in Proposition 3 are tight. In other words, there exist an and such that and , where and are two positive constants.
Proof The lower bound of Proposition 3 can be attained by the uniform distribution. Specifically, if , . So .
On the other hand, the upper bound can be attained by another simple distribution. Let
| (3.1) |
We can show that this density leads to , where is a positive constant. It is a consequence of the central limit theorem for the binomial distribution. The detailed proof is delegated to Appendix D.
Given Proposition 3, we can get the rate of of along with the DKW inequality, which is as shown in Theorem 5. By taking integral of w.r.t , we immediately have Corollary 6.
Theorem 5 (The rate of K-S distance between and with a density)
Suppose is a density function on with . The data is generated as Model (1.2). It follows that
where . The two-side tail bound also holds as follow
where .
Proof Note that
The first term can be bounded by the original DKW inequality and the second term can be bounded using the result of Proposition 3. Then we conclude the second result. The first result can be obtained in the same fashion.
Corollary 6
Under the same setup of Theorem 5, we have , and .
3.3 with A Smooth Density
In this section, we investigate the estimation of with a smooth density. Under this condition, we first obtain a stronger result than Proposition 3 for , based on a truncated K-S distance on the interval , where . Proposition 7 shows that if the density of is smooth, the truncated K-S distance decreases at . The proof is based on the fact the binomial distribution random variable behaves like a Gaussian random variable when the binomial probability is bounded away from and . When is close to and , the Gaussian approximation cannot be used since it has an unbounded variance . The proof is deferred to Appendix E.
Proposition 7 (Deviation of from with a smooth density)
Suppose is a density function on with being absolutely continuous. Let and . It follows for any that
where is some constant that only depends on and .
Then, we investigate the histogram estimator, since it is the one of simplest nonparametric density estimators and it has a theoretical guarantee when the density is smooth. Let be an integer and define bins
Let be the number of observations in , and . It is known that under certain smoothness conditions, the histogram converges in a cubic root rate for the rooted mean squared error (MSE) [41, Chapter 6]. Next we study how the histogram behaves on the binomial mixture model. Denote
where is the bandwidth, denotes the bin that falls in. Theorem 8 shows that the histogram estimator based on ’s has the same convergence rate in terms of the MSE metrics as the histogram estimator based on ’s if and . This rate might not be improved even if has higher order continuous derivatives since is bounded by , which dominates when has a -order continuous derivative. The proof of Theorem 8 is delegated to Appendix F.
Theorem 8 (Upper bound of the histogram risk for binomial mixture model)
Let be the integrated risk on the interval . Assume that is absolutely continuous. It follows that
Furthermore, if , , we have
Here , and are positive constants that only depend on and , only depends on .
Finally, we conclude this section with a study on whose density is discretized into a point mass function of non-zero masses. In contrast to the existing results in [36], we allow to be as large as , and study the finite-sample rate of the histogram estimator. Let be a point mass function such that
where and , . Denote by the interval centered at and of length . We can make “smooth” by letting , where is a smooth function. Denote
Then the MSE can be defined as . It is known that . Theorem 9 shows that the same rate can be achieved by when . The proof is deferred to Appendix G.
Theorem 9 (Upper bound of the histogram risk for finite binomial mixture)
Let , where is absolutely continuous and . Let be the risk on the interval . It follows that
Furthermore, if , then
Here are positive constants that only depend on and .
3.4 with A Monotone Density
Next, we shift our attention to with a monotone density . It is motivated by the U shape in the histograms of the GeneFishing output, where we can decompose the U shape into a decreasing part, a flat part, and an increasing part; see Section 4.1. To estimate , a natural solution is the Grenander estimator [8, 14]. Specifically, we first construct the least concave majorant of the empirical CDF of ; then its left derivative is the desired estimator. The detailed review of the Grenander estimator is deferred to Appendix C.
In the sequel, we establish convergence and inference results for that is the Grenander estimator based on ’s. Theorem 10 states achieves the convergence rate of w.r.t the distance if .
Theorem 10 ( convergence of )
Suppose is a decreasing density on with . It follows that
Furthermore, if , we have
Here are positive constants that only depend on .
Theorem 10 follows by Corollary 6 and [4]. The details can be found in Appendix H. Furthermore, we discuss the minimal we need to ensure the convergence rate in terms of the distance. We have seen that is a sufficient condition. The question arises naturally whether it is necessary. Based on the density (3.1) used in Proposition 4, we can show that is also the minimal binomial size; see Proposition 11.
Proposition 11
Proof Note that
where in Inequality (i); Inequality (ii) holds because , which can be easily derived by Marshall’s lemma [22]; Inequality (iii) holds because of Proposition 4 and the DKW inequality, and are two positive constants that only depend . To ensure the expected distance between and is bounded by , it is necessary to have
which implies that , for some positive constant that depends on .
Next, we study the local asymptotics of . For the binomial mixture model, we yield a similar result for as the local asymptotics of when grows faster than , as shown in Theorem 12.
Theorem 12 (Local Asymptotics of )
Suppose is a decreasing density on and is smooth at . Then when as , if , we have
-
(A)
If is flat in a neighborhood of , and is the flat part containing , it follows that
where is the slope at of the least concave majorant in of a standard Brownian Bridge in .
-
(B)
If near for some and , it follows that
where is the slope at of the least concave majorant of the process , and is a standard two-sided Brownian motion on with .
The proof of Theorem 12 relies on Proposition 3 and the Komlós-Major-Tusnády (KMT) approximation [17]. Given these two results, we can show that if is upper bounded, there exists a sequence of Brownian bridges such that
where only depends on and are universal positive constants. Then following [40], we can prove Theorem 12. The details are deferred to Appendix I.
Finally, we conclude this section by discussing the histogram estimator and the Grenander estimator (for a density). Both of them are bin estimators but differ in the choice of the bin width. One can pick the bin width for the histogram to attain optimal convergence rates [41]. On the other hand, the bin widths of the Grenander estimator are chosen completely automatically by the estimator and are naturally locally adaptive [4]. The consequence is that the Grenander estimator can guarantee monotonicity, but the histogram estimator cannot. If the underlying model is monotone, the Grenander estimator has a better convergence rate than the histogram estimator. Notably, the convergence theory of the histogram estimator cannot be established unless the density is smooth, while that of the Grenander estimator only requires the density is monotone and integrable () [4].
In our setup, we show that when , both the Grenander estimator and the histogram estimator, based on , have the same rate at in distance (the convergence of the histogram can imply the convergence). It seems that both methods are comparable. Nonetheless, we mention that the conditions for the convergence of the two estimators are different. The Grenander estimator requires a bounded monotone density, while the histogram requires a smooth density.
4 Estimation and Inference of with U-shape Constraint
Now we have sufficient insight into the estimation of under various conditions in the binomial mixture model (1.2). We are ready to cast our attention back to the cutoff selection problem for the GeneFishing method, i.e., distinguishing the relevant genes (to the baits genes or the associated biological process) from the irrelevant ones. To answer this question, we leverage the observation that the histogram of appears to have a U shape as shown in Figure 1.
4.1 Model
We decompose the density or the pmf of into three parts: the first part decreases, the second part remains flat, and the last part increases. The first part is assumed to be purely related to the irrelevant genes; the second part is associated with the mixture of the irrelevant and the relevant genes; the last part is purely corresponding to the relevant genes. Denote by and the transition points from the first part to the second part and the second part to the third part, respectively. Then the question is reduced to identifying and getting an upper confidence bound on . In the sequel, we formally write this assumption as Assumption 1 when is associated with a continuous random variable. The corresponding mathematical formulations for the pmf are similar, so we omit them here.
Assumption 1
Let be the derivative of , i.e., the probability density function. We assume consists of three parts:
| (4.1) |
where , is a decreasing function, is an increasing function such that , , and with .
For the U-shaped constraint, we also need
The shape constraint (4.1) is determined by six parameters , but they are not identifiable. Below is an example of such unidentifiability.
Example 1 (Identifiability Issue for (4.1))
The parameters yield the same model as if .
The identifiability issue results from the vague transitions from one part to the next adjacent part in Model (4.1). To tackle it, we need to introduce some assumptions to sharpen the transitions. For example, if is smooth, then a sharp transition means the first derivative of , i.e., the slope, significantly changes at this point. In general, we do not impose the smoothness on and use the finite difference as the surrogate of the slope. To be specific, suppose there exist and neighborhoods of and , whose sizes are and respectively, such that
For the sake of convenience, we consider a stronger condition that drop off the factors and , which is called Assumption 2. It indicates that the density jumps at the transition points and .
Assumption 2
There are two positive parameters and such that
4.2 Method
Let and be the underlying ground truth of the two cutoffs in BMU. Our goal is to identify the cutoff that separates the relevant genes and the irrelevant genes in the GeneFishing method. Specifically, we want to find an estimator for and study the behavior of .
Define , , , where can be or . Define , , , , where can be or .
Since we are working on ’s rather than on ’s, we denote and for simplicity. Similarly, we can get simplified notation , , , , . In the rest of the paper, we sometimes use , , for , and respectively if no confusion arises.
4.2.1 The Non-parametric Maximum Likelihood Estimation
To estimate the parameters in BMU, we consider the non-parametric maximum likelihood estimation (NPMLE). We first solve the problem given and , then searching for optimal and using grid searching. The NPMLE problem is:
| (4.5) | |||||
Here and are two parameters to tune, and we call the inequalities (4.5) the change-point-gap constraint, which correspond to Assumption 1 and Assumption 2. Given and , the variables to optimize over are
where , . Since is continuous and concave w.r.t , and the feasible set is convex (it is easy to check that is a convex set), the problem (4.2.1) is a convex optimization with a unique optimizer.
4.2.2 Ucut: A Simplified Estimator
Fortunately, the following observation suggests a simplified optimization problem.
-
•
Note that and are the population masses for and , which can be well estimated by the empirical masses , and .
- •
-
•
From Figure 1, we can see that the flat region is wide. We can easily pick an interior point within the flat region.
Inspired by these observations, we replace the population masses with the empirical masses and drop off the change-point-gap constraint. We obtain the simplified objective function as follows:
where
The problem (4.2.2) is reduced to two monotone density estimations, which the Grenander estimator can solve. As we point out in the above observations, we can easily identify an interior point in the flat region. We fit an Grenander estimator for the decreasing on and an Grenander estimator for the increasing on . There are three advantages of using the interior point . First, it significantly reduces the computational cost by estimating the two Grenander estimators just once, regardless of the choices of and . Second, it bypasses the boundary issue of the Grenander estimators since we are mainly concerned with the behaviors of the estimators at the points and . Moreover, the usage of disentangles the mutual influences of the left decreasing part and the right increasing part; thus, it makes the analysis of the estimators simple.
Once we fit the Grenander estimator, we check whether the change-point-gap constraint (4.5) holds for different pairs of and . Finally, we pick the feasible pair with the maximal likelihood. We call this algorithm Ucut (U-shape cutoff), which is summarized in Algorithm 1.
4.3 Analysis
For Algorithm 1, the question arises whether is a feasible pair for the change-point-gap constraint (4.5). Theorem 13 answers this question by claiming that there exist in a small neighborhood of and in a small neighborhood of such that and for appropriate choices of and . This implies that we can safely set aside the constraint (4.5) when solving the problem (4.2.2). The proof of Theorem 13 is deferred to Appendix J.
Theorem 13 (Feasibility of Gap Constraint for )
Suppose is a distribution satisfying Assumption 1 and Assumption 2, with , . If , and , , there exist and such that
and
such that , , and produced by Algorithm 1 satisfy and , provided the input . Furthermore, the resulting density estimator satisfies
Here are positive constants that only depend on .
Besides knowing there are some feasible points near and , we want to have a clear sense of the optimal cutoff pair produced by Algorithm 1. Theorem 14 says that the optimal cutoff for the left (right) part is smaller (larger) than () with high probability.
Theorem 14 (Tail Bounds of Identified Cutoffs)
Suppose is the identified optimal cutoff pair produced by Algorithm 1, provided an input . Under the same assumptions as Theorem 13, particularly , ,
and
where , are positive constants, and only depends on , , only depends on , ; is the slope at of the least concave majorant in of a standard Brownian Bridge in .
The proof of Theorem 14 is in fact reduced to proving any cutoff pair with or does not satisfy the change-point-constraint with high probability. Since and estimated in Algorithm 1 are decreasing and increasing respectively, if (or ) violates the constraint, then (or ) will violate it with high probability if (or ). So it is reduced to considering the smallest and the largest in the grid searching space of Algorithm 1. Then the result can be concluded using Theorem 12. The detail is deferred to Appendix K.
5 Experiments of Ucut
5.1 Numerical Experiments
5.1.1 Data generating process
To confirm and complement our theory, we use extensive numerical experiments to examine the finite performance of Ucut on the estimation of . We study a BMU model that is comprised of linear components. Specifically, the model consists of three parts with boundaries and . The middle part is a flat region of height . The left part is a segment with the right end at and slope while the right part is a segment with the left end at and slope ; see Figure 2 (a) for illustration. We call it the linear valley model. We normalize the linear valley model to produce the density of interest. We call the normalized gaps and .


The linear valley model depicts the mixture density of the null distribution and the alternative distribution. We only assume that the left part ahead of purely belongs to the null distribution while the right part ahead of purely belongs to the alternative distribution. The null and the alternative distributions can hardly be distinguished in the flat middle part. To understand the linear valley model from the perspective of the two-group model, we assume that of the middle part belongs to the null distribution while the remaining belongs to the alternative model. In Figure 2 (b), the part in left slash corresponds to the null density while the part in right slash corresponds to the alternative density . Let be the area in the left slash divided by the total area. Then the marginal density can be written as . Since any gives the same , the middle part is not identifiable. It is necessary to estimate and infer the right cutoff , so that we can safely claim all the samples beyond are from the alternative distribution.
By default, we set , , , , , , . We sample samples from the linear valley model. Then for each , we get the observations independently, where if it is not specified particularly. The value of does not affect the data generation but it affects the FDR and the power of any method that yields discoveries.
Finally, the left part and the right part are not necessary to be linear. To investigate the effect of general monotone cases and misspecified cases (e.g., unimodal densities), we replace the left part and the right part with other functions; see Appendix M. All codes to replicate the results in this paper can be found at github.com/Elric2718/GFcutoff/.
5.1.2 Robustness to model parameters
When using Algorithm 1, we use the middle point , the left gap parameter , the right gap parameter , the searching unit . We first investigate how the binomial size affects the estimation of . Using the default setup as described in Section 5.1.1, we vary the binomial size , where refers to the case that there is no binomial randomness and we observe ’s directly. As shown in Figure 3 (a), converges to the true as grows. When , the estimated is as good as that of using ’s directly. This corroborates our theory that we only need when the BMU model holds. Note that in the linear setup, even with , is larger than true with large probability. It implies that Ucut is safe in the sense that it will make few false discoveries by using as the cutoff.
In the sequel, we stick to since it works well enough for the linear valley model. We investigate whether the width of the middle flat region affects the estimation of . We consider , with while other model parameters are set by default. In Figure 3 (b), the estimation of is quite satisfying when the width is no smaller than . When the width drops to or smaller, the estimation is not stable but still conservative in the sense that in most cases.
Finally, we examine how the gap size influences the estimation of . We take and . Figure 3 (c) shows that the estimation of is robust to the gap sizes as long as the input and are smaller than the true gaps. This gives us confidence in applying Ucut to identify the cutoff even when there is no gap, which is more realistic.


5.1.3 Sensitivity of the algorithm hyper-parameters
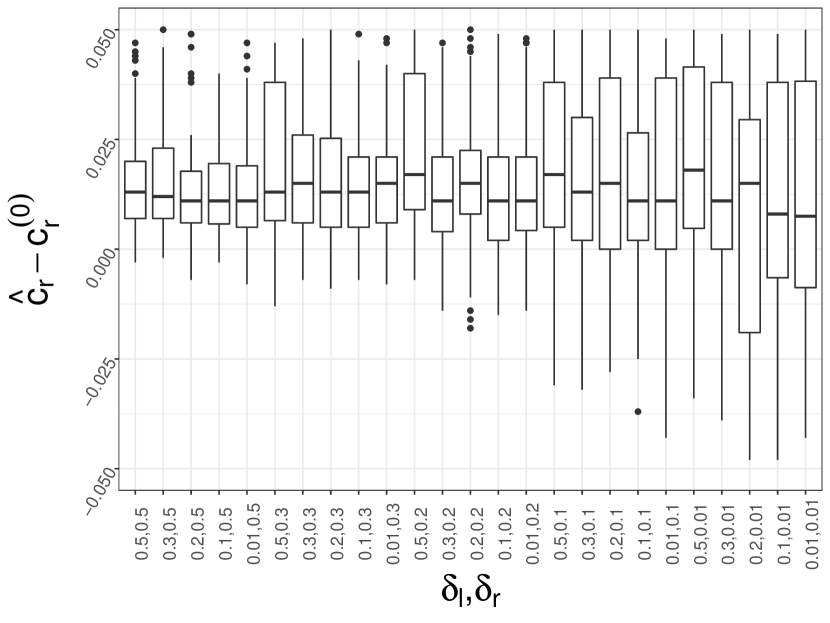
Algorithm 1 (Ucut) mainly have three tuning parameters: the middle point , the left gap and the right gap . For practical use, the three tuning parameters may be misspecified. For example, the middle point is not easy to spot, or the left gap and the right gap are too small. We use the default model parameters as specified in Section 5.1.1. Let and be times the true normalized gaps and respectively. We vary the choice of the middle point . Figure 4 (a) shows that the estimation of is not sensitive to the choice of as long as it is picked within the flat region . If is picked left to the flat region, the has a larger variance but it is more conservative in the sense that in most cases. If is picked right to the flat region, the tends to be .
Next, we fix but consider and , where . We do not consider because there might not exist feasible that satisfies the change-point-constraint. Figure 4 (b) shows that when is within the estimation is satisfying. The estimated can be slightly smaller than the true when but in a tolerable range.
In a nutshell, the choices of , and are crucial to Algorithm 1. But the sensitivity analysis indicates that it is not necessary to be excessively cautious. In practice, picking these parameters by eyeballs can give a safe estimation in most cases.


5.1.4 Comparison to other methods
To examine the power and the capacity of controlling FDR of Ucut, we consider the two-group model as specified in Figure 2 (b). The middle part is not identifiable, which means that the samples of the alternative distribution can not be distinguished from those of the null distribution. To reflect this point, we arbitrarily set the proportion of the null distribution in the middle part . The goal is to identify the right cutoff but not because it is impossible to infer .
We compare Ucut to the other four methods that are studied in [7], i.e., ZIGP (Zero-inflated Generalized Poisson), ZIP (Zero Inflated Poisson), GP (Generalized Poisson) and P (Poisson). The data studied in this paper and the associated primary purpose are highly similar to ours. First, they study mutation counts for a specific protein domain, which have excess zeros and are assumed to follow a zero-inflated model. Moreover, the four mentioned methods are used to select significant mutation counts (i.e., cutoff) while controlling a given level of Type I error via False Discovery Rate procedures. Therefore, the four methods are good competitors for Ucut in view of the data distribution and the method usage.
Figure 5 shows that GP and P use rather small cutoffs and have too large FDRs. ZIGP and ZIP are over-conservative if the target FDR level is too low at or , thus having quite low power. They perform better when the target FDR level is set to be . On the other hand, Ucut can control FDR at if we directly use as the cutoff. The associated power is better than those of ZIGP and ZIP. In order to loosen the FDR control and get higher power, it is fine to use a slightly smaller cutoff than . From this result, we confirm that Ucut is a better fit for the scenario where the middle part is not distinguishable.

5.2 Application to Real Data
We further demonstrate the performance of Ucut on the real datasets used in [18]. To be specific, we apply the GeneFishing method to four GTEx RNAseq datasets, liver, Artery Coronary, Transverse Colon, and Testis; see Table 1 for details. We leverage the same set of bait genes used in [18]. The number of fishing rounds is set to be .
| # samples | # genes | |
|---|---|---|
| Liver | ||
| Artery-Coronary | ||
| Colon-Transverse | ||
| Testis |
Once the CFRs are generated, we apply Algorithm 1 with the middle point , and . We take to be ten times because there are much more zeros than ones in CFRs. As shown in Section 5.1, Ucut is not sensitive to the three hyper-parameters. The change of these parameters lays little influence on the results. Table 2 shows that for each tissue Ucut gives the estimator of that yields to discoveries. We estimate the false discovery rate using the second approach in [18]. Note that for Artery-Coronary, the estimated by Ucut (which gives ) is less extreme than simply using (which gives ). It implicates that Ucut adapts to the tissue and can pick a cutoff with a reasonable false discovery rate.
| bootstrapping estimation | # discovery (use ) | |||
|---|---|---|---|---|
| Liver | ||||
| Artery-Coronary | ||||
| Colon-Transverse | ||||
| Testis |
In addition, we also apply the GeneFishing method to a single-cell data of the pancreas cells from Tabula Muris111https://tabula-muris.ds.czbiohub.org. It contains cells from mice and genes expressed in enough cells out of about genes. We find out bait genes based on the pancreas insulin secretion gene ontology (GO) term.
Unlike Figure 1, the CFRs of this data set do not appear in a U shape. Instead, we observe a unimodal pattern around zero and an increasing pattern around one (Figure 6). Nonetheless, it does not hinder us from using Ucut to determine the cutoff, since we are mainly concerned about the right cutoff and Section 5.1 demonstrates that Ucut is conservative even if the model is misspecified. By using , and , Ucut gives as the estimation of the right cutoff, which discovers genes. By doing the GO enrichment analysis, we find out that these identified genes are enriched for the GO of response to ethanol with p-value , the GO of positive regulation of fatty acid biosynthesis with p-value , and the GO of eating behavior with p-value . These GOs have been shown to relate to insulin secretion in literature [13, 26, 35], which indicates the effectiveness of Ucut.

6 Discussion
In this work, we analyze the binomial mixture model (1.2) under the U-shape constraint, which is motivated by the results of the GeneFishing method [18]. The contributions of this work are two-fold. First, to the best of our knowledge, this is the first paper to investigate the relationship between the binomial size and the sample size for the binomial mixture model under various conditions for . Second, we provide a convenient tool for the downstream decision-making of the GeneFishing method.
Despite the identifiability issue of the binomial mixture model, we show that the estimator of the underlying distribution deviates from the true distribution, in some distance, at most a small quantity that depends on . The implication is that to have the same convergence rate as if there is no binomial randomness, we need for the empirical CDF and the Grenander estimator when the underlying density is respectively bounded and monotone. It is also of great interest to further investigate how the minimal hinges on the smoothness of the underlying distribution, e.g., studying the kernel density estimator and the smoothing spline estimator under the binomial mixture model.
To answer the motivating question of how large the CFR should be so that the associated sample can be regarded as a discovery in the GeneFishing method, we propose the BMU model to depict the underlying distribution and the NPMLE method Ucut to determine the cutoff. This estimator comprises two Grenander estimators, thus having a cubic convergence rate as the Grenander estimator when . We also show that the estimated cutoff is larger than the true cutoff with high probability. On the other hand, all these results are established for a bounded density. We leave it as future work to study the relationship between the convergence rate and the smoothness of the density.
Finally, we conclude the paper with a discussion on the empirical performance of Ucut. The simulation studies reassure the practitioners that Ucut is not sensitive to the choice of its hyper-parameters — the default setup can handle most cases. In the real data example used in [18], Ucut gives a cutoff with a low estimated FDR using much less time than [18]. In the other example of the pancreas single-cell dataset, we use GeneFishing with Ucut and find out genes that are shown to be related to pancreas insulin secretion by GO enrichment analysis. Therefore, we are interested and confident in discovering exciting signals in biology or other fields if GeneFishing with Ucut can be applied to more real datasets.
References
- [1] Raghu Raj Bahadur “Some approximations to the binomial distribution function” In The Annals of Mathematical Statistics JSTOR, 1960, pp. 43–54
- [2] Fadoua Balabdaoui et al. “On the Grenander estimator at zero” In Statistica Sinica 21.2 NIH Public Access, 2011, pp. 873
- [3] O Barndorff-Nielsen “Identifiability of mixtures of exponential families” In Journal of Mathematical Analysis and Applications 12.1 Elsevier, 1965, pp. 115–121
- [4] Lucien Birge “The grenander estimator: A nonasymptotic approach” In The Annals of Statistics JSTOR, 1989, pp. 1532–1549
- [5] Steven R Dunbar “The de Moivre-Laplace Central Limit Theorem” In Technical Report, 2011
- [6] Martin D Fraser, YU SHENG HSU and WALKER JJ “Identifiability of finite mixtures of von Mises distributions” In The Annals of Statistics 9.5 JSTOR, 1981, pp. 1130–1134
- [7] Iris Ivy M Gauran et al. “Empirical null estimation using zero-inflated discrete mixture distributions and its application to protein domain data” In Biometrics 74.2 Wiley Online Library, 2018, pp. 458–471
- [8] Ulf Grenander “On the theory of mortality measurement: part ii” In Scandinavian Actuarial Journal 1956.2 Taylor & Francis, 1956, pp. 125–153
- [9] Leonardo Grilli, Carla Rampichini and Roberta Varriale “Binomial mixture modeling of university credits” In Communications in Statistics-Theory and Methods 44.22 Taylor & Francis, 2015, pp. 4866–4879
- [10] Wassily Hoeffding “Probability Inequalities for Sums of Bounded Random Variables” In Journal of the American Statistical Association 58.301 Taylor & Francis, 1963, pp. 13–30 DOI: 10.1080/01621459.1963.10500830
- [11] Jian Huang and Jon A Wellner “Estimation of a monotone density or monotone hazard under random censoring” In Scandinavian Journal of Statistics JSTOR, 1995, pp. 3–33
- [12] Youping Huang and Cun-Hui Zhang “Estimating a monotone density from censored observations” In The Annals of Statistics JSTOR, 1994, pp. 1256–1274
- [13] Zhen Huang and $A$ke Sjöholm “Ethanol acutely stimulates islet blood flow, amplifies insulin secretion, and induces hypoglycemia via nitric oxide and vagally mediated mechanisms” In Endocrinology 149.1 Oxford University Press, 2008, pp. 232–236
- [14] Hanna K Jankowski and Jon A Wellner “Estimation of a discrete monotone distribution” In Electronic journal of statistics 3 NIH Public Access, 2009, pp. 1567
- [15] John T Kent “Identifiability of finite mixtures for directional data” In The Annals of Statistics JSTOR, 1983, pp. 984–988
- [16] Marc Kéry “Estimating abundance from bird counts: binomial mixture models uncover complex covariate relationships” In The Auk 125.2 Oxford University Press, 2008, pp. 336–345
- [17] János Komlós, Péter Major and Gábor Tusnády “An approximation of partial sums of independent RV’-s, and the sample DF. I” In Zeitschrift für Wahrscheinlichkeitstheorie und verwandte Gebiete 32.1-2 Springer, 1975, pp. 111–131
- [18] Ke Liu et al. “GeneFishing to reconstruct context specific portraits of biological processes” In Proceedings of the National Academy of Sciences 116.38 National Acad Sciences, 2019, pp. 18943–18950
- [19] Frederic M Lord “Estimating true-score distributions in psychological testing (an empirical Bayes estimation problem)” In Psychometrika 34.3 Springer, 1969, pp. 259–299
- [20] Frederic M Lord and Noel Cressie “An empirical Bayes procedure for finding an interval estimate” In Sankhyā: The Indian Journal of Statistics, Series B JSTOR, 1975, pp. 1–9
- [21] U Lüxmann-Ellinghaus “On the identifiability of mixtures of infinitely divisible power series distributions” In Statistics & probability letters 5.5 Elsevier, 1987, pp. 375–378
- [22] AW Marshall “Discussion on Barlow and van Zwet’s paper” In Nonparametric Techniques in Statistical Inference 1969 Cambridge University Press New York, 1970, pp. 174–176
- [23] Albert W Marshall and Frank Proschan “Maximum likelihood estimation for distributions with monotone failure rate” In The annals of mathematical statistics 36.1 JSTOR, 1965, pp. 69–77
- [24] Pascal Massart “The tight constant in the Dvoretzky-Kiefer-Wolfowitz inequality” In The annals of Probability JSTOR, 1990, pp. 1269–1283
- [25] Trent McDonald et al. “Evidence of Absence Regression: A Binomial N-Mixture Model for Estimating Bird and Bat Fatalities at Wind Power Facilities” In bioRxiv Cold Spring Harbor Laboratory, 2020 DOI: 10.1101/2020.01.21.914754
- [26] Christopher J Nolan et al. “Fatty acid signaling in the -cell and insulin secretion” In Diabetes 55.Supplement 2 Am Diabetes Assoc, 2006, pp. S16–S23
- [27] Katherine M O’Donnell, Frank R Thompson III and Raymond D Semlitsch “Partitioning detectability components in populations subject to within-season temporary emigration using binomial mixture models” In PLoS One 10.3 Public Library of Science, 2015, pp. e0117216
- [28] GP Patil and Sheela Bildikar “Identifiability of countable mixtures of discrete probability distributions using methods of infinite matrices” In Mathematical Proceedings of the Cambridge Philosophical Society 62.3, 1966, pp. 485–494 Cambridge University Press
- [29] BLS Prakasa Rao “Estimation for distributions with monotone failure rate” In The annals of mathematical statistics JSTOR, 1970, pp. 507–519
- [30] J Andrew Royle “N-mixture models for estimating population size from spatially replicated counts” In Biometrics 60.1 Wiley Online Library, 2004, pp. 108–115
- [31] Theofanis Sapatinas “Identifiability of mixtures of power-series distributions and related characterizations” In Annals of the Institute of Statistical Mathematics 47.3 Springer, 1995, pp. 447–459
- [32] S Sivaganesan and James Berger “Robust Bayesian analysis of the binomial empirical Bayes problem” In Canadian Journal of Statistics 21.1 Wiley Online Library, 1993, pp. 107–119
- [33] GM Tallis “The identifiability of mixtures of distributions” In Journal of Applied Probability 6.2 JSTOR, 1969, pp. 389–398
- [34] GM Tallis and Peter Chesson “Identifiability of mixtures” In Journal of the Australian Mathematical Society 32.3 Cambridge University Press, 1982, pp. 339–348
- [35] Muneki Tanaka et al. “Eating pattern and the effect of oral glucose on ghrelin and insulin secretion in patients with anorexia nervosa” In Clinical endocrinology 59.5 Wiley Online Library, 2003, pp. 574–579
- [36] Henry Teicher “Identifiability of finite mixtures” In The annals of Mathematical statistics JSTOR, 1963, pp. 1265–1269
- [37] Henry Teicher “Identifiability of mixtures” In The annals of Mathematical statistics 32.1 Institute of Mathematical Statistics, 1961, pp. 244–248
- [38] Hoben Thomas “A binomial mixture model for classification performance: A commentary on Waxman, Chambers, Yntema, and Gelman (1989)” In Journal of Experimental Child Psychology 48.3 Elsevier, 1989, pp. 423–430
- [39] Aad Van der Vaart and Mark Van der Laan “Smooth estimation of a monotone density” In Statistics: A Journal of Theoretical and Applied Statistics 37.3 Taylor & Francis, 2003, pp. 189–203
- [40] Y. Wang “Nonparametric Estimation Subject to Shape Restrictions” University of California, Berkeley, 1992 URL: https://books.google.com/books?id=QmVMAQAAMAAJ
- [41] Larry Wasserman “All of nonparametric statistics” Springer Science & Business Media, 2006
- [42] GR Wood “Binomial mixtures: geometric estimation of the mixing distribution” In The Annals of Statistics 27.5 Institute of Mathematical Statistics, 1999, pp. 1706–1721
- [43] Michael Woodroofe and Jiayang Sun “A penalized maximum likelihood estimate of f (0+) when f is non-increasing” In Statistica Sinica JSTOR, 1993, pp. 501–515
- [44] Guohui Wu, Scott H Holan, Charles H Nilon and Christopher K Wikle “Bayesian binomial mixture models for estimating abundance in ecological monitoring studies” In Annals of Applied Statistics 9.1 Institute of Mathematical Statistics, 2015, pp. 1–26
- [45] Sidney J Yakowitz and John D Spragins “On the identifiability of finite mixtures” In The Annals of Mathematical Statistics JSTOR, 1968, pp. 209–214
Appendix
Appendix A The Identifiability Issue of Binomial Mixture Model
We review existing results for mixtures of distributions and the binomial mixture model in the literature. A general mixture model is defined as
| (A.1) |
where is a density function for all , is a Borel measurable function for each and is a distribution function defined on . The family , is referred to as the kernel of the mixture and as the mixing distribution function. In order to devise statistical procedures for inferential purposes, an important requirement is the identifiability of the mixing distribution. Without this condition, it is not meaningful to estimate the distribution either non-parametrically or parametrically. The mixture defined by (A.1) is said to be identifiable if there exists a unique yielding , or equivalently,if the relationship
implies for all .
The identifiability problems concerning finite and countable mixtures (i.e. when the support of in (A.1) is finite and countable respectively) have been investigated by [36, 28, 45, 33, 6, 34, 15]. Examples of identifiable finite mixtures include: the family of Gaussian distribution , the family of one-dimensional Gaussian distributions, the family of one-dimensional gamma distributions, the family of multiple products of exponential distributions, the multivariate Gaussian family, the union of the last two families, the family of one-dimensional Cauchy distributions, etc.
For sufficient conditions for identifiability of arbitrary mixtures, [37] studied the identifiability of mixtures of additive closed families, while [3] discussed the identifiability of mixtures of some restricted multivariate exponential families. [21] has given a sufficient condition for the identifiability of a large class of discrete distributions, namely that of the power-series distributions. Using topological arguments, he has shown that if the family in question is infinitely divisible, mixtures of this family are identifiable. For example, Poisson, negative binomial, logarithmic series are infinitely divisible, so arbitrary mixtures are identifiable.
On the other hand, despite being a power-series distribution, the binomial distribution is not infinitely divisible. So its identifiability is not established for the success parameter [31]. In fact, the binomial mixture has often been regarded as unidentifiable, as can be determined only up to its first moments when is known exactly. To be more specific, is a linear function of the first moments of , for every . Therefore, with the same first moments, any other will make the same mixed distribution . To ensure the identifiability for the binomial mixture model, it is a common practice to assume that corresponds to a finite discrete pmf or a parametric density (e.g., beta distribution).
In particular, there are two results for the identifiability of binomial mixture model [36]:
-
1.
If in (A.1) is a binomial distribution with a known binomial size , and the support of only contain points. A necessary and sufficient condition that the identifiability holds is that .
-
2.
Consider as a binomial distribution with binomial size and probability , where , and the support of is . If for , then (A.1) is identifiable.
In this study, we are interested in the regime where the support size of may not be finite, and thus the identifiability may fail for the binomial mixture model. Some efforts are made without identifiability. [20, 32] constructed credible intervals for the Bayes estimators of each point mass and that of , which rely on the lower order moments of the mixing distribution. [42] empirically shows that their proposed nonparametric maximum likelihood estimator of is unique with high probability when is large. However, these results are far from satisfying in terms of our ultimate goal — estimate or infer the underlying distribution .
Appendix B A motivating Example: GeneFishing
The study of model (1.2) with a large is motivated by the GeneFishing method [18]. Provided some knowledge involved in a biological process as “bait”, GeneFishing was designed to “fish” (or identify) discoveries that are yet identified related to this process. In this work, the authors used a set of pre-identified “bait genes”, all of which have known roles in cholesterol metabolism, and then applied GeneFishing to three independent RNAseq datasets of human lymphoblastoid cell lines. They found that this approach identified other genes with known roles not only in cholesterol metabolism but also with high levels of consistency across the three datasets. They also applied GeneFishing to GTEx human liver RNAseq data and identified gene glyoxalase I (GLO1). In a follow-up wet-lab experiment, GLO1 knockdown increased levels of cellular cholesterol esters.
The GeneFishing procedure is as follows, as shown in Figure 7:
-
1.
Split the candidate genes randomly into many sub-search-spaces of genes per sub-group (e.g., ), then added to by the bait genes. This step is the key reduction of search space, facilitating making the “signal” standing out from the “noise”.
-
2.
Construct the Spearman co-expression matrices for gene pairs contained within each sub-search-space. Apply the spectral clustering algorithm (with the number of clusters equal to ) to each matrix separately. In most cases, the bait genes cluster separately from the candidate genes. But in some instances, candidate gene(s) related to the bait genes will cluster with them. When this occurs, the candidate gene is regarded as being “fished out”.
-
3.
Repeat steps 1 and 2 (defining one round of GeneFishing) times (e.g., ) to reduce the impact that a candidate gene may randomly co-cluster with the bait genes.
-
4.
Aggregate the results from all rounds, and the -th gene is fished out times out of . The final output is a table that records the “capture frequency rate” (). The “fished-out” genes with large CFR values are thought of as “discoveries”. Note, however, instead of considering these “discoveries” to perform a specific or similar function as the bait genes, we only believe they are likely to be functionally related to the bait genes. Figure 1 displays the distribution of ’s with and the number of total genes on four tissues for the cholesterol-relevant genes.

Compared to other works for “gene prioritization”, GeneFishing has three merits. First, it takes care of extreme inhomogeneity and low signal-to-noise ratio in high-throughput data using dimensionality reduction by subsampling. Second, it uses clustering to identify tightly clustered bait genes, which is a data-driven confirmation of the domain knowledge. Finally, GeneFishing leverages the technique of results aggregation (motivated by a bagging-like idea) in order to prioritize genes relevant to the biological process and reduce false discoveries.
However, there remains an open question on how large a CFR should be so that the associated gene is labeled as a “discovery”. [18] picked a large cutoff by eye. It is acceptable when the histograms are sparse in the middle as in the liver or the transverse colon tissues (Figure 1 (a)(b)), since cutoff and cutoff make little difference in determining the discoveries. On the other hand, for the artery coronary and testis tissues (Figure 1 (c)(d)), the non-trivial middle part of the histogram is a mixture of the null (irrelevant to the biological process) distribution and the alternative (relevant to the biological process) distribution. The null and the alternative are hard to separate since the middle part is quite flat. Existing tools using parametric models to estimate local false discovery rates [7] are not able to account for the middle flatness well. They tend to select a smaller cutoff and produce excessive false discoveries. [18] provided a permutation-like procedure to compute approximate p-values and false discovery rates (FDRs). Nonetheless, there are two problems with this procedure. On the one hand, it is substantially computationally expensive, considering another round of permutation is added on top of numerous fishing rounds. On the other hand, the permutation idea is based on a strong null hypothesis that none of the candidate non-bait genes are relevant to the bait genes, thus producing an extreme p-value or FDR, which is unrealistic.
To identify a reasonable cutoff on CFRs, we assume there is an underlying fishing rate , reflecting the probability that the -th gene is fished out in each GeneFishing round. The fishing rates are assumed to be independently sampled from the same distribution . Thus, the observation (or ) can be modelled by (1.2). We mention that the independence assumption is raised mainly for convenience but not realistic de facto since genes are interactive and correlated in the same pathways or even remotely. Consequently, the effective sample size is smaller than expected. However, this assumption is still acceptable by assuming only a handful of candidate genes are related to the bait genes, which is reasonable from the biological perspective. Furthermore, we notice that in Figure 1 there exists a clear pattern that the histogram is decreasing on the left-hand side and increasing on the right-hand side for all four tissues. In the middle, liver and colon transverse display sparse densities while artery coronary and testis exhibit flat ones. Thus, we can impose a U shape constraint on the associated density of (see Section 4.1 for details). Then the original problem becomes finding out the cutoff where the flat middle part transits to the increasing part on the right-hand side.
Appendix C Review of Grenander Estimator
Monotone density models are often used in survival analysis and reliability analysis in economics—see [12, 11]. We can apply maximum likelihood for the monotone density estimation. Suppose that is a random sample from a density on that is known to be nonincreasing; the maximum likelihood estimator is defined as the nonincreasing density that maximizes the log-likelihood [8] first showed that this optimization problem has a unique solution under the monotone assumption — so the estimator is also called the Grenander estimator. The Grenander estimator is explicitly given as the left derivative of the least concave majorant of the empirical distribution function . The least concave majorant of is defined as the smallest concave function with for every . Because is concave, its derivative is nonincreasing.
Theorem 16 ([23])
Suppose that are i.i.d random variables with a decreasing density on . Then the Grenander estimator is uniformly consistent on closed intervals bounded away from zero: that is, for each , we have
The inconsistency of the Grenander estimator at , when is bounded, was first pointed out by [43]. [2] later extended this result to other situations, where they consider different behavior near zero of the true density. Theorem 17 explicitly characterizes the behavior of at zero.
Theorem 17 ([43])
Suppose that is a decreasing density on with , and let denote a rate Poisson process. Then
where is a uniform random variable on the unit interval.
[4] proved that Grenander estimator has a cubic root convergence rate in the sense of norm, as in Theorem 18. [39] pointed out that the rate of convergence of the Grenander estimator is slower than that of the monotone kernel density estimator when the underlying function is smooth enough.
Theorem 18 ([4])
Suppose is a decreasing density on with . it follows that
where is a constant that only depends on .
[29] first obtained the limiting distribution of the Grenander estimator at a point. He has proved that converges to the location of the maximum of the process , where and is the standard two-sided Brownian motion on such that ; see [29]. [40] extends this result to the flat region and a higher order derivative, as stated in Theorem 19.
Theorem 19 ([40])
Suppose is a decreasing density on and is smooth at . It follows that
-
(A)
If is flat in a neighborhood of . Let be the flat part containing . Then,
where is the slope at of the least concave majorant in of a standard Brownian Bridge in .
-
(B)
If near for some and . Then,
where is the slope at of the least concave majorant of the process , and is a standard two-sided Brownian motion on with .
Appendix D Proof of Proposition 4
Proof Suppose
Note that
| (D.1) | |||||
Decompose , where , . The previous example shows that the difference for the part in Equation (D.1) is at most So we only need to take care of the part in Equation (D.1), i.e.,
provided . Here . Define
[1][Theorem 1] indicates that , where . Let . By Stirling’s formula and Taylor expansion on , we can obtain
and we can rewrite
So we have
Then it follows that
Together, we have , where is a residual term with , and are positive constants.
Appendix E Proof of Proposition 7
Proof The proof of this theorem follows from that of Theorem 8, so we defer most details to the proof of the latter.
From Equation (F.5), we know that
where is still defined as the bin that contains among . Note that
Following the proof of bounding in Theorem 8, we can bound
where .
Following the proof of bounding in Theorem 8, we can bound
where for some constant that only depends on .
To bound
we still follow the proof of bounding in Theorem 8. The problem is that there are terms instead terms. By carefully arranging the terms, and using the fact that for any positive , it can be easily seen that we still get the same bound as above. In total, we have
where is some constant that only hinges on . To minimize the upper bound, take . Thus, it follows that
where is some constant that only depends on and .
Appendix F Proof of Theorem 8
Theorem 8 relies on the local limit theorem of binomial distribution, as follows.
Lemma 20
Suppose , with . For any such that as , then
where is the error from the Gaussian approximation to Binomial point mass function, and is the error from the summation series approximating the integral. Specifically, we have
where , and are two positive constants that depend on via .
The detailed proof of Lemma 20 can be easily obtained by adapting that of [5]. Now we prove Theorem 8:
Proof
Denote by the risk at a point . We decompose the risk into the variance and the bias square as follows.
| (F.1) |
For the variance part, denote by . We have
| (F.2) |
where is a positive constant that relies on . For the bias part, since
| (F.3) |
and it is well known that
| (F.4) |
where is positive constant that only relies on . We only need to consider . By definition,
| (F.5) | |||||
By McDiarmid’s inequality, it follows that
where is the maximal value of in . Take , i.e., the least integer that is not smaller than . Then we have
| (F.6) |
where is a universal positive constant. Similarly, we can show that for some positive constant . Next, we investigate . Denote by and the left boundary and the right boundary of the interval . By Lemma 20, it follows that
where , , and are positive constants that only depend on . We consider the summation of the error terms in , :
-
(I)
where are positive constants that only depend on .
-
(II)
where is a positive constant that only depends on .
-
(III)
where only depends on .
We call the summation of the error terms by , which satisfies , where only depends on . Similarly, for the summation of the error terms in , , we have the same rate. Now we consider
| (F.7) | |||||
where are positive constants that only depend on . Equation (i) uses the Fubini’s theorem; Inequality (ii) applies the mean value theorem to the function , where is a constant; Inequality (iii) holds since , thus is bounded, and attains the maximal when ; Inequality (iv) is obtained via integral by part. Similarly, has the same rate as (F.7). Putting (F.5)(F.6)(F.7) together, we have
| (F.8) |
where is some constant that only depends on . Combining Inequalities (F.1)(F.2) (F.3)(F.4) and Inequality (F.8), it follows that
The minimal risk is no larger than , which is attained when , . Here are positive constants that only depend on and .
Appendix G Proof of Theorem 9
Proof Note for the point mass function , we have an additional information that only hold for the discrete case but not for the density case,
We follow the proof of Theorem 8 and can show that
When , we have . Here where do not depend on , and .
Appendix H Proof of Theorem 10
We first define a few concepts. Let denote the interval , where and in our setup. We set
Any finite increasing sequences with , generates a partition of into intervals , . When no confusion arises, we put for , for and so on. Set a functional defined for positive by
Before proving Theorem 10, we state the needed lemma, which is adapted from Lemma 1 in [4]. The proof also follows that of Lemma 1 in [4].
Lemma 21
Let be some partition of , an absolutely continuous distribution function, the corresponding empirical c.d.f based on and , the related Grenander estimators defined on the associative intervals. Define
with and to be the respective derivatives of and . Then
In the proof, there are many similar notations that might be confusing. I list all of them below for clarity and the convenience of reference.
-
•
Let , i.e. the c.d.f of . Let be the derivative of .
-
•
For any interval , , . and correspond to and with in our setup.
-
•
and are the respective least concave majorants of and condition on the interval . Let and be the derivatives of and . , and , correspond to , and , .
-
•
For any partition , let be the derivative of
-
•
, , , .
-
•
For any partition , . .
-
•
for some ; .
-
•
For an interval ,
-
–
Let and be the number of ’s and ’s that fall in , respectively.
-
–
Define and to be the respective conditional c.d.f’s of the ’s and ’s that fall in , and their derivatives.
-
–
Define , .
-
–
Define and be the respective least concave majorants of and conditional on . Let and be derivatives of and respectively.
-
–
Proof
We want to show that
where are universal constants. Then, the convergence of only hinges on the characteristics of . For example, when is a decreasing function on such that for some and , then Proposition 4 of [4] shows that
| (H.1) |
where and . It implies that has an convergence rate at , where , are some positive constants.
By Lemma 21 it is sufficient to prove that for any partition of , we have
where is the derivative of . This is certainly true if for any arbitrary sub-interval of , the below inequality holds
In order to prove this inequality, we assume there are ’s and ’s falling in the interval respectively. Here, has a binomial distribution and has a binomial distribution , where is the derivative of the c.d.f . Then with ,
| (H.2) |
The only difficulty comes from the last term. Define and to be the respective conditional c.d.f’s of the ’s and ’s that fall in , and their derivatives. Then
because the joint distribution of the ’s falling in given is the same as the distribution of i.i.d variables from . If is the uniform c.d.f on , then
Here Equation holds because this is an equivalent expression of the total variation for with a non-increasing derivative and with a flat density. Equation holds because
-
•
for any and the equality occurs when the derivative of changes.
-
•
attains the maximum at a point which corresponds to a change of the derivative of .
where . Plug in this result into the inequality (H.2), and with the Cauchy-Schwarz inequality, we have
By the Cauchy-Schwarz inequality, it follows that
Note that
where Inequality (c) holds because of Proposition 3 with (note that , and ). Thus, for , it follows that
Then we complete the initial claim by letting and . Finally, as Proposition 4 in [4], we construct the partition of where is the integer such that , , , and for . Since , there is only finite number of intervals. It can be shown that when is the smallest integer that is larger than , this partition can give the inequality (H.1).
Appendix I Proof of local asymptotics
I.1 Local Inference of when is absolutely continuous
Theorem 5 shows that the empirical CDF is a consistent estimator of the population CDF. We also want to understand the uncertainty of the empirical CDF. The Komlós-Major-Tusnády (KMT) approximation shows that can be approximated by a sequence of Brownian bridges [17]. This result can be extended to the empirical CDF based on ’s; see Theorem 22. The proof is similar to Theorem 5 by splitting into and . The former can be bounded by the original KMT approximation and the latter one can be bounded using Proposition 3. Another thing needs taking care of is to bound , which is in fact the sum of two independent Gaussian random variables with zero mean and variance upper bounded by .
Theorem 22 (Local inference of )
Suppose corresponds to a density on with . There exists a sequence of Brownian bridges such that
for all positive integers and all , where , , and are positive constants.
I.2 Proof of Theorem 12
This proof is adapted from [40]. Define
Then with probability one, we have the switching relation
| (I.1) |
By the relation (I.1), we have
From the definition of , it follows that
By Theorem 22,
where is a sequence of Brownian Bridges, constructed on the same space as the . So the limit distribution of is the same as that of the location of the maximum of the process . Note that is concave and linear in , then
and
Hence the location of the maximum of behaves asymptotically as that of
where is a standard Brownian bridge in . Thus,
by the definition of . That completes the proof of Part (A). The proof of Part (B) follows in a similar manner.
Appendix J Proof of Theorem 13
Proof Let , , , , be the output of Algorithm 1 with the input , and , . The corresponding estimator of is termed as . For simplicity, we consider , i.e., the case where there is only the decreasing part and the flat part. For a general case where , we just need to focus on .
By Theorem 10, we know that when for some positive constants and that only depend on . For , it is easy to see that , where is a residual term with for some positive constant , because the estimator of the flat region converges at a square-root rate [40]. In other words, it is unlikely to find a desired gap beyond .
If , we select the desired . Otherwise, define
Then , it follows that
When , it implies that
Since the distance between and reduces at a cubic-root rate, it follows that for some positive constant . So is the desired cutoff. Finally, we have that
where the last inequality holds because and is bounded can imply . Here , are two positive constants that only depend on .
Appendix K Proof of Theorem 14
Proof Given the interior point in the flat region, the left decreasing part and the right increasing part are disentangled. Therefore, we only need to consider the left side, and the right side can be proven in the same way. A necessary condition for being identified as feasible for the change-point-gap constraint in Algorithm 1 is that
where and . It is easy to see that
and
where and ; and are residual terms with for some universal positive constant by McDiarmid inequality. So the necessary condition is
| (K.1) |
with for some constant that only depends on , and . If and the constraint is violated at , then for any the constraint is violated at with high probability since and ( and are both in the flat region). Therefore, to see if , we only need to investigate the smallest with that is in the searching space of Algorithm 1. By Theorem 12, when , it follows that
By the necessary condition (K.1), then asymptotically we have
where the last approximation holds because is the smallest one searching candidate with , so it is very close to .
Appendix L Proof of Theorem 15
Proof Let , , , , be the output of Algorithm 1 with the input , and , . The corresponding estimator of is termed as . Let be the log likelihood function associated with the optimization problem (4.2.2), and . It follows that
where . From the relations between total variation, Kullback-Leibler divergence and the distance,
we have
where the last inequality uses the Jensen’s inequality. On the other hand, it follows that
Then the problem is reduced to bound . From Theorem 13, we know that when , there exist and in the neighborhoods of and respectively, such that the resulting estimator satisfies for some positive constants and . Along with Lemma 23, we conclude the desired result.
Lemma 23
Let be the solution by Algorithm 1 with input and and the corresponding . Assume and . If , then is a necessary condition for
where are four constants depending on , , and ; , .
Proof For simplicity, we consider , i.e., the case where there is only the decreasing part and the flat part. For a general case where , we just need to focus on . If , the distance between and is
where and are two positive constants that only depend on , , since . The inequality (a) and the equation (c) are obtained using Theorem 10. The equation (b) makes use of assumption that the right hand side is a flat region. Then, if there exists such that , then , for some positive constant .
Next, we investigate the case when . Denote , , , and . It is easy to check that
Using the convergence of the Grenander estimator, it follows that
If there exists such that , we have
If the output of Algorithm 1 is True, for some positive constant . Then it must follow that , where . So far, we have proven the lemma for the left hand side. For the right hand side, it can be proven similarly.
Appendix M More simulation studies
Besides the linear valley model specified in Section 5.1.1, we also consider a non-linear model and a misspecified model.
For the non-linear model, we replace the left linear part in the linear valley model with an unnormalized decreasing function , . We replace the right linear part with an unnormalized increasing function , . Here is a density of Beta distribution with parameters and . In this case, we use . Applying Ucut to the synthetic data generated by this model, we observe similar results as those from the linear valley model; see Figure 8910. It indicates that Ucut can detect the cutoff in a satisfying range as long as the underlying model satisfies Assumption 1 and Assumption 2. Ucut is particularly useful when the middle part is “uniform” and not easy to tell apart the samples of the alternative distribution from those of the null distribution.
For the misspecified model, we replace the left linear part with an unnormalized unimodal function , . We replace the right linear part with an unnormalized unimodal function , . The results can be found in Figure 11,12,13. We observe that the estimated is not satisfying until attains . So in the other experiments, we use . We find that although the variance of becomes larger than the estimate for the correctly specified model, the detected cutoff tends to be larger than the truth. It implies that if the model does not align with Assumption 1 and Assumption 2, Ucut is still useful because it is conservative.


