Bulge and in High Mass Galaxies: Constraints on the Origin of Bulges in Hierarchical Models
Abstract
We use the bulge Sérsic index and bulge-to-total ratio () to explore the fundamental question of how bulges form. We perform bulge-disk-bar decomposition on -band images of 143 bright, high mass () low-to-moderately inclined () spirals. Our results are: (1) Our -band bar fraction () is consistent with that from ellipse fits. (2) 70% of the stellar mass is in disks, 10% in bars, and 20% in bulges. (3) A large fraction ( 69%) of bright spirals have 0.2, and 76% have low bulges. These bulges exist in barred and unbarred galaxies across a wide range of Hubble types. (4) About 65% (68%) of bright spirals with () bulges host bars, suggesting a possible link between bars and bulges. (5) We compare the results with predictions from a set of CDM models. In the models, a high mass spiral can have a bulge with a present-day low 0.2 only if it did not undergo a major merger since . The predicted fraction ( 1.6%) of high mass spirals, which have undergone a major merger since and host a bulge with a present-day low , is a factor of over thirty smaller than the observed fraction () of high mass spirals with . Thus, contrary to common perception, bulges built via major mergers since seriously fail to account for the bulges present in of high mass spirals. Most of these present-day low bulges are likely to have been built by a combination of minor mergers and/or secular processes since .
1 Introduction
The formation of galaxies is a classic problem in astrophysics. Contemporary galaxy formation models combine the well-established Cold Dark Matter (CDM) cosmology, which describes behavior of dark matter on very large scales, with baryonic physics to model galaxy formation. In the early Universe, pockets of dark matter decoupled from the Hubble flow, collapsed into virialized halos, and then clustered hierarchically into larger structures. Meanwhile, gas aggregated in the interiors of the halos to form rotating disks, which are the building blocks of galaxies (Steinmetz & Navarro 2002; Cole et al. 2000). Such disks are typically destroyed during major mergers of galaxies with mass ratio (e.g. Steinmetz & Navarro 2002; Naab & Burkert 2003; Burkert & Naab 2004; Mihos & Hernquist 1996). When the mass ratio is close to unity, the remnant is a spheroid with properties close to that of a classical bulge, namely a steep de Vaucouleurs surface brightness profile and a high ratio of ordered-to-random motion (). We shall return to this point in 5. Within this hierarchical framework, the disk of spiral galaxies forms when gas of higher specific angular momentum subsequently accretes around the bulge (Steinmetz & Navarro 2002; Burkert & Naab 2004).
CDM-based simulations of galaxy formation face several challenges. One issue is the angular momentum problem; simulated galaxy disks have smaller scalelengths and, therefore, less specific angular momentum than their counterparts in nature (Navarro & Steinmetz 2000; Burkert & D’Onghia 2004; D’Onghia et al. 2006). A second issue is the problem of bulgeless or low bulge-to-total mass ratio () spirals. Within the CDM paradigm, galaxies that had a past major merger at a time when its mass was a fairly large fraction of its present-day mass are expected to have a significant bulge with large and high Sérsic index. Depending on the merger history and hence the fraction of spiral galaxies that fulfill this criterion (see 5.8) we can end up with a small or large fraction of present-day galaxies with low .
There is rising evidence that low and bulgeless galaxies are quite common in the local Universe, especially in low mass or late-type galaxies. Late-type Sd galaxies often harbor no bulge (Böker et al. 2002). Kautsch et al. (2006) and Barazza, Jogee & Marinova (2007, 2008) also find from the analysis of several thousand late-type SDSS galaxies that 15-20% of such disk galaxies out to appear bulgeless. Of the 19 local galaxies ( Mpc) with circular velocity km s-1, 11 (58%) have pseudobulges instead of merger-built classical bulges (Kormendy & Fisher 2008).
Theoretical work by Koda et al. (2007) conclude the survival of disk-dominated systems in a CDM universe is compatible with observational constraints provided classical bulges form only in mergers where and the primary halo has virial velocity km s-1.
Evidence also suggests that bulges with low and low Sérsic index may be common even in high mass and/or early-type spirals. Balcells et al. (2003) report that early-type disk galaxies tend to have 3 and often from 1 to 2. Laurikainen et al. (2007) find barred and unbarred early-type disk galaxies to have mean between 0.25 and 0.35, while later Hubble types have ; they also find mean bulge Sérsic indices to be or less across the Hubble sequence. Graham & Worley (2008) report low ratios across the Hubble sequence based on bulge-disk decomposition of -band images of local spiral galaxies. They suggest that these low values are problematic for CDM simulations, but no quantitative assessment of the extent of the problems is presented.
These emerging statistics on the fraction of bulgeless () galaxies, and galaxies with low and low bulges provide important first constraints. More work is needed to fully explore the the distribution of bulge properties in both high and low mass galaxies. In particular, we need to explore how the observed distributions of bulge and compare with the predictions from CDM-based simulations of galaxy evolution. To the best of our knowledge, few such quantitative comparisons have been attempted, so that it remains unclear how serious the problem of low galaxies is. This study is an attempt to derive robust observational constraints on bulge properties in high mass spirals and to attempt such a comparison with models.
Completely resolving the issue of low systems will require understanding the different types of bulges and their formation pathways. Bulges are commonly divided in several groups: classical bulges, boxy/peanut bulges, and ‘pseudobulges’ or disky bulges. Classical bulges are believed to be built by major mergers () and the associated violent relaxation of stars. They are associated with modest-to-high bulge Sérsic indices, in the range (Hopkins et al. 2008; Springel et al. 2005; Robertson et al. 2006; 5.8). Boxy/peanut bulges are believed to be the result of vertical resonances and buckling instabilities in bars, which are viewed at high inclination (Combes & Sanders 1981; Combes et al. 1990; Pfenniger & Norman 1990; Bureau & Athanassoula 2005; Athanassoula 2005; Martinez-Valpuesta et al. 2006). Pseudobulges or disky bulges are believed to form as a result of gas inflow into the central kiloparsec and subsequent star formation building a compact disky, high stellar component (Kormendy 1993; Jogee 1999; Kormendy & Kennicutt 2004, hereafter KK04; Jogee, Scoville, & Kenney 2005; Athanassoula 2005; Kormendy & Fisher 2005). Pseudobulges tend to have a bulge (Kormendy & Fisher 2005; Fisher & Drory 2008).
One possibility for the formation of disky bulges or pseudobulges is the idea of secular evolution (Kormendy 1993; KK04; Jogee, Scoville, & Kenney 2005), where a stellar bar or globally oval structure in a non-interacting galaxy drives the gas inflow into the inner kpc via shocks and gravitational torque. Another idea for building disky bulges is that the gas inflow into the inner kiloparsec is driven by external non-secular processes, such as tidal interaction and minor mergers. The gas inflow in such cases can be caused by a tidally induced non-axisymmetric feature, such as a bar (e.g., Quinn et al. 1993; Hernquist & Mihos 1995), and by tidal torques from the companion. The subsequent central star formation can still form a compact high stellar component, a pseudobulge.
Throughout this paper, we avoid making any a priori assumptions about the origin of different types of bulges by simply referring to them according to their bulge Sérsic index or bulge-to-total mass ratio (). We consider bulges of high ( 4), intermediate () and low () index, as well as those of low or high .
The structural properties of galaxy components, such as bulges, disks, and bars can be derived through the decomposition of the light distribution, taking into account the PSF. Many early studies have performed only two component bulge-disk decomposition (e.g., Allen et al. 2006; Byun & Freeman 1995; de Jong 1996; Simard 1998; Wadadekar et al. 1999), ignoring the contribution of the bar, even in strongly barred galaxies. However, recent work has shown that it is important to include the bar in decomposition of barred galaxies, else the ratio can be artificially inflated, and bulge properties skewed (e.g., Laurikainen et al. 2005, 2007). Furthermore, since most () bright spiral galaxies are barred in the NIR (Eskridge et al. 2000; Laurikainen et al. 2004; Marinova & Jogee 2007, hereafter MJ07; Menendez-Delmestre et al. 2007), the inclusion of the bar is quite important. This has led to several recent studies, where bulge-disk-bar decomposition are being performed (e.g. Laurikainen et al. 2007; Reese et al. 2007; Gadotti & Kauffmann 2007).
Another advantage of bulge-disk-bar decomposition over bulge-disk decomposition is that the former allows us to constrain the properties of the bar itself. Bars provide the most important internal mechanism for redistributing angular momentum in baryonic and dark matter components (e.g. Weinberg 1985; Debattista & Sellwood 1998, 2000; Athanassoula 2002; Berentzen, Shlosman, & Jogee 2006). They efficiently drive gas inflows into the central kpc, feed central starbursts (Elmegreen 1994; Knapen et al. 1995; Hunt & Malakan 1999; Jogee et al. 1999; Jogee, Scoville, & Kenney 2005; Jogee 2006) and lead to the formation of disky or pseudobulges (see above). Furthermore, the prominence of strong bars out to over the last 8 Gyr (Jogee et al. 2004; Sheth et al. 2008) suggest that bars have been present over cosmological times and can shape the dynamical and secular evolution of disks. Thus, quantifying bar properties, such as the fractional light and mass ratio (Bar/), can yield insight into these processes.
In this paper, we constrain the properties of bulges and bars along the Hubble sequence, and compare our results with CDM-based simulations of galaxy evolution. In 2, we define our complete sample of 143 bright () low-to-moderately inclined () spirals from the Ohio State University Bright Spiral Galaxy Survey (OSUBSGS; Eskridge et al. 2002), which is widely used as the local reference sample for bright spirals by numerous studies (e.g., Eskridge et al. 2000; Block et al. 2002; Buta et al. 2005; MJ07 ; Laurikainen et al. 2004, 2007). In 3, we perform bulge-disk and bulge-disk-bar decompositions of -band images using GALFIT (Peng et al. 2002), and derive fractional light ratios (, Bar/, Disk/), as well as Sérsic indices and half light radii or scale lengths. Tests to verify the robustness of our decompositions are presented in 4. In 5, we present our results. Specifically, the total stellar mass present in bulges, disks, and bars is calculated ( 5.2). In 5.3, the distribution of bulge Sérsic index and as a function of galaxy Hubble type and stellar mass is presented, and the surprising prevalence of bulges with low Sérsic index and low is established. A comparison with other works is presented in 5.4. We examine how Bar/ and bar fraction (the fraction barred disks) change as a function of host galaxy properties in 5.5. In 5.8, we compare our observed distribution of bulge and in high mass () spirals with predictions from CDM cosmological semi-analytical models. 6 summarizes our results.
2 Sample Properties
2.1 OSUBSGS
Our dataset is derived from the 182 -band images from the public data release of the Ohio State University Bright Spiral Galaxy Survey (OSUBSGS; Eskridge et al. 2002). These galaxies are a subset of the RC3 catalog that have , Hubble types (S0/a to Sm), , and . Imaging of OSUBSGS galaxies spans optical and near infrared (NIR) wavelengths with images available for most galaxies. OSUBSGS images were acquired on a wide range of telescopes with apertures ranging from 0.9-2.4m. The data were acquired with a variety of telescopes and detectors, but mainly with the 1.8 m Perkins reflector at Lowell Observatory and the CTIO 1.5 m telescope with the OSIRIS detector, having 18.5 micron pixels (Depoy et al. 1993). Pixel scale is dependent on the telescope and for these observations ranged between /pix. Exposure times were heterogeneous, but the total observing time per object was typically between 10-15 minutes in . The resulting limiting -band surface brightness is mag arcsec-2. The typical limiting surface brightnesses of the images mag arcsec-2 in -band and mag arcsec-2 in -band (Eskridge et al. 2002). The seeing depends on observing time and location. We find the -band images have seeing of .
We choose to use the NIR images rather than optical ones for several reasons. Firstly, NIR images are better tracers of the stellar mass than optical images, and the mass-to-light ratio is less affected by age or dust gradients. Secondly, obscuration by dust and SF are minimized in the NIR, compared to the optical. As the -band images are of poor quality, we settle on using the -band images.
The OSUBSGS is widely used as the local reference sample for bright spirals by numerous studies (e.g. Eskridge et al. 2000; Block et al. 2002; Buta et al. 2005; MJ07; Laurikainen et al. 2004, 2007). Thus, there are numerous complementary results that we can use or compare with. In particular, MJ07 have identified bars in this sample using quantitative criteria based on ellipse fitting, and characterized their sizes, position angles, and ellipticities.
OSUBSGS is a magnitude-limited survey with objects whose distances range up to Mpc. Faint galaxies are inevitably missed at larger distances, resulting in the absolute magnitude distribution in Figure 1. We compare the -band LF of this sample with a Schechter (Schechter 1976) LF (SLF) with Mpc-3, , and (Efstathiou, Ellis & Peterson 1988) in Figure 2. The volume used to determine the number density in each magnitude bin is
| (1) |
where
| (2) |
is the maximum distance out to which a galaxy of absolute magnitude can be observed given the cutoff magnitude . If the SLF is representative of the true LF, then Figure 2 suggests that the OSUBSGS sample is seriously incomplete at , while at the brighter end (-19.3 to -23) the shape of its LF matches fairly well the SLF. We thus conclude that the sample is reasonably complete for bright ( or 0.33 ) galaxies.
We exclude highly inclined () galaxies for which structural decomposition does not yield accurate results. Thus, our final sample S1 consists of 143 bright () low-to-moderately inclined () spirals with Hubble types mainly in the range S0/a to Sc (Figure 1). Of the 126 for which we could derive stellar masses (see 2.2, most have stellar masses (Figure 3). Table 1 summarizes the morphologies, luminosities, and stellar masses of the sample. Note that there are few galaxies of late Hubble types (Scd or later) and we do not draw any conclusions on such systems from our study. In a future paper, we will tackle galaxies of lower mass and later Hubble types.
2.2 Stellar Masses
We derive global stellar masses for most of the OSUBSGS sample galaxies using the relation between stellar mass and rest-frame color from Bell et al. (2003). Using population synthesis models, the latter study calculates stellar ratio as a function of color using functions of the form , where and are bandpass dependent constants and C is a constant that depends on the stellar initial mass function (IMF). For the band Bell et al. (2003) find and ; assuming a Kroupa (1993) IMF, they find . This yields an expression for the stellar mass in for a given color:
| (3) |
where
| (4) |
Here, is the luminosity parametrized in terms of absolute magnitude.
How reliable are stellar masses determined from this procedure? Clearly, the above relationship between and cannot apply to all galaxies, and must depend on the assumed stellar IMF, and range of ages, dust, and metallicity. However, it is encouraging to note that several studies (Bell et al. 2003; Drory et al. 2004; Salucci, Yegorova, & Drory 2008) find generally good agreement between masses based on broad-band colors and those from spectroscopic (e.g. Kauffmann et al. 2003) and dynamical (Drory et al. 2004) techniques. Typical errors are within a factor of two to three. Salucci et al. (2008) derive disk masses with both photometric and kinematic methods and find the two methods are equivalent on average. For a sample of 18, they find an rms scatter of 0.23 dex, while on an individual basis the deviation can be as high as 0.5 dex.
We used this relation to compute stellar masses for 126 of 143 (88%) objects. The remainder did not have colors available in the Hyperleda database or RC3. The mass distribution is summarized in Figure 3. Individual masses are listed in Table 1. This sample of 126 galaxies is referenced henceforth as sample S2.
3 Method and Analysis
The structural properties of galaxy components, such as bulges, disks, and bars can be derived through the decomposition of the 2D light distribution, taking into account the PSF. There are several algorithms for luminosity decomposition, including GIM2D (Simard et al. 2002), GALFIT (Peng et al. 2002), and BUDDA (de Souza et al. 2004). The latter two allow bulge-disk-bar decomposition, while the former only allows bulge-disk decomposition.
Most previous work has addressed bulge-disk decomposition only. Allen et al. (2006), for example, performed bulge-disk decomposition of -band images with GIM2D on 10,095 galaxies from the Millennium Galaxy Catalog (Liske et al. 2003; Driver et al. 2005). However, recent work (e.g., Laurikainen et al. 2005; Graham & Balcells, in preparation) has shown that the ratio can be artificially inflated in a barred galaxy unless the bar component is included in the decomposition. The fact that most () bright spiral galaxies are barred in the NIR (Eskridge et al. 2000; Laurikainen et al. 2004; MJ07; Menendez-Delmestre et al. 2007), further warrants the inclusion of the bar. Another advantage of bulge-disk-bar decomposition is that it allows us to constrain the properties of the bar itself, and to constrain scenarios of bar-driven evolution (see 1).
Motivated by these considerations, several studies have tackled the problem of bulge-disk-bar decomposition. Laurikainen et al. (2005, 2007) have developed a multicomponent decomposition code designed to model bulges, disks, primary and secondary bars, and lenses; they apply Sérsic functions to bulges and use either Sérsic or Ferrers functions to describe bars and lenses. Reese et al. (2007) have written a non-parametric algorithm to model bars in -band images. Gadotti & Kauffmann (2007) are performing bulge-disk-bar and bulge-disk decomposition of 1000 barred and unbarred galaxies from SDSS with the BUDDA software.
In this study, we perform two-component bulge-disk decomposition and three-component bulge-disk-bar decomposition of the OSUBSGS sample with GALFIT. We note that Laurikainen et al. (2007) have also performed bulge-disk-bar decomposition on the OSUBSGS sample. However, there are also important complementary differences between our study and theirs. The decomposition algorithm and tests on the robustness performed in our study are different (see 3 and 4). Furthermore, unlike Laurikainen et al. (2007), we also compare the bulge-to-total ratio () with predictions from hierarchical models of galaxy evolution ( 5), and also present the distribution of bar-to-total ratio (Bar/).
3.1 Image Preparation
Running GALFIT on an image requires initial preparation. The desired fitting region and sky background must be known, and the PSF image, bad pixel mask (if needed), and pixel noise map must be generated. We addressed these issues as follows: (1) The GALFIT fitting region must be large enough to include the outer galaxy disk, as well as some sky region. Since cutting out empty regions of sky can drastically reduce GALFIT run-time, a balance was sought between including the entire galaxy and some decent sky region, while excluding large extraneous blank sky areas. (2) It is possible for GALFIT to fit the sky background, but this is not recommended. When the sky is a free parameter, the wings of the bulge Sérsic profile can become inappropriately extended, resulting in a Sérsic index that is too high. Sky backgrounds were measured separately and designated as fixed parameters; (3) GALFIT requires a PSF image to correct for seeing effects. Statistics of many stars in each frame can be used to determine an average PSF. However, many of our images contain merely a few stars. Instead, a high S/N star from each frame was used as a PSF. (4) We used ordered lists of pixel coordinates to make bad pixel masks, which are useful for blocking out bright stars and other image artifacts. (5) We had GALFIT internally calculate pixel noise maps for an image from the noise associated with each pixel. Noise values are determined from image header information concerning gain, read noise, exposure time, and the number of combined exposures.
3.2 Decomposition Steps
Figure 4 summarizes our method of decomposition, which we now detail. GALFIT requires initial guesses for each component it fits. It uses a Levenberg-Marquardt downhill-gradient algorithm to determine the minimum based on the input guesses. GALFIT continues iterating until the changes by less than 5e-04 for five iterations (Peng et al. 2002). We recognize that a drawback to any least-squares method is that a local minimum, rather than a global minimum, in space may be converged upon. We explore this possibility with multiple tests described in § 4. We adopted an iterative process, involving three separate invocations of GALFIT, to perform 1-component, 2-component, and 3-component decomposition:
-
1.
Stage 1 (single Sérsic): In Stage 1, a single Sérsic component is fitted to the galaxy. This serves the purpose of measuring the total luminosity, which is conserved in later Stages, and the centroid of the galaxy, which is invariant in later fits.
-
2.
Stage 2 (exponential plus Sérsic): In Stage 2, the image is fit with the sum of an exponential disk and a Sérsic component. During the Stage 2 fit, the disk and are held constant at values, which we take from the published ellipse fits of MJ07, as well as ellipse fits of our own. This procedure reduces the number of free parameters in the fit by fixing the disk and , which are easily measurable parameters. It also prevents GALFIT from confusing the disk and bar, and artificially stretching the disk along the bar PA in an attempt to mimic the bar. As initial guesses for the Sérsic component in Stage 2, the output of Stage 1 is used. The Sérsic component in Stage 2 usually represents the bulge, in which case Stage 2 corresponds to a standard bulge-disk decomposition.
However, in a few rare cases, where the galaxy has just a bar and a disk, the Sérsic component in Stage 2 represents a bar. The latter is recognizable by a low Sérsic index and large half-light radius.
-
3.
Stage 3 (exponential plus two Sérsic components): In Stage 3, a three-component model consisting of an exponential disk, a Sérsic bulge, and a Sérsic bar is fit. As suggested by Peng et al. (2002), the bar can be well described by an elongated, low-index Sérsic () profile. As in Stage 2, the disk and are held constant at values predetermined from ellipse fits. We provide initial guesses for the bar and , based on ellipse fits of the images from MJ07 or analysis of the images in DS9. We provide GALFIT with input guesses for the bulge parameters, based on the output from Stage 2. In principle, it is also possible to generate reasonable guess parameters for the bulge and disk from a bulge-disk decomposition on a profile taken along a select PA. As described in 4.3, we also experiment with initial guesses derived in this way, and find that the final convergence solution is the same. We also note that GALFIT fixes the bulge and does not allow it to vary with radius, while real bulges may have a varying . We tested the impact of fixed and varying bulge on the derived ( 4.1) and find that there is no significant change in .
For objects with central point sources, the bulge Sérsic index in the Stage 2 and Stage 3 models can be inadvertently overestimated unless an extra nuclear component is added to the model. Balcells et al. (2003) note that for galaxies imaged both from the ground and , the combination of unresolved central sources and seeing effects mimic high-index bulge Sérsic profiles in the ground images. Depending on sample and resolution, the frequency of central sources can range from 50% to 90% (Ravindranath et al. 2001; Böker et al. 2002; Balcells et al. 2003). Ravindranath et al. (2001) find a frequency of 50% in early type (E, S0, S0/a) galaxies, while Böker et al. (2002) measure a frequency of 75% for spirals with Hubble types Scd to Sm. Balcells et al. (2003) determine a frequency of 84% for S0-Sbc galaxies imaged with . Our dataset most closely resembles the latter sample, so we might expect that, as an upper limit, a similar fraction of our galaxies will need to be corrected with an extra compact component.
We added point sources as third or fourth components to the initial models. For those cases where the model successfully converged with the extra component, the images were visually inspected to verify the presence of a central bright source. Sometimes, the model converged to significantly different and unreasonable parameters for all components. Other times, the model would converge to a very dim point source without changing any of the other model parameters. Where new model parameters were not unreasonable and not identical to the case without the point source, the new model was adopted. This was the case for 111 of 143 (78%) of our sample. The point sources contribute less than 1%, 3%, and 5% of the total luminosity 55%, 86%, and 95% of the time, respectively. As the point sources take up such a small fraction of the light distribution, their contribution is folded back into in all cases where a point source was modeled. Inclusion of the point source reduced bulge index by for both barred and unbarred galaxies. Such a change is expected based on the above discussion. The decline in bulge index caused a minor decrease in ; on the mean, this change was 1.04% for barred galaxies and 0.32% for unbarred galaxies. For barred galaxies, this light most primarily added to rather than Bar/.
It is important to recognize the physical significance of the added nuclear components. We began by determining which objects show evidence for AGN activity. The sample was checked against the catalog of Ho et al. (1997), the Véron Catalog of Quasars & AGN, 12th Edition (Véron-Cetty & Véron 2006), and NED. Of the 111 objects fit with point sources, 43 (39%) contain AGN. An additional 20 (18%) possess HII nuclei according to Ho et al. (1997) and visibly show bright compact nuclei. The remaining 48 (43%) probably contain neither AGN nor HII nuclei, but could house nuclear star clusters. For these objects, we visually inspected the images to ensure there was a bright compact source at the center. We are confident that the fitted point source components have physical counterparts in the data images.
GALFIT also allows a diskiness/boxiness parameter to be added to any Sérsic or exponential profile. We did not use this parameter for any bulge or disk profiles. Bars in general have boxy isophotes, and we could have included the diskiness/boxiness parameter in the bar profiles. However, it was found that adding boxiness to the bar did not change any model parameters, including fractional luminosities , , and Bar/, by more than a small percentage, even though the appearance of the residual images improved in some cases due to the change in bar shape. Consequently, we chose to neglect bar boxiness altogether.
3.3 Choosing the Best Fit Between Stage 2 and Stage 3
All objects in our sample were subjected to Stages 1, 2, and 3. Depending on whether a galaxy with a bulge is unbarred or barred, its best fit should be taken from the Stage 2 bulge-disk decomposition or the Stage 3 bulge-disk-bar decomposition, respectively. For objects with prominent bars, it is obvious that the Stage 3 model provides the best fit. However, it is more difficult to decide between Stage 2 versus Stage 3 fits in galaxies which host weak bars with no strong visual signature. In practice, we therefore applied the set of criteria below to each galaxy in order to select between the Stage 2 bulge-disk decomposition and Stage 3 bulge-disk-bar decomposition. Table 1 lists the model chosen for each galaxy. Table 2 summarizes the model parameters from the best fits.
For completeness, we note that for the few rare galaxies (see 3.2) that have just a bar and a disk, the choice of a final solution is between the Stage 2 bar-disk decomposition and Stage 3 bulge-disk-bar decomposition. The same guidelines below can be used to identify the best model.
-
1.
GALFIT calculates a and for each model. It was found that almost universally declines between the Stage 2 and Stage 3 fits for a given object. This is because in the Stage 3 fit, five extra free parameters (bar luminosity, , Sérsic index, , and ) are added with the Sérsic bar component, allowing GALFIT to almost always make a lower model during Stage 3. However, this does not necessarily mean that the solution in Stage 3 is more correct physically. Thus, an increasing was interpreted as a sign that the Stage 3 fit should not be adopted, but a decreasing was not considered as a sufficient condition to adopt Stage 3.
-
2.
In cases with prominent bars, a symmetric light distribution due to unsubtracted bar light was often found in the Stage 1 and Stage 2 bulge-disk residuals. This was strong evidence that the Stage 3 bulge-disk-bar fit be selected. NGC 4643 is shown in Figure 5 because it has a particularly striking bar residual; the corresponding fit parameters appear in Table 3. Note that in all figures and tables, we adopt the convention that PA values are positive/negative if they are measured from North counterclockwise/clockwise.
-
3.
The Stage 2 and Stage 3 models were selected only so long as the model parameters were all well behaved. In unbarred galaxies, the Stage 3 model parameters might be unphysically large or small, in which case the Stage 2 fit was favored. Conversely, in galaxies with prominent bars, the bulge component of the Stage 2 bulge-disk fit tends to grow too extended in size. Addition of a bar in the Stage 3 bulge-disk-bar fit removes this artifact, giving a more physical solution. An extreme example of this situation is the barred galaxy NGC 4548, which has a prominent bar and a faint disk. The Stage 2 fit, based on a Sérsic bulge and exponential disk, is highly inadequate to describe the bulge, disk, and the bar because it leads to an extremely extended bulge. The Stage 3 bulge-disk-bar fit, however, yields a believable fit with a prominent bar. The results of Stage 1, Stage 2, and Stage 3 are displayed in Figure 6 and Table 4.
-
4.
Not all barred galaxies had unphysical Stage 2 models. Instead, the bulge could be stretched along the of the bar, giving the bulge a lower Sérsic index and larger effective radius. A Stage 3 model that returned the bulge to a size and shape more representative of the input image was favored over the Stage 2 fit. Figure 7 and Table 5 demonstrate this behavior in NGC 4902. We distinguish this effect from cases like NGC 4548 (Figure 6 and Table 4) where the Stage 2 fit is completely wrong.
-
5.
In cases where there was no bar, GALFIT can sometimes be enticed into fitting a bar to any existing spiral arms, rings, or the clumpy disks of late-type spirals. Stage 3 fits in these cases could be discarded by noting the resulting discrepancies in appearance between the galaxy images and the Stage 3 model images. Examples of false bars are shown in Figure 8.
After fitting the whole sample and picking the best fit from either the Stage 2 bulge-disk decomposition or the Stage 3 bulge-disk-bar decomposition, we also performed the following extra tests. For our sample S1 of 143 bright () low-to-moderately inclined () spirals in the OSUBSGS survey, we determine the fraction (75 of 143 or ) of spiral galaxies where a bulge-disk-bar decomposition was picked as the best fit for the -band image. There are also eight galaxies with pure bar-disk fits. The -band bar fraction, which is defined as the fraction of disk galaxies that are barred, is therefore (83 of 143). We then compared our results () with the -band bar fraction (60%) determined from ellipse fits of the OSUBSGS sample by MJ07, with a slightly more conservative inclination cut (). The two numbers are in excellent agreement. As a further check to our fits, we compare the bar and unbarred classification for individual galaxies from our fits with those from MJ07, which were based on ellipse fits. Of the 73 galaxies that we classify as barred, and that are mutually fitted by MJ07, 54 (74%) are also classified as barred by MJ07. The remaining 19 (26%) galaxies are mainly weakly barred (with Bar/ below 0.08). Their RC3 optical types are weakly barred AB (10), barred B (7), and unbarred A (2).
In most previous bulge-disk and bulge-disk-bar decomposition, the issue of parameter coupling and the systematic exploration of local versus global minima in have been ignored. Quantifying how the parameters are coupled is important in measuring error bars for the model parameters. With models containing several free parameters, this is not an easy task. Although we also do not address this problem in rigorous detail, we describe in § 4.4 simple test that explores parameter coupling in our models.
4 Extra Tests to Verify Correctness of Fits
4.1 Varying as a Function of Radius
Models generated with GALFIT do not allow the of the bulge, disk, or bar to vary with radius. Since real bulges may have a varying , it is legitimate to investigate the impact of fixing the bulge on the estimated . We therefore performed the following test on NGC 4548. To mimic a model bulge of varying , we fitted the bulge light of NGC 4548 with ten concentric Sérsic profiles of increasing and varying . The of the outermost profile comes from the original bulge model (see Table 4) where was kept constant with radius. The separation in between adjacent profiles is 0.5 pixels (0.75”). The luminosity, Sérsic index, , and of each profile were free parameters. The disk and bar components were fixed to the values in Table 4, as the emphasis was on the change in the bulge.
Figure 9 compares the obtained by fitting the bulge of NGC 4548 with a Sérsic model of constant as opposed to a Sérsic model varying . The bulge (0.88), (-66.5), and (13%) from the original Sérsic fit of constant (Table 4) are indicated with horizontal lines on the 3 panels. The top two panels show the run of (0.85 to 1.0) and ( to ) of the ten concentric Sérsic profiles. It can be seen that the Sérsic indices of the ten bulge models were generally higher toward the center and declined at larger , indicating that the ‘fitted bulge is more concentrated at the center. The bottom panel shows the cumulative calculated by summing all models with . The last point representing the summed from all ten components is 14.5%, in good agreement with the 13.0% value from the Sérsic fit of constant . Thus, using a Sérsic model of constant , does not have any significant adverse impact on our derived in NGC 4548.
4.2 Fitting Artificially Simulated Images
An elementary test is to determine if GALFIT can recover the known parameters of artificially simulated noisy images. The images were simulated by taking parametric model images produced by GALFIT, and adding noise to the images with the PyFITS module for Python (Barrett & Bridgman 1999). Noise in each pixel was calculated by adding in quadrature the noise due to the source, sky, and read noise. The standard deviation of pixel noise in electrons was computed as
| (5) |
where is the number of electrons due to the source, is the number of electrons due to the sky, and is the detector read noise. The contribution due to detector dark current was very small and therefore neglected. The offset added to each pixel was drawn from a normal distribution centered at zero with standard deviation .
Our test sample consisted of 40 models (20 bulge-disk and 20 bulge-disk-bar) with noise added as described. Thirty of the images included point sources as extra components. The range explored for each parameter in the model images is a fair representation of the parameter space covered by our full sample (e.g., ranges from , the bulge index ranges from , and the full range of possible bulge and bar PA was also tested ( to )). In terms of surface brightness, the models span five magnitudes in mean surface brightness inside the disk scalelength. Examples of the noise-added models are shown in Figure 10.
The noisy images were subjected to the decomposition procedure outlined in Figure 4. GALFIT reproduced the model (bulge, disk, bar, and point source) parameters quite closely for the majority of the test cases. Figure 11 compares the recovered versus original model parameters. Except for some extreme cases where the images were highly distorted by noise, all parameters were recovered to within a few percent. Figure 12 plots the ratio of model-to-recovered parameter against mean surface brightness inside the disk scalelength; there is no strong trend in error with dimming surface brightness. This suggests our decompositions are effective across the parameter space spanned by our sample. The overall success of this test is evidence that GALFIT is able to converge to the absolute minimum in space for our bulge-disk and bulge-disk-bar decompositions when the input is the sum of parametric functions.
4.3 Using Decomposition To Generate Guesses for Bulge Parameters
It is important to verify that GALFIT converges to the same solution even if the initial guesses for the bulge parameters in Stage 2 and 3 are different. Bulge-disk decomposition from profiles provides an alternative means of generating initial guesses. While bulge-disk decompositions of radial profiles along the bar major axis can be influenced by the bar, decomposition of cuts along the bar minor axis will not be influenced as heavily. The resulting bulge and disk parameters should be adequate guesses for Stage 3 of our decomposition method.
We tested the robustness of our Stage 3 fits by extracting initial guesses for the bulge and disk using decomposition along the bar minor axis. The nonlinear least-squares algorithm designed to perform the decomposition simultaneously fits the sky-subtracted profiles with the sum of a Sérsic bulge and an exponential disk, while ignoring the PSF. The results from the decomposition include a bulge magnitude, , Sérsic index, disk magnitude, and disk scalelength.
The robustness of several bulge-disk-bar fits were tested by using the results of the decomposition as input to Stage 3. The decompositions do not provide information about the axis ratio () or , so these parameters for the bulge were estimated by eye; for the disk, the and were fixed to the values determined by ellipse fitting, as described in 3.2. The initial bar parameters were unchanged from the earlier Stage 3 fits. In all cases, the new models were identical to the Stage 3 models. As an example, Table 6 compares Stage 3 input derived from 1D decomposition and GALFIT for NGC 4548 and NGC 4643. In each case, both sets of input reproduced the same results.
4.4 Parameter Coupling
Assessing the coupling between model parameters is complicated when models have a large number of free parameters. A standard approach is to calculate confidence regions using multi-dimensional ellipsoids for a given contour. As the errors in the GALFIT models are not normally distributed, but are instead dominated by the systematics of galaxy structure, this approach does not yield meaningful results because of the ambiguity in assessing which contour levels are statistically significant.
We carry out a simple test for representative galaxies to determine not only the effects of parameter coupling, but also the the effect parameter coupling has on model parameter errors, paying particularly close attention to , , and Bar/, as they are of primary interest. We perform this test on four representative galaxies (NGC 3885, NGC 4151, NGC 4643, and NGC 7213). Two are barred (NGC 4151 and NGC 4643). Two have high () bulge indices (NGC 4643 and NGC 7213), and the other two have low () bulge indices.
We fit two and three-component bulge-disk and bulge-disk-bar models using fixed bulge indices of and . The initial inputs to these fits were the same as those used to generate the model in which bulge is a free parameter. We then had GALFIT re-fit the models with bulge index as a free parameter using these output model parameters as input initial guesses. We compare the output of these two fits with the the best fit as selected in § 3.3, in which bulge is a free parameter. Ideally, the re-fits should converge to the same final parameters as the selected best fit.
Table 7 displays the outcome of this test for the four representative systems. For barred galaxies NGC 4643 and NGC 4151, the and re-fits converged to the same as when bulge is initially left a free parameter. , , and Bar/ are precisely equal for NGC 4643, while for NGC 4151 there is a small dispersion of 0.1-0.2%. For unbarred galaxies NGC 3885 and NGC 7213, the re-fits again converged to the same and model parameters as when bulge is initially left a free parameter. This is not true for the re-fits. When the condition is enforced, the bulges in these cases become too extended and luminous while the drop below those when bulge is initially left a free parameter. During the re-fits, increases further at the expense of and the remain unchanged or decrease further. The ratio from the re-fit for NGC 3885 is 1.3, roughly 3.5 times higher than when is free. Given that NGC 3885 is an S0/a galaxy with a bulge embedded in a smooth extended disk, the latter is arguably too large. For NGC 7213, the re-fit yields starkly unphysical values. The ratio is 11.3, and , the ratio between bulge effective radius and disk scalelength is 9.0. The lower in these cases cannot be taken seriously as the bulges are too luminous and the resulting ratios do not match the data images.
As illustrated by the above discussion and Table 7, this test shows that in some cases (e.g., NGC 4643 and NGC 4151) GALFIT converges to the similar model parameters and , , and Bar/ while starting from highly different initial input guesses (e.g. bulge , bulge , and bulge based on the Stage 2 fits) in different regions of parameter space. For NGC 3885 and NGC 7213, however, during the re-fits GALFIT converged to models that were unphysical and different compared with the reasonable models generated with input guesses corresponding to the bulge fixed at or the bulge based on output from Stage 1. In effect, when the initial input guesses were very different from the data images, the resulting models were found, in spite of the lower , to be unphysical through comparison with the input data images. We emphasize that for all sources analyzed in the paper, the data, converged model output, and residuals are always inspected before adopting the best final fit (see § 3.3).
Table 7 also provides hints as to how the model parameters are coupled to bulge index. As suggested in the above discussion, fixing the bulge index to leads to a more extended and luminous bulge, causing bulge and to rise without fail for increasing bulge index. The disk is coupled with the bulge such that increasing bulge index, bulge , and yields a reduction in . At the same time, disk scalelength either increases (NGC 3885 and NGC 4643) or decreases (NGC 3885 and NGC 4151); in the latter two cases, the disk becomes very compact and the bulge quite extended. The behavior of the bar is coupled with both the bulge and disk. In the case of NGC 4643, as bulge index is raised to , bar becomes slightly larger, but Bar/ falls by a factor of 2.6 as light is redistributed from the bar and disk to the bulge. Bar index also declines as the bar assumes a flatter profile. For NGC 4151, bar again increases slightly, but this time Bar/ rises by a factor of 1.7 as light is transferred from the disk to the bulge and bar.
Based on the above test, we stress that GALFIT was able to overcome this parameter coupling in the cases where the input guess parameters well-reflected the data images.
5 Results and Discussion
5.1 Impact of Bars in Decomposition
From the Stage 2 bulge-disk decomposition and Stage 3 bulge-disk-bar decompositions, which we performed on all objects ( 3.2) we saw firsthand the effects of adding a bar to the fit of a barred galaxy. We summarize below some of these effects in order to underscore the importance of including a bar component in the luminosity decomposition of barred galaxies
-
1.
During the Stage 2 bulge-disk decomposition of a barred galaxy, the luminosity which comes from the galaxy’s disk, bulge, and bar gets distributed only between two model components: the model bulge and disk. Since the disk and are measured independently and held constant during the fits, the Stage 2 model tends to distort the bulge in order to fit the bar. Thus, the bulge in the Stage 2 bulge-disk decomposition of a barred galaxy can be artificially long or too bright and extended. When a model bar component is added in the Stage 3 bulge-disk-bar decomposition of a barred galaxy, it forces a reshuffling of the luminosity between the three components. Generally, the bulge declines in luminosity, whereas light can be either taken from, or added back, to the disk.
-
2.
We find that the inclusion of a bar component in the Stage 3 bulge-disk-bar decomposition of a barred galaxy reduces the bulge fractional luminosity , compared with the Stage 2 bulge-disk decomposition. For our 75 barred galaxies, the reductions correspond to factors of less than two, 2 to 4, and above 4, in 36%, 25%, and 39% of barred galaxies, respectively. The larger changes in occur in very strongly barred galaxies, where a prominent bar cause the Stage 2 bulge-disk decomposition to overestimate the bulge. For instance, declines in both of NGC 4643 (Figure 5 and Table 3) and NGC 4548 (Figure 6 and Table 4). In the latter case, is reduced by a factor of between Stage 2 and Stage 3. These examples underscore the importance of including bars in luminosity decomposition of very strongly barred galaxies.
-
3.
The scalelength of the disk is generally unchanged by including the bar. NGC 4548 (Figure 6 and Table 4) is a good example. Sometimes, however, the disk from the Stage 2 bulge-disk decomposition of a barred galaxy is erroneous due to a poor fit. The disk parameters from the Stage 3 bulge-disk-bar decomposition are quite different in such cases. NGC 4643 (Figure 5 and Table 3) illustrates this behavior.
We find that for our sample S1 of 143 bright () low-to-moderately inclined () spirals (Figure 1) in the OSUBSGS survey, 75 of 143 or are better fit with a Stage 3 bulge-disk-bar decomposition than a Stage 2 bulge-disk decomposition. There are also eight galaxies with pure bar-disk fits. As stated in 3.3, the resulting -band bar fraction ( or 83 of 143) is in excellent agreement with the -band bar fraction of 60% reported by MJ07 based on ellipse fits of the OSUBSGS sample, with a slightly more conservative inclination cut ().
5.2 Mass in Bulges, Disks, and Bars
The fractional -band luminosities in the bulge, disk, and bar (, , Bar/) of each galaxy can be considered as a fractional mass if we assume that the same mass-to-light () ratio can be used to convert the -band luminosities of both the numerator (, , or Bar) and the denominator () terms into a stellar mass. This is not an unreasonable assumption as the -band ratio is not very sensitive to differences in dust or age that might exist between the bulge, disk, and bar. The uncertainties in can be estimated by looking at population synthesis models. Charlot, Worthey, & Bressan (1996) find that for idealized galaxies with a single generation of stars, the uncertainties in ratio due to different input stellar models and spectra are roughly for a fixed metallicity and IMF. Furthermore, as the age of a stellar population varies from Gyr to 10 Gyr, the -band ratio rises by a factor of 2 to 3 (Charlot 1996). Asymptotic giant branch (AGB) stars dominate the NIR light for ages between 0.1 and 1 Gyr, while red giant branch (RGB) and super-giant branch (SGB) stars dominate between 1 Gyr and 10 Gyr.
In this paper, we convert the light ratio determined from -band images to a mass ratio by assuming a constant mass-to-light () in the -band for both the bulge and the rest of the galaxy. However, Moorthy & Holtzman (2006) present line strengths of bulges and inner disks for 38 spirals with Hubble types S0 to Sc. They show 76% of spirals have negative metallicity gradients. color gradients are shown to largely match metallicity gradients and are likewise negative outward, indicating bulge is higher than in the disk and bar. If bulges are much older than the disks, then our prescription would underestimate the true mass ratio. If we assume an extreme case where bulges are Gyr and the disk light is dominated by a young 3 Gyr population, our assumption of a constant -band ratio would underestimate the true by a factor of (Charlot 1996). In several sections of the paper (e.g., 5.3, 5.8), we illustrate how our main results would change if the true was higher by up to a factor of two. On the other hand, central regions of galaxies may harbor intense episodes of star formation. If the bulge is younger than the disk and happens to have star formation and a significant young population of massive stars, then our prescription could overestimate the true mass ratio. This would make our current results on the high fraction of low bulges even stronger.
Using the total galaxy stellar mass from 2.2, the fractional masses can be converted into absolute masses. (We do not convert the -band luminosity directly into a mass as the -band images do not have photometric calibration). The results are shown in Table 8. For our sample S1 of 143 bright () low-to-moderately inclined () spirals with a mass-weighted mean Hubble type of Sab-Sb, we find that of the stellar mass is in disks, 10% is in stellar bars and is in bulges (with in bulges and in bulges). Thus while bulges with are highly ubiquitous (see next section), they only account for a small fraction of the total stellar mass budget.
Figure 13 shows the stellar mass for bulges, disks, and bars along the Hubble sequence.
It is useful to compare our results with those of Driver et al. (2006), who performed bulge-disk decomposition of -band images with GIM2D on 10,095 galaxies from the Millennium Galaxy Catalog (Liske et al. 2003; Driver et al. 2005). They found 68.6% of the stellar mass to be in disks, and 32.6% in bulges (with 30.8% in high bulges, and 1.8% in low bulges). Their study thus finds a higher stellar mass fraction in all bulges (32.6% vs our 18.9%), and in high bulges (30.8% vs our 10.4%), and a lower fraction in low bulges (1.8% vs our 8.4%), and disks+bars (68.6% vs our 71.6% + 9.6%). This difference can be attributed to the fact that the Driver et al. (2006) study did not perform bulge-disk-bar fits and thus, their ratios may be skewed to higher values.
5.3 Distribution of Bulge Index and
Figure 14 shows the individual and mean and bulge Sérsic index, plotted, as a function of Hubble type and galaxy stellar mass. Barred and unbarred galaxies are shown separately. Figure 15 shows the relationship between bulge index and .
We first consider the values in Figure 14. The mean in barred galaxies is lower than in unbarred galaxies, but there is a large overlap in the individual values. The offset in the mean of barred and unbarred galaxies reported here, agrees with the result of Laurikainen et al. (2007; see 5.4) on the same sample. We also note that does not correlate with Bar/ (Fig. 16): aside from the six galaxies with large Bar/ (), most galaxies have low-to-moderate Bar/ and a wide range of is seen at each Bar/. This is reassuring and suggests that the bar fit is not arbitrarily biasing the values. The distribution of Bar/ is further discussed in 5.5.
How does the vary as a function of Hubble type and galaxy stellar mass? Bulges with very high () exist primarily in galaxies with high mass () and early types (S0/a to Sab). Bulges with very low () lie primarily in lower mass galaxies with later morphologies (Sb to Sc). It is striking that of bright () low-to-moderately inclined () spirals have : these bulges are pervasive and exist across the whole spectrum of S0/a to Sd. The results are summarized in Table 9. We shall return to this point in § 5.8. We note again that these mass ratios were calculated assuming a constant ratio in the -band for the bulge and disk components. As noted in 5.2, if the bulge in these high mass spirals is much younger (older) than the disk and bar, then the can be overestimated (underestimated) by up to a factor of two, and the limiting value of 0.2 for the cited in the above fraction, would have to be modified in the extreme case to 0.1 and 0.4, respectively.
Some of the low values for six barred S0/a and Sa galaxies in Figure 14 may at first look suspicious. Balcells et al. (2007) report the mean for S0 galaxies to be 0.25, so much smaller are potentially worrisome. OSUBSGS -band images of these objects in Figure 17 show a smooth extended disk around the bulge. It should be noted that Hubble types were originally assigned on a combination of criteria including disk smoothness and spiral arm topology in addition to the prominence of the bulge. It is likely that these galaxies were assigned early Hubble types due to their smooth extended disks, in spite of their low bulge-to-disk ratio.
Similarly, some of the high bulges in three of the Sc galaxies may at first seem odd. However, again, visual inspection of their image (Figure 17) reveals prominent spiral arms and clumpiness, which may explain why they were assigned late Hubble types.
How does the bulge Sérsic index vary as a function of Hubble type, and galaxy stellar mass (Figure 14), as well as (Figure 15)? The results are summarized in Table 9. Only a small fraction () of bright spirals have high bulges; such bulges lie primarily in S0/a to Sab, and have a large . A moderate fraction () have intermediate bulges; these exist in barred and unbarred S0/a to Sd, and their spans a wide range (0.03 to 0.5) with a mean of 0.29. A strikingly large fraction () of bright spirals have low bulges; such bulges exist in barred and unbarred galaxies across a wide range of Hubble types, and their varies from 0.01 to 0.4, with most having .
5.4 Comparison With Other Work
As an independent check of our decomposition method, we compare our results with independently published decompositions.
We find our mean -band (Figure 18) ratios are comparable to the -band derived with the bulge-disk decompositions of Graham (2001) and Trujillo et al. (2002). Like Graham (2001) and Trujillo et al. (2002), we find is widely variable with Hubble type and that mean steadily declines from Sa through Scd galaxies. Graham (2001) and Trujillo et al. (2002) find bulge indices are widely variable within a Hubble type, but they are in general for early types and for late types. We likewise find wide scatter in bulge index with bulges existing in both early and late types. Figure 18 is also in good agreement with the more recent results of Graham & Worley (2008), who have calculated, as a function of morphology, inclination and dust-corrected and bulge Sérsic indices. They find values are typically .
Another meaningful comparison can be made with Laurikainen et al. (2007) who, using their own decomposition code, fit a hybrid sample containing some OSUBSGS galaxies combined with additional S0 galaxies. One difference between their work and ours is that they typically model bars with a Ferrers function, but may sometimes use a Sérsic profile, while we use only the latter. Also, they include additional components to model secondary bars or inner disks. They report a distinct offset in the mean between barred and unbarred galaxies, which we confirm in Figure 14. Their mean are similar to ours, and they conclude that pseudobulges exist throughout the Hubble sequence. The Sérsic indices derived by Laurikainen et al. (2007) are likewise similar, on the mean, to ours for both barred and unbarred systems. They likewise find bulges across early and late Hubble type galaxies.
Balcells et al. (2003) emphasized that bulges typically have indices or lower. Our results in Figure 14 are consistent. We find a low frequency () of high bulges, with most bulges having .
5.5 Bar Strength
Stellar bars exert gravitational torques on the gaseous component and are particularly efficient in driving gas from the outer disk into the inner kiloparsec (see 1). Thus, it would be natural to have a measure of bar strength that is sensitive to the strength of the gravitational torque and hence measures both the shape and mass of the bar.
Many measures of bar strength have been formulated. The method of (Block et al. 2002; Buta et al. 2003; Buta et al. 2005) measures directly the gravitational torque at a single point along the bar. This method requires a value of scaleheight for the disk and a model of the potential to be made from the image. In the bar/inter-bar contrast method of Elmegreen & Elmegreen (1985) and Elmegreen et al. (1996), bar strength is parameterized as the ratio between peak surface brightness in the bar region and the minimum surface brightness in the inter-bar region. Elmegreen & Elmegreen (1985) and Elmegreen et al. (1996) also characterize bar strength with the maximum amplitude of the mode from Fourier decomposition. When ellipse fitting is applied, the maximum ellipticity of the bar, , can be used to characterize bar strength (e.g. MJ07). This constitutes a partial measure of bar strength only, however, as it offers no information about mass of the bar.
Bulge-disk-bar decomposition in the -band provides another partial measure of bar strength through the -band Bar/ light ratio, which is a measure of the Bar/ mass ratio under the assumption that the -band ratio is the same for the bar and the rest of the galaxy, as discussed in 5.2. Figures 19 and 20 explore the derived bar properties.
The upper left panel of Figure 19 plots the individual and mean Bar/ against Hubble type. There is a wide range ( to ) in the individual Bar/ at a given Hubble type. The mean Bar/ remains fairly constant with Hubble type from Sa to Sb, but shows a possible weak decline by about 0.1 from Sb to Sc. Their number statistics are too small to make any robust statement for later Hubble types. We also note that six systems have high Bar/ above ; these are displayed in Figure 21.
Bar Sérsic indices are mostly below unity. Neither the individual, nor the mean bar Sérsic index, show any trend with Hubble type or with stellar mass, for Sa to Sc galaxies (Fig. 19). Thus, the steepness of the bar profile does not seem to depend on the Hubble type. Is the bar mass ratio and its mass profile related? There is a wide range in the individual Bar/ at a given bar Sérsic index (Fig. 20). The mean Bar/ rises with bar index out to a bar index of , and then flattens out. This suggests that on the mean, bars of lower Bar/ have flatter profiles.
Is there a relation between the bar strength and the bulge present in a galaxy? There is a wide range in the individual Bar/ at a given , and at a given bulge Sérsic index (Fig. 20). The mean Bar/ shows a weak decline for bulge Sérsic indices above two. Similarly the mean Bar/ shows a weak rise from 0.1 to 0.25 as rises out to 0.15, after which the trend flattens or reverses.
Both Bar/ and maximum bar ellipticity are partial measures of bar strength. Figure 19 shows mean Bar/ may scale weakly with Hubble type. The bars with highest (i.e, thin bars) are often termed strong bars, and has been shown to correlate with . Total bar strength should scale with both bar mass and bar ellipticity. Does bar strength have a dependence on Hubble type? The upper left panel of Figure 20 plots the product of Bar/ and , as determined by MJ07 for galaxies mutually classified as barred, against Hubble type. There is a wide range in Bar/ in each bin, and mean bar strength shows no definite trend with Hubble type. We note that bars with high Bar/ and high should exert the largest gravitational torque and be most effective at driving gas inflows. A nice example is the oval or lens galaxy NGC 1317 (Figure 21); the bar has a low ellipticity, but its is large as it is extended and massive. Such bars or lenses may exert significant gravitational torques although they are not very elongated.
5.6 Bar Fraction as a Function of and Bulge Index
As outlined in 5.3, we found that as many as of bright spirals have bulges with ; such bulges exist in barred and unbarred galaxies across a wide range of Hubble types, and their spread in is from 0.01 to 0.4, with most having 0.2. The variation of the bar fraction as a function of and bulge can provide important constraints on bulge formation scenarios ( 5.8). Table 10 shows our results. The bar fraction declines with bulge index; of the spirals with low bulges host bars while intermediate bulges have a lower bar fraction (). The high bulges in the sample are unbarred, so the bar fraction is . Systems with low are more likely to be barred. For , the bar fraction is high (). Systems with and have lower bar fraction ( and ).
Overall, Table 10 shows bulges with low and low preferentially exist in barred galaxies. This is consistent with earlier work (Odewahn 1996; Barazza et al. 2008; Marinova et al. 2008; Aguerri et al. 2008, in prep.) where an enhanced optical bar fraction is seen is galaxies with late Hubble types or low . It may be tempting to infer this result to mean the formation pathway of two-thirds of low- bulges is related to bars in that spontaneous or/and tidally induced bars play a role in bulge formation (with the remaining one-third of such bulges may have been formed either by mechanisms like retrograde minor mergers or short-lived bars). We caution that this type of cause-effect relationship is not the only scenario consistent with this result. It may also be possible that bar instabilities are favored in galaxies with low and no inner Lindblad resonances (ILR). Under these conditions, the swing amplifier model with a feedback loop (Julian & Toomre 1966; Toomre 1981; Binney & Tremaine 1987) may be responsible for bar formation and partly account for the high bar fraction in galaxies of low .
5.7 Formation of Bulges
Our observational results provide some interesting challenges for models of galaxy evolution that try to address the origin of present-day bulges. Any successful model must be able to account for the observed distribution of bulge and in high mass () spirals, as shown in Table 9 and Table 10. In particular, the following results must be reproduced:
-
1.
In terms of the overall distribution of bulge , as much as () of high mass spirals have bulge : such bulges exist in barred and unbarred galaxies and their ranges from 0.01 to 0.4, with most having (Table 9). A moderate fraction () of high mass spirals have , and just () have .
- 2.
-
3.
The fraction of bars rises among spirals with low bulge index . About 63% of spirals with low bulges host bars, while the bar fraction in spirals with bulges (44%) is two-thirds as large (Table 10).
In a hierarchical Universe, there are several physical processes that contribute to the assembly of bulges: major mergers, minor mergers, and secular evolution. We briefly describe these, expanding on our introduction in 1.
Major mergers, defined as those with mass ratio , typically destroy the extended outer stellar disks during violent relaxation, leaving behind a classical bulge. Such bulges are associated with modest-to-high bulge Sérsic indices, in the range (Hopkins et al. 2008; Springel et al. 2005; Robertson et al. 2006; 5.8) in simulations. This trend is also consistent with the fact that among ellipticals, high luminosity ones tend to have a Sérsic index , while low luminosity ones tend to have (Caon et al. 1993; Kormendy et al. 2008). The final Sérsic index depends on the amount of residual gas the settles into a somewhat disky component. Simulations by Hopkins et al. (2008) find that the Sérsic indices of remnants from 1:1 gas-rich major mergers lie in the range of , with most above 2.5 (see Fig. 22). This body of evidence strongly suggests that many bulges with might have a major merger origin.
Minor mergers, typically defined as those with mass ratio , do not destroy the stellar disk of the primary system, but can contribute to building bulges via three pathways. Firstly, a fraction of the satellite’s stellar mass can end up in the central region of the primary galaxy. The value of depends on how centrally concentrated the in-falling satellite is. Typically, the more diffuse outer stellar body is tidally stripped, while the central core sinks by dynamical friction to the central region (e.g., Quinn et al. 1993; Walker et al. 1996). Secondly, a non-axisymmetric feature (e.g., a stellar bar or bar-like feature) can be induced in the main disk, and gravitational torques exerted by the feature can drive gas into the inner kpc (e.g., Hernquist & Mihos 1995; Jogee 2006 and references therein), where subsequent SF forms a compact high stellar component, or disky pseudobulge. Most of the gas inflow happens during the merger phase and large gas inflow rates (e.g., per year) may be generated. Thirdly, gas inflow can also be caused by direct tidal torques from the companion (e.g., Hernquist & Mihos 1995; Eliche-Moral et al. 2006). It is to be noted that in the simulations by Hernquist & Mihos (1995), the gas inflow generated by non-axisymmetric features (e.g., bar-like features) in the inner part of the disk is much larger than that caused by direct tidal torques from the satellite. In the recent work of Eliche-Moral et al. (2006), N-body simulations of minor mergers followed by fits of 1D Sérsic+exponential models to the remnants, suggest that the bulge Sérsic index and ratio can grow as a result of the central re-concentration of stellar disk material in the primary system by tidal forces. Minor mergers are frequent under CDM, and the likelihood of multiple successive minor mergers occurring during the formation of a galaxy is high. Bournaud, Jog, & Combes (2007) study the effects of repeated minor mergers on galaxy structure. They show that a disk galaxy undergoing successive minor mergers will eventually transform into an elliptical galaxy with an -law profile and high . However, galaxy growth is not completely merger-driven and the efficiency of minor mergers at creating ellipticals must be regulated by other mechanisms (e.g., cold gas accretion).
In addition, the process of secular evolution can build a disky bulge (pseudobulge) between merger events. Here a stellar bar or globally oval structure in a non-interacting galaxy drives gas inflow into the inner kpc, where subsequent star formation forms a compact high stellar component (e.g., Kormendy 1993; Jogee 1999; KK04; Jogee, Scoville, & Kenney 2005; Athanassoula 2005; Kormendy & Fisher 2005; Kormendy 2008). This process is different from that of minor mergers in the sense that it happens in the quiescent phase of the galaxy, between minor or major merger events. The prevalence of pseudobulges in galaxies of different Hubble types is discussed in KK04, and select examples of S0 galaxies with pseudobulges are also shown in Kormendy & Cornell (2004) and KK04.
The present-day bulge mass can be written as the sum of mass contributed from each process:
| (6) |
where
-
•
is the percentage of the bulge stellar mass, which is built by major mergers,
-
•
is the percentage of the bulge stellar mass, which is built during minor mergers from stars of the satellite. This depends on the fraction of the satellite’s stellar mass, which ends up in the central region of the primary galaxy during each minor merger.
-
•
is the percentage of the bulge stellar mass, which is built during minor mergers from gas inflow caused by a tidally induced bar.
-
•
is the percentage of the stellar mass, which is built during minor mergers from gas inflow caused by tidal torques from the companion.
-
•
is the percentage of the stellar mass, which is built secularly between merger events from gas inflow caused by bars or ovals
In § 5.8, we compare our derived distribution of bulge and with hierarchical models that model major and minor mergers, but not secular evolution. The main goal of the model is to see whether bulges built via major mergers can account for the large fraction of high mass spirals with bulges of low or/and low . A secondary goal is to see if a first order simplified prescription for minor mergers can broadly account for the observations. We stress here that bulge-building during minor mergers is modeled in a very simple way: all the stars in the satellite are assumed to contribute to the bulge of the larger galaxy (i.e., ), and bulge-building via gas inflow driven through tidal torques and via gravitational torques from induced bars are ignored (i.e., = 0, and = 0). Furthermore, the models entirely ignore secular evolution between mergers. In a future paper, these extra terms will be addressed and a comprehensive picture built of the relative importance of minor mergers and secular processes in making present-day bulges.
5.8 Comparison of With Hierarchical Models of Galaxy Evolution
We compare our data with the predictions from cosmological semi-analytical models based on Khochfar & Burkert (2005) and Khochfar & Silk (2006). We briefly describe the models first. The merger trees of dark matter (DM) halos are derived by using the extended Press-Schechter formalism (Press & Schechter 1974), as in Somerville & Kolatt (1999). When two DM halos merge, the merger time scale of the galaxies is calculated by considering the timescale it would take the satellite galaxies to reach the central galaxy at the center of the halo via dynamical friction (e.g., Kauffmann et al. 1999; Springel et al. 2001). The baryonic physics, which includes radiative cooling, star formation, and feedback from supernovae, is treated via semi-analytic prescriptions (see Khochfar & Silk (2006) and references therein). Baryonic mass inside the dark matter halos is divided between hot gas, cold gas, and stars. The hot gas is initially shock-heated to the halo virial temperature. As the gas radiatively cools, it settles down into a rotationally supported disk at the halo center. Cold disk gas is allowed to fragment and subsequently form stars according to the Schmidt-Kennicutt law (Kennicutt 1998). Star formation is regulated by feedback from supernovae using the prescription in Kauffmann et al. (1999).
Major mergers are typically considered as those with stellar mass ratio . In the simulations, one assumes that during a major merger any existing stellar disk is destroyed, gas is converted to stars with some star formation efficiency (SFE), and all stars present undergo violent relaxation to form a bulge. Therefore, the bulge-to-total stellar mass ratio () of a bulge immediately after a major merger is always one. Note that the SFE during a major merger is not assumed to be 100% as there is mounting evidence from SPH simulations (Springel & Hernquist 2005; Cox et al. 2008) that not all cold gas is converted to stars. Instead, the burst efficiency defined by Cox et al. (2008) is applied to control the fraction of stars formed due to the interaction. This efficiency is dependent on the relative masses of merging galaxies and is expressed as
| (7) |
where is the burst efficiency for a 1:1 merger and fixes the dependence on mass ratio; Cox et al. (2008) find and . The remaining fraction (1-) of gas is added to the gaseous disk and can start making stars.
As stated above, immediately after a major merger, the remnant is a bulge with a equal to one. As time proceeds, falls because a stellar disk grows around the bulge as hot gas in the halo cools, settles into a disk, and forms stars. The formation of stars by any residual cold gas left at the end of the major merger also helps to grow the disk. Thus falls until the next major merger happens, at which point is reset to one in the models.
The bulge may also grow in stellar mass due to minor mergers. Minor mergers are defined as mergers with mass ratio , and the stellar disk of the large companion is not destroyed during such mergers. The models assume that during minor mergers, all the stars in the satellite are added to the bulge of the host, while the gas settles in the disk. When DM halos grow by accretion or minor mergers, the hot gas that comes in with a satellite is immediately stripped and added to the hot gas component of the host. The cold gas in the disk of the satellite is only added to the cold gas of the host if they merge. Until they merge the satellite is using up its own cold gas to make stars.
Fig. 23 shows the relationship between the present-day of a a high mass () spiral and the redshift of its last major merger. As expected, systems where the last major merger occurred at earlier times, have had more time to grow a disk and have a lower . The dispersion in the present-day at a given is due to the different times spent by a galaxy in terms of being a satellite versus a central galaxy in a DM halo, since the cooling of gas and the growth of a disk is stopped when a galaxy becomes a satellite. Thus, galaxies that became a satellite galaxy shortly after their last major merger stayed at high . Conversely, galaxies that continued to be a central galaxy for a long time after their last major merger will have low .
The present-day of a high mass () spiral depends on its major merger history. In particular, we note from Fig. 23 that a high mass () galaxy, which has undergone a past major merger since will end up hosting a present-day . In effect, a high mass spiral can have a present-day only if its last major merger occurred at (lookback times Gyr).
The predicted distribution of present-day depends on the galaxy merger history in the models and it is relevant to ask how well the latter is constrained observationally. Over the redshift range to 0.80 (lookback times of 3 to 7 Gyr), recent studies by Jogee et al. (2008, 2009) find that among high mass () galaxies, 10% of galaxies are undergoing mergers of mass ratio , and 3% are undergoing major mergers of mass ratio . These findings agree within a factor of less than with the merger rates from the models of Khochfar & Burkert (2001) over 0.24 to 0.80. At higher redshifts, the empirical merger rate/fraction is uncertain due to relatively modest volumes and bandpass shifting effects, but there is a general trend towards higher merger fractions at higher redshifts (e.g., Conselice et al. 2003). The models used here (Khochfar & Burkert 2001) agree with this trend and predict that 13.5% and 20% of high mass () spirals have undergone major mergers since and , respectively (see Table 11).
The contribution of galaxies with different merger histories to the present-day distribution are shown in Table 11. The top and middle parts of the table describe systems with and without major mergers since and , respectively. In the model, 13.5% of present-day high mass () spirals, experienced a major merger since , causing most of them ( 11.2%) to have a present-day high and a negligible fraction ( 0.1%) to have a low present-day . In contrast, the remaining 86.5% spirals experienced no major merger at 2, and most (67.2%) of them have a present-day low . If the comparisons are extended to systems without a major merger since , the numbers are very similar (see middle part of Table 11).
Table 11 shows that there is good agreement between the model and data for the fraction of high mass spirals with present-day low ( 67% in the model versus 66% in the data). The model contribution to low comes almost entirely from galaxies, which have not had a major merger since (see column 4 in Table 11). In fact, most of these galaxies have not even had a major merger since , as illustrated by the bottom part of Table 11. In the model, the fraction (; column 3 of Table 11) of high mass spirals, which have undergone a major merger since and host a bulge with a present-day , is a factor of over thirty smaller than the observed fraction () of high mass spirals with . Thus, bulges built via major mergers since seriously fail to account for the bulges present in of high mass spirals. These results are also illustrated in Fig. 24, which shows the comparison between data and models for the cumulative fraction of high mass spirals as a function of present-day .
It is also interesting to note from Table 11 that although the models reproduce well the frequency of bulges with present-day low , they tend to over-produce the frequency of present-day high systems by nearly a factor of two ( 14% in the model versus 8% in the data; see columns 6 and 2 in middle part of Table 11). Most of this overproduction stems from major mergers at ( 13%; column 4 in middle part of Table 11). This suggests that major mergers, as currently modeled here, are building bulges too efficiently.
One possible solution to this problem might relate to the suggestion by Hopkins et al. (2009) that the efficiency of bulge-building during the major merger of two spirals depends not only on the mass ratio of the merger, but also depends on the cold gas mass fraction in the disk. In their semi-analytic models, the entire stellar mass of the satellite violently relaxes, but the fraction of stellar mass in the primary disk that violently relaxes and adds to the bulge is . This differs with our models where the entire primary stellar disk is always destroyed in a major merger. Furthermore, the fraction of the total gas mass, which loses angular momentum, falls to the nucleus, and is transformed into stellar mass in a nuclear starburst, is . In particular, is lower for more gas-rich disks, causing a suppression of the burst efficiency in gas-rich systems, and a reduction in the stellar mass that ends up in the bulge built during the major merger. The predictions for the distribution of from the Hopkins et al. (2009) models are shown in the bottom of Table 11, with major mergers considered as those with baryonic galaxy-galaxy mass ratio /1/3. Due to the reduced stellar mass that ends up in the bulge after a major merger, the Hopkins et al. (2009) models tend to yield lower after such a merger. Thus, the models produce overall fewer high systems, and more intermediate 0.2 0.4 and low systems (see column 6 in Table 11). Nonetheless, the predictions are not very different from the models by Khochfar & Burkert (2005) and Khochfar & Silk (2006), which we use in this paper. In particular, the conclusion that the large frequency of high mass () spirals with low bulges can only be accounted for by spirals without a major merger since also holds with the Hopkins et al. (2009) models.
Thus, we conclude that the observed large frequency ( 66%) of high mass () spirals with low present-day can be accounted for in our and other hierarchical models by high mass spirals, which have not undergone a major merger since , and most of which have not even experienced a major merger over the last 12 Gyr since . In the models, most of these present-day low bulges are built by minor mergers since . As noted earlier, our models explore bulge-building via minor and major mergers, but do not explicitly incorporate secular processes (see 5.7). In practice, secular processes may contribute to the building of present-day low bulges, and are particularly relevant at , where major mergers cannot build such bulges.
For completeness, we further explore how sensitive are our results to other assumptions made in the data and models of Khochfar & Burkert (2005) and Khochfar & Silk (2006):
-
•
How sensitive are the results to the mass ratio used to separate major and minor mergers? Fig. 25 is similar to Fig. 24 except that the model now defines major mergers as those with mass ratio . In this case, about 30% of the model spirals undergo major mergers since rather than . The overall model (black dashed line) now under-predicts the data by about 10% for 0.2. However, the main conclusion that bulges built by major mergers since cannot account for most of the low bulges, present in a large percentage () of spirals still holds.
- •
-
•
How sensitive are the results to our assumed constant -band mass-to-light () for the bulge, disk, and bar? Fig. 27 is similar to Fig. 24 except that the of all the observed galaxies has been multiplied by a factor of two, in order to test what would happen in the case where the ratio of the bulge in -band is twice as high as that of the disk and bar. This could happen in an extreme example where the dominant bulge stellar population was much older (e.g. 12 Gyr) than the age of the dominant disk stellar population (e.g., 3 Gyr). In such a case, the fraction of high mass spirals with 0.2 would change from in Fig. 24 to , and deviate from the model overall model (black dashed line) by . However, the main conclusion that bulges built by major mergers since cannot account for most of the low bulges, present in a large percentage () of spirals still holds.
Finally, it is important to note that so far we have compared the data and model only in terms of bulge , but not in terms of bulge index or in terms of bar fraction. In effect, we have only shown that the models reproduce a subset of the results outlined in points (1)-(3) of 5.7. Since the semi-analytic models do not produce a distribution of bulge index , we resort to presenting only an indirect comparison in Table 12. We assume that bulges, which form in major mergers have a bulge . This assumption is based the evidence presented in 5.7. Thus, in Test 1 of Table 12, we compare the fraction ( 66%) of galaxies in the semi-analytic models having and no major merger since , to the observed fraction ( 65%) of galaxies with and bulge . There is close agreement between the two values. In Test 2 of Table 12, the fraction ( 12.7%) of model galaxies with and no major merger since is a factor of 3 higher than the fraction ( 3.5%) of high mass spirals with and bulge . Similarly, the fraction ( 1.6%) of model galaxies with and a past major merger since is also a factor of 2 higher than the observed fraction ( 0.9%) of high mass spirals with and bulge (Test 3, Table 12). Thus, in terms of bulge and , there is good agreement between data and model for Test 1 (involving model galaxies with no major mergers since ). This suggests that the vast majority of bulges with and likely formed in galaxies having had no major merger since . However, the agreement is less good for Tests 2 and 3 (involving model galaxies with major mergers since ) and this suggests that the models may be building bulges a little bit too efficiently during a major merger, in agreement with the conclusion reached earlier.
What about the role of bars in the formation of these bulges of low and low ? A detailed direct comparison with the semi-analytic models is not possible as the role of bars is not yet modeled, but related comparisons are possible. First, it is important to note that bar-driven gas inflow into the inner kpc and the subsequent building of disky stellar components or ‘pseudobulges’ (see 1) can happen in both isolated galaxies and in minor mergers ( 5.7), since bars can be spontaneously induced in an isolated disk or tidally induced during an interaction or minor merger. The triggering of a bar is favored in a prograde interaction or minor merger. Thus, bulge-building via induced bars is more likely to happen in prograde rather than retrograde minor mergers. Statistically about half of minor mergers might be prograde or prograde-like, and half retrograde. Thus, one would expect bars to be induced in only half of the minor mergers. If this assumption is correct and if most of the mass in bulges with present-day is formed in minor mergers, then one would expect only about half of these bulges to host bars. This is close to what is observed, as shown by Table 10. We see that of high mass spirals with low bulges and of spirals with low bulges host bars. This suggests that in high mass spirals, spontaneous and/or tidally induced bars may play a part in forming up to two-thirds of or bulges. The remaining one-third of such bulges may have been formed either by mechanisms that do not involve bars (e.g., retrograde minor mergers) or by bars that are not long-lived.
6 Summary
The properties of galaxy components (bulges, disks, and bars) in the local Universe provide key constraints for models of galaxy evolution. Most previous decompositions have focused on two-component bulge-disk decomposition, and ignored the contribution of the bar even in strongly barred galaxies. However, as shown by this work and other recent studies (e.g., Laurikainen et al. 2005; Laurikainen et al. 2007; Reese et al. 2007), it is important to include the bar component in the decomposition, in order to correctly estimate the bulge-to-total ratio () and disk properties. In this paper we have developed an iterative , bulge-disk-bar decomposition technique using GALFIT and applied it to -band images to a complete sample (S1) of 143 bright () low-to-moderately inclined () spirals from the OSU Bright Spiral Galaxy Survey (OSUBSGS). The sample has primarily spirals with Hubble type S0/a to Sc and stellar mass . We performed two-component bulge-disk decomposition, as well as three-component bulge-disk-bar decomposition on the light distribution of all galaxies, taking into account the PSF. We use an exponential profile for the disk, and Sérsic profiles for the bulge and bar. A number of quantitative indicators, including bar classification from ellipse fits, are used to pick either the bulge-disk-bar decomposition or bulge-disk decomposition, as the best final fit for a galaxy. Our main results are the following.
-
1.
We find that it is necessary to include the bar component in decomposition of barred galaxies, otherwise, the bulge-to-total ratio () will be overestimated and the disk properties may be skewed. Examples of the effect of including the bar are shown for the prominently barred galaxies NGC 4643 (Figure 5, Table 3) and NGC 4548 (Figure 6, Table 4).
-
2.
We find that out of the 143 low-to-moderately inclined () spirals in our sample, 75 of 143 or are better fit with a Stage 3 bulge-disk-bar decomposition than a Stage 2 bulge-disk decomposition. There are also eight galaxies with pure bar-disk fits. The resulting -band bar fraction, defined as the fraction of disk galaxies that are barred, is (84 of 143). This fraction is in excellent agreement with the -band bar fraction of 60% reported by MJ07, based on ellipse fits of the same OSUBSGS sample, with a more conservative inclination cut ().
-
3.
-band images tend to trace the overall mass fairly well and are not overly impacted by extinction and age gradients. We therefore assume a constant mass-to-light () in the -band for the bulge, disk, and bar, and assume their -band light fraction is a measure of their mass fraction. For our sample S1 of 143 bright () low-to-moderately inclined () spirals with a mass-weighted mean Hubble type of Sab-Sb, we find that 71.6% of the stellar mass is in disks, 9.6% is in stellar bars and 18.9% is in bulges (with 10.4% in bulges and 8.4% in bulges).
If disks and bars are much younger (e.g., Gyr old ) than bulges (e.g., Gyr old), then our prescription would underestimate the true by a factor of 2. On the other hand, if the bulge is younger than the disk and happens to harbor a significant young population of massive stars, then our prescription will overestimate the true mass ratio, and make our current results on the high fraction of low bulges (see point 4 below) even stronger.
-
4.
We explore the relationship between , bulge Sérsic index, and Hubble types (Fig. 14 & Fig. 15). Only a small fraction () of bright spirals have high bulges; such bulges lie primarily in S0/a to Sab, and have a large . A moderate fraction () have intermediate bulges; these exist in barred and unbarred S0/a to Sd, and their spans a wide range (0.03 to 0.5) with a mean of 0.29. Finally, a strikingly large fraction (%) of bright spirals have low bulges; such bulges exist in barred and unbarred galaxies across a wide range of Hubble types, and their varies from 0.01 to 0.4, with most having .
-
5.
Bulges with very high () exist primarily in galaxies with high mass () and early types (S0/a to Sab). Bulges with very low () lie primarily in lower mass galaxies with later morphologies (Sb to Sc). As many as of bright spirals have bulges with : these bulges are pervasive and exist across the whole spectrum of S0/a to Sd (Figure 14).
-
6.
Modeling bars with decomposition allows us to measure bar properties and the bar-to-total ratio (Bar/), which is a measure of bar strength. There is a wide range ( to ) in the individual Bar/ at a given Hubble type. The mean Bar/ remains fairly constant with Hubble type from Sa to Sb, but shows a possible weak decline by about 0.1 from Sb to Sc (See Figure 19 and Figure 20). The bar fraction (Table 10) declines with ; it is highest () for bright spirals with , and lower () by nearly a factor of two in spirals with .
It may be tempting to infer this to mean the formation of two-thirds of low- bulges is related to spontaneous or/and tidally induced bars. Such a cause-effect relationship is not the only scenario consistent with this result. It may also be possible that bar instabilities are favored in galaxies with low and no inner Lindblad resonances. Under these conditions, the swing amplifier model with a feedback loop may be responsible for bar formation and partly account for the high bar fraction in galaxies of low .
-
7.
We compare the observed distribution of bulge and in high mass () spirals with predictions from a set of CDM cosmological semi-analytical models (Table 11, Table 12, and Figs. 24 to 27). Major mergers are considered as those with stellar mass ratio . In the models, a high mass spiral can have a bulge with a present-day low 0.2 only if it did not undergo a major merger since (Fig. 23). The model merger history shows that only 13.5% and 20% of the high mass spirals experience major mergers since and , respectively. The fraction ( 1.6%) of high mass spirals which have undergone a major merger since and host a bulge with a present-day low is a factor of over thirty smaller than the observed fraction () of high mass spirals with (Table 11). Thus, bulges built via major mergers since , over the last 12 Gyr, seriously fail to account for most of the low bulges present in two-thirds of high-mass spirals. The overall picture that emerges is that the observed large frequency ( 66%) of high mass () spirals with low present-day can be accounted for in our hierarchical models by high mass spirals, which have not undergone a major merger since , and most of which have not even experienced a major merger since . Most of these present-day low bulges are likely to have been built by a combination of minor mergers and/or secular processes since .
References
- Allen et al. (2006) Allen, P. D., Driver, S. P., Graham, A. W., Cameron, E., Liske, J., & de Propris, R. 2006, MNRAS, 371, 2
- Athanassoula (2002) Athanassoula, E. 2002, ApJL, 569, L83
- Athanassoula (2003) Athanassoula, E. 2003, MNRAS, 341, 1179
- Athanassoula (2005) Athanassoula, E. 2005, MNRAS, 358, 1477
- Balcells et al. (2003) Balcells, M., Graham, A. W., Domínguez-Palmero, L., & Peletier, R. F. 2003, ApJL, 582, L79
- Balcells et al. (2007) Balcells, M., Graham, A. W., & Peletier, R. F. 2007, ApJ, 665, 1084
- Barazza et al. (2007) Barazza, F. D., Jogee, S., & Marinova, I. 2007, in IAU Symposium 235, Galaxy Evolution across the Hubble Time, ed. F. Combes & J. Palous (Cambridge: Cambridge University Press), 76
- Barazza et al. (2008) Barazza, F. D., Jogee, S., & Marinova, I. 2008, ApJ, 675, 1194
- Barrett & Bridgman (1999) Barrett, P. E., & Bridgman, W. T. 1999, in ASP Conf. Ser. 172, Astronomical Data Analysis Software and Systems VIII, ed. D. M. Mehringer, R. L. Plante, & D. A. Roberts (San Francisco: Astronomical Society of the Pacific), 483
- Bell et al. (2003) Bell, E. F., McIntosh, D. H., Katz, N., & Weinberg, M. D. 2003, ApJS, 149, 289
- Benedict et al. (1996) Benedict, F. G., Smith, B. J., & Kenney, J. D. P. 1996, AJ, 111, 1861
- Berentzen et al. (2006) Berentzen, I., Shlosman, I., & Jogee, S. 2006, ApJ, 637, 582
- (13) Binney, J., & Tremaine, S. 1987, Galactic Dynamics (Princeton: Princeton Univ. Press)
- Blanton et al. (2005) Blanton, M. R., Lupton, R. H., Schlegel, D. J., Strauss, M. A., Brinkmann, J., Fukugita, M., & Loveday, J. 2005, ApJ, 631, 208
- Block et al. (2002) Block, D. L., Bournaud, F., Combes, F., Puerari, I., & Buta, R. 2002, A&A, 394, L35
- Böker et al. (2002) Böker, T., Laine, S., van der Marel, R. P., Sarzi, M., Rix, H.-W., Ho, L. C., & Shields, J. C. 2002, AJ, 123, 1389
- Bottinelli et al. (1995) Bottinelli, L., Gouguenheim, L., Paturel, G., & Teerikorpi, P. 1995, A&A, 296, 64
- Bournaud et al. (2007) Bournaud, F., Jog, C. J., & Combes, F. 2007, A&A, 476, 1179
- Bureau & Athanassoula (2005) Bureau, M., & Athanassoula, E. 2005, ApJ, 626, 159
- Burkert & D’Onghia (2004) Burkert, A. M., & D’Onghia, E. 2004, in Penetrating Bars Through Masks of Cosmic Dust: the Hubble Tuning Fork Strikes a New Note, ed. D. L. Block, I. Puerari, K. C. Freeman, R. Groess, & E. K. Block (Dordrecht: Kluwer Academic Publishers), 341
- Burkert & Naab (2004) Burkert, A., & Naab, T. 2004, in Carnegie Observatories Astrophysics Series, Vol. 1: Coevolution of Black Holes and Galaxies, ed. L. C. Ho (Cambridge: Cambridge Univ. Press), 421
- Buta et al. (2003) Buta, R., Block, D. L., & Knapen, J. H. 2003, AJ, 126, 1148
- Buta et al. (2005) Buta, R., Vasylyev, S., Salo, H., & Laurikainen, E. 2005, AJ, 130, 506
- Byun & Freeman (1995) Byun, Y. I., & Freeman, K. C. 1995, ApJ, 448, 563
- Caon et al. (1993) Caon, N., Capaccioli, M., & D’Onofrio, M. 1993, MNRAS, 265, 1013
- Charlot (1996) Charlot, S. 1996, in The Universe at High-z, Large-Scale Structure and the Cosmic Microwave Background, ed. E. Martinez-Gonzalez & J. L. Sanz (New York: Springer-Verlag), 53
- Charlot et al. (1996) Charlot, S., Worthey, G., & Bressan, A. 1996, ApJ, 457, 625
- Cole et al. (2000) Cole, S., Lacey, C. G., Baugh, C. M., & Frenk, C. S. 2000, MNRAS, 319, 168
- Conselice et al. (2003) Conselice, C. J., Bershady, M. A., Dickinson, M., & Papovich, C. 2003, AJ, 126, 1183
- Combes et al. (1990) Combes, F., Debbasch, F., Friedli, D., & Pfenniger, D. 1990, A&A, 233, 82
- Combes & Sanders (1981) Combes, F., & Sanders, R. H. 1981, A&A, 96, 164
- Cox et al. (2008) Cox, T. J., Jonsson, P., Somerville, R. S., Primack, J. R., & Dekel, A. 2008, MNRAS, 384, 386
- Debattista & Sellwood (1998) Debattista, V. P., & Sellwood, J. A. 1998, ApJL, 493, L5
- Debattista & Sellwood (2000) Debattista, V. P., & Sellwood, J. A. 2000, ApJ, 543, 704
- de Jong (1996) de Jong, R. S. 1996, A&A Suppl., 118, 557
- Depoy et al. (1993) Depoy, D. L., Atwood, B., Byard, P. L., Frogel, J., & O’Brien, T. P. 1993, Proc. SPIE, 1946, 667
- de Souza et al. (2004) de Souza, R. E., Gadotti, D. A., & dos Anjos, S. 2004, ApJS, 153, 411
- de Vaucouleurs et al. (1976) de Vaucouleurs, G., de Vaucouleurs, A., & Corwin, H. G. 1976, Second Reference Catalogue of Bright Galaxies, University of Texas Monographs in Astronomy, (Austin: University of Texas Press)
- de Vaucouleurs et al. (1991) de Vaucouleurs, G., de Vaucouleurs, A., Corwin, H. G., Jr., Buta, R. J., Paturel, G., & Fouque, P. 1991, Third Reference Catalogue of Bright Galaxies, Volume 1-3, (New York: Springer-Verlag)
- D’Onghia et al. (2006) D’Onghia, E., Burkert, A., Murante, G., & Khochfar, S. 2006, MNRAS, 372, 1525
- Driver et al. (2005) Driver, S. P., Liske, J., Cross, N. J. G., De Propris, R., & Allen, P. D. 2005, MNRAS, 360, 81
- Driver et al. (2006) Driver, S. P., et al. 2006, MNRAS, 368, 414
- Drory et al. (2004) Drory, N., Bender, R., & Hopp, U. 2004, ApJL, 616, L103
- Efstathiou et al. (1988) Efstathiou, G., Ellis, R. S., & Peterson, B. A. 1988, MNRAS, 232, 431
- Eliche-Moral et al. (2006) Eliche-Moral, M. C., Balcells, M., Aguerri, J. A. L., & González-García, A. C. 2006, A&A, 457, 91
- Elmegreen (1994) Elmegreen, B. G. 1994, ApJL, 425, L73
- Elmegreen & Elmegreen (1985) Elmegreen, B. G., & Elmegreen, D. M. 1985, ApJ, 288, 438
- Elmegreen et al. (1996) Elmegreen, B. G., Elmegreen, D. M., Chromey, F. R., Hasselbacher, D. A., & Bissell, B. A. 1996, AJ, 111, 2233
- Eskridge et al. (2000) Eskridge, P. B., et al. 2000, AJ, 119, 536
- Eskridge et al. (2002) Eskridge, P. B., et al. 2002, ApJS, 143, 73
- Fisher & Drory (2008) Fisher, D. B., & Drory, N. 2008, AJ, 136, 773
- Gadotti & Kauffmann (2007) Gadotti, D., & Kauffmann, G. 2007, in IAU Symposium 241, Stellar Populations as Building Blocks of Galaxies, ed. A. Vazdekis & R. F. Peletier (Cambridge: Cambridge University Press), 507
- Graham (2001) Graham, A. W. 2001, AJ, 121, 820
- Graham & Worley (2008) Graham, A. W., & Worley, C. C. 2008, MNRAS, 752
- (55) Hernquist, L. & Mihos, J. C. 1995, ApJ, 448, 41
- Ho et al. (1997) Ho, L. C., Filippenko, A. V., & Sargent, W. L. W. 1997, ApJS, 112, 315
- Hopkins et al. (2008) Hopkins, P. F., Cox, T. J., Dutta, S. N., Hernquist, L., Kormendy, J., & Lauer, T. R. 2008, ArXiv e-prints, 805, arXiv:0805.3533
- Hopkins et al. (2009) Hopkins, P. F., et al. 2009, ApJ, submitted (arXiv:0901.4111)
- Hunt & Malkan (1999) Hunt, L. K., & Malkan, M. A. 1999, ApJ, 516, 660
- Jogee (1999) Jogee, S. 1999, Ph.D. thesis, Yale University
- Jogee (2006) Jogee, S. 2006, in Physics of Active Galactic Nuclei at all Scales, ed. D. Alloin, R. Johnson, & P. Lira (Berlin: Springer), 143
- Jogee et al. (1999) Jogee, S., Kenney, J. D. P., & Smith, B. J. 1999, ApJ, 526, 665
- Jogee et al. (2005) Jogee, S., Scoville, N., & Kenney, J. D. P. 2005, ApJ, 630, 837
- Jogee et al. (2004) Jogee, S., et al. 2004, ApJL, 615, L105
- Jogee et al. (2008) Jogee, S. 2008, in ‘The Galaxy Disk in a Cosmological Context’, Proceedings of IAU Symposium 254, Eds. J. Andersen, J. Bland-Hawthorn & B. Nordstrom, held in Copenhagen in June 2008, in press (arXiv:0810.5617)
- Jogee et al. (2009) Jogee, S., et al. 2009, ApJ, accepted
- Julian & Toomre (1966) Julian, W. H., & Toomre, A. 1966, ApJ, 146, 810
- Kauffmann et al. (1999) Kauffmann, G., Colberg, J. M., Diaferio, A., & White, S. D. M. 1999, MNRAS, 303, 188
- Kauffmann et al. (2003) Kauffmann, G., et al. 2003, MNRAS, 341, 33
- Kautsch et al. (2006) Kautsch, S. J., Grebel, E. K., Barazza, F. D., & Gallagher, J. S., III 2006, A&A, 445, 765
- Kenney et al. (1993) Kenney, J. D. P., Carlstrom, J. E., & Young, J. S. 1993, ApJ, 418, 687
- Kennicutt (1998) Kennicutt, R. C., Jr. 1998, ApJ, 498, 541
- Khochfar & Burkert (2001) Khochfar, S., & Burkert, A. 2001, ApJ, 561, 517
- Khochfar & Burkert (2005) Khochfar, S., & Burkert, A. 2005, MNRAS, 359, 1379
- Khochfar & Silk (2006) Khochfar, S., & Silk, J. 2006, MNRAS, 370, 902
- Knapen et al. (1995) Knapen, J. H., Beckman, J. E., Heller, C. H., Shlosman, I., & de Jong, R. S. 1995, ApJ, 454, 623
- Knapen et al. (2000) Knapen, J. H., Shlosman, I., & Peletier, R. F. 2000, ApJ, 529, 93
- Koda et al. (2007) Koda, J., Milosavljevic, M., & Shapiro, P. R. 2007, preprint (arXiv:0711.3014)
- Kormendy (1993) Kormendy, J. 1993, in IAU Symposium 153, Galactic Bulges, ed. H. Dejonghe & H. J. Habing (Dordrecht: Kluwer), 209
- Kormendy (2008) Kormendy, J. 2008, in IAU Symposium 245, Formation and Evolution of Galaxy Bulges, ed. M. Bureau, E. Athanassoula, & B. Barbury (Cambridge: Cambridge Univ. Press), in press
- Kormendy & Cornell (2004) Kormendy, J., & Cornell, M. E. 2004, in Penetrating Bars Through Masks of Cosmic Dust: the Hubble Tuning Fork Strikes a New Note, ed. D. L. Block, I. Puerari, K. C. Freeman, R. Groess, & E. K. Block (Dordrecht: Kluwer Academic Publishers), 261
- Kormendy & Fisher (2005) Kormendy, J., & Fisher, D. B. 2005, Rev. Mex. AA Ser. Conf., 23, 101 (arXiv:0507525)
- Kormendy & Fisher (2008) Kormendy, J., & Fisher, D. B. 2008, in Formation and Evolution of Galaxy Disks, ed. J. G. Funes, S. J., & E. M. Corsini (San Francisco: ASP), 297
- (84) Kormendy, J., Fisher, D. B., Cornell, M. E., & Bender, R. 2008, ApJS, in press (arXiv:0810.1681)
- Kormendy & Kennicutt (2004) Kormendy, J., & Kennicutt, R. C., Jr. 2004, ARAA, 42, 603 (KK04)
- Kroupa et al. (1993) Kroupa, P., Tout, C. A., & Gilmore, G. 1993, MNRAS, 262, 545
- Laine et al. (2002) Laine, S., Shlosman, I., Knapen, J. H., & Peletier, R. F. 2002, ApJ, 567, 97
- Laurikainen et al. (2004) Laurikainen, E., Salo, H., & Buta, R. 2004, ApJ, 607, 103
- Laurikainen et al. (2005) Laurikainen, E., Salo, H., & Buta, R. 2005, MNRAS, 362, 1319
- Laurikainen et al. (2007) Laurikainen, E., Salo, H., Buta, R., & Knapen, J. H. 2007, MNRAS, 381, 401
- Liske et al. (2003) Liske, J., Lemon, D. J., Driver, S. P., Cross, N. J. G., & Couch, W. J. 2003, MNRAS, 344, 307
- Marinova & Jogee (2007) Marinova, I., & Jogee, S. 2007, ApJ, 659, 1176 (MJ07)
- (93) Marinova, I., et al. . 2008, ApJ, submitted
- Martinez-Valpuesta et al. (2006) Martinez-Valpuesta, I., Shlosman, I., & Heller, C. 2006, ApJ, 637, 214
- Menéndez-Delmestre et al. (2007) Menéndez-Delmestre, K., Sheth, K., Schinnerer, E., Jarrett, T. H., & Scoville, N. Z. 2007, ApJ, 657, 790
- Mihos & Hernquist (1996) Mihos, J. C., & Hernquist, L. 1996, ApJ, 464, 641
- Moorthy & Holtzman (2006) Moorthy, B. K., & Holtzman, J. A. 2006, MNRAS, 371, 583
- Mulchaey & Regan (1997) Mulchaey, J. S., & Regan, M. W. 1997, ApJL, 482, L135
- Naab & Burkert (2001) Naab, T., & Burkert, A. 2001, ApJL, 555, L91
- Naab & Burkert (2003) Naab, T., & Burkert, A. 2003, ApJ, 597, 893
- Navarro & Steinmetz (2000) Navarro, J. F., & Steinmetz, M. 2000, ApJ, 538, 477
- (102) Odewahn, S. C. 1996, in Barred Galaxies, IAU Coll. 157, ed. R. Buta, D. A. Crocker & B. G. Elmegreen, ASP Conf. Ser. 91 (San Francisco: ASP), 30
- Paturel et al. (2003) Paturel G., Petit C., Prugniel P., Theureau G., Rousseau J., Brouty M., Dubois P., Cambrésy L., 2003, A&A, 412, 45
- Peng et al. (2002) Peng, C. Y., Ho, L. C., Impey, C. D., & Rix, H.-W. 2002, AJ, 124, 266
- Pfenniger & Norman (1990) Pfenniger, D., & Norman, C. 1990, ApJ, 363, 391
- Press & Schechter (1974) Press, W. H., & Schechter, P. 1974, ApJ, 187, 425
- Ravindranath et al. (2001) Ravindranath, S., Ho, L. C., Peng, C. Y., Filippenko, A. V., & Sargent, W. L. W. 2001, AJ, 122, 653
- Reese et al. (2007) Reese, A. S., Williams, T. B., Sellwood, J. A., Barnes, E. I., & Powell, B. A. 2007, AJ, 133, 2846
- Robertson et al. (2006) Robertson, B., Bullock, J. S., Cox, T. J., Di Matteo, T., Hernquist, L., Springel, V., & Yoshida, N. 2006, ApJ, 645, 986
- Robertson et al. (2004) Robertson, B., Yoshida, N., Springel, V., & Hernquist, L. 2004, ApJ, 606, 32
- Salucci et al. (2008) Salucci, P., Yegorova, I. A., & Drory, N. 2008, MNRAS, 388, 159
- Schechter (1976) Schechter, P. 1976, ApJ, 203, 297
- Schlegel et al. (1998) Schlegel, D. J., Finkbeiner, D. P., & Davis, M. 1998, ApJ, 500, 525
- Sheth et al. (2008) Sheth, K., et al. 2008, ApJ, 675, 1141
- Simard (1998) Simard, L. 1998, in ASP Conf. Ser. 145, Astronomical Data Analysis Software and Systems VII, ed. R. Albrecht, R. N. Hook, & H. A. Bushouse (San Francisco: Astronomical Society of the Pacific), 108
- Simard et al. (2002) Simard, L., et al. 2002, ApJS, 142, 1
- Somerville & Kolatt (1999) Somerville, R. S., & Kolatt, T. S. 1999, MNRAS, 305, 1
- Springel et al. (2005) Springel, V., Di Matteo, T., & Hernquist, L. 2005, MNRAS, 361, 776
- Springel & Hernquist (2005) Springel, V., & Hernquist, L. 2005, ApJL, 622, L9
- Springel et al. (2001) Springel, V., White, S. D. M., Tormen, G., & Kauffmann, G. 2001, MNRAS, 328, 726
- Steinmetz & Navarro (2002) Steinmetz, M., & Navarro, J. F. 2002, NewA, 7, 155
- (122) Toomre, A. 1981, in The Structure and Evolution of Normal Galaxies, ed. S. M. Fall & D. Lynden-Bell (New York: Cambridge University Press), 111
- Trujillo et al. (2002) Trujillo, I., Asensio Ramos, A., Rubiño-Martín, J. A., Graham, A. W., Aguerri, J. A. L., Cepa, J., & Gutiérrez, C. M. 2002, MNRAS, 333, 510
- (124) Tully, R. B. 1988, Nearby Galaxies Catalog (Cambridge: Cambridge University Press)
- (125) Quinn, P. J., Hernquist, L., & Fullagar, D. P. 1993, ApJ, 403, 74
- Véron-Cetty & Véron (2006) Véron-Cetty, M.-P., & Véron, P. 2006, A&A, 455, 773
- Wadadekar et al. (1999) Wadadekar, Y., Robbason, B., & Kembhavi, A. 1999, AJ, 117, 1219
- (128) Walker, I. R., Mihos, J. C., & Hernquist, L. 1996, ApJ, 460, 121
- Warren et al. (2007) Warren, S. J., et al. 2007, MNRAS, 375, 213
- Weinberg (1985) Weinberg, M. D. 1985, MNRAS, 213, 451
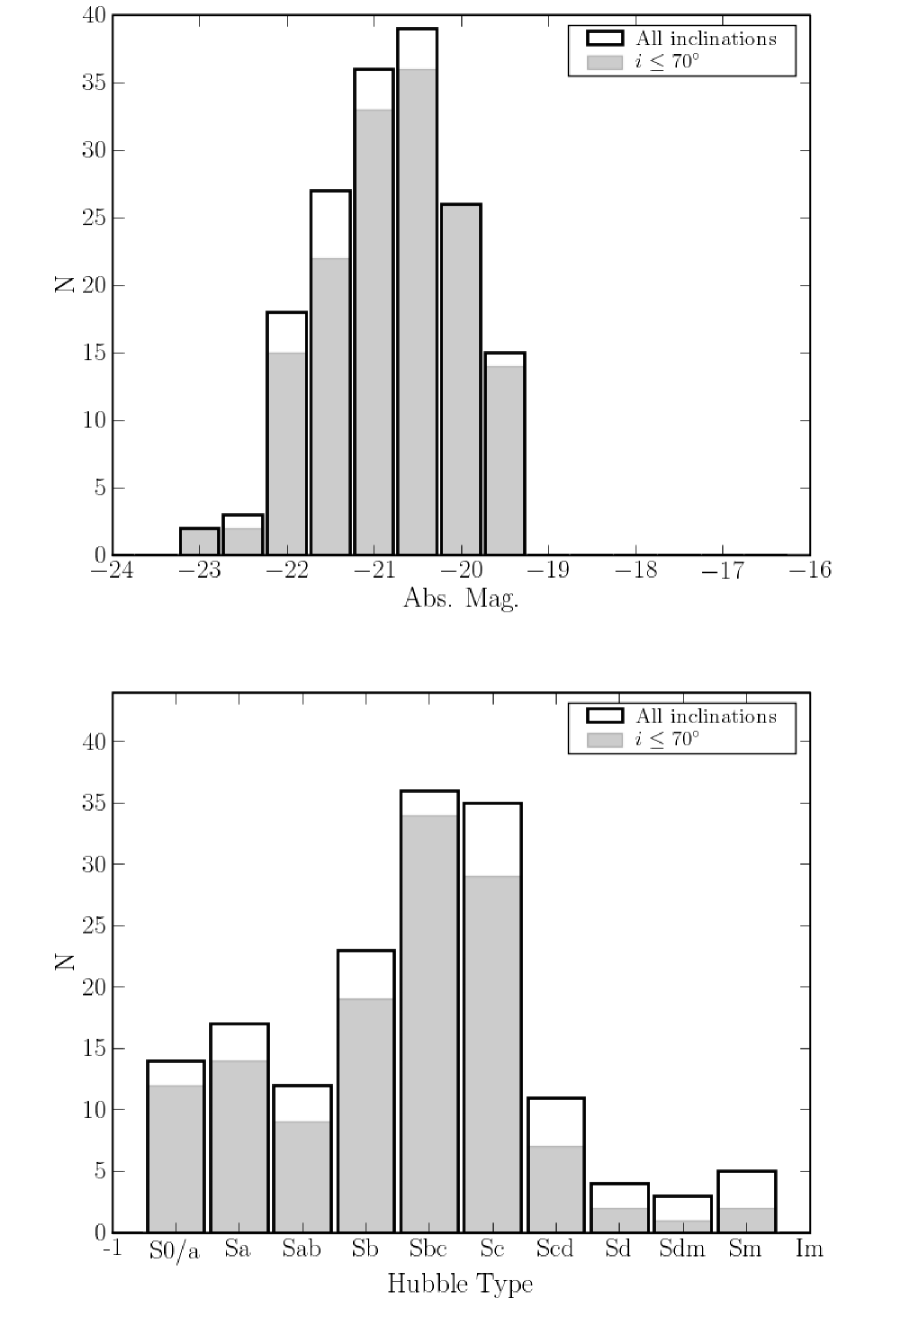
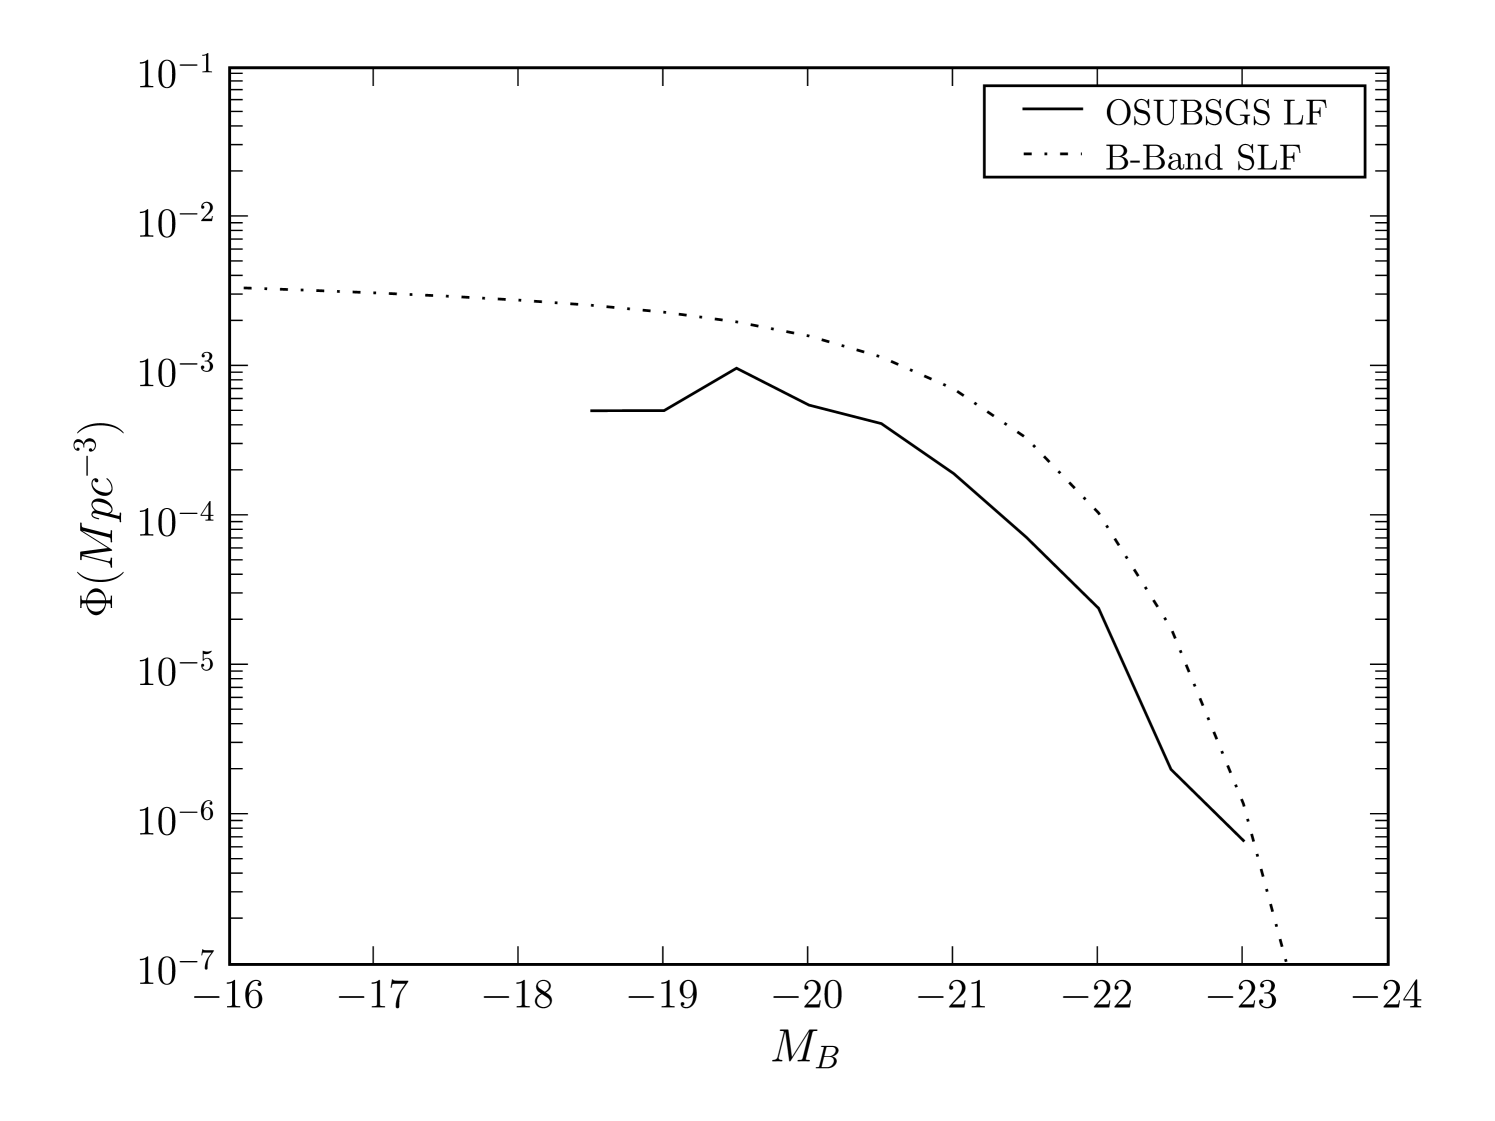
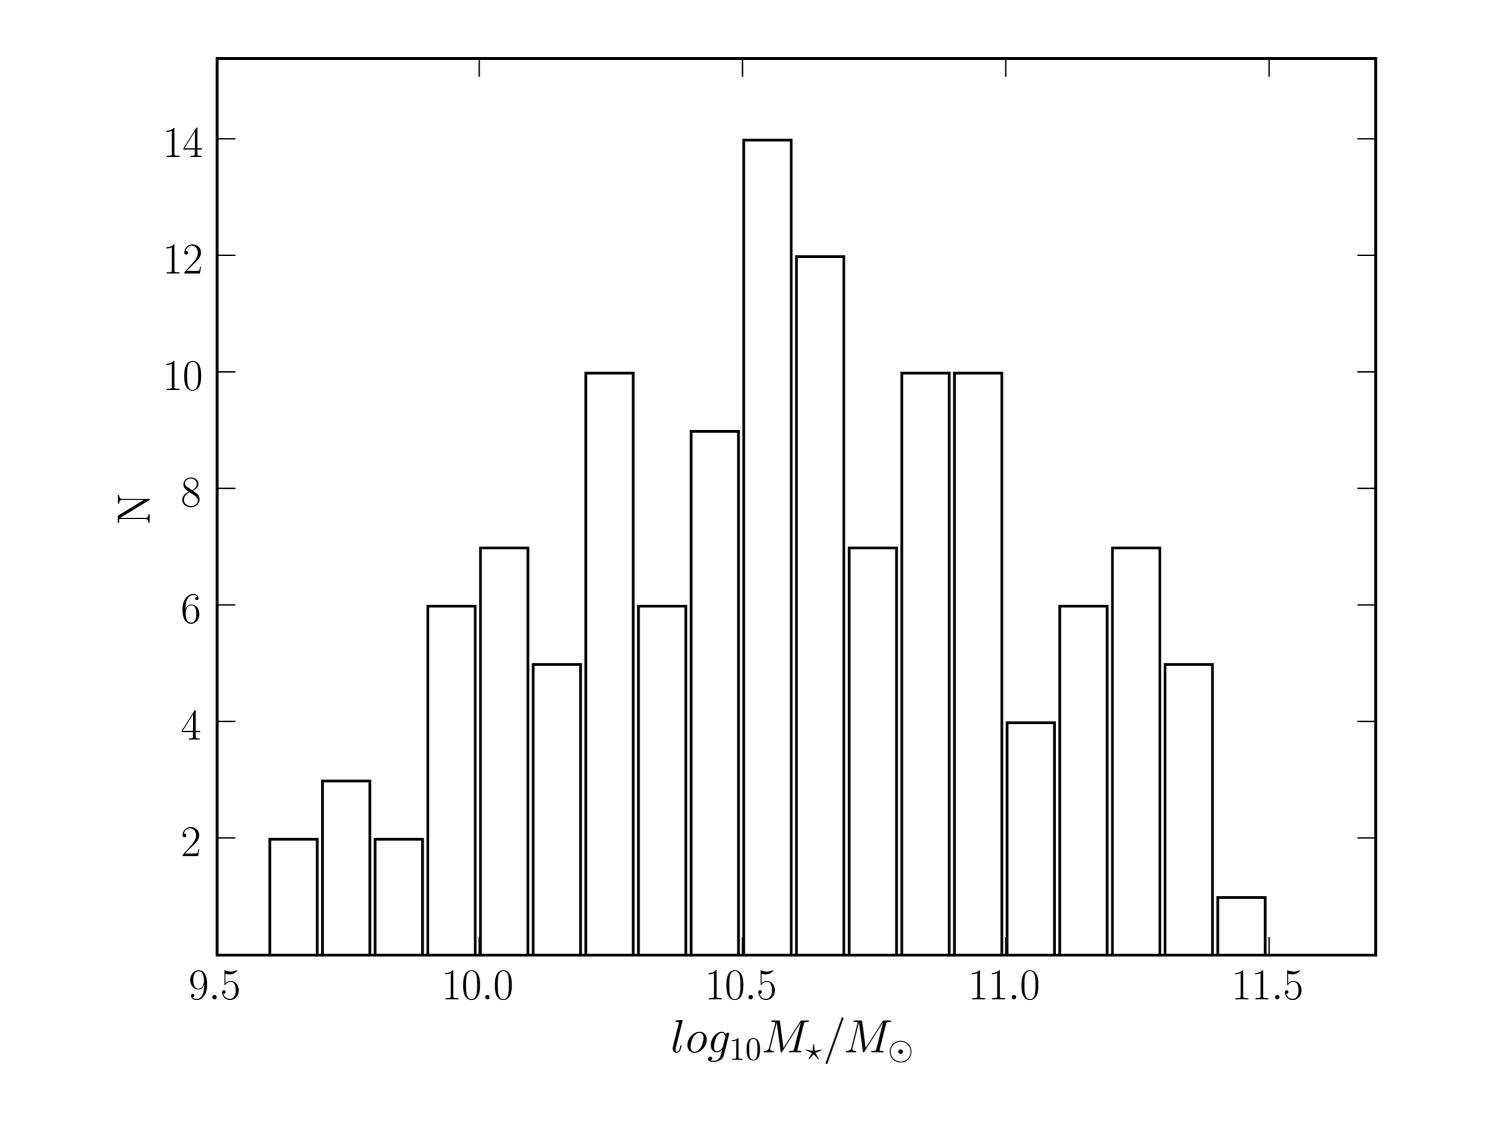
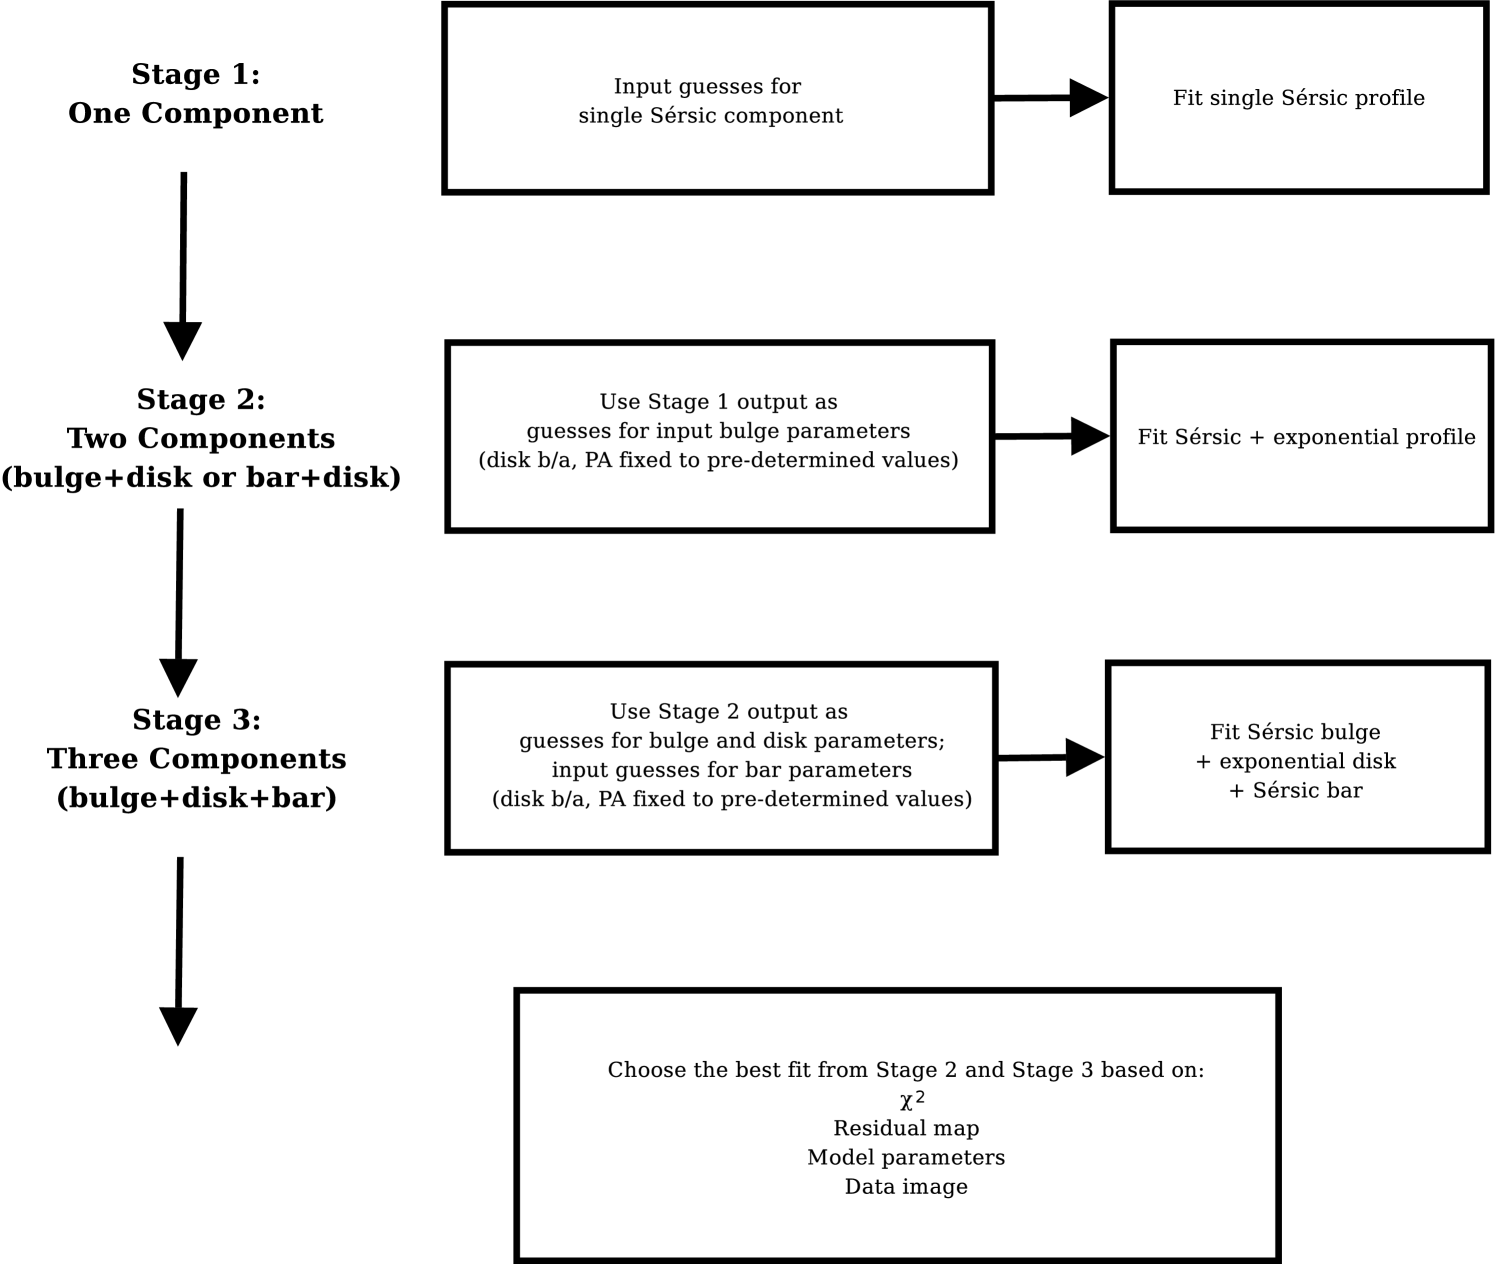
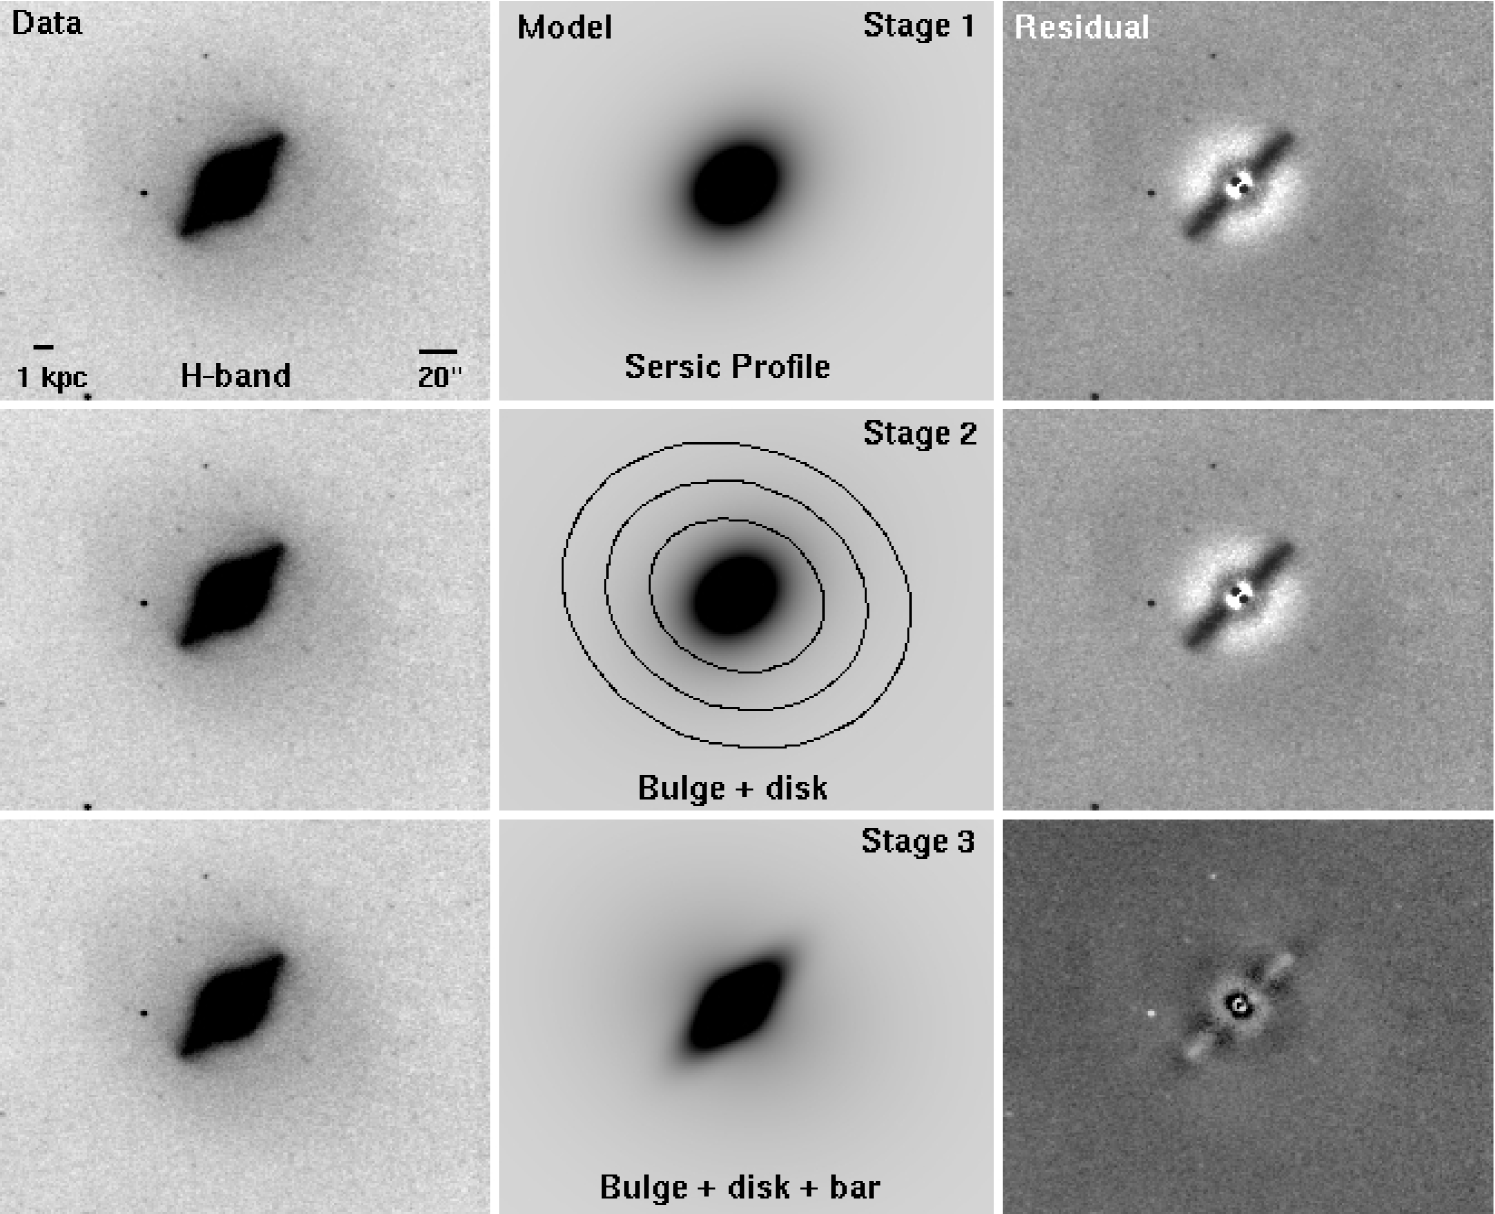
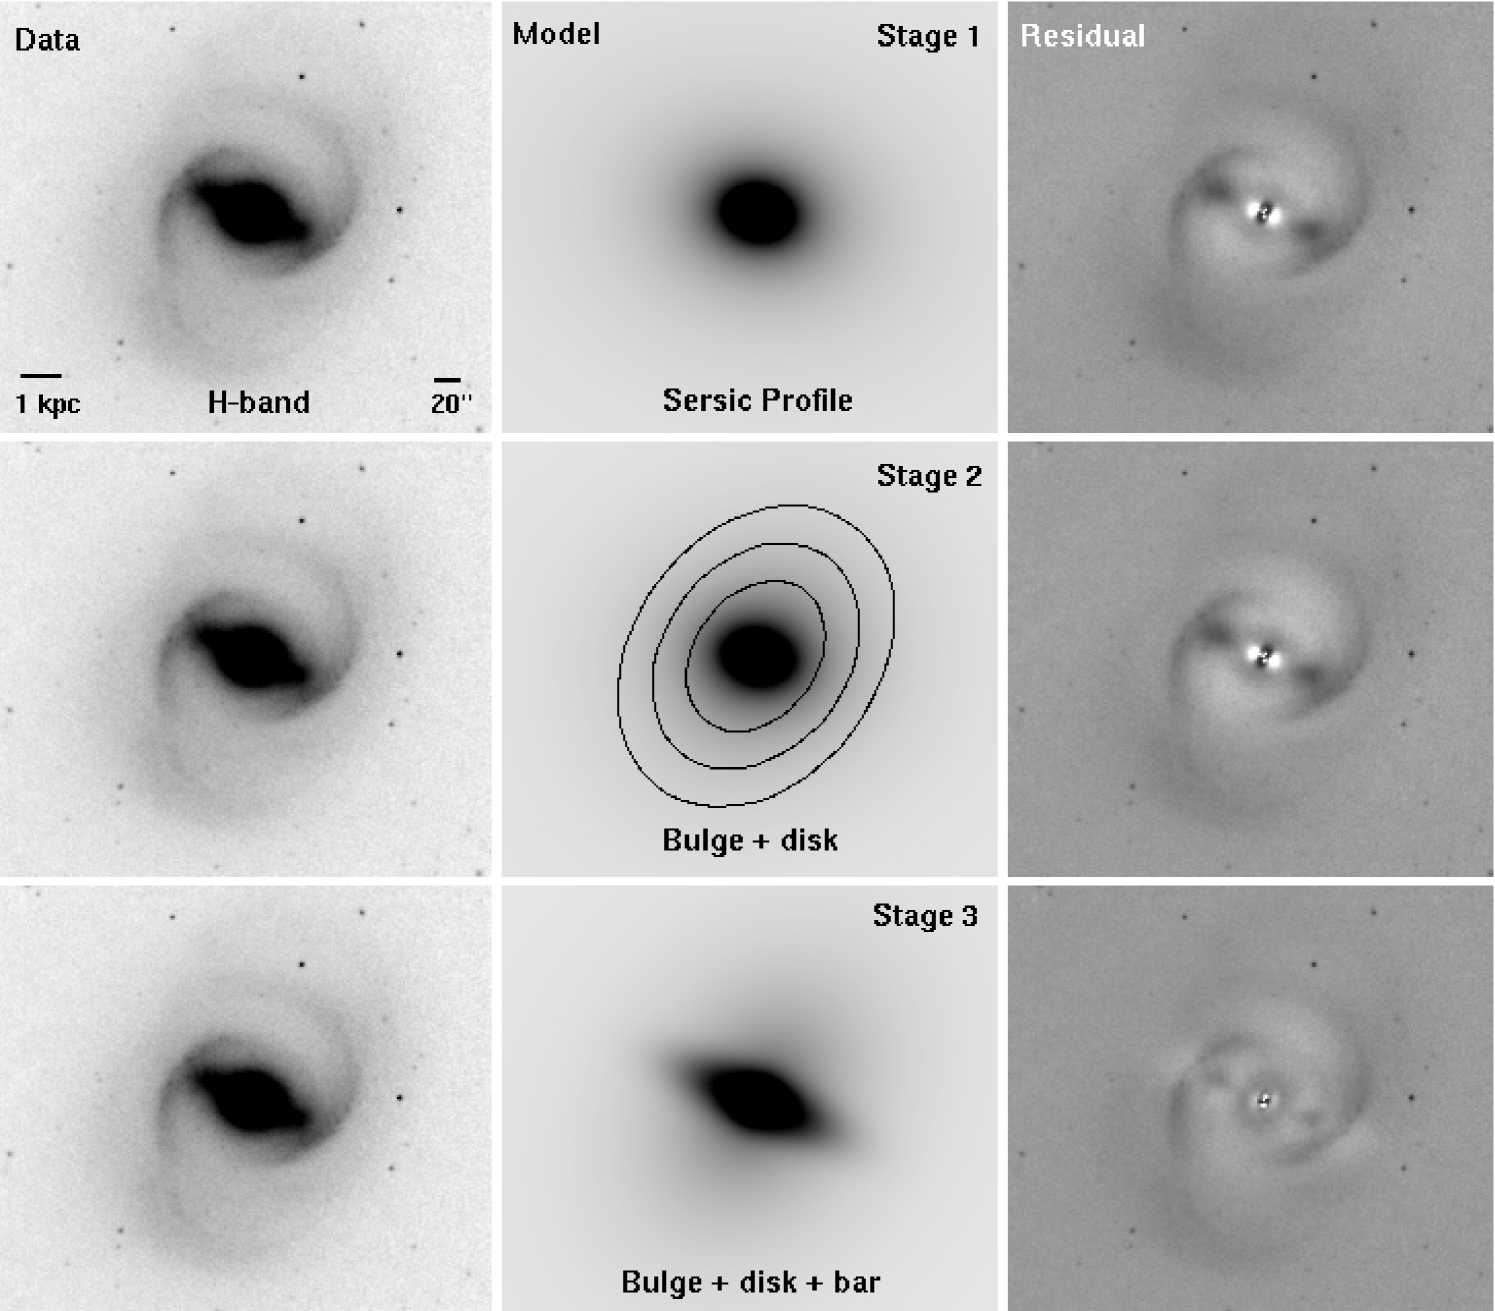
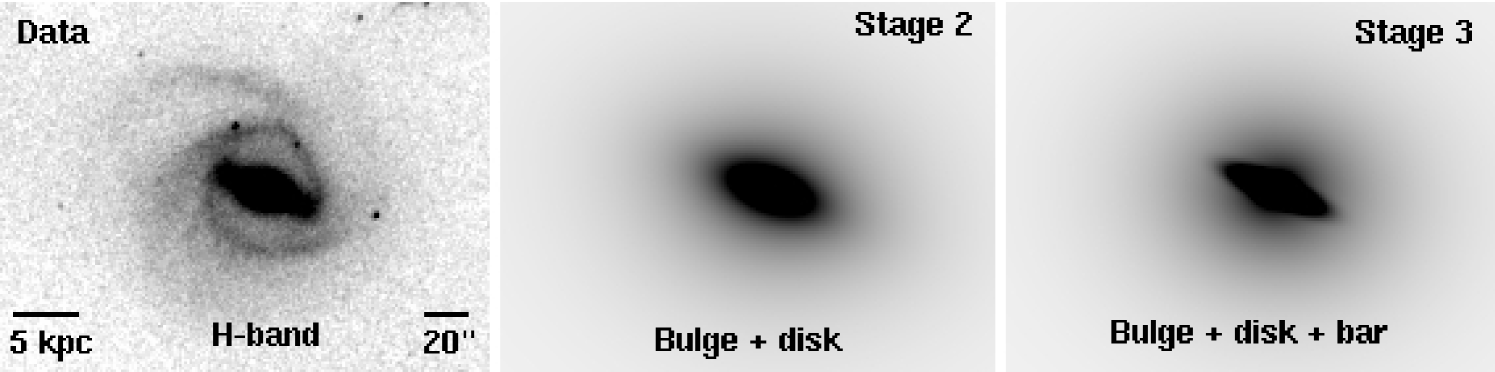
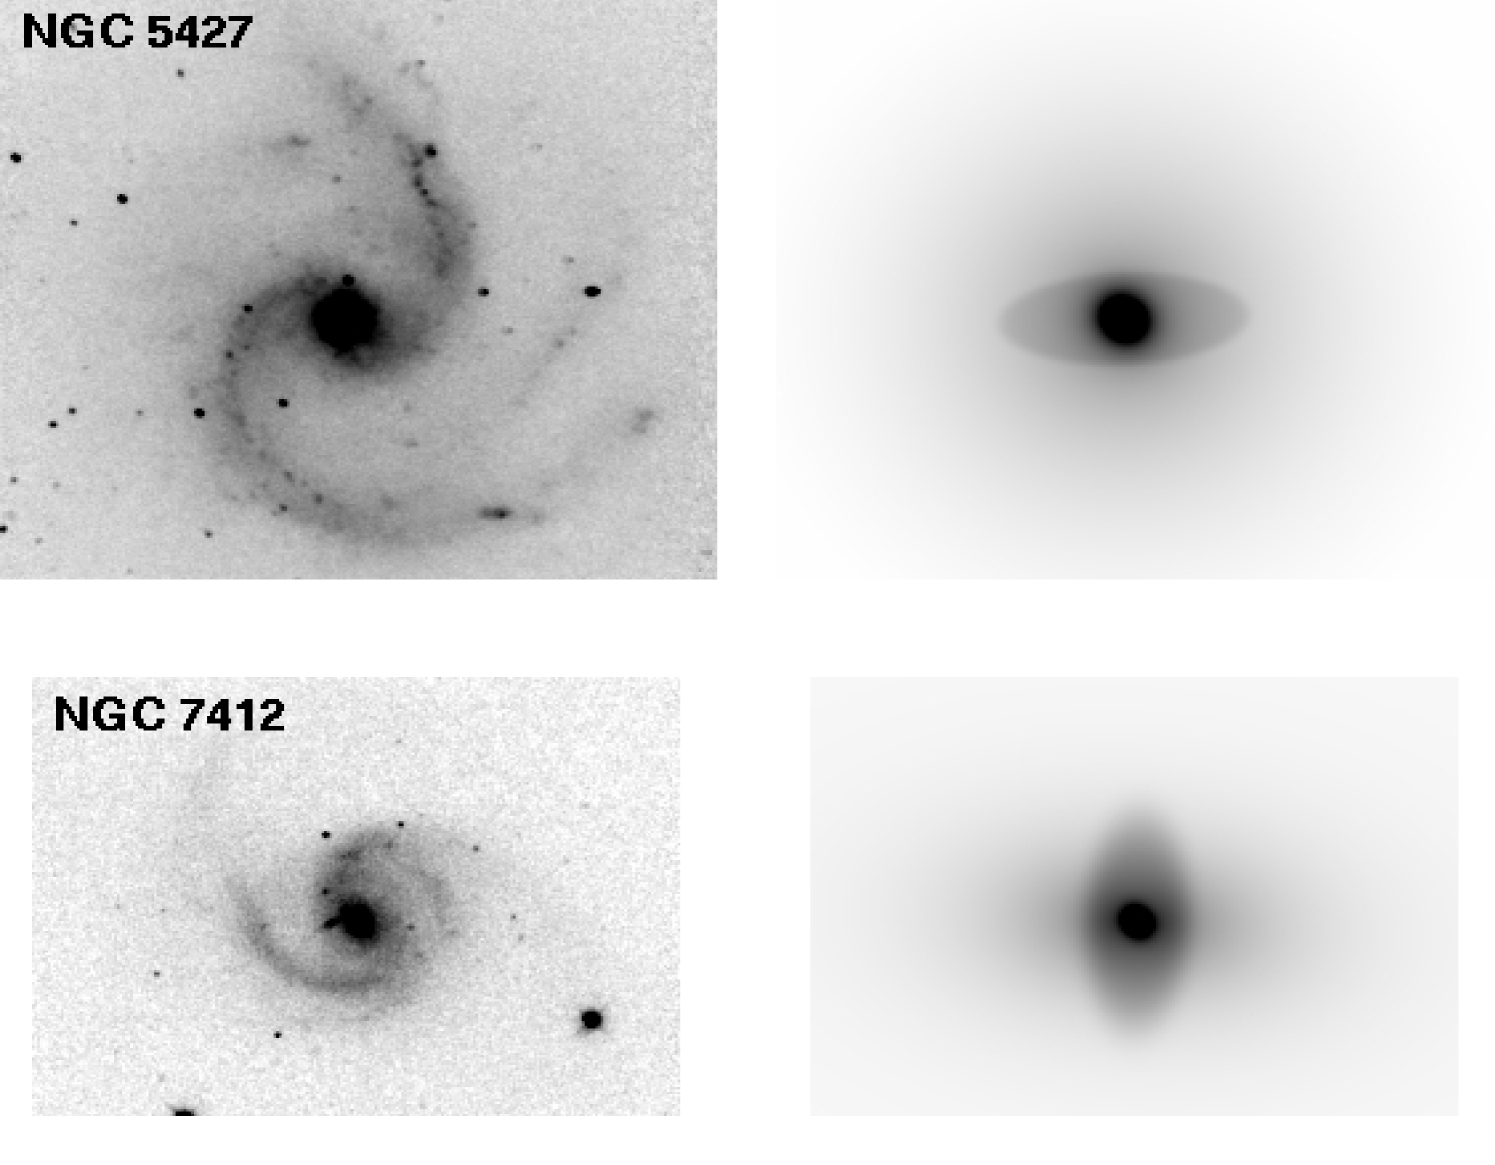
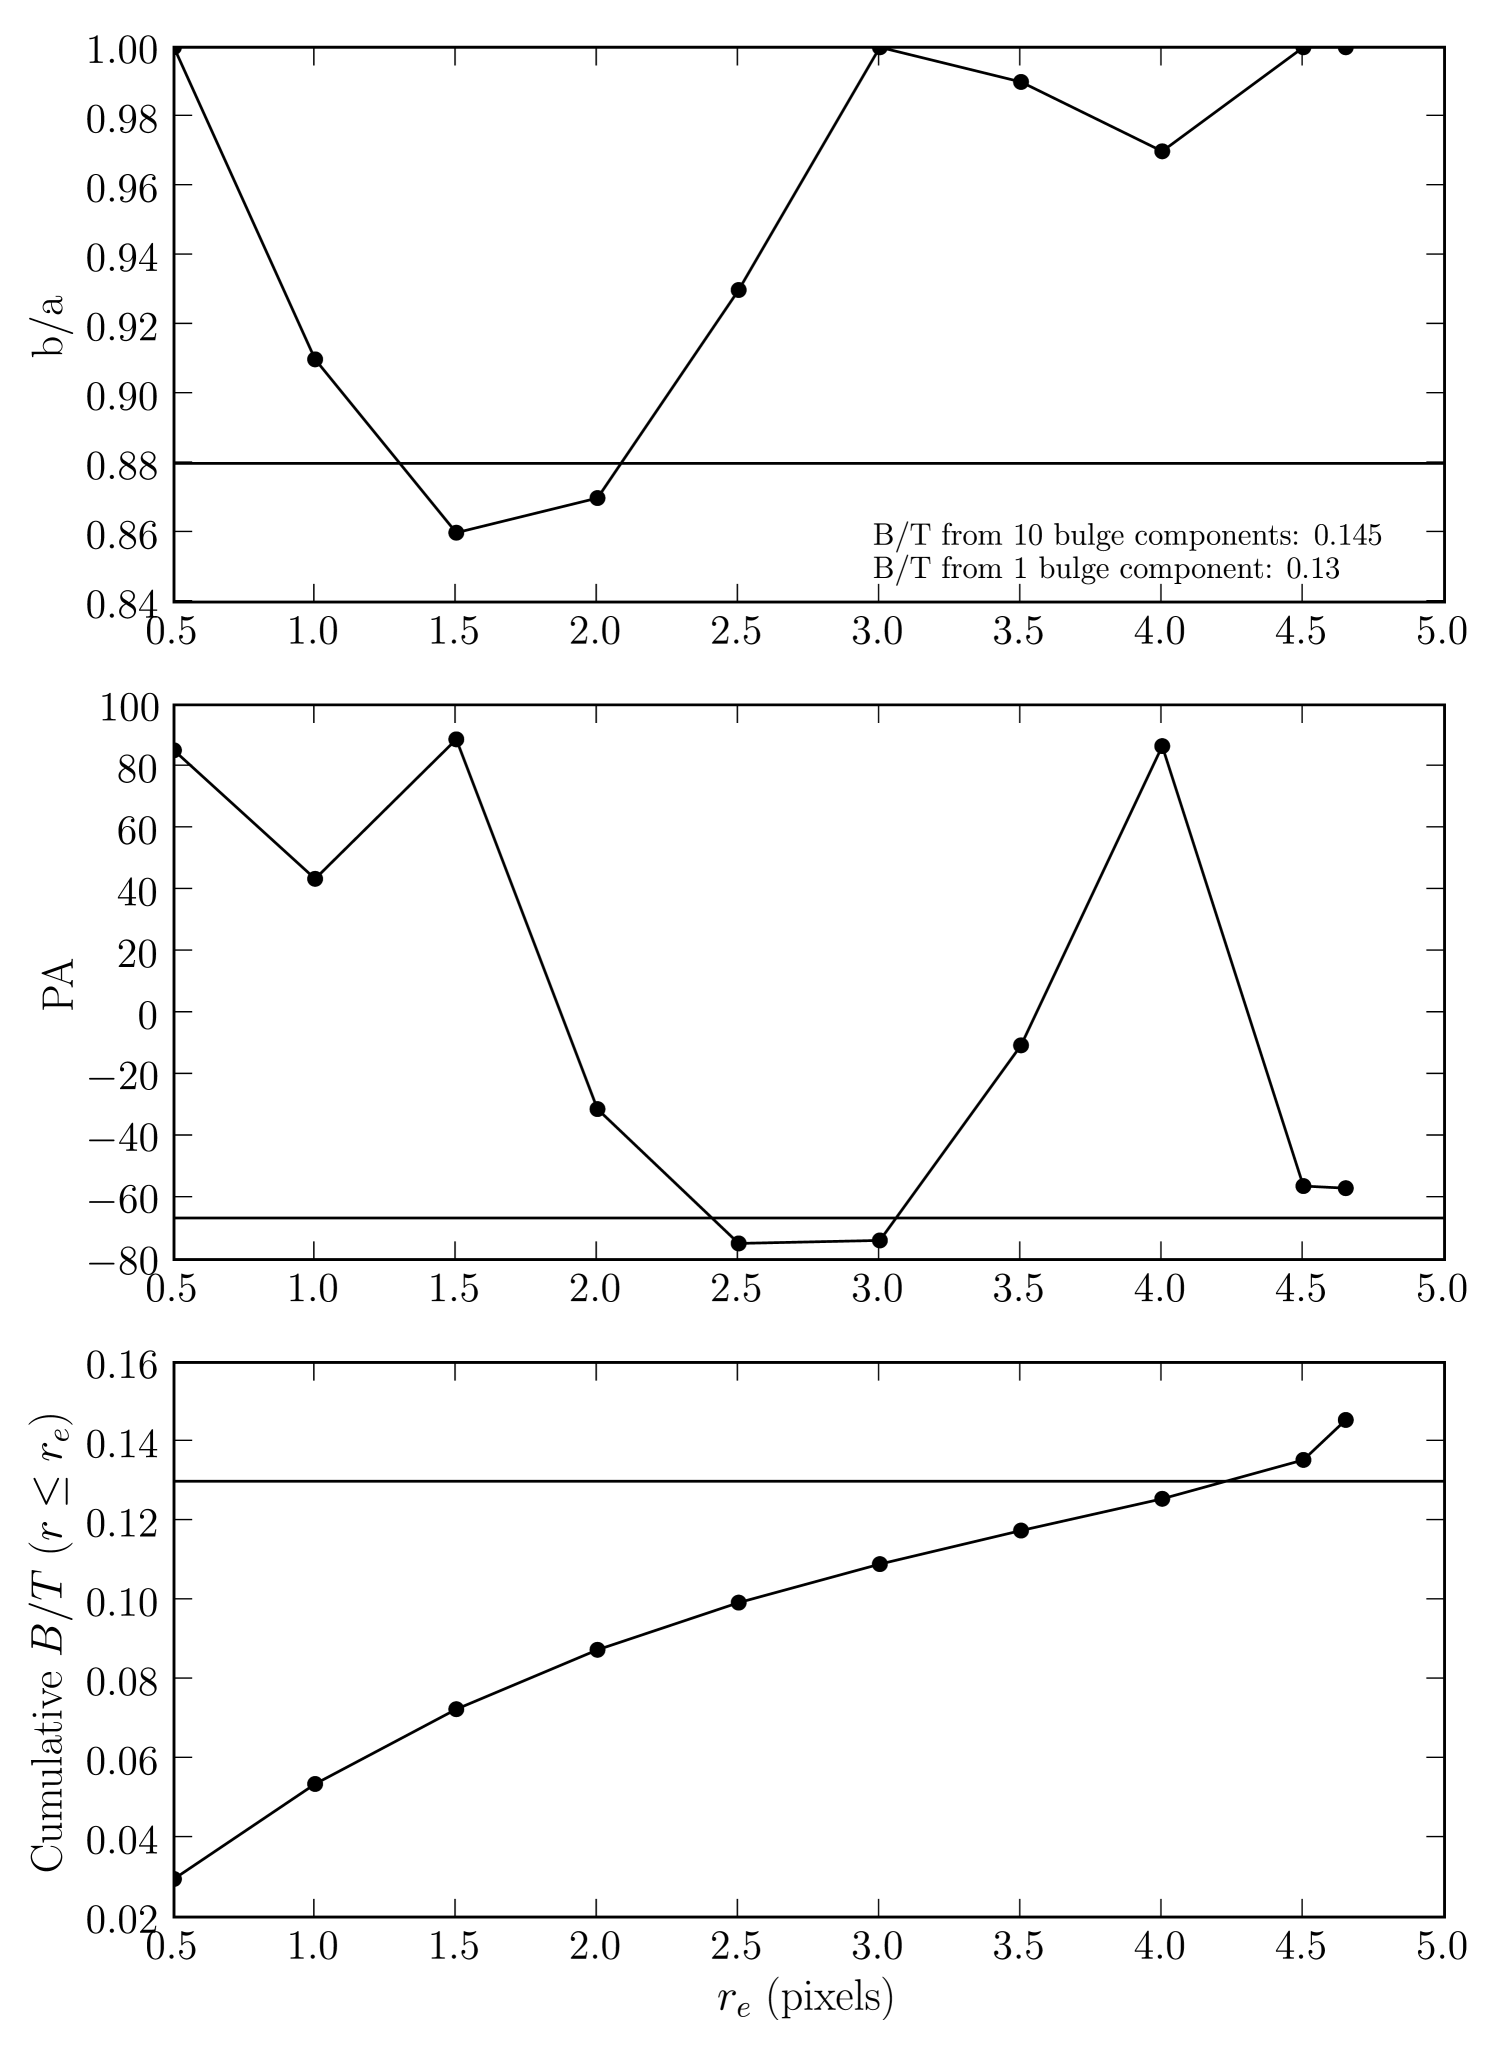
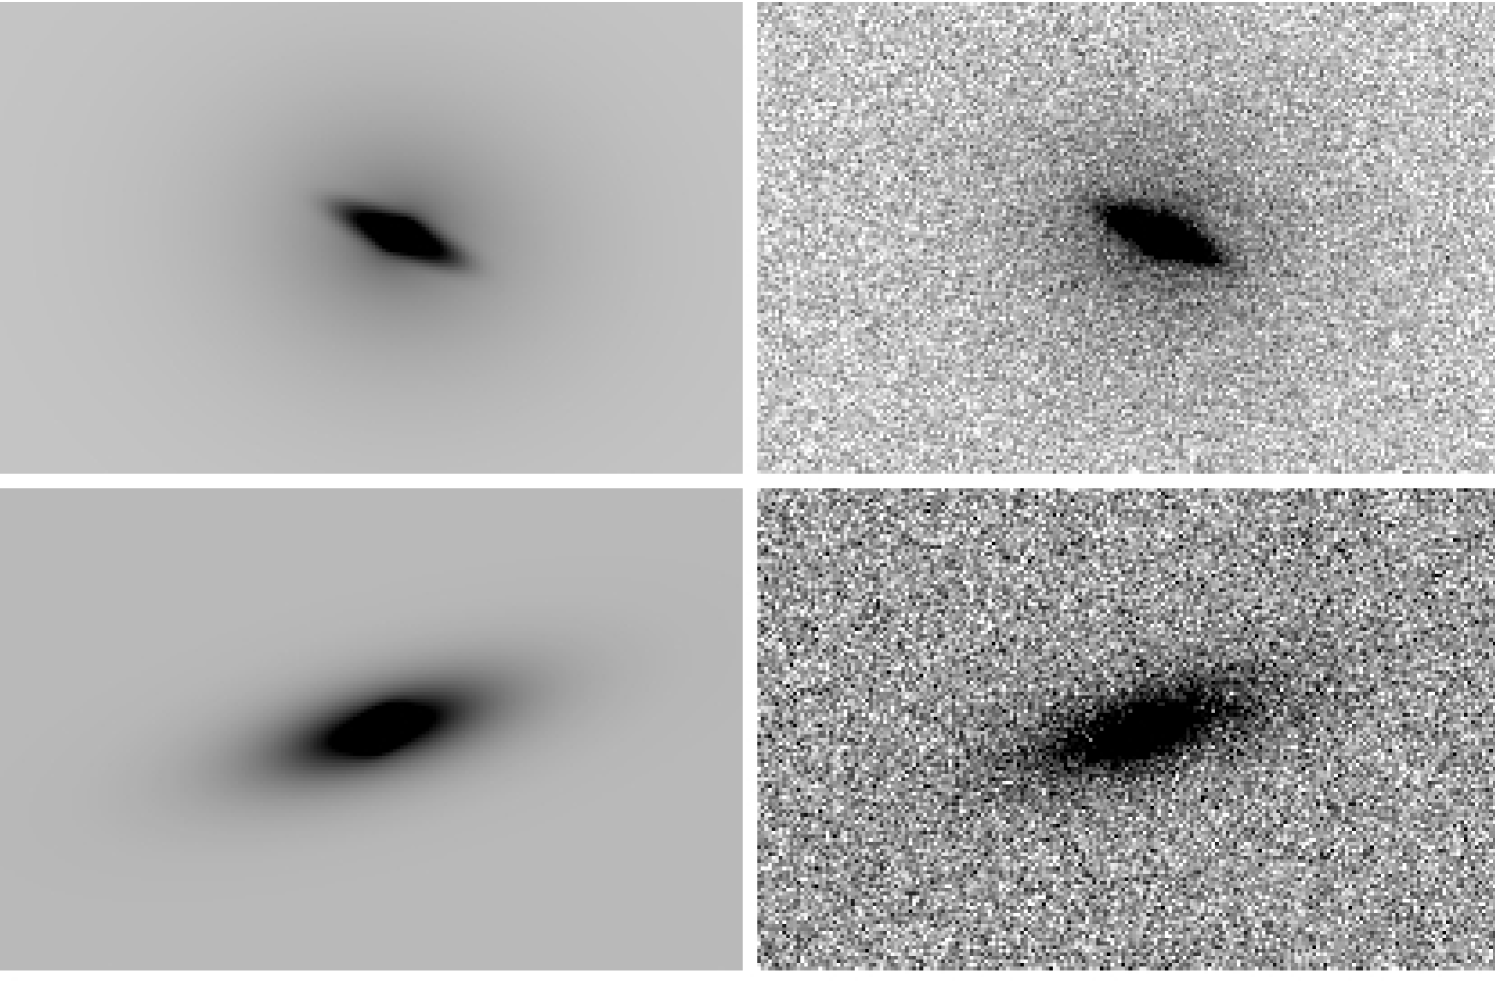
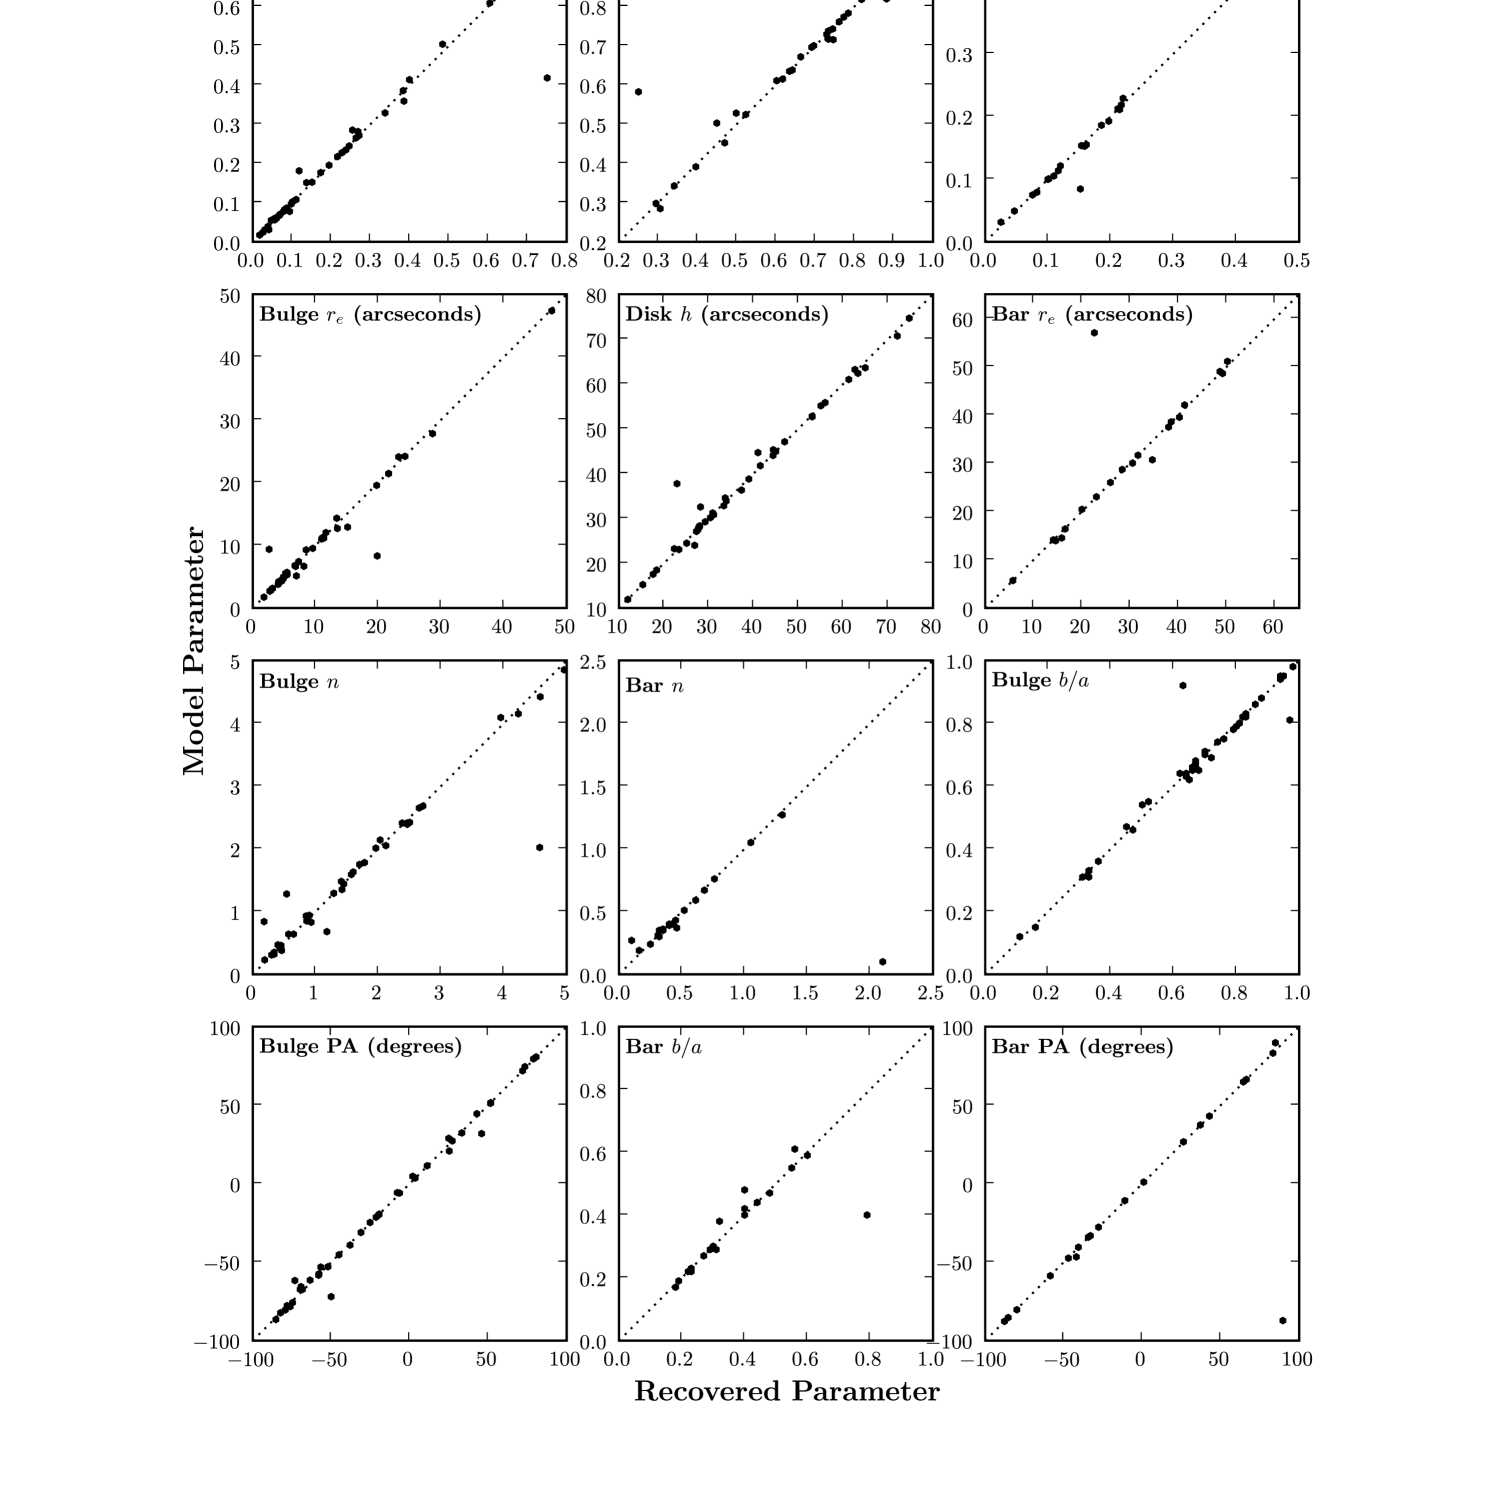
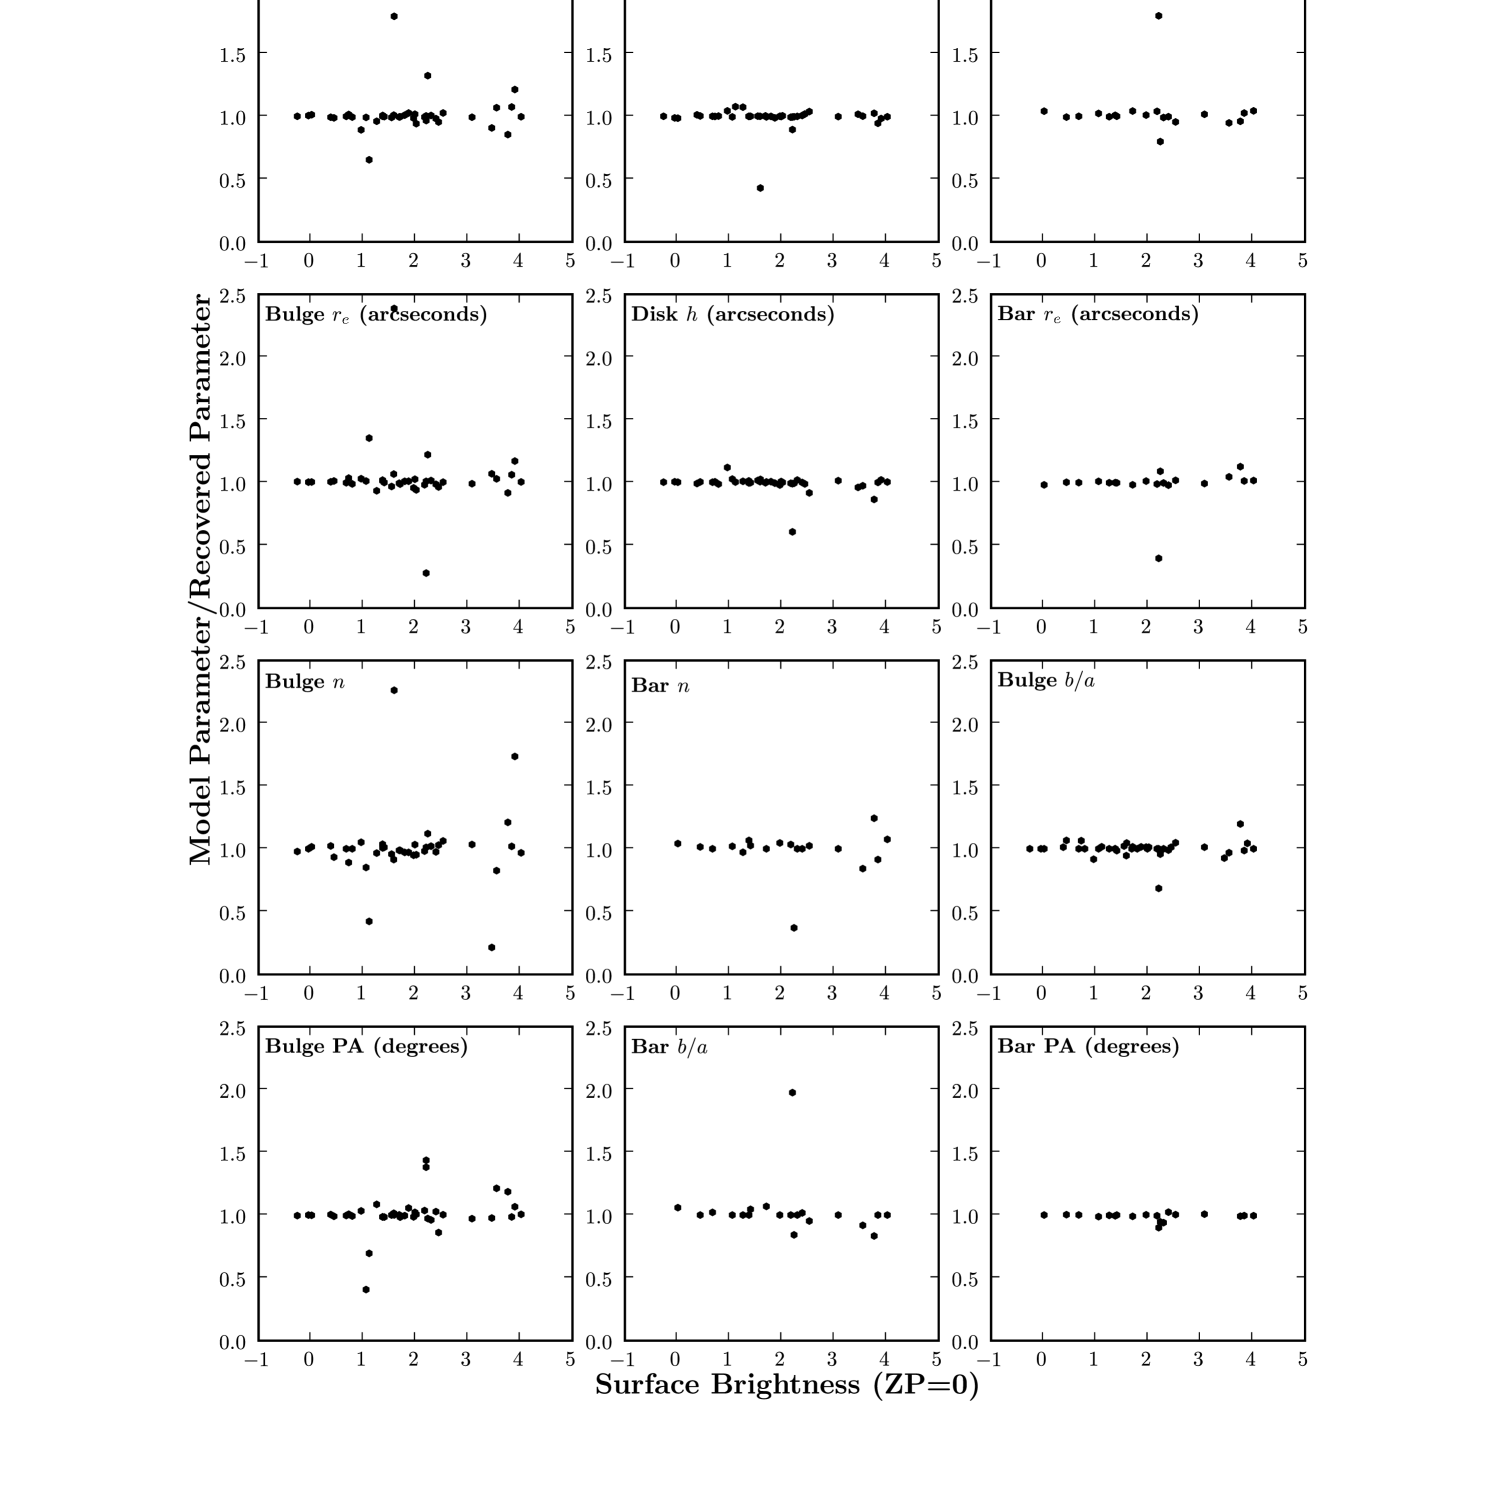
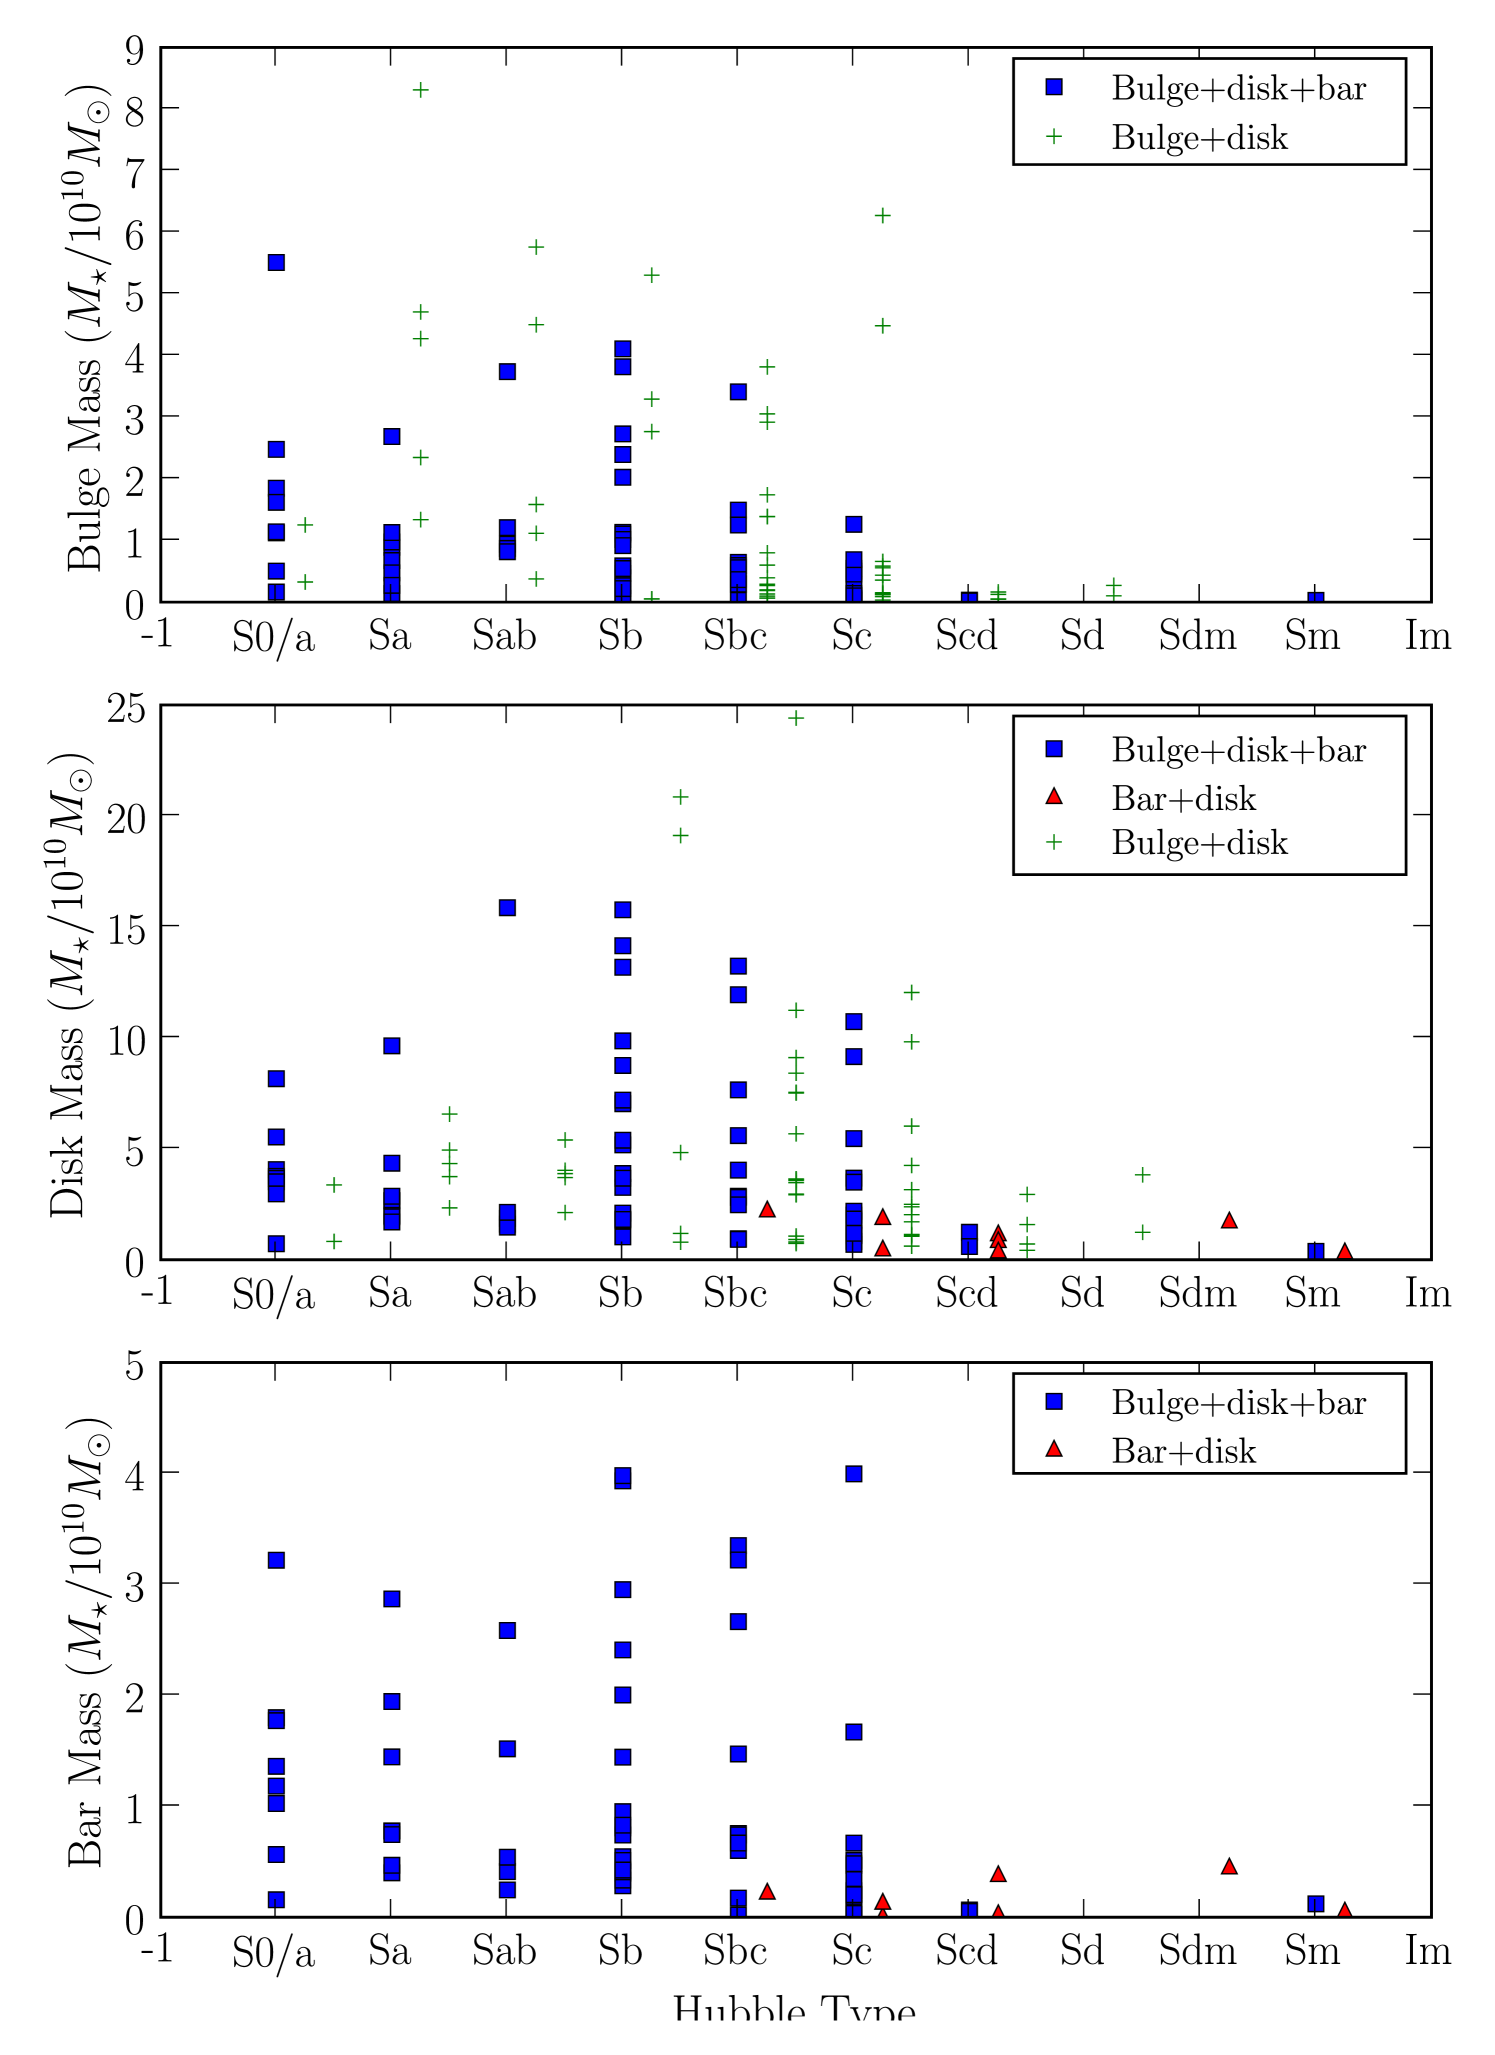
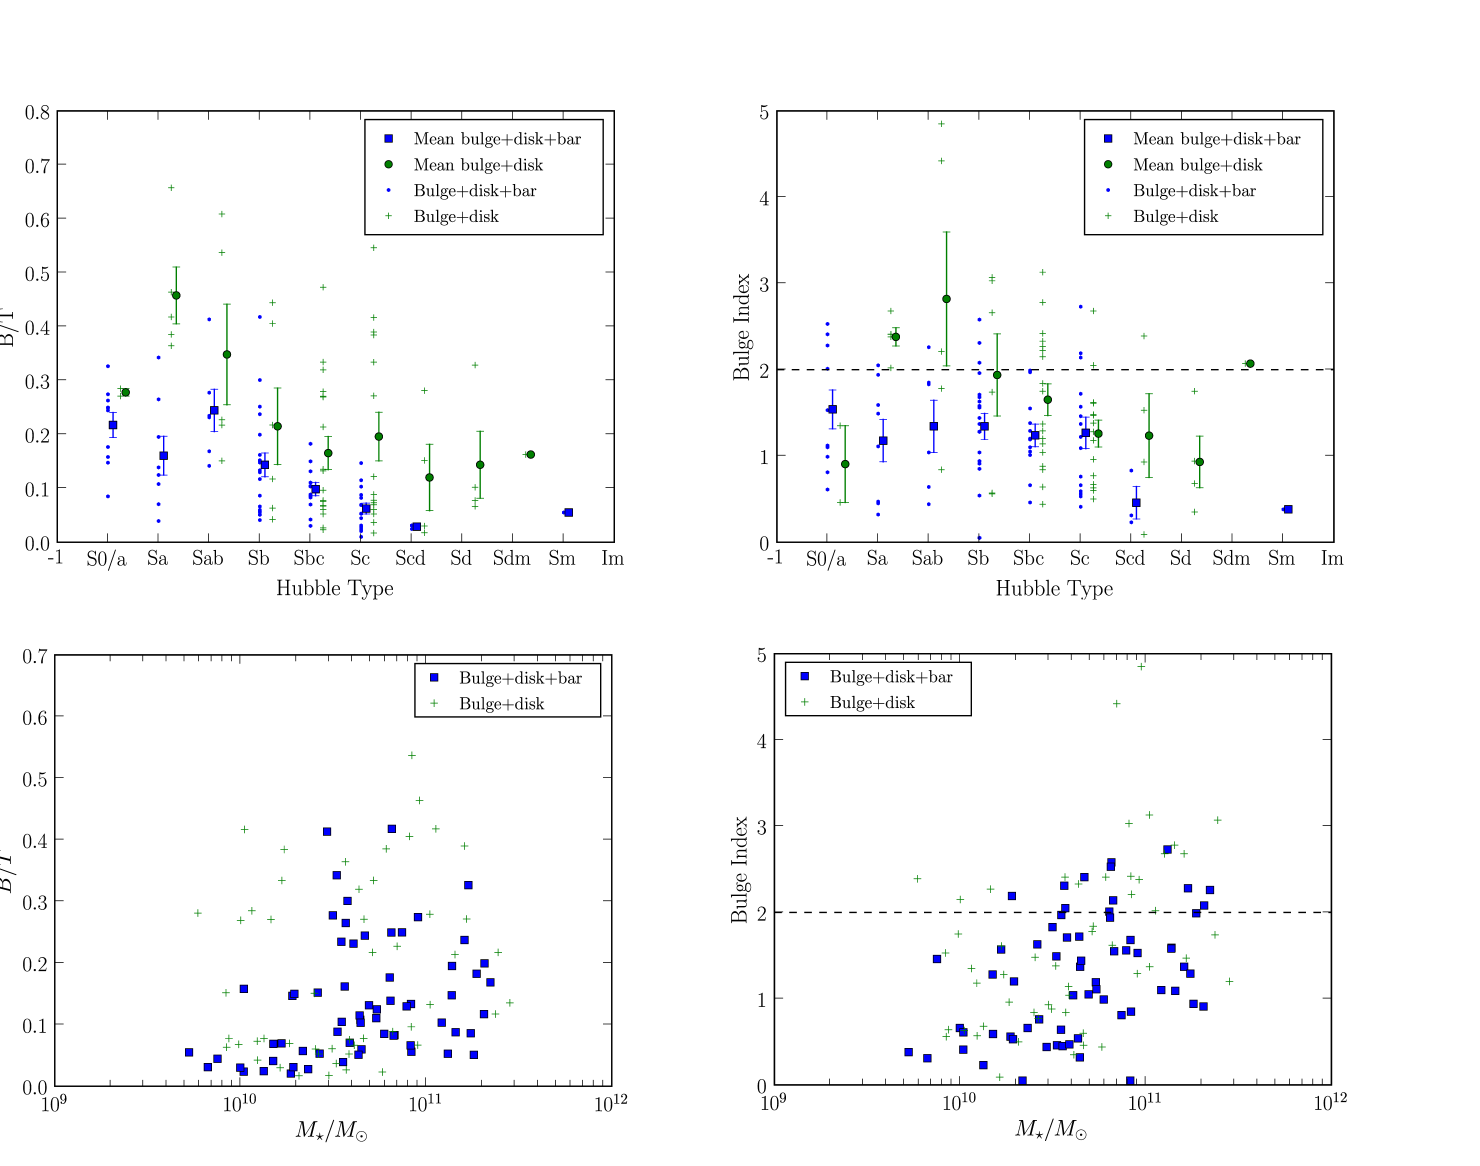
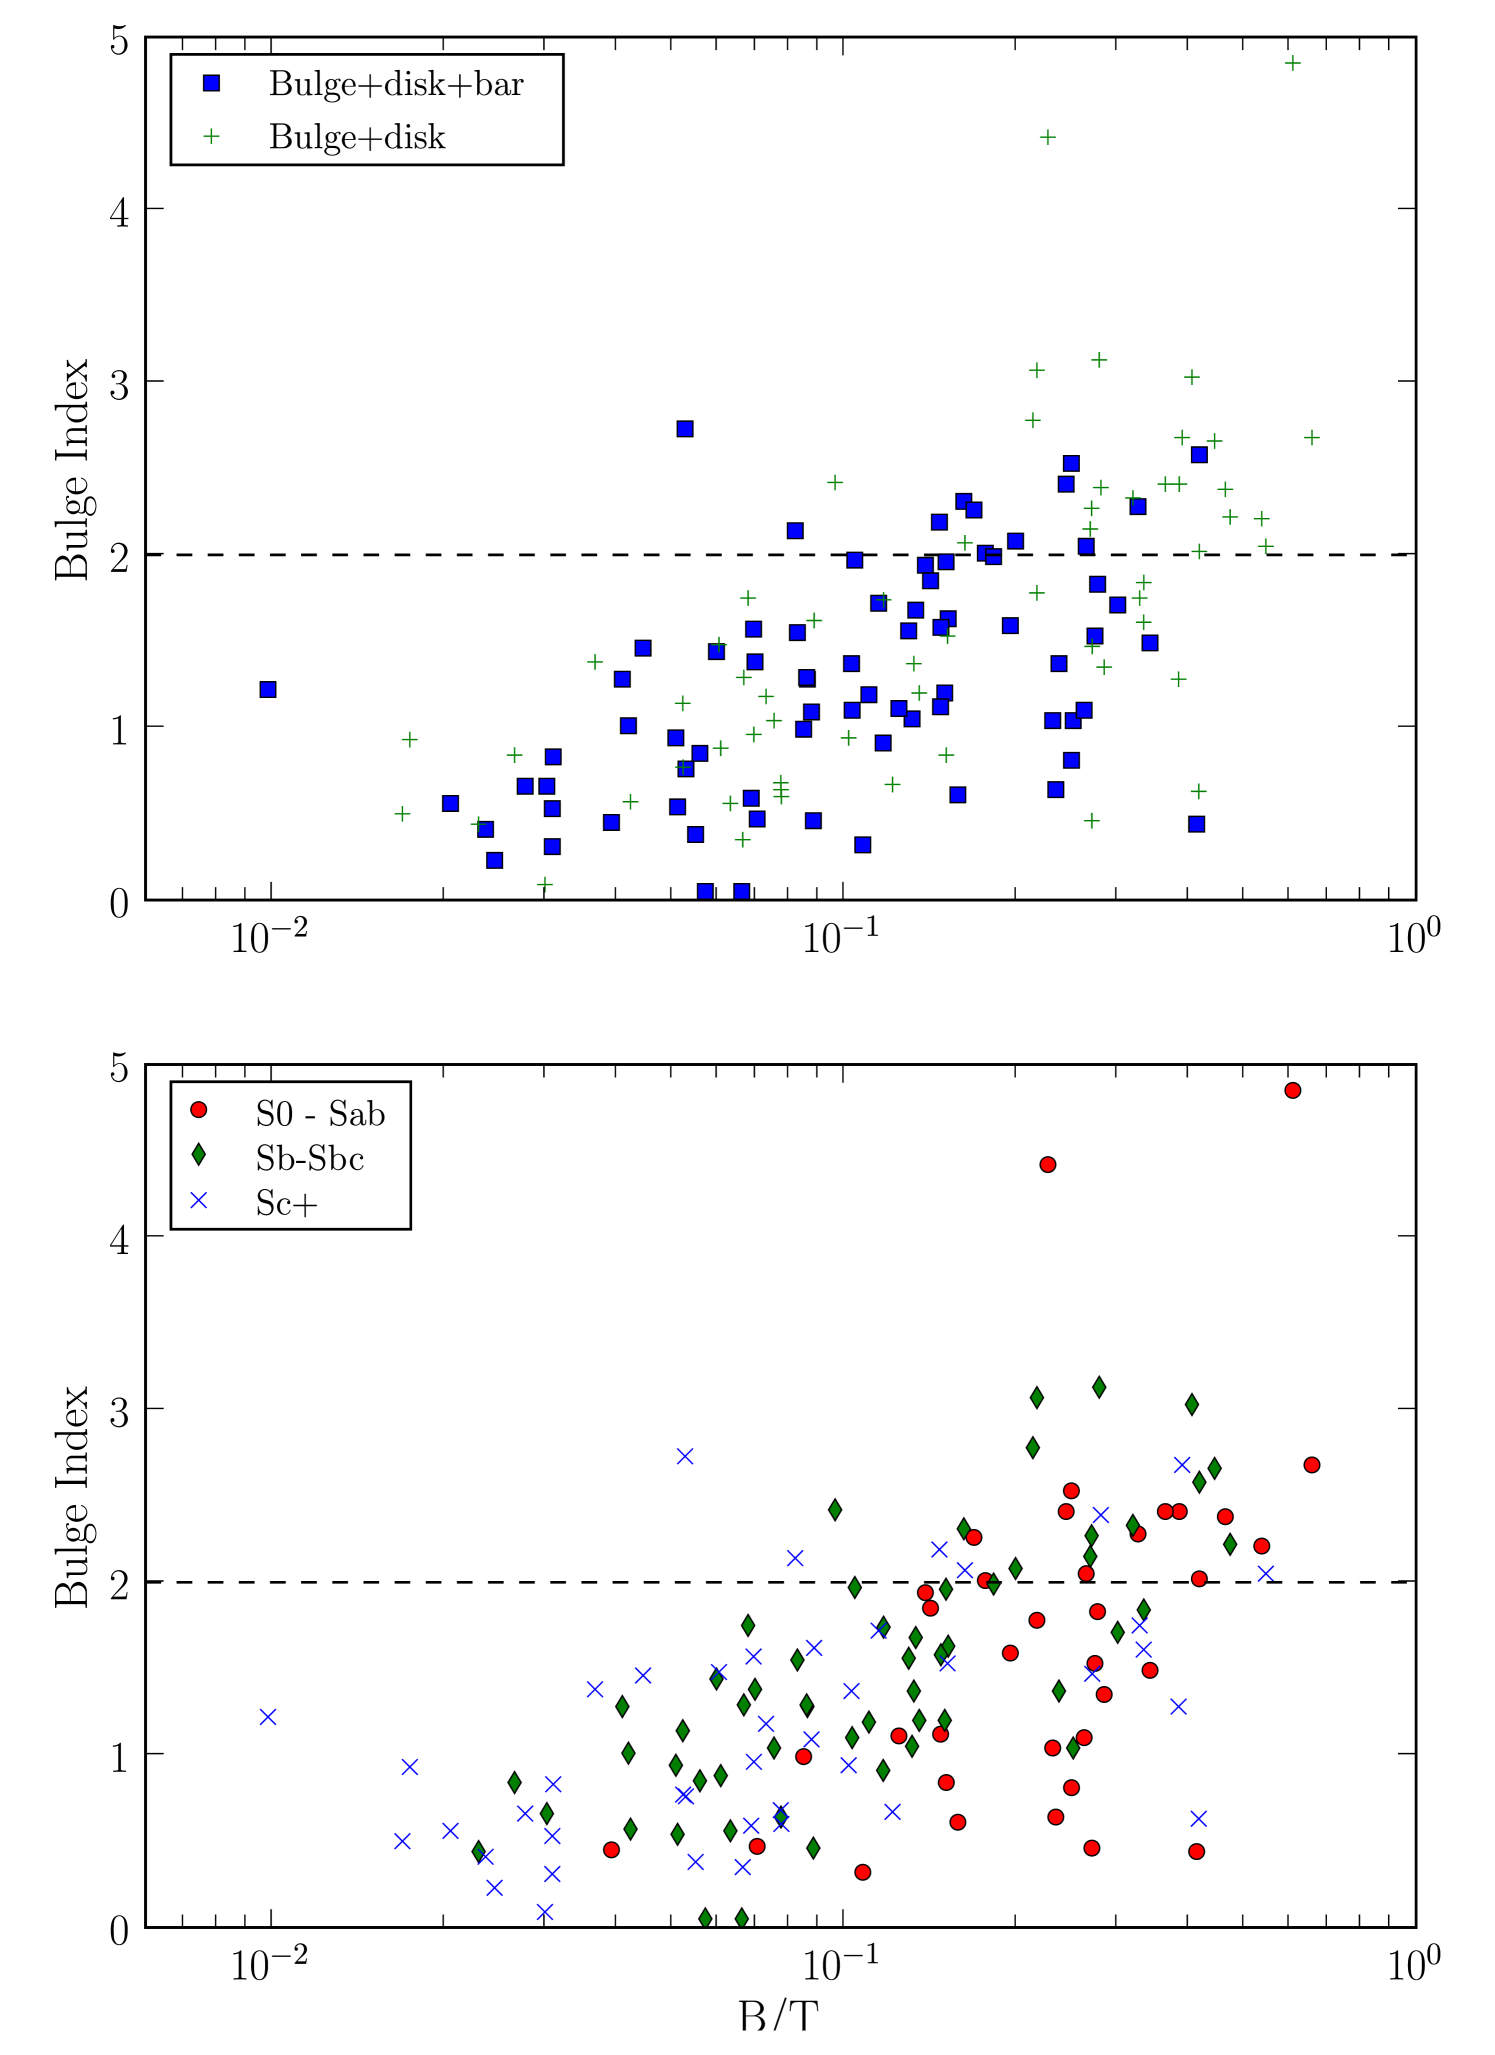
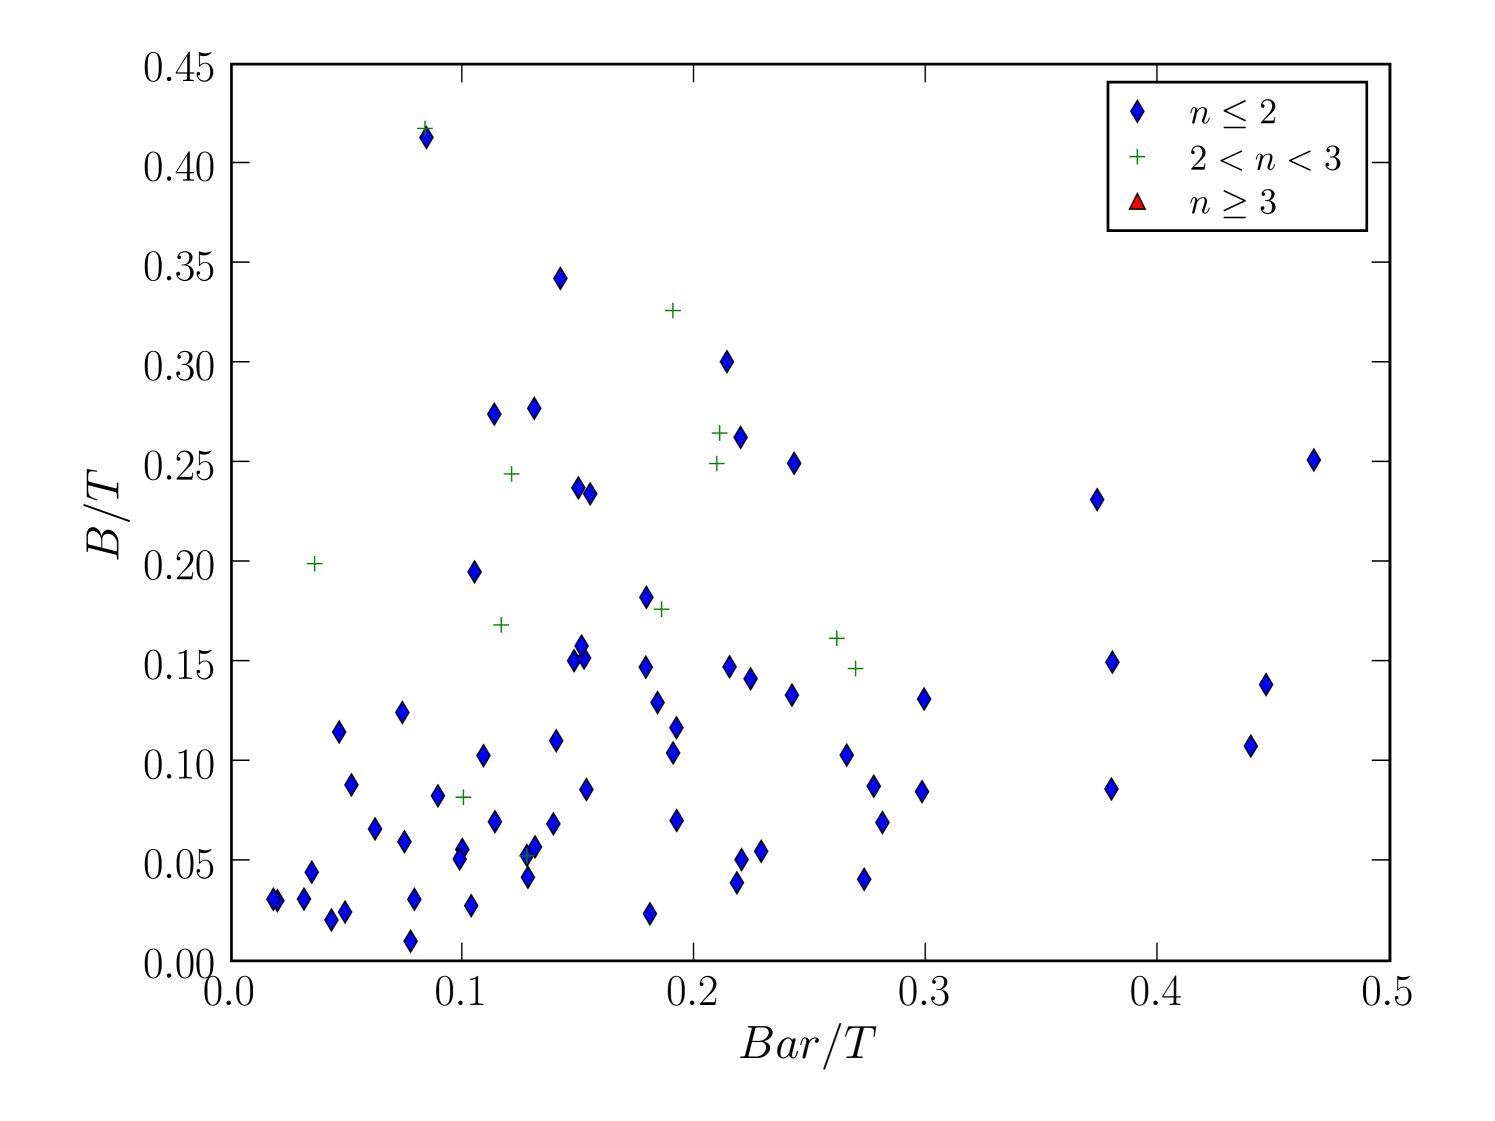
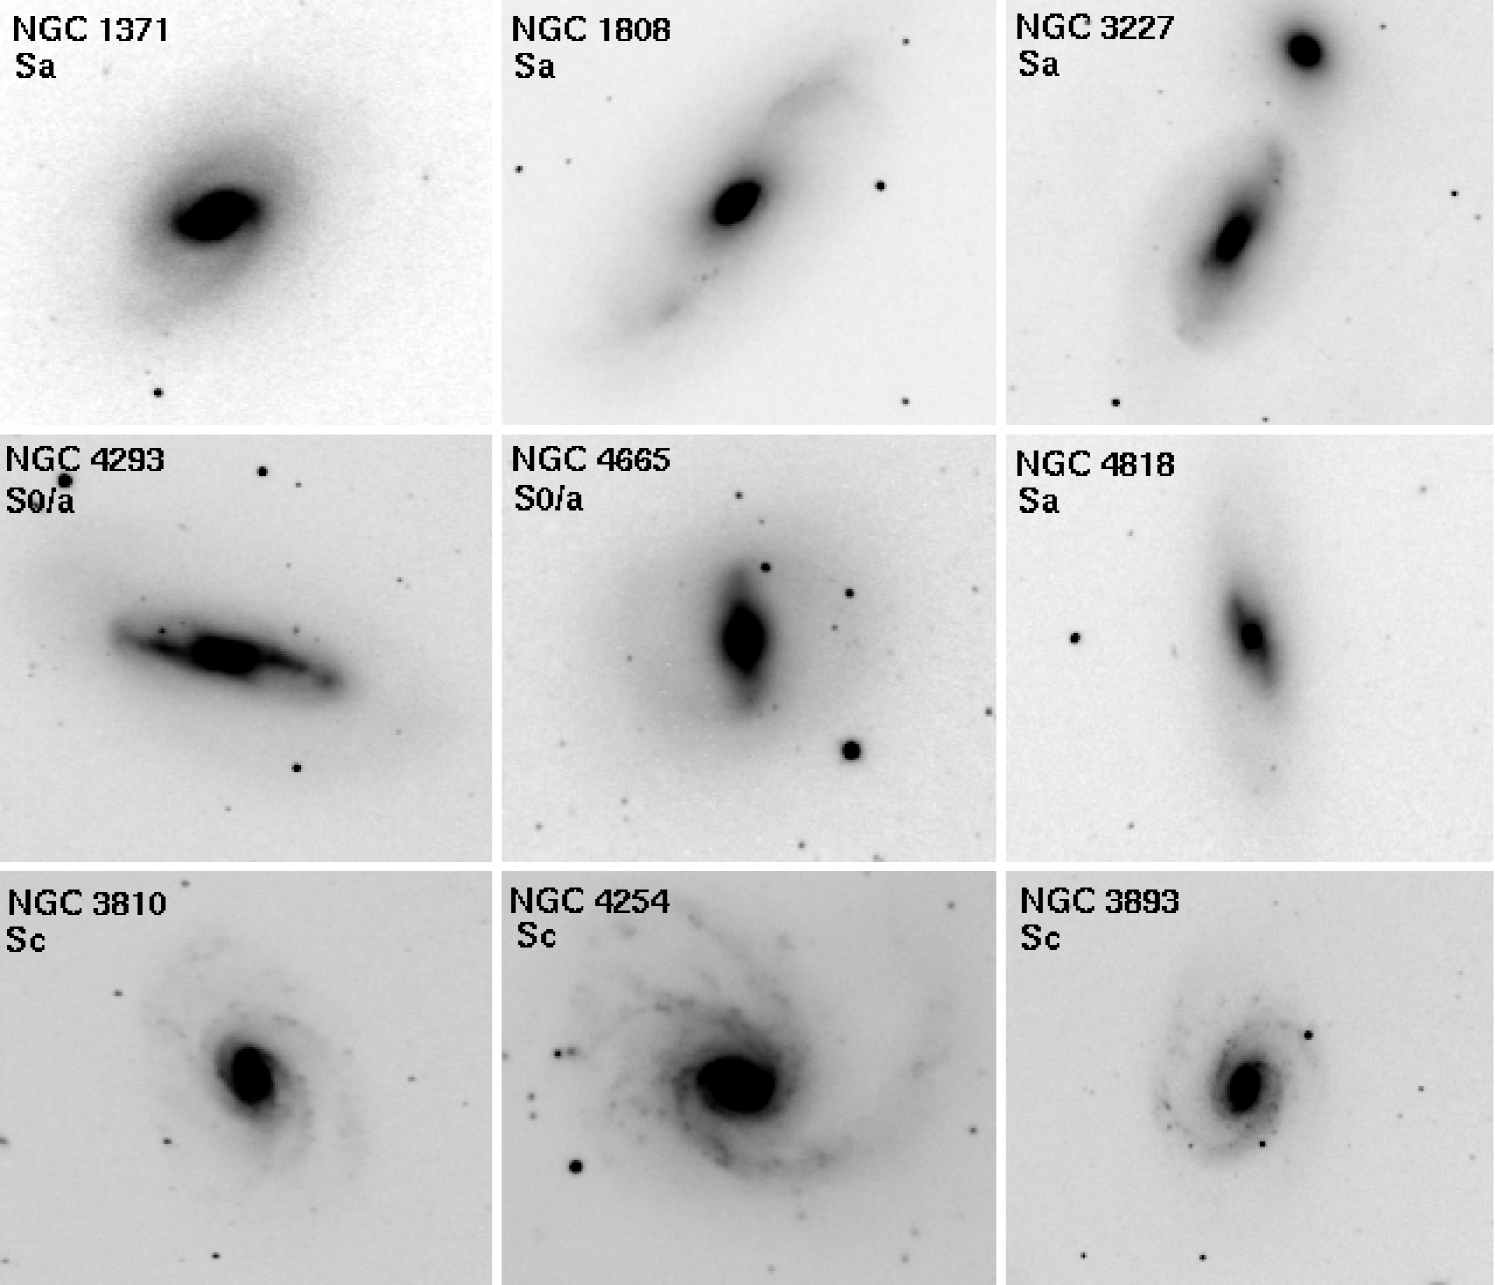
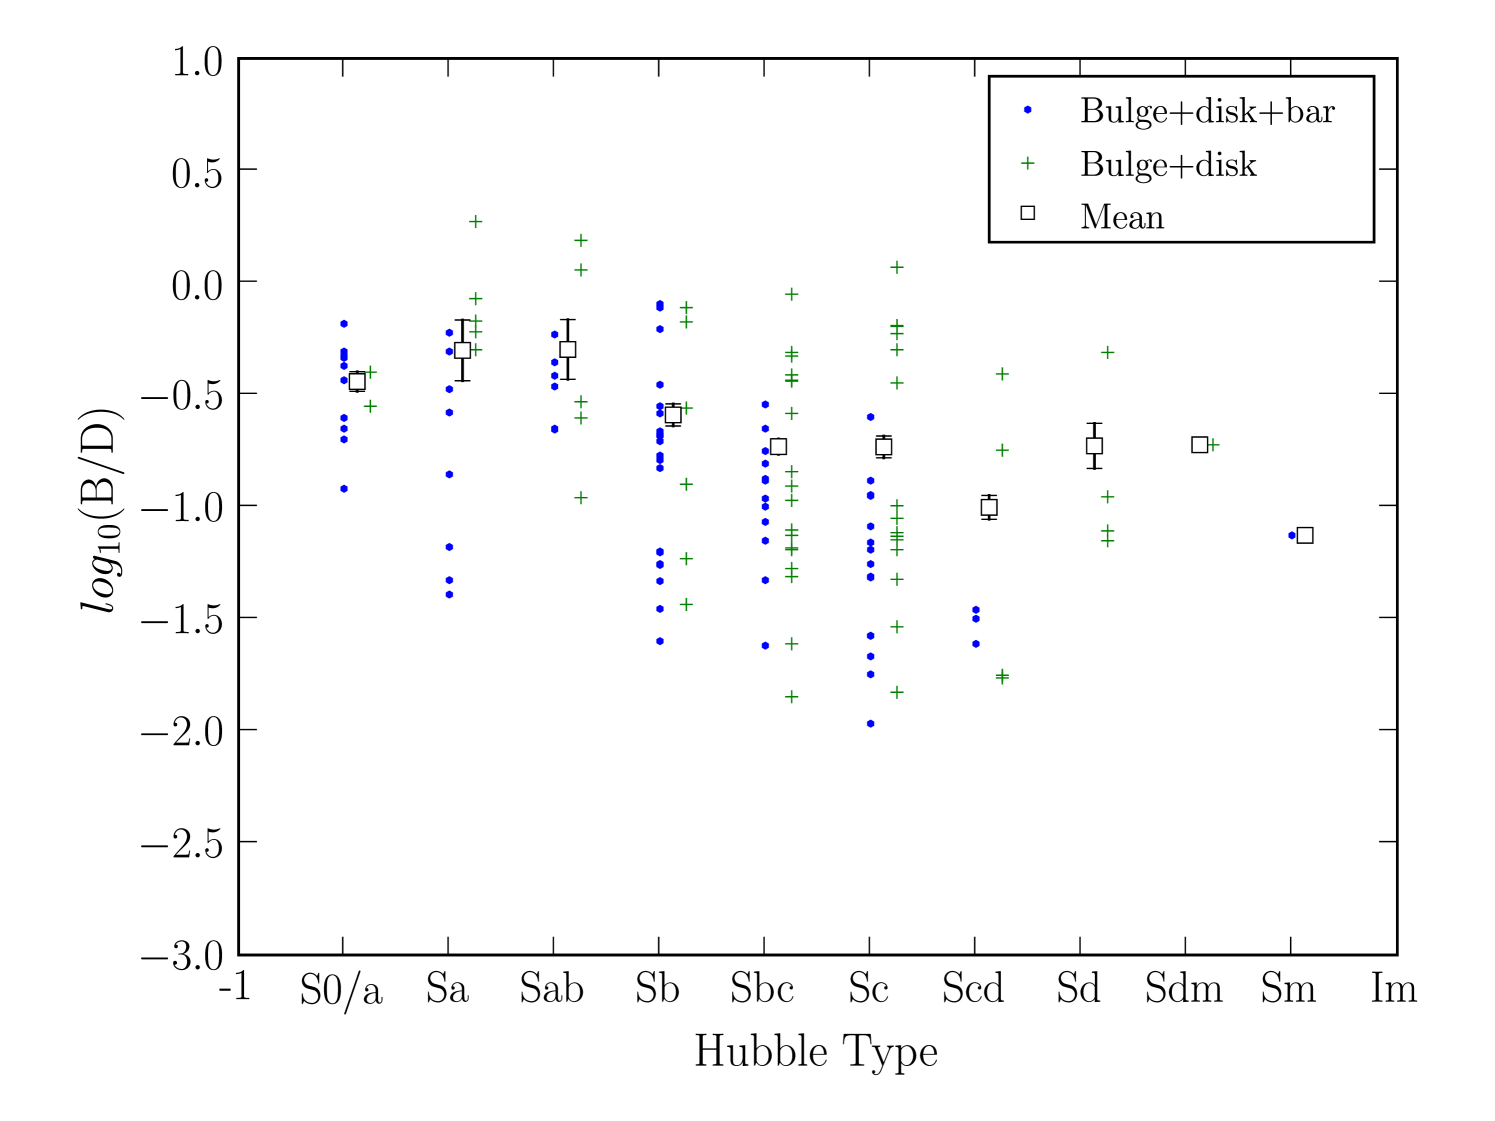
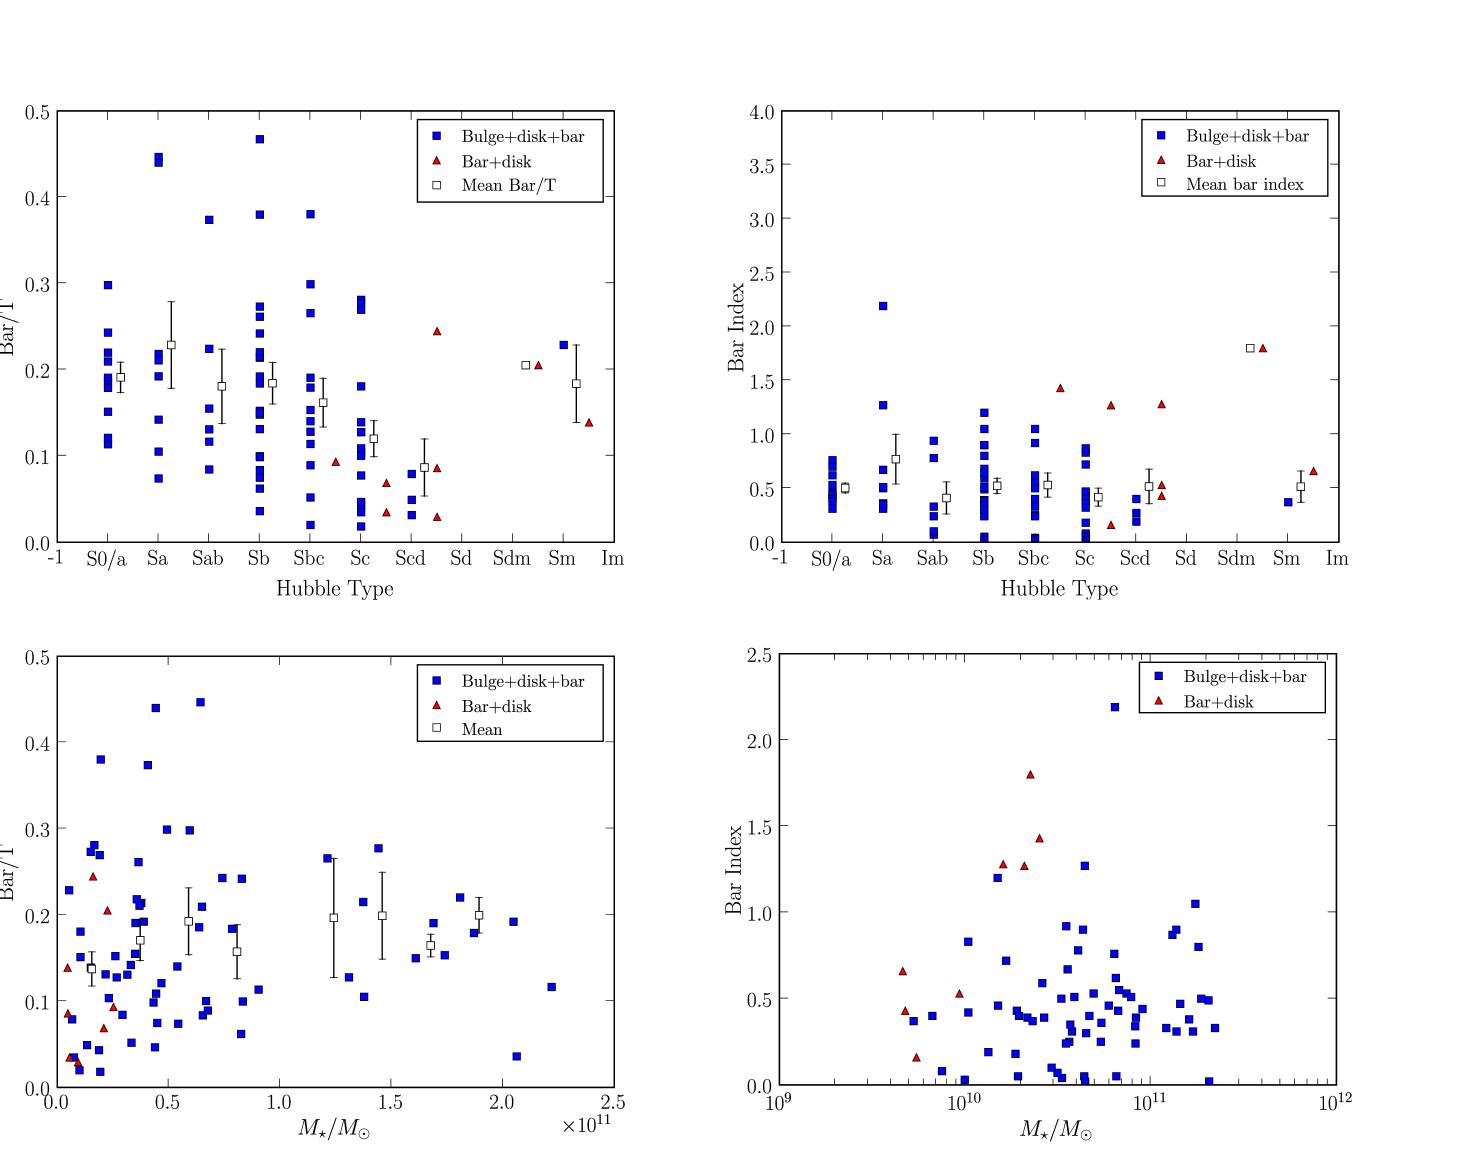
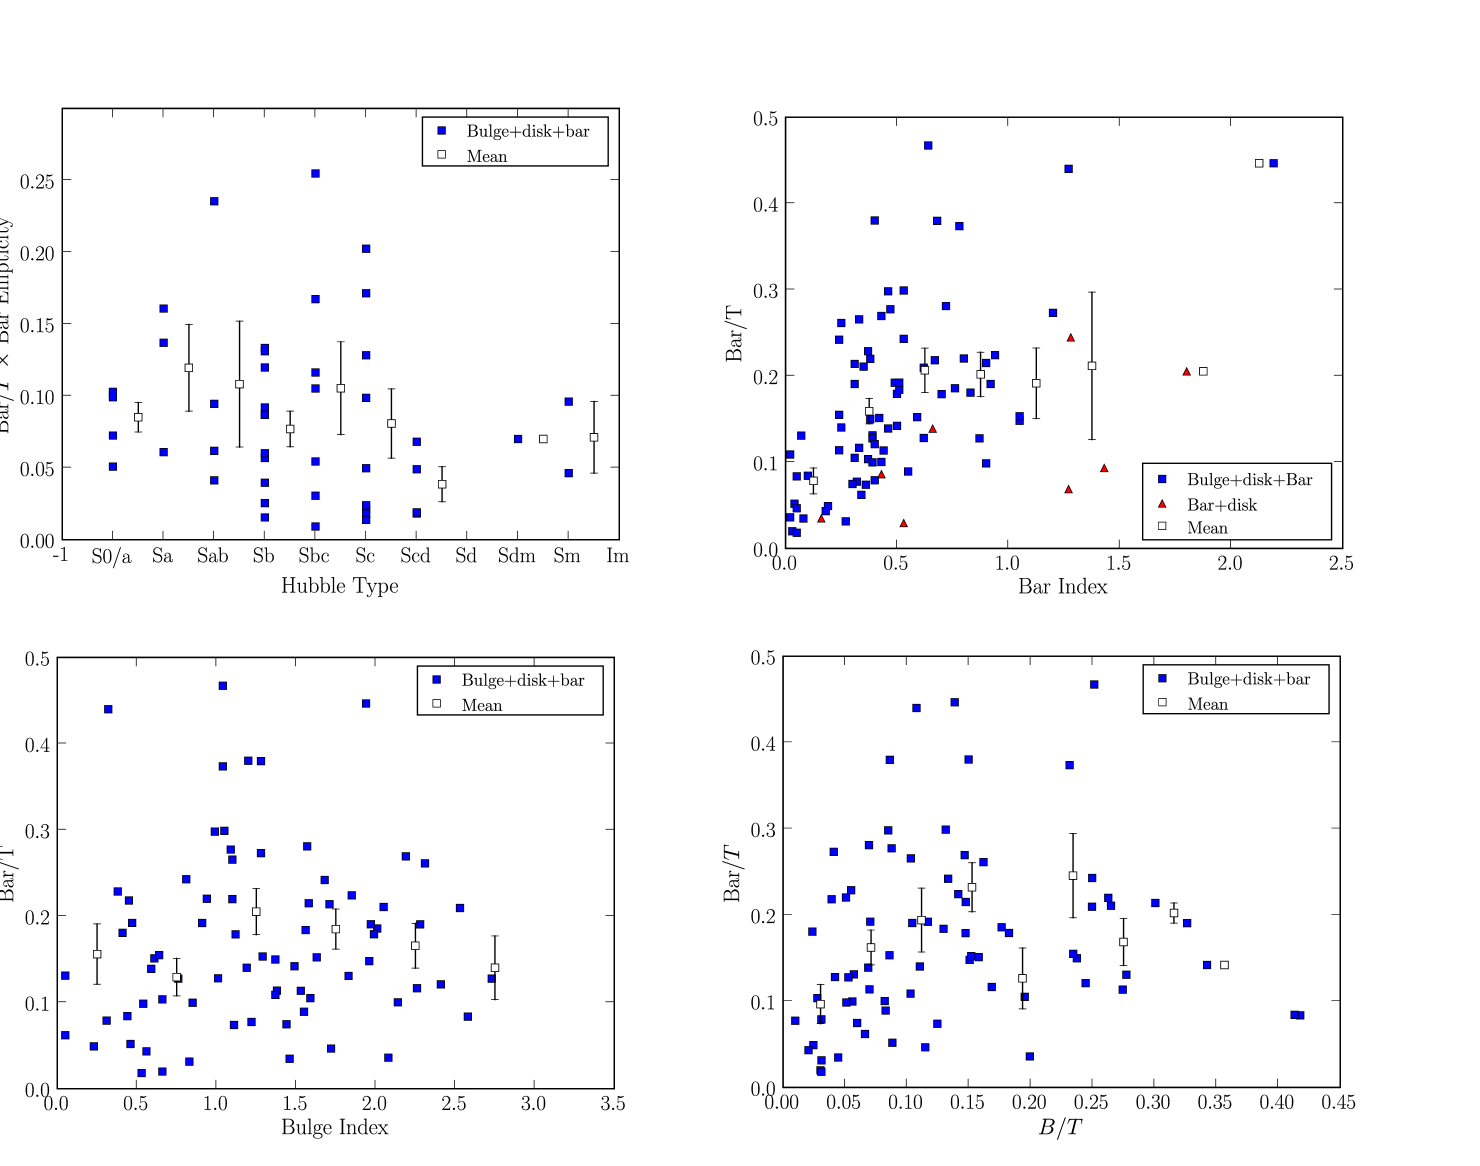
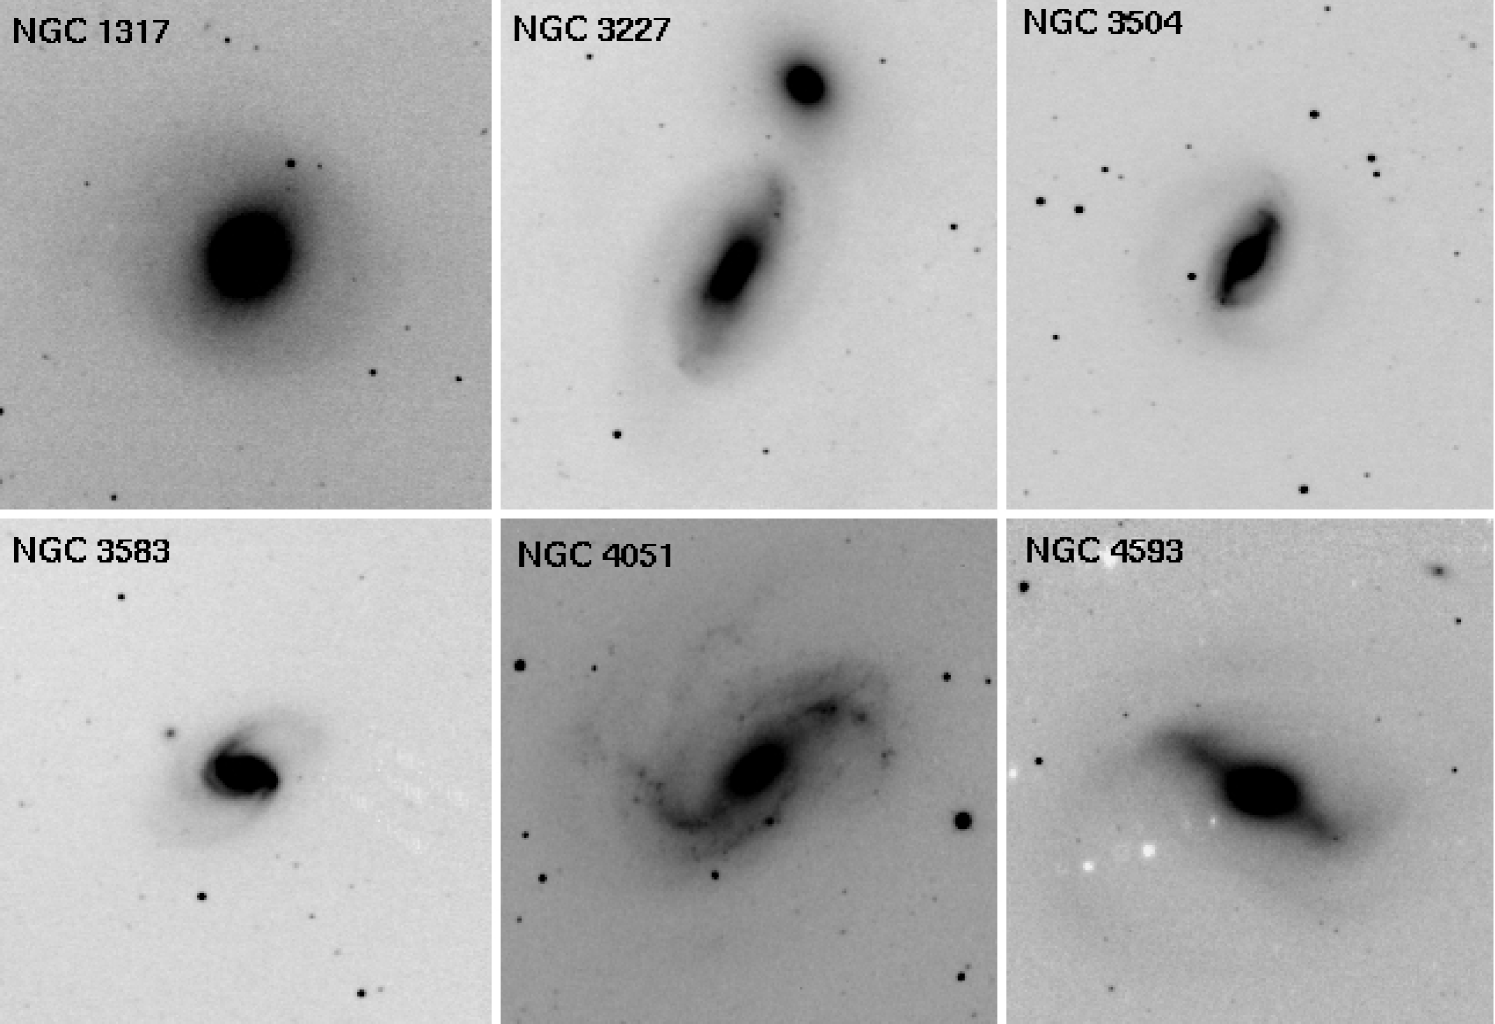

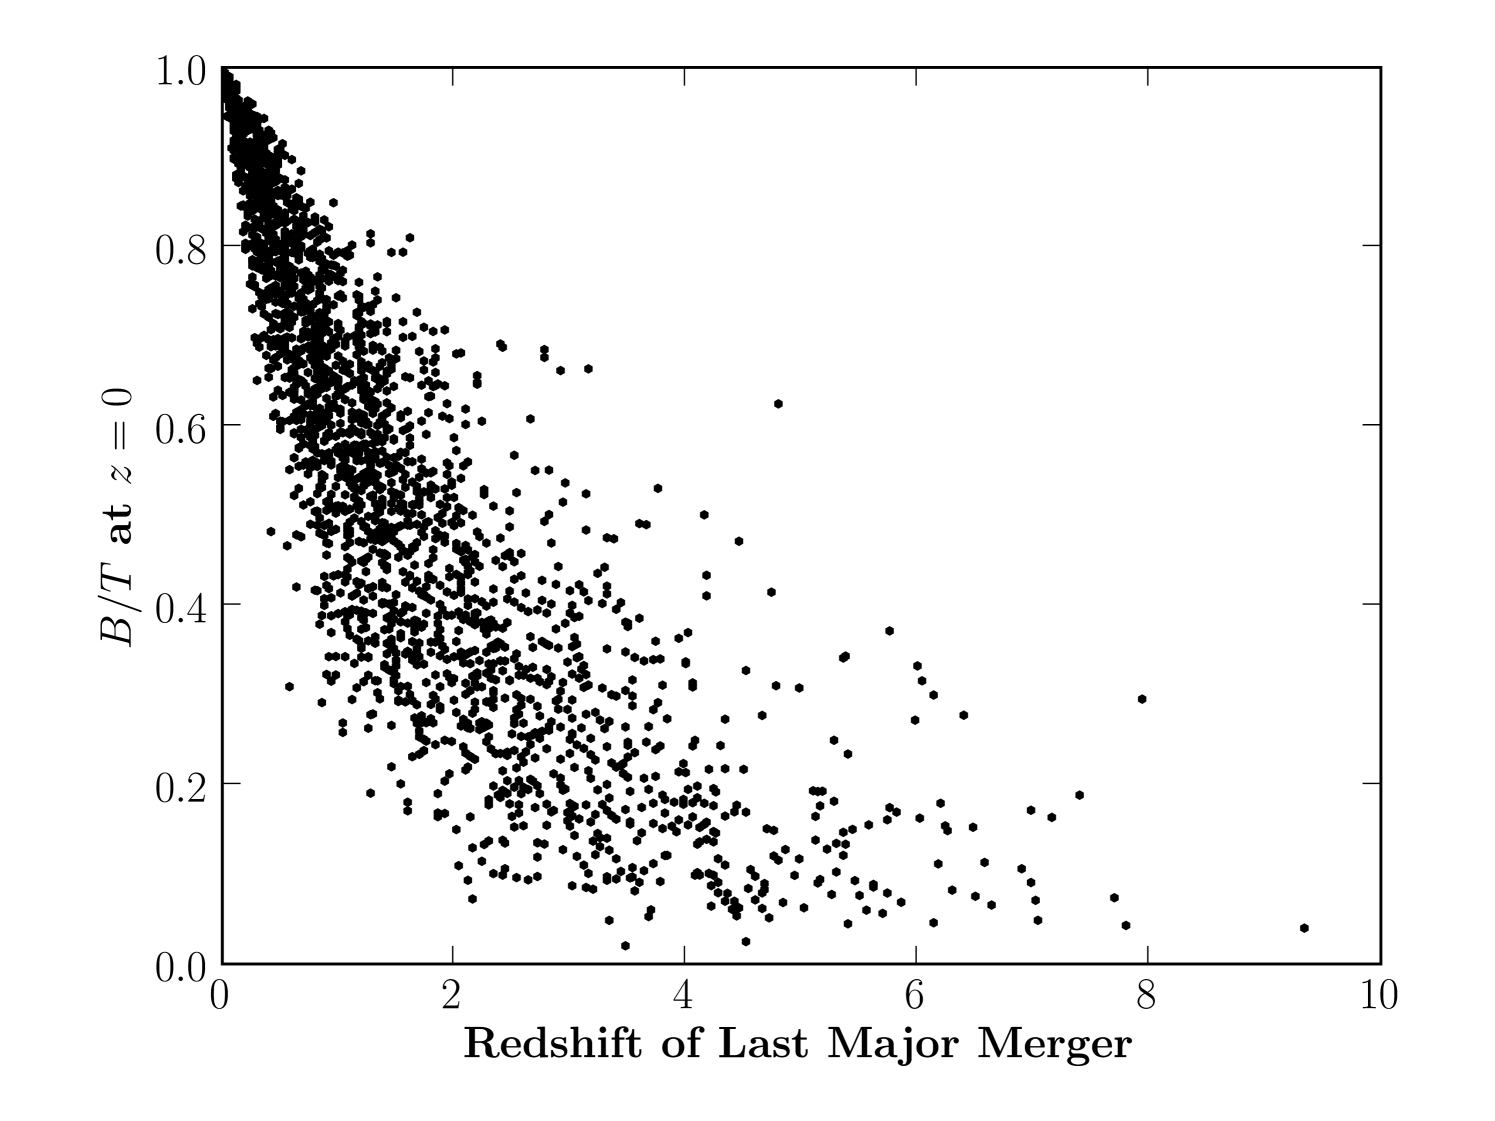
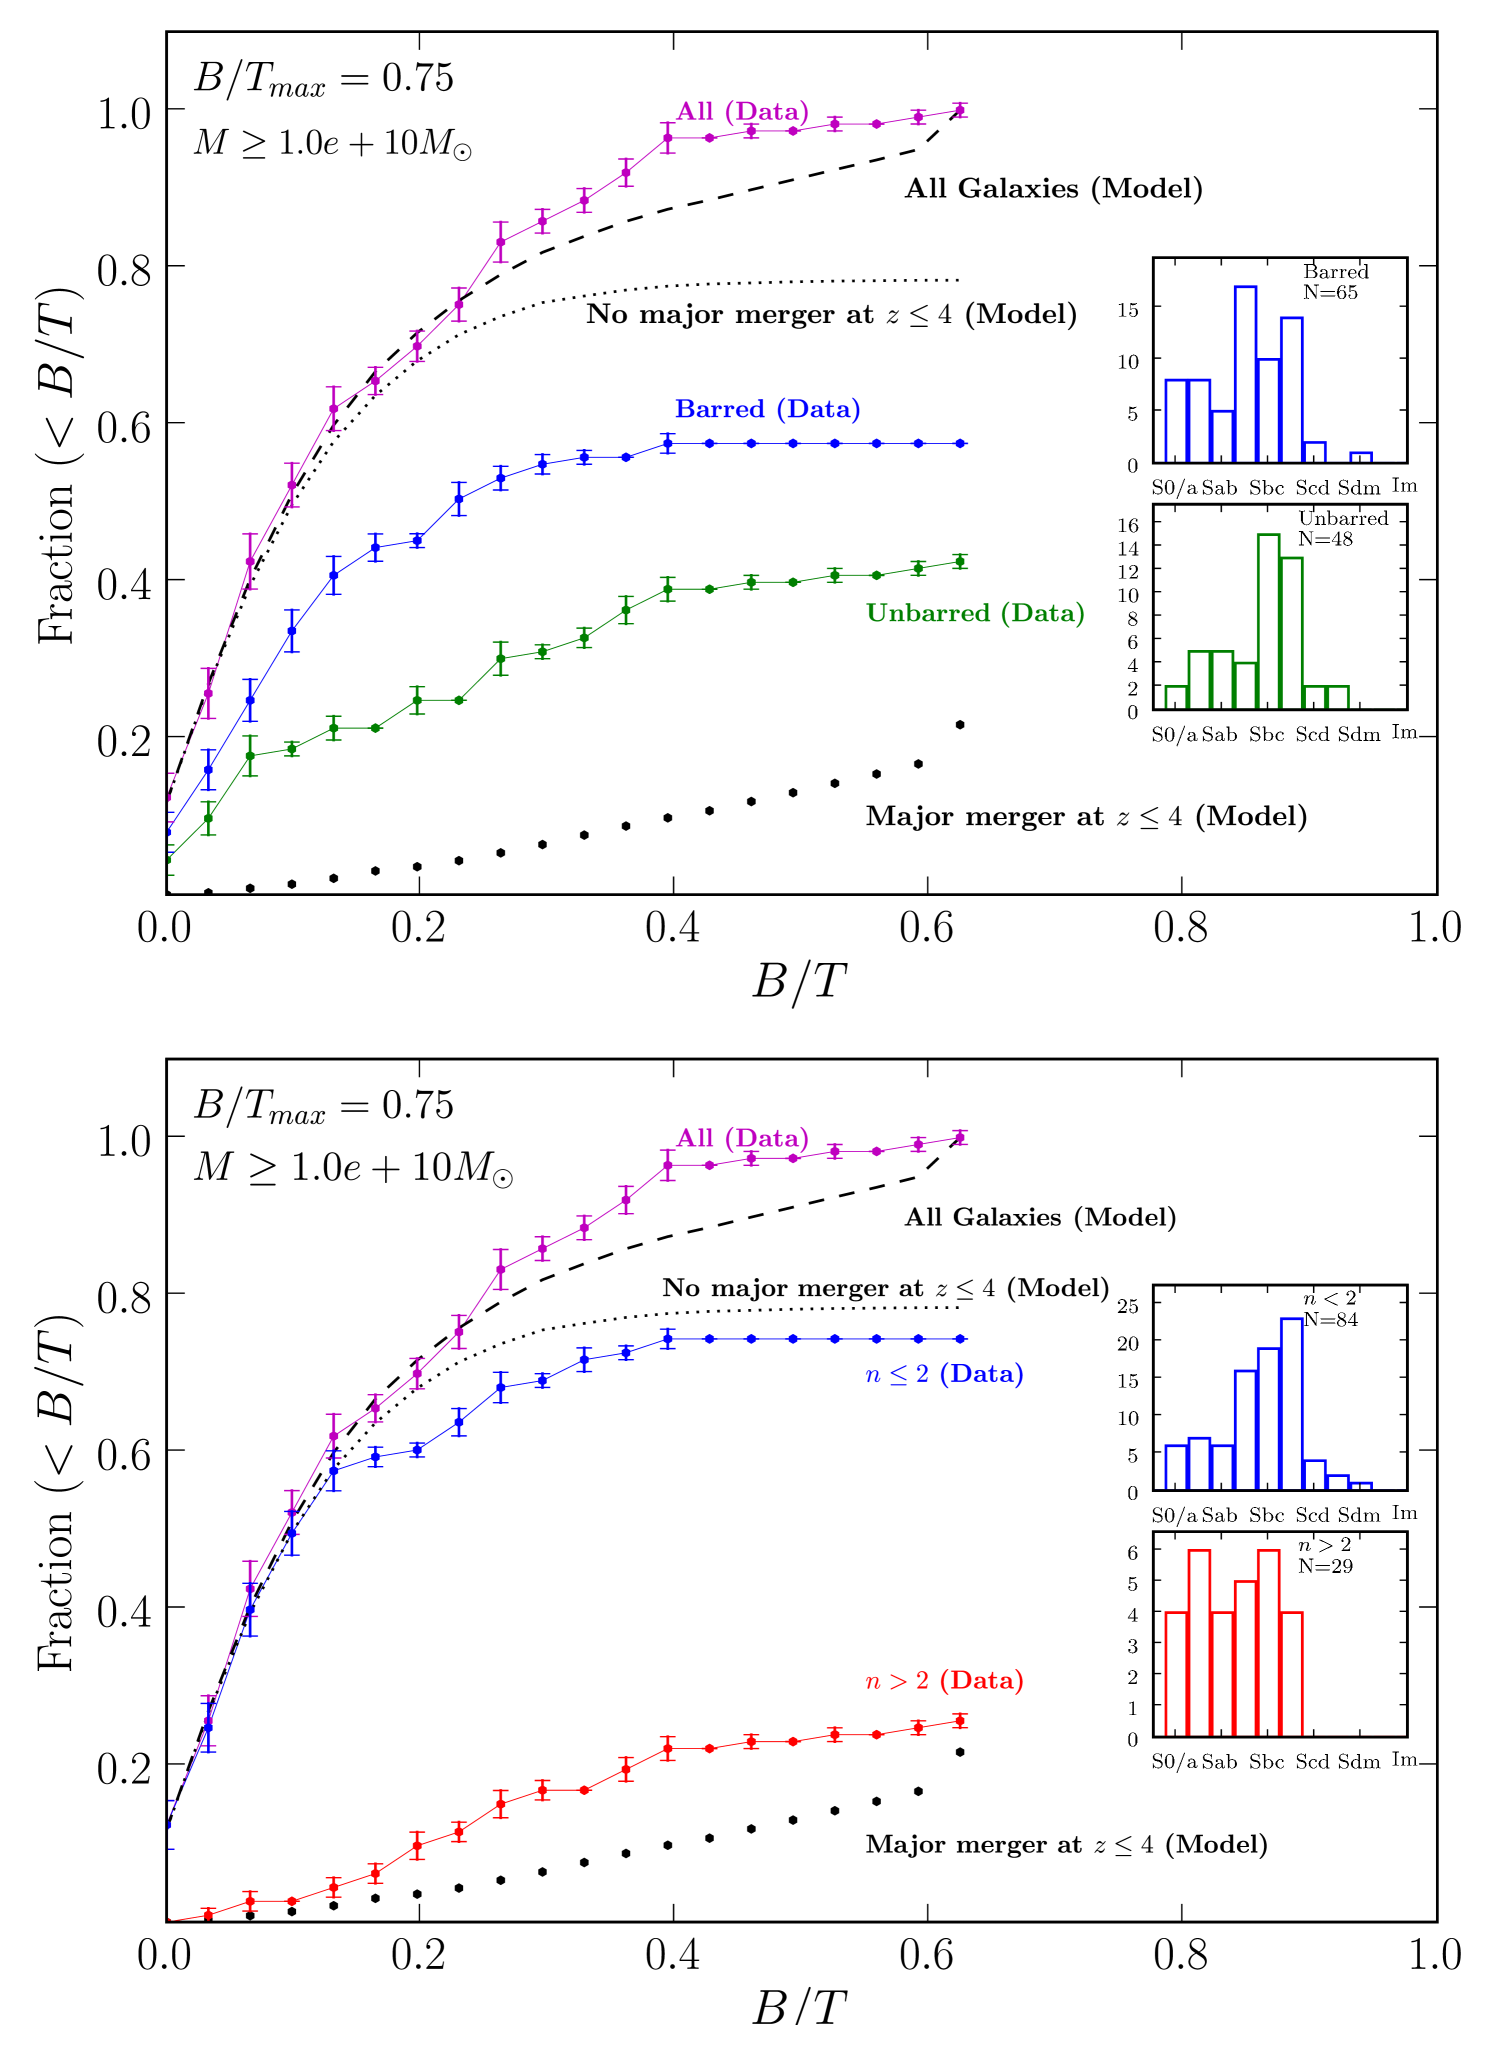
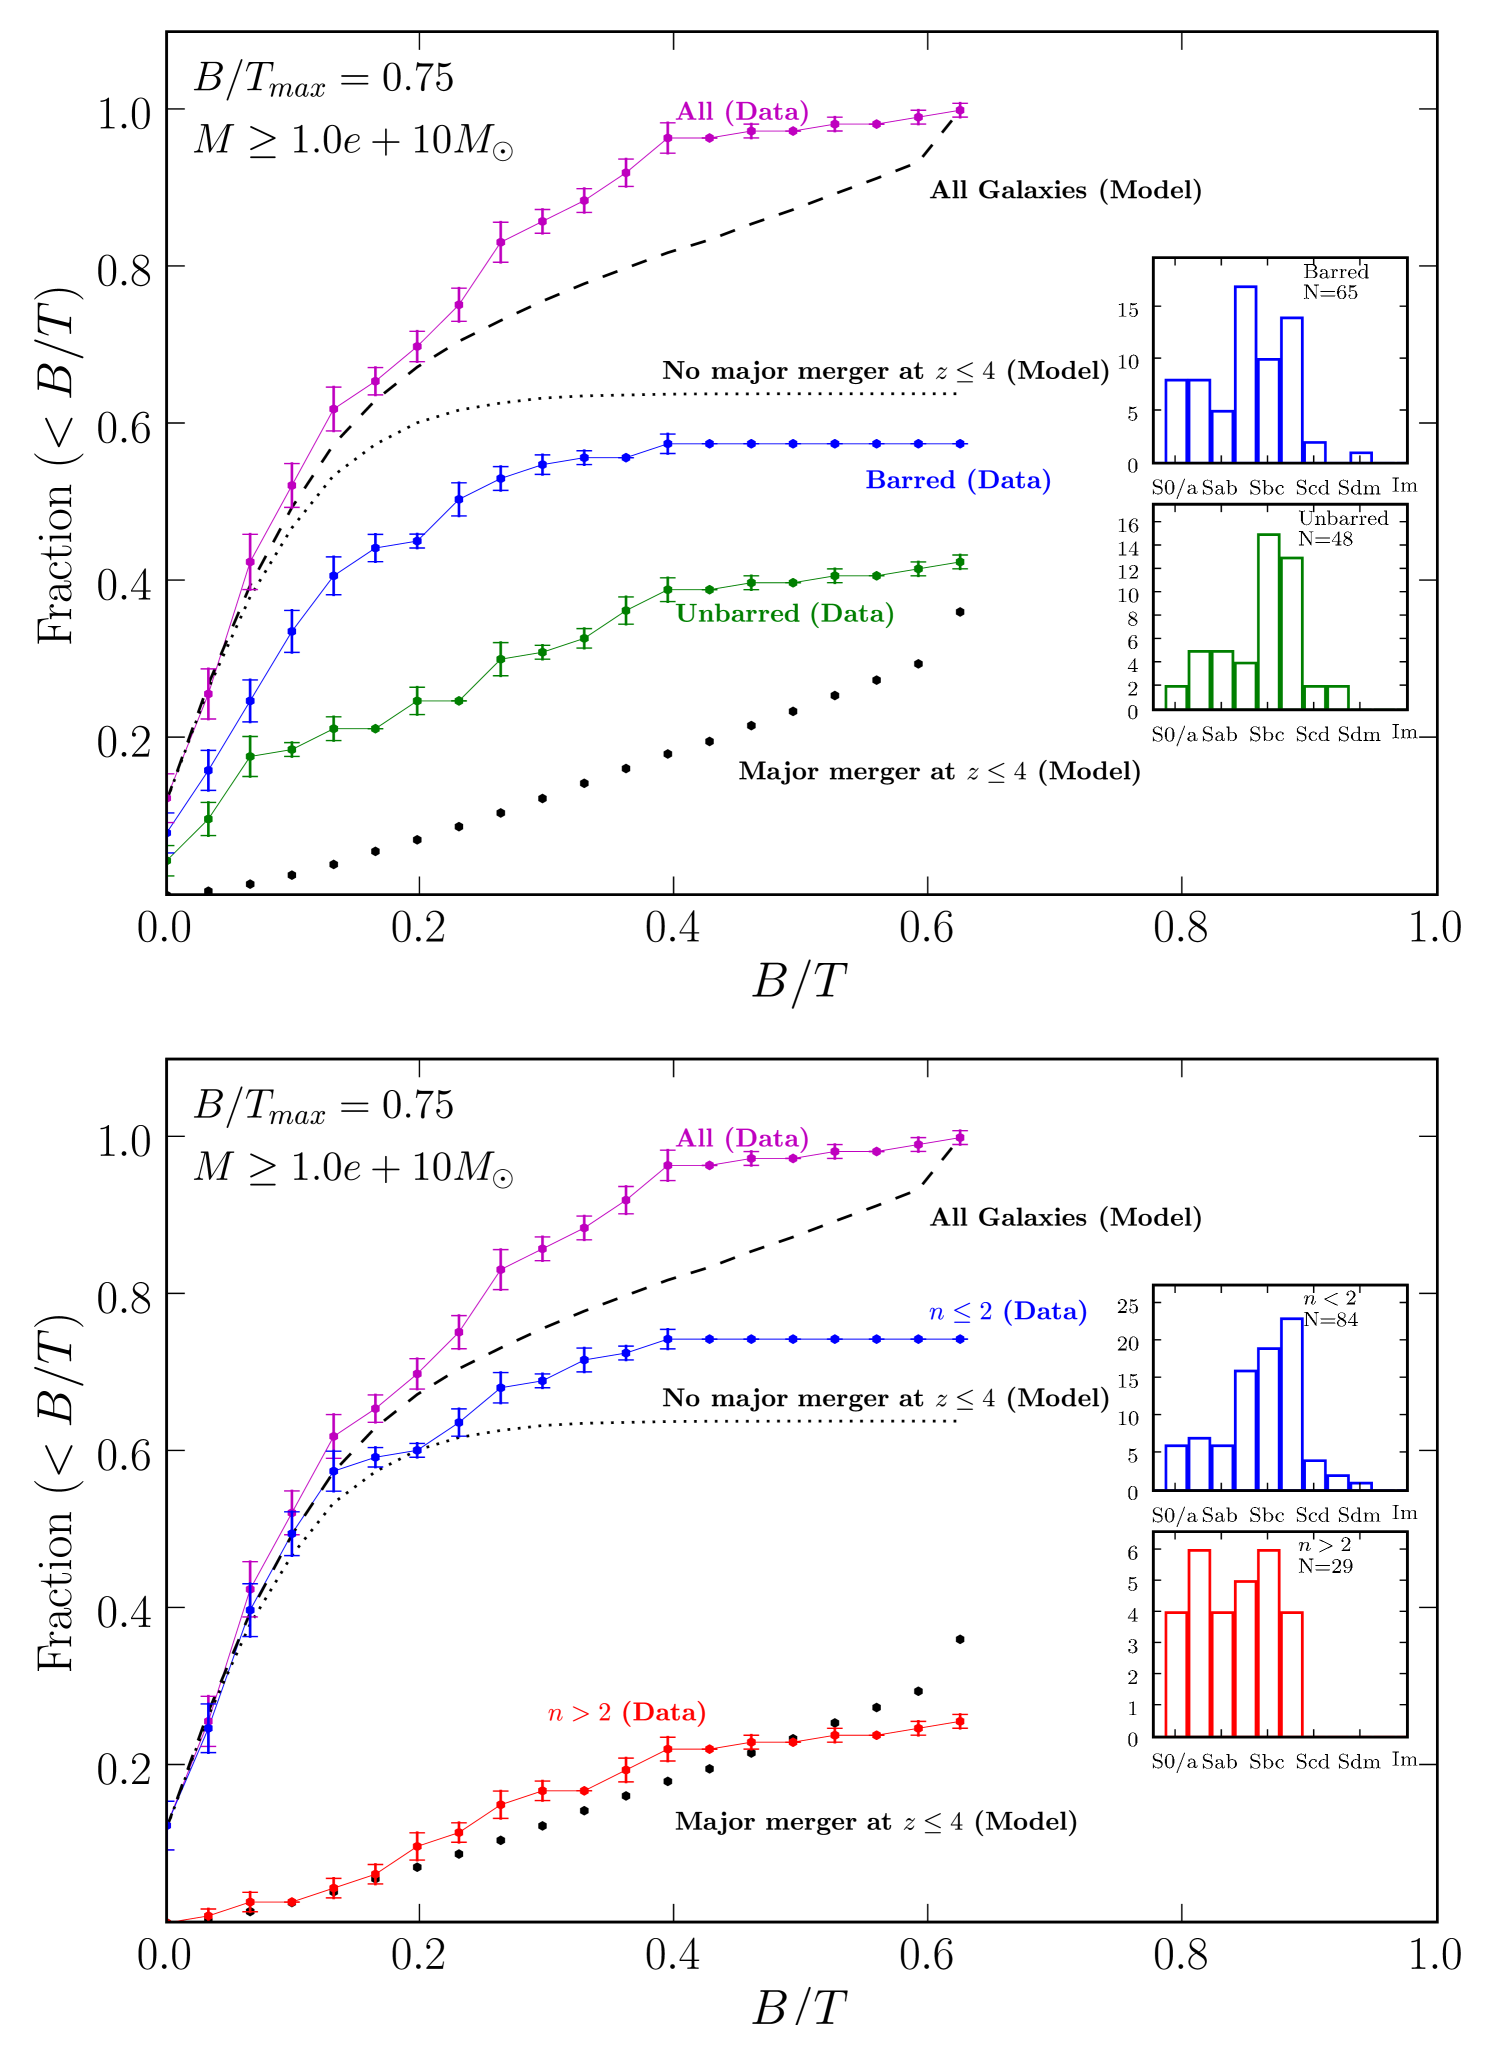
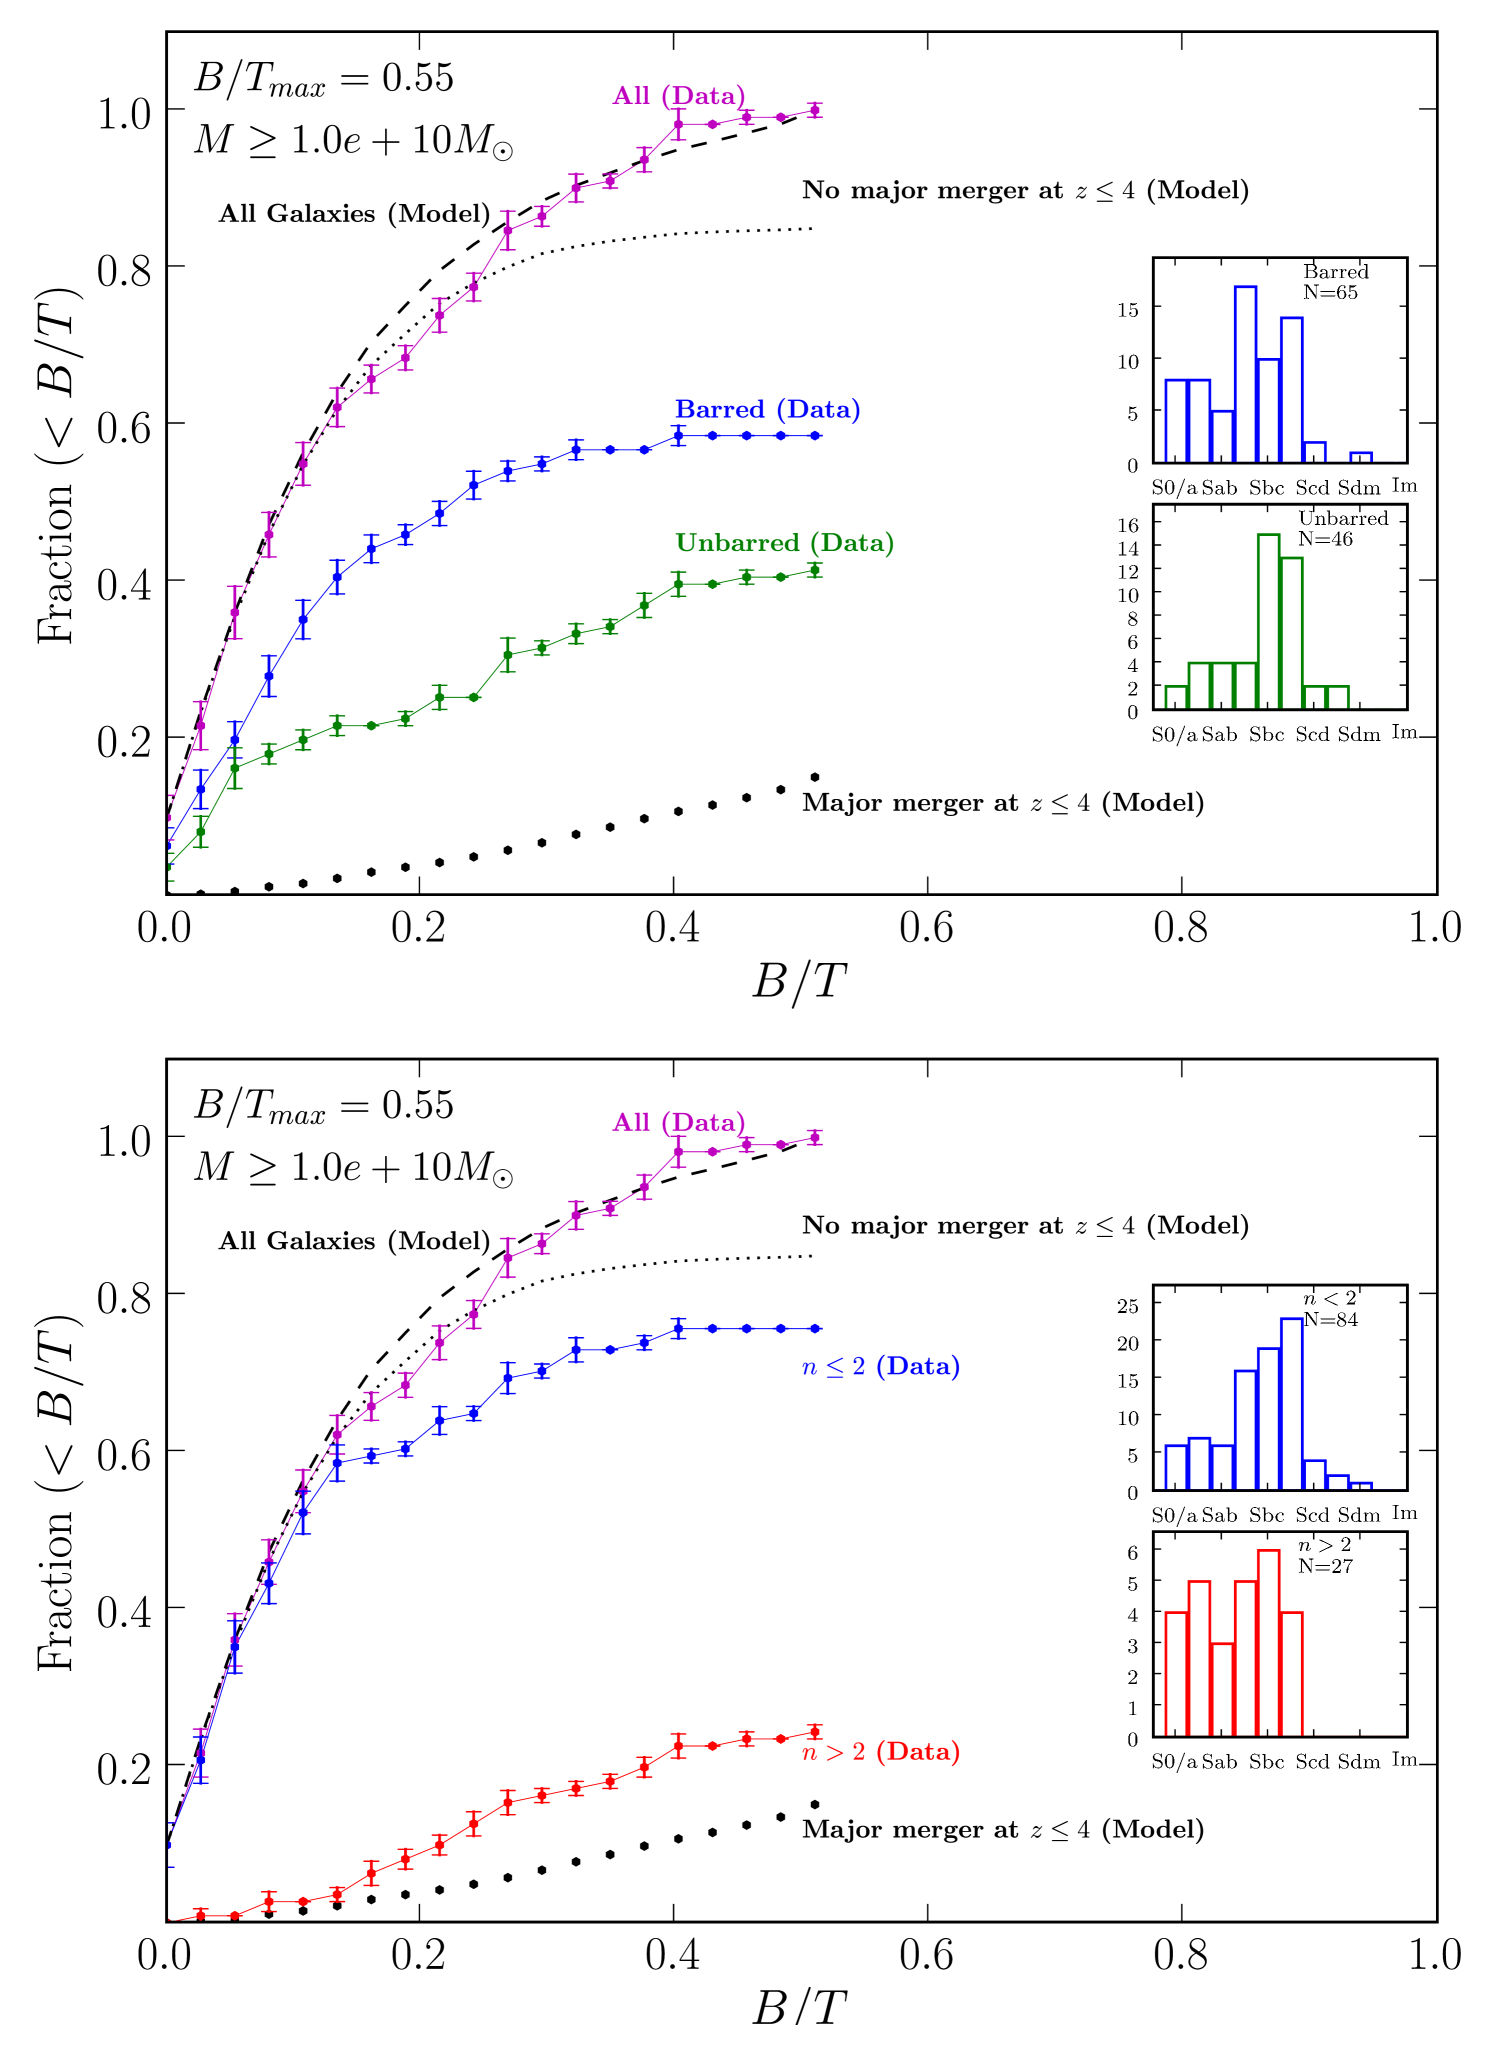
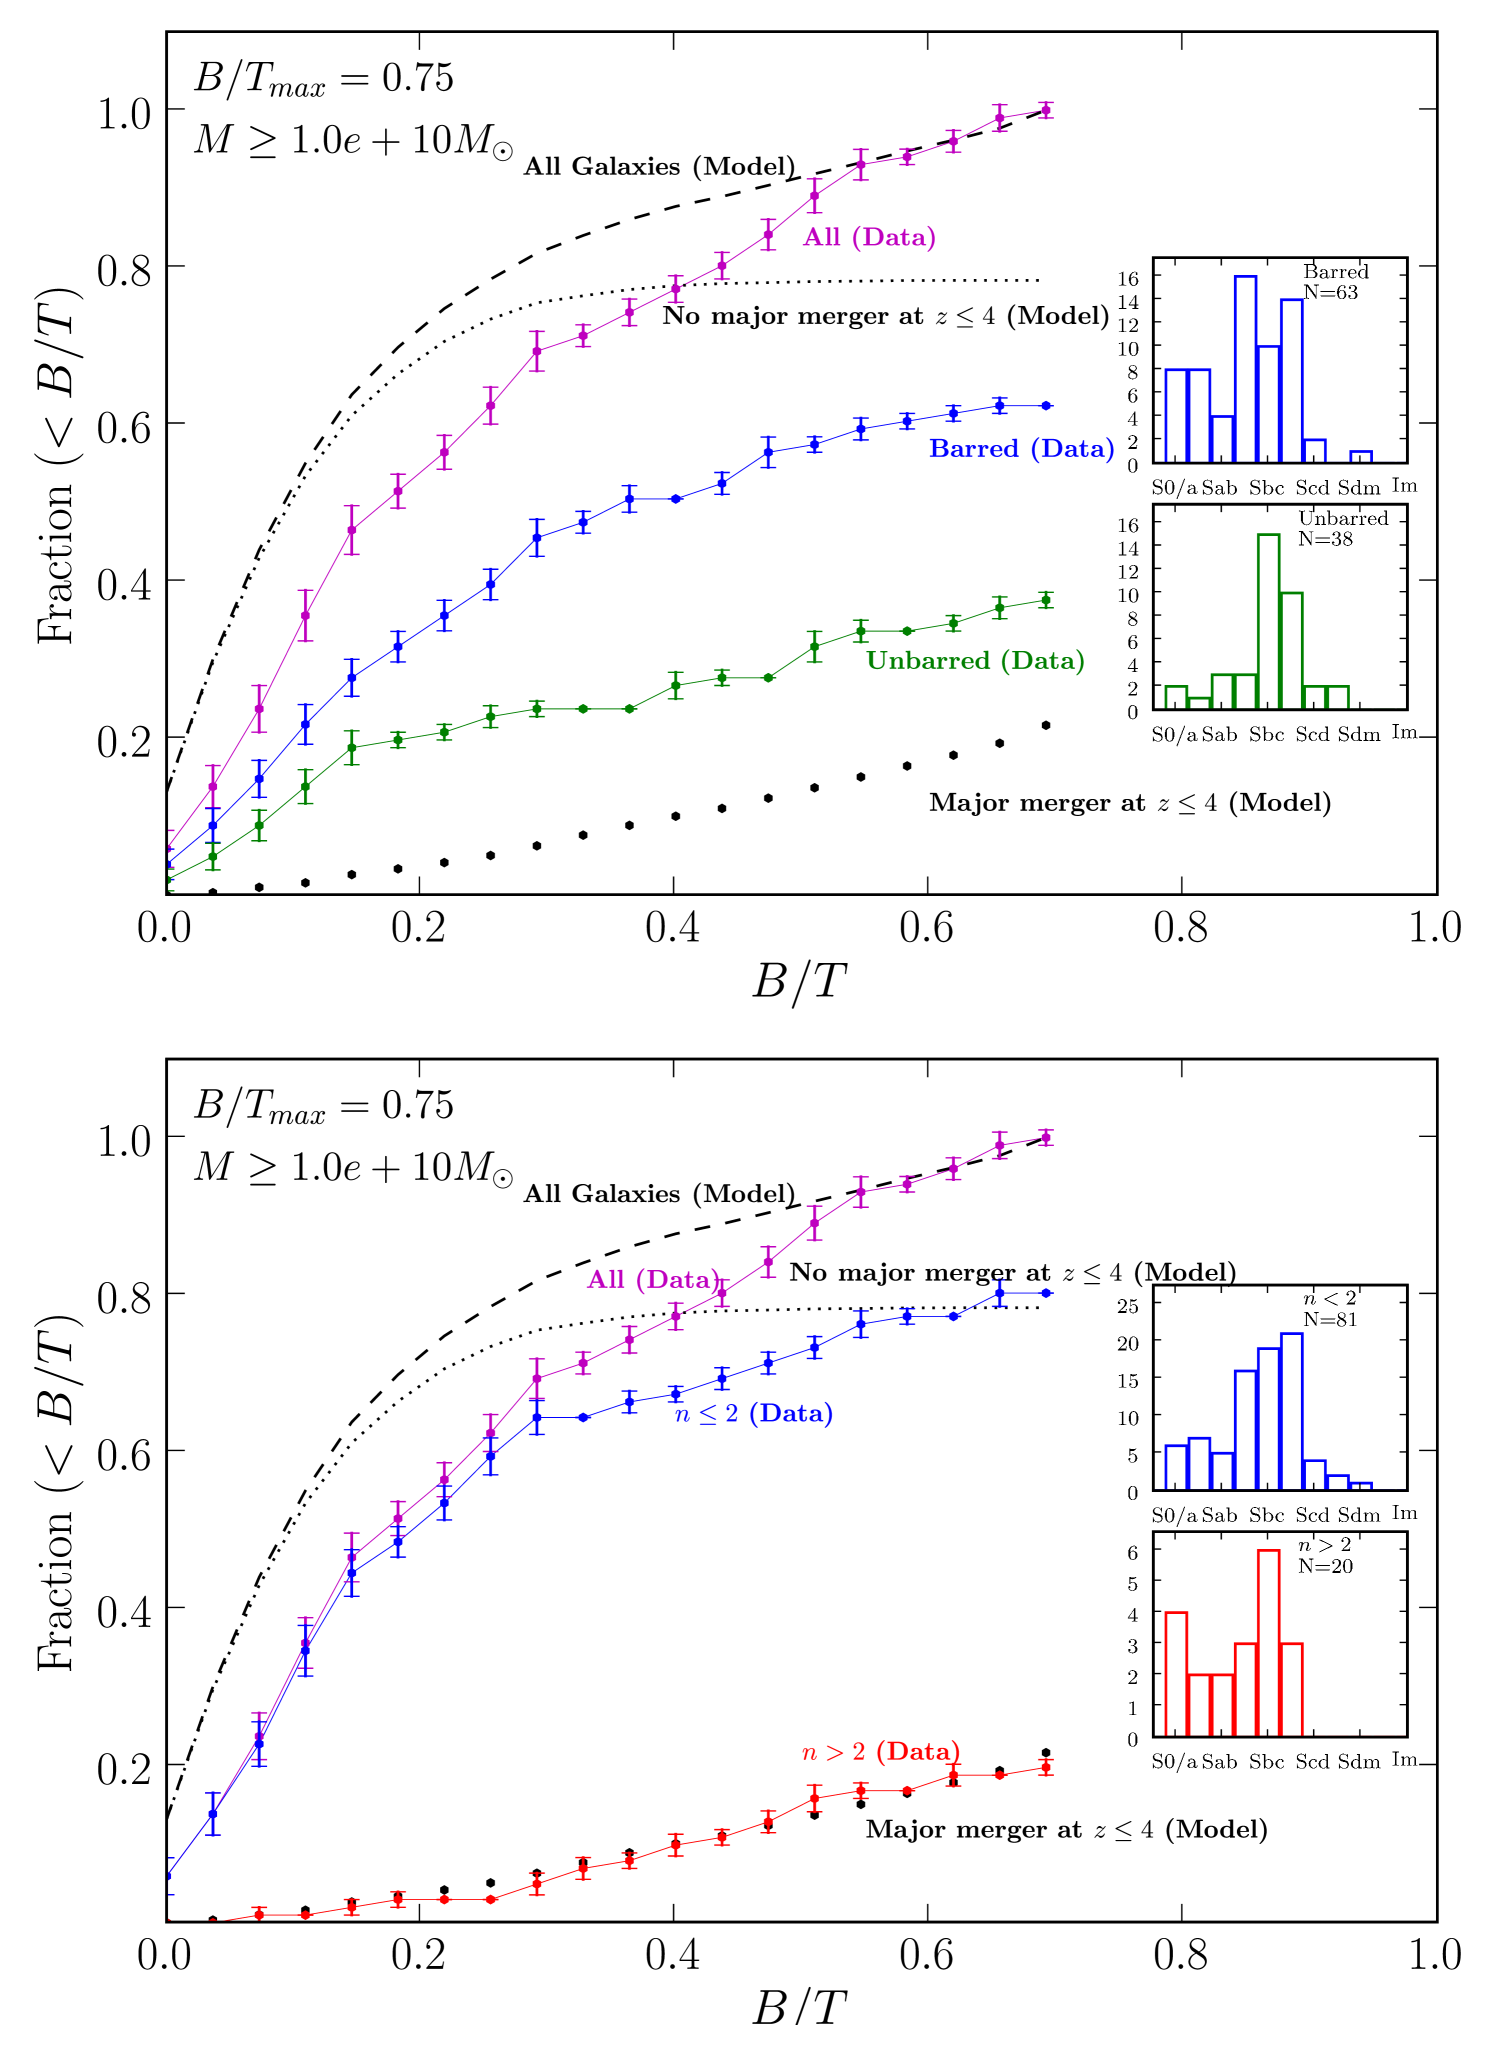
| Galaxy Name | Best Fit | Hubble Type | Bar Type | ||||
|---|---|---|---|---|---|---|---|
| (RC3) | (RC3) | (Mpc) | (mag) | (mag) | () | ||
| (1) | (2) | (3) | (4) | (5) | (6) | (7) | (8) |
| ESO138-10 | PSF+Bulge+Disk | SA(s)cd | A | 15.75 | -20.2 | - | - |
| IC0239 | PSF+Bulge+Disk+Bar | SAB(rs)cd | AB | 15.21 | -19.3 | 0.70 | 1.34e+10 |
| IC4444 | Bulge+Disk | SAB(rs)bc | AB | 28.82 | -20.9 | 0.64 | 4.35e+10 |
| IC5325 | PSF+Bulge+Disk | SAB(rs)bc | AB | 19.39 | -19.6 | 0.56 | 9.78e+09 |
| NGC0150 | PSF+Bulge+Disk+Bar | SB(rs)bc | B | 20.57 | -20.1 | 0.64 | 2.17e+10 |
| NGC0157 | PSF+Bulge+Disk | SAB(rs)bc | AB | 22.39 | -21.4 | 0.59 | 5.81e+10 |
| NGC0210 | Bulge+Disk+Bar | SAB(s)b | AB | 21.75 | -20.4 | 0.71 | 3.77e+10 |
| NGC0278 | PSF+Bulge+Disk | SAB(rs)b | AB | 12.64 | -19.5 | 0.64 | 1.24e+10 |
| NGC0289 | PSF+Bulge+Disk+Bar | SAB(rs)bc | AB | 20.79 | -20.2 | 0.73 | 3.33e+10 |
| NGC0428 | PSF+Bulge+Disk+Bar | SAB(s)m | AB | 15.96 | -19.4 | 0.44 | 5.28e+09 |
| NGC0488 | PSF+Bulge+Disk | SA(r)b | A | 31.39 | -21.8 | 0.87 | 2.44e+11 |
| NGC0578 | PSF+Bulge+Disk+Bar | SAB(rs)c | AB | 20.89 | -20.5 | 0.51 | 1.87e+10 |
| NGC0613 | PSF+Bulge+Disk+Bar | SB(rs)bc | B | 18.75 | -20.8 | 0.68 | 4.92e+10 |
| NGC0685 | Bar+Disk | SAB(r)c | AB | 16.29 | -19.4 | 0.46 | 5.47e+09 |
| NGC0779 | Bulge+Disk+Bar | SAB(r)b | AB | 18.54 | -20.0 | 0.79 | 3.64e+10 |
| NGC0864 | PSF+Bulge+Disk+Bar | SAB(rs)c | AB | 21.43 | -20.6 | 0.55 | 2.31e+10 |
| NGC0908 | PSF+Bulge+Disk | SA(s)c | A | 19.07 | -21.3 | 0.65 | 6.60e+10 |
| NGC1042 | PSF+Bulge+Disk | SAB(rs)cd | AB | 17.89 | -20.2 | 0.54 | 1.63e+10 |
| NGC1073 | PSF+Bulge+Disk+Bar | SB(rs)c | B | 16.29 | -19.9 | 0.50 | 1.04e+10 |
| NGC1084 | PSF+Bulge+Disk | SA(s)c | A | 18.32 | -20.6 | 0.58 | 2.64e+10 |
| NGC1087 | Bar+Disk | SAB(rs)c | AB | 20.36 | -20.6 | 0.52 | 2.09e+10 |
| NGC1187 | PSF+Bulge+Disk+Bar | SB(r)c | B | 17.46 | -20.2 | 0.56 | 1.66e+10 |
| NGC1241 | PSF+Bulge+Disk+Bar | SB(rs)b | B | 28.50 | -21.7 | 0.85 | 2.05e+11 |
| NGC1300 | PSF+Bulge+Disk+Bar | SB(rs)bc | B | 20.14 | -20.9 | 0.68 | 5.39e+10 |
| NGC1302 | PSF+Bulge+Disk+Bar | (R)SB(r)0 | B | 21.43 | -20.2 | 0.89 | 6.37e+10 |
| NGC1309 | PSF+Bulge+Disk | SA(s)bc | A | 27.86 | -20.5 | 0.44 | 1.46e+10 |
| NGC1317 | Bulge+Disk+Bar | SAB(r)a | AB | 18.11 | -20.2 | 0.89 | 6.42e+10 |
| NGC1350 | PSF+Bulge+Disk+Bar | (R’)SB(r)ab | B | 18.11 | -21.1 | 0.87 | 1.38e+11 |
| NGC1371 | PSF+Bulge+Disk+Bar | SAB(rs)a | AB | 18.32 | -20.0 | 0.90 | 5.43e+10 |
| NGC1385 | PSF+Bar+Disk | SB(s)cd | B | 18.75 | -20.3 | 0.51 | 1.61e+10 |
| NGC1511 | Bulge+Disk | SAa;pec | A | 16.18 | -19.7 | 0.57 | 1.15e+10 |
| NGC1559 | PSF+Bar+Disk | SB(s)cd | B | 15.32 | -20.4 | 0.35 | 9.33e+09 |
| NGC1703 | PSF+Bulge+Disk | SB(r)b | B | 18.64 | -19.4 | 0.56 | 8.43e+09 |
| NGC1792 | PSF+Bulge+Disk | SA(rs)bc | A | 14.57 | -20.5 | 0.68 | 3.71e+10 |
| NGC1808 | PSF+Bulge+Disk+Bar | (R)SAB(s)a | AB | 11.57 | -19.9 | 0.81 | 3.57e+10 |
| NGC1964 | PSF+Bulge+Disk+Bar | SAB(s)b | AB | 21.43 | -20.8 | 0.77 | 6.54e+10 |
| NGC2090 | Bulge+Disk+Bar | SA(rs)c | A | 10.93 | -19.3 | 0.79 | 1.90e+10 |
| NGC2139 | Bulge+Disk | SAB(rs)cd | AB | 24.00 | -20.3 | 0.36 | 8.35e+09 |
| NGC2196 | PSF+Bulge+Disk | (R’)SA(s)a | A | 30.86 | -21.0 | 0.81 | 9.22e+10 |
| NGC2442 | PSF+Bulge+Disk+Bar | SAB(s)bc;pec | AB | 18.32 | -20.8 | 0.82 | 8.28e+10 |
| NGC2559 | Bulge+Disk+Bar | SB(s)bc;pec | B | 21.43 | -21.0 | - | - |
| NGC2566 | Bulge+Disk | (R’)SB(rs)ab;pec | B | 22.61 | -20.7 | 0.81 | 6.98e+10 |
| NGC2775 | PSF+Bulge+Disk | SA(r)ab | A | 18.21 | -20.6 | 0.90 | 9.46e+10 |
| NGC3059 | Bar+Disk | SB(rs)c | B | 15.86 | -20.1 | 0.68 | 2.52e+10 |
| NGC3166 | Bulge+Disk+Bar | SAB(rs)0 | AB | 23.57 | -20.2 | 0.93 | 7.41e+10 |
| NGC3169 | PSF+Bulge+Disk | SA(s)a;pec | A | 21.11 | -20.3 | 0.85 | 6.09e+10 |
| NGC3223 | PSF+Bulge+Disk | SA(s)b | A | 40.82 | -21.9 | 0.82 | 2.36e+11 |
| NGC3227 | PSF+Bulge+Disk+Bar | SAB(s)a;pec | AB | 22.07 | -20.1 | 0.82 | 4.42e+10 |
| NGC3261 | PSF+Bulge+Disk+Bar | SB(rs)b | B | 35.79 | -21.3 | - | - |
| NGC3275 | PSF+Bulge+Disk+Bar | SB(r)ab | B | 45.43 | -21.2 | - | - |
| NGC3319 | PSF+Bar+Disk | SB(rs)cd | B | 12.32 | -19.4 | 0.41 | 4.76e+09 |
| NGC3338 | PSF+Bulge+Disk+Bar | SA(s)c | A | 24.43 | -20.6 | 0.59 | 2.67e+10 |
| NGC3423 | Bulge+Disk | SA(s)cd | A | 11.68 | -19.5 | 0.45 | 5.89e+09 |
| NGC3504 | Bulge+Disk+Bar | (R)SAB(s)ab | AB | 21.43 | -20.5 | 0.72 | 4.06e+10 |
| NGC3513 | Bulge+Disk+Bar | SB(rs)c | B | 18.21 | -19.9 | 0.43 | 7.52e+09 |
| NGC3583 | Bulge+Disk+Bar | SB(s)b | B | 36.43 | -20.8 | - | - |
| NGC3596 | PSF+Bulge+Disk | SAB(rs)c | AB | 24.64 | -19.6 | - | - |
| NGC3646 | PSF+Bulge+Disk | Ring | - | 59.79 | -22.9 | 0.65 | 2.82e+11 |
| NGC3675 | PSF+Bulge+Disk | SA(s)b | A | 13.71 | -20.2 | - | - |
| NGC3684 | PSF+Bulge+Disk | SA(rs)bc | A | 25.07 | -19.4 | 0.62 | 1.00e+10 |
| NGC3686 | PSF+Bulge+Disk+Bar | SB(s)bc | B | 25.18 | -19.6 | 0.57 | 9.97e+09 |
| NGC3705 | PSF+Bulge+Disk+Bar | SAB(r)ab | AB | 18.21 | -19.9 | 0.79 | 3.15e+10 |
| NGC3726 | PSF+Bulge+Disk+Bar | SAB(r)c | AB | 18.21 | -20.6 | 0.49 | 1.93e+10 |
| NGC3810 | PSF+Bulge+Disk | SA(rs)c | A | 18.11 | -20.1 | 0.58 | 1.72e+10 |
| NGC3885 | PSF+Bulge+Disk | SA(s)0 | A | 29.79 | -19.6 | 0.95 | 4.62e+10 |
| NGC3887 | PSF+Bulge+Disk+Bar | SB(r)bc | B | 20.68 | -20.4 | - | - |
| NGC3893 | PSF+Bulge+Disk | SAB(rs)c | AB | 18.21 | -19.9 | - | - |
| NGC3938 | PSF+Bulge+Disk | SA(s)c | A | 18.21 | -20.0 | 0.52 | 1.23e+10 |
| NGC3949 | PSF+Bulge+Disk | SA(s)bc | AB | 18.21 | -19.9 | 0.45 | 8.66e+09 |
| NGC4027 | Bar+Disk | SB(s)dm | B | 27.43 | -20.6 | 0.54 | 2.25e+10 |
| NGC4030 | PSF+Bulge+Disk | SA(s)bc | A | 27.75 | -20.8 | - | - |
| NGC4051 | PSF+Bulge+Disk+Bar | SAB(rs)bc | AB | 18.21 | -20.0 | 0.65 | 1.95e+10 |
| NGC4062 | PSF+Bulge+Disk | SA(s)c | A | 10.39 | -19.5 | 0.76 | 2.07e+10 |
| NGC4123 | PSF+Bulge+Disk+Bar | SB(r)c | B | 17.68 | -19.8 | 0.61 | 1.50e+10 |
| NGC4145 | PSF+Bulge+Disk | SAB(rs)d | AB | 22.18 | -20.1 | 0.51 | 1.34e+10 |
| NGC4151 | PSF+Bulge+Disk+Bar | (R’)SAB(rs)ab | AB | 21.75 | -20.1 | 0.73 | 2.93e+10 |
| NGC4212 | PSF+Bulge+Disk | SAc | A | 18.00 | -20.4 | 0.67 | 3.28e+10 |
| NGC4254 | PSF+Bulge+Disk | SA(s)c | A | 18.00 | -22.6 | 0.57 | 1.61e+11 |
| NGC4293 | PSF+Bulge+Disk+Bar | (R)SB(s)0 | B | 18.21 | -20.1 | 0.90 | 5.94e+10 |
| NGC4303 | Bulge+Disk+Bar | SAB(rs)bc | AB | 16.29 | -21.8 | 0.53 | 6.76e+10 |
| NGC4314 | PSF+Bulge+Disk+Bar | SB(rs)a | B | 10.39 | -19.8 | 0.85 | 3.69e+10 |
| NGC4394 | PSF+Bulge+Disk+Bar | (R)SB(r)b | B | 18.00 | -19.4 | 0.85 | 2.61e+10 |
| NGC4414 | PSF+Bulge+Disk+Bar | SA(rs)c | A | 10.39 | -20.0 | 0.84 | 4.38e+10 |
| NGC4450 | PSF+Bulge+Disk+Bar | SA(s)ab | A | 18.00 | -21.9 | 0.82 | 2.22e+11 |
| NGC4487 | PSF+Bulge+Disk+Bar | SAB(rs)cd | AB | 21.32 | -19.6 | - | - |
| NGC4490 | PSF+Bulge+Disk | SB(s)d;pec | B | 8.36 | -21.7 | 0.43 | 4.10e+10 |
| NGC4527 | Bulge+Disk+Bar | SAB(s)bc | AB | 14.46 | -21.5 | 0.86 | 1.87e+11 |
| NGC4548 | PSF+Bulge+Disk+Bar | SB(rs)b | B | 18.00 | -20.8 | 0.81 | 7.85e+10 |
| NGC4593 | PSF+Bulge+Disk+Bar | (R)SB(rs)b | B | 42.32 | -20.8 | - | - |
| NGC4618 | PSF+Bar+Disk | SB(rs)m | B | 7.82 | -19.3 | 0.44 | 4.62e+09 |
| NGC4643 | Bulge+Disk+Bar | SB(rs)0 | B | 27.54 | -19.9 | 0.96 | 6.49e+10 |
| NGC4647 | Bulge+Disk | SAB(rs)c | AB | 18.00 | -19.8 | 0.65 | 1.67e+10 |
| NGC4651 | PSF+Bulge+Disk | SA(rs)c | A | 18.00 | -19.6 | 0.57 | 1.05e+10 |
| NGC4654 | Bulge+Disk | SAB(rs)cd | AB | 18.00 | -20.6 | 0.60 | 2.99e+10 |
| NGC4665 | PSF+Bulge+Disk+Bar | SB(s)0 | B | 19.18 | -19.3 | - | - |
| NGC4689 | PSF+Bulge+Disk | SA(rs)bc | A | 18.00 | -20.7 | 0.65 | 3.84e+10 |
| NGC4691 | PSF+Bulge+Disk+Bar | (R)SB(s)0;pec | B | 24.11 | -19.6 | 0.58 | 1.04e+10 |
| NGC4698 | PSF+Bulge+Disk | SA(s)ab | A | 18.00 | -19.9 | 0.91 | 5.15e+10 |
| NGC4699 | Bulge+Disk+Bar | SAB(rs)b | AB | 27.54 | -21.5 | 0.89 | 2.06e+11 |
| NGC4772 | PSF+Bulge+Disk+Bar | SA(s)a | A | 17.46 | -19.4 | 0.92 | 3.30e+10 |
| NGC4775 | PSF+Bulge+Disk | SA(s)d | A | 28.50 | -20.4 | - | - |
| NGC4781 | PSF+Bulge+Disk | SB(rs)d | B | 24.11 | -20.8 | - | - |
| NGC4818 | PSF+Bulge+Disk+Bar | SAB(rs)ab;pec | AB | 23.04 | -19.7 | 0.89 | 3.88e+10 |
| NGC4856 | PSF+Bulge+Disk+Bar | SB(s)0 | B | 22.61 | -20.2 | 0.99 | 9.04e+10 |
| NGC4902 | PSF+Bulge+Disk+Bar | SB(r)b | B | 42.00 | -21.4 | 0.69 | 8.33e+10 |
| NGC4930 | PSF+Bulge+Disk+Bar | SB(rs)b | B | 37.50 | -21.2 | 0.90 | 1.61e+11 |
| NGC4939 | PSF+Bulge+Disk | SA(s)bc | A | 47.46 | -22.2 | 0.64 | 1.43e+11 |
| NGC4941 | PSF+Bulge+Disk | (R)SAB(r)ab | AB | 6.86 | -19.4 | 0.84 | 2.50e+10 |
| NGC4995 | PSF+Bulge+Disk+Bar | SAB(rs)b | AB | 30.00 | -20.6 | 0.87 | 8.25e+10 |
| NGC5054 | Bulge+Disk | SA(s)bc | A | 29.25 | -21.1 | 0.76 | 8.31e+10 |
| NGC5085 | Bulge+Disk | SA(s)c | A | 30.96 | -19.3 | 0.87 | 2.54e+10 |
| NGC5101 | PSF+Bulge+Disk+Bar | (R)SB(rs)0 | B | 29.36 | -20.8 | 1.00 | 1.69e+11 |
| NGC5121 | PSF+Bulge+Disk | (R’)SA(s)a | A | 23.68 | -19.4 | 0.95 | 3.68e+10 |
| NGC5161 | PSF+Bulge+Disk | SA(s)c | A | 35.89 | -21.7 | 0.79 | 1.65e+11 |
| NGC5247 | PSF+Bulge+Disk | SA(s)bc | A | 23.79 | -21.2 | 0.54 | 3.86e+10 |
| NGC5371 | PSF+Bulge+Disk+Bar | SAB(rs)bc | AB | 40.50 | -22.1 | 0.70 | 1.74e+11 |
| NGC5427 | PSF+Bulge+Disk | SA(s)c;pec | A | 40.82 | -21.2 | 0.57 | 4.61e+10 |
| NGC5483 | Bulge+Disk+Bar | SA(s)c | A | 26.46 | -20.3 | - | - |
| NGC5643 | PSF+Bulge+Disk+Bar | SAB(rs)c | AB | 18.11 | -20.9 | 0.74 | 6.68e+10 |
| NGC5676 | PSF+Bulge+Disk | SA(rs)bc | A | 36.96 | -21.5 | 0.68 | 9.01e+10 |
| NGC5701 | PSF+Bulge+Disk+Bar | (R)SB(rs)0 | B | 27.96 | -19.9 | 0.88 | 4.67e+10 |
| NGC5713 | PSF+Bulge+Disk | SAB(rs)bc;pec | AB | 32.57 | -21.1 | 0.64 | 5.21e+10 |
| NGC5850 | PSF+Bulge+Disk+Bar | SB(r)b | B | 30.54 | -21.5 | 0.79 | 1.37e+11 |
| NGC5921 | PSF+Bulge+Disk+Bar | SB(r)bc | B | 27.00 | -20.6 | 0.66 | 3.51e+10 |
| NGC5962 | Bulge+Disk+Bar | SA(r)c | A | 34.07 | -20.9 | 0.64 | 4.43e+10 |
| NGC6215 | PSF+Bulge+Disk | SA(s)c | A | 21.96 | -20.4 | 0.54 | 1.84e+10 |
| NGC6221 | Bulge+Disk+Bar | SB(s)bc;pec | B | 20.79 | -21.6 | 0.74 | 1.31e+11 |
| NGC6300 | PSF+Bulge+Disk+Bar | SB(rs)b | B | 15.32 | -20.3 | 0.78 | 4.49e+10 |
| NGC6384 | Bulge+Disk | SAB(r)bc | AB | 28.50 | -21.5 | 0.72 | 1.05e+11 |
| NGC6753 | PSF+Bulge+Disk+Bar | (R)SA(r)b | A | 43.82 | -21.6 | 0.83 | 1.81e+11 |
| NGC6782 | PSF+Bulge+Disk+Bar | (R)SAB(r)a | AB | 54.43 | -21.4 | - | - |
| NGC6902 | PSF+Bulge+Disk | SA(r)b | A | 38.25 | -21.2 | 0.71 | 8.12e+10 |
| NGC6907 | PSF+Bulge+Disk+Bar | SB(s)bc | B | 46.07 | -21.8 | 0.69 | 1.21e+11 |
| NGC7083 | PSF+Bulge+Disk | SA(s)bc | A | 41.46 | -21.8 | 0.65 | 1.05e+11 |
| NGC7205 | PSF+Bulge+Disk | SA(s)bc | A | 21.96 | -20.7 | 0.60 | 3.11e+10 |
| NGC7213 | PSF+Bulge+Disk | SA(s)a | A | 23.57 | -21.0 | 0.89 | 1.26e+11 |
| NGC7217 | PSF+Bulge+Disk | (R)SA(r)ab | A | 17.14 | -20.5 | 0.90 | 8.38e+10 |
| NGC7412 | PSF+Bulge+Disk+Bar | SB(s)b | B | 22.61 | -20.2 | 0.53 | 1.50e+10 |
| NGC7479 | PSF+Bulge+Disk+Bar | SB(s)c | B | 34.71 | -21.7 | 0.75 | 1.44e+11 |
| NGC7552 | Bulge+Disk+Bar | (R’)SB(s)ab | B | 20.89 | -20.5 | 0.68 | 3.49e+10 |
| NGC7723 | PSF+Bulge+Disk+Bar | SB(r)b | B | 25.39 | -20.5 | 0.73 | 4.32e+10 |
| NGC7727 | PSF+Bulge+Disk | SAB(s)a;pec | AB | 24.96 | -20.8 | 0.91 | 1.13e+11 |
| NGC7741 | Bulge+Disk+Bar | SB(s)cd | B | 13.18 | -19.3 | 0.53 | 6.67e+09 |
Note. — Columns are: (1) Galaxy name. (2) The best fit chosen based on the criteria outlined in § 3.3. (3) Hubble type from RC3 (de Vaucouleurs et al. 1991). (4) RC3 bar type, which is based on visual inspection of optical images and runs as ‘B’=‘strongly barred’, ‘AB’=‘weakly barred’, and ‘A’=‘unbarred’. (5) The distance in Mpc from the Nearby Galaxies Catalog (Tully 1988) scaled to a Hubble constant of 70 km s-1 Mpc-1. Distances are adjusted assuming the Galaxy is retarded by 300 km from the universal expansion by the mass of the Virgo Cluster. Exceptions are NGC 6753, NGC 6782, and NGC 6907 where distances are from RC3, NGC 3504 where the distance is from Kenney et al. (1993), and NGC 4314 where the distance is from Benedict et al. (1996). (6) Absolute -band magnitude from Hyperleda. Corrections have been applied for galactic and internal extinction. Galactic absorption is computed based on Schlegel et al. (1998). Internal extinction is corrected for following Bottinelli et al. (1995). K-correction co-efficients are drawn from RC2 (de Vaucouleurs et al. 1976). (7) color from Hyperleda. Corrections for extinction and k-correction have been applied as in column 6. (8) Stellar mass, calculated as outlined in § 2.2.
| Galaxy Name | Best Fit | Bar/ | Bulge | Bulge | Bulge | Disk h | Disk h | Bar | Bar | Bar | |||
|---|---|---|---|---|---|---|---|---|---|---|---|---|---|
| % | % | % | ′′ | kpc | ′′ | kpc | ′′ | kpc | |||||
| (1) | (2) | (3) | (4) | (5) | (6) | (7) | (8) | (9) | (10) | (11) | (12) | (13) | (14) |
| ESO138-10 | PSF+Bulge+Disk | 16.25 | 83.75 | - | 0.19 | 10.94 | 0.86 | 2.07 | 27.10 | 2.14 | - | - | - |
| IC0239 | PSF+Bulge+Disk+Bar | 2.45 | 92.65 | 4.91 | 0.03 | 6.63 | 0.41 | 0.23 | 34.56 | 2.15 | 13.95 | 0.87 | 0.19 |
| IC4444 | Bulge+Disk | 31.97 | 68.03 | - | 0.47 | 7.94 | 1.06 | 2.33 | 17.67 | 2.36 | - | - | - |
| IC5325 | PSF+Bulge+Disk | 6.79 | 93.21 | - | 0.07 | 15.17 | 1.56 | 1.75 | 23.18 | 2.39 | - | - | - |
| NGC0150 | PSF+Bulge+Disk+Bar | 5.72 | 81.18 | 13.11 | 0.07 | 4.22 | 0.44 | 0.05 | 33.57 | 3.52 | 17.82 | 1.87 | 0.39 |
| NGC0157 | PSF+Bulge+Disk | 2.29 | 97.71 | - | 0.02 | 3.44 | 0.41 | 0.44 | 31.82 | 3.78 | - | - | - |
| NGC0210 | Bulge+Disk+Bar | 30.07 | 48.54 | 21.39 | 0.62 | 4.81 | 0.57 | 1.71 | 83.21 | 9.92 | 29.41 | 3.51 | 0.31 |
| NGC0278 | PSF+Bulge+Disk | 4.23 | 95.77 | - | 0.04 | 3.46 | 0.15 | 0.57 | 13.48 | 0.58 | - | - | - |
| NGC0289 | PSF+Bulge+Disk+Bar | 8.83 | 85.99 | 5.18 | 0.10 | 4.91 | 0.57 | 0.46 | 20.28 | 2.36 | 18.90 | 2.19 | 0.04 |
| NGC0428 | PSF+Bulge+Disk+Bar | 5.50 | 71.64 | 22.86 | 0.08 | 9.27 | 0.67 | 0.38 | 32.55 | 2.34 | 30.70 | 2.21 | 0.37 |
| NGC0488 | PSF+Bulge+Disk | 21.72 | 78.28 | - | 0.28 | 9.91 | 1.52 | 3.07 | 38.94 | 5.96 | - | - | - |
| NGC0578 | PSF+Bulge+Disk+Bar | 2.05 | 93.63 | 4.32 | 0.02 | 4.19 | 0.46 | 0.56 | 40.73 | 4.47 | 14.95 | 1.64 | 0.18 |
| NGC0613 | PSF+Bulge+Disk+Bar | 13.14 | 56.97 | 29.90 | 0.23 | 6.12 | 0.64 | 1.05 | 44.69 | 4.64 | 62.49 | 6.49 | 0.53 |
| NGC0685 | Bar+Disk | - | 96.53 | 3.47 | - | - | - | - | 41.24 | 4.28 | 20.68 | 2.15 | 0.16 |
| NGC0779 | Bulge+Disk+Bar | 16.18 | 57.69 | 26.13 | 0.28 | 6.04 | 0.59 | 2.31 | 38.74 | 3.79 | 29.00 | 2.84 | 0.25 |
| NGC0864 | PSF+Bulge+Disk+Bar | 2.77 | 86.88 | 10.35 | 0.03 | 3.52 | 0.38 | 0.66 | 39.54 | 4.22 | 21.07 | 2.25 | 0.37 |
| NGC0908 | PSF+Bulge+Disk | 8.86 | 91.14 | - | 0.10 | 7.18 | 0.84 | 1.62 | 48.96 | 5.72 | - | - | - |
| NGC1042 | PSF+Bulge+Disk | 3.00 | 97.00 | - | 0.03 | 5.91 | 0.57 | 0.09 | 39.83 | 3.86 | - | - | - |
| NGC1073 | PSF+Bulge+Disk+Bar | 2.36 | 79.58 | 18.06 | 0.03 | 5.47 | 0.46 | 0.41 | 50.02 | 4.17 | 34.24 | 2.85 | 0.83 |
| NGC1084 | PSF+Bulge+Disk | 5.23 | 94.77 | - | 0.06 | 3.24 | 0.32 | 0.77 | 18.68 | 1.82 | - | - | - |
| NGC1087 | Bar+Disk | - | 93.13 | 6.87 | - | - | - | - | 28.55 | 2.78 | 7.79 | 0.76 | 1.27 |
| NGC1187 | PSF+Bulge+Disk+Bar | 6.94 | 64.96 | 28.10 | 0.11 | 4.81 | 0.51 | 1.57 | 38.20 | 4.06 | 51.85 | 5.51 | 0.72 |
| NGC1241 | PSF+Bulge+Disk+Bar | 11.70 | 69.10 | 19.21 | 0.17 | 2.61 | 0.70 | 0.91 | 27.69 | 7.43 | 17.89 | 4.80 | 0.49 |
| NGC1300 | PSF+Bulge+Disk+Bar | 11.04 | 74.94 | 14.02 | 0.15 | 4.63 | 0.51 | 1.19 | 63.53 | 6.96 | 65.89 | 7.21 | 0.25 |
| NGC1302 | PSF+Bulge+Disk+Bar | 17.65 | 63.79 | 18.57 | 0.28 | 4.96 | 0.59 | 2.01 | 44.92 | 5.34 | 20.44 | 2.43 | 0.76 |
| NGC1309 | PSF+Bulge+Disk | 27.07 | 72.93 | - | 0.37 | 10.86 | 1.68 | 2.27 | 16.67 | 2.58 | - | - | - |
| NGC1317 | Bulge+Disk+Bar | 13.86 | 41.48 | 44.65 | 0.33 | 3.99 | 0.53 | 1.94 | 47.37 | 6.31 | 20.22 | 2.69 | 2.19 |
| NGC1350 | PSF+Bulge+Disk+Bar | 19.52 | 69.99 | 10.50 | 0.28 | 7.41 | 0.95 | 1.59 | 52.77 | 6.73 | 51.07 | 6.51 | 0.31 |
| NGC1371 | PSF+Bulge+Disk+Bar | 12.46 | 80.16 | 7.38 | 0.16 | 5.17 | 0.52 | 1.11 | 29.34 | 2.93 | 18.92 | 1.89 | 0.36 |
| NGC1385 | PSF+Bar+Disk | - | 75.54 | 24.46 | - | - | - | - | 28.69 | 2.87 | 15.63 | 1.56 | 1.28 |
| NGC1511 | Bulge+Disk | 28.47 | 71.53 | - | 0.40 | 27.78 | 2.55 | 1.35 | 23.99 | 2.20 | - | - | - |
| NGC1559 | PSF+Bar+Disk | - | 97.06 | 2.94 | - | - | - | - | 31.16 | 2.86 | 9.84 | 0.90 | 0.53 |
| NGC1703 | PSF+Bulge+Disk | 6.32 | 93.68 | - | 0.07 | 2.83 | 0.30 | 0.56 | 18.24 | 1.91 | - | - | - |
| NGC1792 | PSF+Bulge+Disk | 2.65 | 97.35 | - | 0.03 | 3.72 | 0.31 | 0.84 | 38.50 | 3.23 | - | - | - |
| NGC1808 | PSF+Bulge+Disk+Bar | 3.92 | 74.27 | 21.82 | 0.05 | 2.78 | 0.19 | 0.45 | 38.78 | 2.71 | 5.71 | 0.40 | 0.67 |
| NGC1964 | PSF+Bulge+Disk+Bar | 41.78 | 49.87 | 8.35 | 0.84 | 8.31 | 0.97 | 2.58 | 18.59 | 2.17 | 8.05 | 0.94 | 0.05 |
| NGC2090 | Bulge+Disk+Bar | 14.67 | 58.39 | 26.94 | 0.25 | 17.68 | 1.12 | 2.19 | 160.02 | 10.17 | 33.74 | 2.14 | 0.43 |
| NGC2139 | Bulge+Disk | 15.16 | 84.84 | - | 0.18 | 8.27 | 1.04 | 1.53 | 18.12 | 2.27 | - | - | - |
| NGC2196 | PSF+Bulge+Disk | 46.38 | 53.62 | - | 0.86 | 13.42 | 2.12 | 2.38 | 28.38 | 4.48 | - | - | - |
| NGC2442 | PSF+Bulge+Disk+Bar | 13.33 | 62.47 | 24.19 | 0.21 | 4.78 | 0.46 | 1.68 | 78.46 | 7.55 | 60.15 | 5.79 | 0.24 |
| NGC2559 | Bulge+Disk+Bar | 6.98 | 81.64 | 11.37 | 0.09 | 4.01 | 0.43 | 1.38 | 34.65 | 3.72 | 21.40 | 2.30 | 0.24 |
| NGC2566 | Bulge+Disk | 22.71 | 77.29 | - | 0.29 | 1.74 | 0.20 | 4.42 | 23.05 | 2.60 | - | - | - |
| NGC2775 | PSF+Bulge+Disk | 60.87 | 39.13 | - | 1.56 | 47.35 | 4.37 | 4.85 | 28.09 | 2.59 | - | - | - |
| NGC3059 | Bar+Disk | - | 90.68 | 9.32 | - | - | - | - | 64.22 | 5.92 | 23.94 | 2.21 | 1.43 |
| NGC3166 | Bulge+Disk+Bar | 24.97 | 50.74 | 24.29 | 0.49 | 3.25 | 0.30 | 0.81 | 20.14 | 1.84 | 13.85 | 1.26 | 0.53 |
| NGC3169 | PSF+Bulge+Disk | 38.53 | 61.47 | - | 0.63 | 11.01 | 0.96 | 2.41 | 55.12 | 4.79 | - | - | - |
| NGC3223 | PSF+Bulge+Disk | 11.71 | 88.29 | - | 0.13 | 5.39 | 1.06 | 1.74 | 29.05 | 5.73 | - | - | - |
| NGC3227 | PSF+Bulge+Disk+Bar | 10.78 | 45.23 | 44.00 | 0.24 | 4.84 | 0.44 | 0.32 | 44.67 | 4.07 | 39.51 | 3.60 | 1.27 |
| NGC3261 | PSF+Bulge+Disk+Bar | 15.06 | 70.15 | 14.79 | 0.21 | 2.95 | 0.52 | 1.96 | 28.89 | 5.08 | 14.19 | 2.49 | 1.05 |
| NGC3275 | PSF+Bulge+Disk+Bar | 14.15 | 63.44 | 22.41 | 0.22 | 2.21 | 0.48 | 1.85 | 28.25 | 6.20 | 20.75 | 4.55 | 0.94 |
| NGC3319 | PSF+Bar+Disk | - | 91.41 | 8.59 | - | - | - | - | 66.08 | 14.49 | 14.60 | 3.20 | 0.43 |
| NGC3338 | PSF+Bulge+Disk+Bar | 5.29 | 81.96 | 12.75 | 0.06 | 4.39 | 0.39 | 0.76 | 36.42 | 3.25 | 20.62 | 1.84 | 0.39 |
| NGC3423 | Bulge+Disk | 28.10 | 71.90 | - | 0.39 | 24.09 | 1.39 | 2.39 | 31.21 | 1.80 | - | - | - |
| NGC3504 | Bulge+Disk+Bar | 23.15 | 39.49 | 37.37 | 0.59 | 2.37 | 0.25 | 1.04 | 29.55 | 3.09 | 26.02 | 2.72 | 0.78 |
| NGC3513 | Bulge+Disk+Bar | 4.45 | 92.08 | 3.47 | 0.05 | 10.73 | 0.88 | 1.46 | 33.18 | 2.72 | 18.32 | 1.50 | 0.08 |
| NGC3583 | Bulge+Disk+Bar | 8.62 | 53.40 | 37.98 | 0.16 | 1.29 | 0.19 | 1.28 | 21.78 | 3.19 | 14.89 | 2.18 | 0.68 |
| NGC3596 | PSF+Bulge+Disk | 12.15 | 87.85 | - | 0.14 | 5.34 | 0.43 | 0.67 | 18.54 | 1.50 | - | - | - |
| NGC3646 | PSF+Bulge+Disk | 13.53 | 86.47 | - | 0.16 | 3.60 | 1.04 | 1.20 | 26.01 | 7.54 | - | - | - |
| NGC3675 | PSF+Bulge+Disk | 44.42 | 55.58 | - | 0.80 | 28.41 | 1.42 | 2.66 | 47.12 | 2.35 | - | - | - |
| NGC3684 | PSF+Bulge+Disk | 26.92 | 73.08 | - | 0.37 | 11.43 | 1.10 | 2.15 | 15.96 | 1.53 | - | - | - |
| NGC3686 | PSF+Bulge+Disk+Bar | 3.02 | 95.00 | 1.98 | 0.03 | 4.39 | 0.31 | 0.66 | 27.57 | 1.96 | 21.32 | 1.52 | 0.03 |
| NGC3705 | PSF+Bulge+Disk+Bar | 27.73 | 59.20 | 13.07 | 0.47 | 8.62 | 0.63 | 1.83 | 37.77 | 2.74 | 30.00 | 2.18 | 0.07 |
| NGC3726 | PSF+Bulge+Disk+Bar | 3.09 | 95.10 | 1.81 | 0.03 | 5.64 | 0.37 | 0.53 | 49.58 | 3.24 | 41.09 | 2.69 | 0.05 |
| NGC3810 | PSF+Bulge+Disk | 38.43 | 61.57 | - | 0.62 | 12.35 | 0.82 | 1.28 | 23.78 | 1.57 | - | - | - |
| NGC3885 | PSF+Bulge+Disk | 27.10 | 72.90 | - | 0.37 | 3.13 | 0.41 | 0.46 | 11.94 | 1.57 | - | - | - |
| NGC3887 | PSF+Bulge+Disk+Bar | 4.19 | 83.01 | 12.80 | 0.05 | 5.27 | 0.44 | 1.01 | 42.69 | 3.55 | 37.62 | 3.13 | 0.62 |
| NGC3893 | PSF+Bulge+Disk | 54.61 | 45.39 | - | 1.20 | 20.05 | 1.31 | 2.05 | 23.40 | 1.52 | - | - | - |
| NGC3938 | PSF+Bulge+Disk | 7.30 | 92.70 | - | 0.08 | 6.43 | 0.34 | 1.18 | 32.84 | 1.75 | - | - | - |
| NGC3949 | PSF+Bulge+Disk | 7.75 | 92.25 | - | 0.08 | 4.67 | 0.22 | 0.64 | 15.22 | 0.72 | - | - | - |
| NGC4027 | Bar+Disk | - | 79.48 | 20.52 | - | - | - | - | 43.11 | 2.03 | 26.50 | 1.25 | 1.80 |
| NGC4030 | PSF+Bulge+Disk | 47.29 | 52.71 | - | 0.90 | 17.18 | 1.73 | 2.22 | 20.67 | 2.08 | - | - | - |
| NGC4051 | PSF+Bulge+Disk+Bar | 14.99 | 46.99 | 38.02 | 0.32 | 11.29 | 0.54 | 1.20 | 65.81 | 3.12 | 69.69 | 3.31 | 0.40 |
| NGC4062 | PSF+Bulge+Disk | 1.69 | 98.31 | - | 0.02 | 3.62 | 0.19 | 0.50 | 34.98 | 1.79 | - | - | - |
| NGC4123 | PSF+Bulge+Disk+Bar | 6.87 | 79.23 | 13.90 | 0.09 | 6.55 | 0.56 | 0.59 | 56.76 | 4.84 | 42.98 | 3.66 | 0.46 |
| NGC4145 | PSF+Bulge+Disk | 7.75 | 92.25 | - | 0.08 | 12.90 | 0.82 | 0.68 | 63.59 | 4.05 | - | - | - |
| NGC4151 | PSF+Bulge+Disk+Bar | 41.32 | 50.26 | 8.42 | 0.82 | 9.36 | 0.62 | 0.44 | 37.74 | 2.49 | 57.00 | 3.76 | 0.10 |
| NGC4212 | PSF+Bulge+Disk | 3.67 | 96.33 | - | 0.04 | 1.44 | 0.01 | 1.38 | 22.56 | 0.13 | - | - | - |
| NGC4254 | PSF+Bulge+Disk | 38.98 | 61.02 | - | 0.64 | 30.46 | 5.03 | 2.68 | 34.19 | 5.64 | - | - | - |
| NGC4293 | PSF+Bulge+Disk+Bar | 8.49 | 61.70 | 29.81 | 0.14 | 8.00 | 0.40 | 0.99 | 58.26 | 2.88 | 55.17 | 2.73 | 0.46 |
| NGC4303 | Bulge+Disk+Bar | 8.28 | 82.81 | 8.91 | 0.10 | 2.67 | 0.30 | 1.55 | 44.58 | 4.93 | 32.35 | 3.58 | 0.55 |
| NGC4314 | PSF+Bulge+Disk+Bar | 26.49 | 52.44 | 21.07 | 0.51 | 11.22 | 0.74 | 2.05 | 62.35 | 4.14 | 48.98 | 3.25 | 0.35 |
| NGC4394 | PSF+Bulge+Disk+Bar | 15.20 | 69.58 | 15.22 | 0.22 | 4.20 | 0.22 | 1.63 | 41.74 | 2.22 | 28.70 | 1.53 | 0.59 |
| NGC4414 | PSF+Bulge+Disk+Bar | 11.48 | 83.86 | 4.65 | 0.14 | 3.50 | 0.17 | 1.72 | 21.27 | 1.05 | 17.66 | 0.87 | 0.05 |
| NGC4450 | PSF+Bulge+Disk+Bar | 16.86 | 71.49 | 11.65 | 0.24 | 8.19 | 1.10 | 2.26 | 47.16 | 6.33 | 36.13 | 4.85 | 0.33 |
| NGC4487 | PSF+Bulge+Disk+Bar | 3.10 | 93.77 | 3.13 | 0.03 | 6.66 | 0.47 | 0.83 | 27.92 | 1.99 | 14.52 | 1.04 | 0.27 |
| NGC4490 | PSF+Bulge+Disk | 6.64 | 93.36 | - | 0.07 | 21.41 | 0.88 | 0.35 | 44.02 | 1.81 | - | - | - |
| NGC4527 | Bulge+Disk+Bar | 18.24 | 63.84 | 17.91 | 0.29 | 5.17 | 0.61 | 1.99 | 55.52 | 6.59 | 41.19 | 4.89 | 0.50 |
| NGC4548 | PSF+Bulge+Disk+Bar | 12.96 | 68.65 | 18.39 | 0.19 | 6.97 | 0.23 | 1.56 | 58.22 | 1.96 | 44.91 | 1.51 | 0.51 |
| NGC4593 | PSF+Bulge+Disk+Bar | 25.13 | 28.15 | 46.72 | 0.89 | 5.27 | 0.97 | 1.04 | 33.07 | 6.11 | 41.94 | 7.75 | 0.64 |
| NGC4618 | PSF+Bar+Disk | - | 86.11 | 13.89 | - | - | - | - | 46.22 | 8.54 | 17.05 | 3.15 | 0.66 |
| NGC4643 | Bulge+Disk+Bar | 24.96 | 54.10 | 20.95 | 0.46 | 5.43 | 0.52 | 2.53 | 48.22 | 4.64 | 21.30 | 2.05 | 0.62 |
| NGC4647 | Bulge+Disk | 33.39 | 66.61 | - | 0.50 | 12.90 | 1.26 | 1.61 | 42.63 | 4.17 | - | - | - |
| NGC4651 | PSF+Bulge+Disk | 41.67 | 58.33 | - | 0.71 | 18.52 | 1.01 | 0.63 | 30.46 | 1.66 | - | - | - |
| NGC4654 | Bulge+Disk | 1.74 | 98.26 | - | 0.02 | 3.78 | 0.27 | 0.93 | 30.16 | 2.18 | - | - | - |
| NGC4665 | PSF+Bulge+Disk+Bar | 14.74 | 67.38 | 17.89 | 0.22 | 6.92 | 0.37 | 1.12 | 50.48 | 2.73 | 30.68 | 1.66 | 0.70 |
| NGC4689 | PSF+Bulge+Disk | 5.22 | 94.78 | - | 0.06 | 6.97 | 0.73 | 1.14 | 41.85 | 4.38 | - | - | - |
| NGC4691 | PSF+Bulge+Disk+Bar | 15.80 | 69.09 | 15.11 | 0.23 | 11.62 | 0.89 | 0.61 | 33.90 | 2.59 | 24.99 | 1.91 | 0.42 |
| NGC4698 | PSF+Bulge+Disk | 21.72 | 78.28 | - | 0.28 | 6.78 | 0.48 | 1.78 | 28.34 | 2.02 | - | - | - |
| NGC4699 | Bulge+Disk+Bar | 19.93 | 76.48 | 3.59 | 0.26 | 2.62 | 0.27 | 2.08 | 15.93 | 1.62 | 13.49 | 1.37 | 0.02 |
| NGC4772 | PSF+Bulge+Disk+Bar | 34.25 | 51.55 | 14.20 | 0.66 | 9.29 | 0.67 | 1.49 | 58.16 | 4.17 | 52.58 | 3.77 | 0.50 |
| NGC4775 | PSF+Bulge+Disk | 32.85 | 67.15 | - | 0.49 | 21.43 | 2.31 | 1.75 | 18.48 | 1.99 | - | - | - |
| NGC4781 | PSF+Bulge+Disk | 10.18 | 89.82 | - | 0.11 | 12.02 | 1.04 | 0.94 | 32.82 | 2.85 | - | - | - |
| NGC4818 | PSF+Bulge+Disk+Bar | 7.04 | 73.74 | 19.22 | 0.10 | 2.82 | 0.21 | 0.47 | 36.31 | 2.69 | 16.38 | 1.21 | 0.51 |
| NGC4856 | PSF+Bulge+Disk+Bar | 27.44 | 61.22 | 11.35 | 0.45 | 5.95 | 0.51 | 1.53 | 30.61 | 2.64 | 17.07 | 1.47 | 0.44 |
| NGC4902 | PSF+Bulge+Disk+Bar | 5.59 | 84.44 | 9.97 | 0.07 | 4.31 | 0.80 | 0.85 | 29.24 | 5.45 | 14.13 | 2.64 | 0.39 |
| NGC4930 | PSF+Bulge+Disk+Bar | 23.74 | 61.29 | 14.98 | 0.39 | 6.46 | 1.14 | 1.37 | 45.02 | 7.93 | 32.96 | 5.80 | 0.38 |
| NGC4939 | PSF+Bulge+Disk | 21.37 | 78.63 | - | 0.27 | 9.52 | 2.01 | 2.78 | 32.14 | 6.79 | - | - | - |
| NGC4941 | PSF+Bulge+Disk | 15.08 | 84.92 | - | 0.18 | 4.30 | 0.25 | 0.84 | 23.23 | 1.36 | - | - | - |
| NGC4995 | PSF+Bulge+Disk+Bar | 6.62 | 87.18 | 6.20 | 0.08 | 4.14 | 0.50 | 0.05 | 19.56 | 2.34 | 18.03 | 2.16 | 0.34 |
| NGC5054 | Bulge+Disk | 9.64 | 90.36 | - | 0.11 | 5.28 | 0.65 | 2.42 | 52.65 | 6.48 | - | - | - |
| NGC5085 | Bulge+Disk | 6.04 | 93.96 | - | 0.06 | 5.53 | 0.74 | 1.48 | 33.88 | 4.55 | - | - | - |
| NGC5101 | PSF+Bulge+Disk+Bar | 32.63 | 48.31 | 19.06 | 0.68 | 7.61 | 0.96 | 2.28 | 28.39 | 3.59 | 37.85 | 4.78 | 0.31 |
| NGC5121 | PSF+Bulge+Disk | 36.43 | 63.57 | - | 0.57 | 4.68 | 0.48 | 2.41 | 15.62 | 1.61 | - | - | - |
| NGC5161 | PSF+Bulge+Disk | 27.14 | 72.86 | - | 0.37 | 20.54 | 3.38 | 1.47 | 43.98 | 7.24 | - | - | - |
| NGC5247 | PSF+Bulge+Disk | 7.54 | 92.46 | - | 0.08 | 8.46 | 0.79 | 1.04 | 50.85 | 4.78 | - | - | - |
| NGC5371 | PSF+Bulge+Disk+Bar | 8.60 | 76.08 | 15.32 | 0.11 | 3.13 | 0.55 | 1.29 | 55.81 | 9.84 | 23.03 | 4.06 | 1.05 |
| NGC5427 | PSF+Bulge+Disk | 7.76 | 92.24 | - | 0.08 | 4.74 | 0.45 | 0.60 | 24.59 | 2.31 | - | - | - |
| NGC5483 | Bulge+Disk+Bar | 0.98 | 91.28 | 7.73 | 0.01 | 3.23 | 0.39 | 1.22 | 23.25 | 2.83 | 8.74 | 1.06 | 0.32 |
| NGC5643 | PSF+Bulge+Disk+Bar | 8.21 | 81.78 | 10.01 | 0.10 | 5.68 | 0.46 | 2.14 | 45.30 | 3.63 | 48.58 | 3.89 | 0.43 |
| NGC5676 | PSF+Bulge+Disk | 6.67 | 93.33 | - | 0.07 | 3.71 | 0.54 | 1.29 | 23.10 | 3.39 | - | - | - |
| NGC5701 | PSF+Bulge+Disk+Bar | 24.43 | 63.47 | 12.09 | 0.38 | 11.13 | 1.19 | 2.41 | 70.67 | 7.56 | 26.01 | 2.78 | 0.40 |
| NGC5713 | PSF+Bulge+Disk | 33.40 | 66.60 | - | 0.50 | 15.59 | 2.02 | 1.84 | 18.52 | 2.40 | - | - | - |
| NGC5850 | PSF+Bulge+Disk+Bar | 14.76 | 63.74 | 21.50 | 0.23 | 6.22 | 1.06 | 1.58 | 72.24 | 12.29 | 46.05 | 7.83 | 0.90 |
| NGC5921 | PSF+Bulge+Disk+Bar | 10.43 | 70.50 | 19.06 | 0.15 | 2.55 | 0.26 | 1.97 | 40.88 | 4.10 | 35.05 | 3.51 | 0.92 |
| NGC5962 | Bulge+Disk+Bar | 10.30 | 78.82 | 10.88 | 0.13 | 2.33 | 0.32 | 1.37 | 14.56 | 1.99 | 13.85 | 1.89 | 0.02 |
| NGC6215 | PSF+Bulge+Disk | 6.95 | 93.05 | - | 0.07 | 2.55 | 0.27 | 0.96 | 14.02 | 1.47 | - | - | - |
| NGC6221 | Bulge+Disk+Bar | 5.27 | 81.98 | 12.76 | 0.06 | 3.16 | 0.29 | 2.73 | 51.47 | 4.78 | 19.33 | 1.80 | 0.87 |
| NGC6300 | PSF+Bulge+Disk+Bar | 5.98 | 86.55 | 7.47 | 0.07 | 5.43 | 0.42 | 1.44 | 47.08 | 3.60 | 31.64 | 2.42 | 0.30 |
| NGC6384 | Bulge+Disk | 27.92 | 72.08 | - | 0.39 | 15.66 | 1.82 | 3.13 | 40.05 | 4.65 | - | - | - |
| NGC6753 | PSF+Bulge+Disk+Bar | 5.08 | 72.91 | 22.02 | 0.07 | 1.50 | 0.32 | 0.94 | 19.17 | 4.12 | 7.88 | 1.69 | 0.80 |
| NGC6782 | PSF+Bulge+Disk+Bar | 26.27 | 51.75 | 21.98 | 0.51 | 3.90 | 1.03 | 1.10 | 27.14 | 7.20 | 19.27 | 5.11 | 0.38 |
| NGC6902 | PSF+Bulge+Disk | 40.55 | 59.45 | - | 0.68 | 12.68 | 2.43 | 3.03 | 30.13 | 5.77 | - | - | - |
| NGC6907 | PSF+Bulge+Disk+Bar | 10.32 | 63.12 | 26.56 | 0.16 | 3.49 | 0.75 | 1.10 | 28.99 | 6.19 | 23.37 | 4.99 | 0.33 |
| NGC7083 | PSF+Bulge+Disk | 13.23 | 86.77 | - | 0.15 | 5.87 | 1.23 | 1.37 | 23.26 | 4.86 | - | - | - |
| NGC7205 | PSF+Bulge+Disk | 6.08 | 93.92 | - | 0.06 | 4.70 | 0.48 | 0.88 | 31.03 | 3.16 | - | - | - |
| NGC7213 | PSF+Bulge+Disk | 65.74 | 34.26 | - | 1.92 | 19.55 | 2.42 | 2.68 | 63.19 | 7.83 | - | - | - |
| NGC7217 | PSF+Bulge+Disk | 53.71 | 46.29 | - | 1.16 | 21.07 | 1.36 | 2.21 | 26.84 | 1.73 | - | - | - |
| NGC7412 | PSF+Bulge+Disk+Bar | 4.09 | 68.60 | 27.31 | 0.06 | 2.84 | 0.34 | 1.28 | 23.58 | 2.78 | 35.06 | 4.13 | 1.20 |
| NGC7479 | PSF+Bulge+Disk+Bar | 8.76 | 63.51 | 27.72 | 0.14 | 6.00 | 0.98 | 1.09 | 37.59 | 6.17 | 40.63 | 6.67 | 0.47 |
| NGC7552 | Bulge+Disk+Bar | 23.44 | 61.08 | 15.48 | 0.38 | 2.70 | 0.31 | 0.64 | 17.54 | 1.99 | 42.05 | 4.78 | 0.24 |
| NGC7723 | PSF+Bulge+Disk+Bar | 5.11 | 85.03 | 9.85 | 0.06 | 2.61 | 0.34 | 0.54 | 21.70 | 2.82 | 21.81 | 2.84 | 0.90 |
| NGC7727 | PSF+Bulge+Disk | 41.77 | 58.23 | - | 0.72 | 8.31 | 1.05 | 2.02 | 24.46 | 3.09 | - | - | - |
| NGC7741 | Bulge+Disk+Bar | 3.09 | 89.02 | 7.90 | 0.03 | 9.51 | 0.50 | 0.31 | 60.98 | 3.18 | 30.02 | 1.56 | 0.40 |
Note. — Columns are: (1) Galaxy name. (2) The best fit chosen based on the criteria outlined in § 3.3. (3) Bulge-to-total light ratio. If a PSF is included in the model, the contribution from the PSF is also added in. (4) Disk-to-total light ratio. (5) Bar-to-total light ratio. (6) Bulge-to-disk ratio (7) Bulge effective radius in arcseconds. (8) Bulge effective radius in kpc. (9) Bulge Sérsic index. (10) Disk scalelength in arcseconds. (11) Disk scalelength in kpc. (12) Bar effective radius in arcseconds. (13) Bar Bulge effective radius in kpc. (14) Bar Sérsic index.
| Fit | or h | or h | Position Angle | Fractional light | |||
|---|---|---|---|---|---|---|---|
| (′′) | (kpc) | ||||||
| (1) | (2) | (3) | (4) | (5) | (6) | (7) | (8) |
| Stage 1 | Sérsic | 27.90 | 2.66 | 4.44 | 0.80 | -51.03 | 100% |
| Stage 2 | Bulge | 23.86 | 2.30 | 4.16 | 0.80 | -51.08 | 34.6% |
| Disk | 335.88 | 32.33 | 1.00 | 0.84 | 66.94 | 65.4% | |
| Stage 3 | Bulge | 5.43 | 0.52 | 2.53 | 0.90 | 60.52 | 25.0% |
| Disk | 48.22 | 4.64 | 1.00 | 0.84 | 66.94 | 54.1% | |
| Bar | 21.30 | 2.05 | 0.62 | 0.37 | -45.84 | 20.9% |
Note. — Columns are: (1) Indicates whether the model is for Stage 1 (pure Sérsic profile), Stage 2 (bulge+disk or bar+disk), or Stage 3 (bulge+disk+bar). (2) One of pure Sérsic profile, Sérsic bulge, exponential disk, or Sérsic bar. (3) Effective radius of the bulge/bar or disk scalelength in arcseconds. (4) Effective radius of the bulge/bar or disk scalelength in kpc. (5) The Sérsic index of the profile. (6) Axis ratio of the component. (7) Position angle in degrees of the component. Positive angles are East of North. (8) The percentage of total galaxy light contributed by the component.
| Fit | or h | or h | Position Angle | Fractional light | |||
|---|---|---|---|---|---|---|---|
| (′′) | (kpc) | ||||||
| (1) | (2) | (3) | (4) | (5) | (6) | (7) | (8) |
| Stage 1 | Sérsic | 154.59 | 5.19 | 5.19 | 0.80 | 78.31 | 100% |
| Stage 2 | Bulge | 57.86 | 1.94 | 4.32 | 0.76 | 75.77 | 61.5% |
| Disk | 60.39 | 2.03 | 1.00 | 0.75 | -32.54 | 38.5% | |
| Stage 3 | Bulge | 6.98 | 0.23 | 1.56 | 0.88 | -66.50 | 13.0% |
| Disk | 58.22 | 1.96 | 1.00 | 0.75 | -32.54 | 68.6% | |
| Bar | 44.91 | 1.51 | 0.51 | 0.35 | 66.65 | 18.4% |
Note. — Columns are: (1) Indicates whether the model is for Stage 1 (pure Sérsic profile), Stage 2 (bulge+disk or bar+disk), or Stage 3 (bulge+disk+bar). (2) One of pure Sérsic profile, Sérsic bulge, exponential disk, or Sérsic bar. (3) Effective radius of the bulge/bar or disk scalelength in arcseconds. (4) Effective radius of the bulge/bar or disk scalelength in kpc. (5) The Sérsic index of the profile. (6) Axis ratio of the component. (7) Position angle in degrees of the component. Positive angles are East of North. (8) The percentage of total galaxy light contributed by the component.
| Fit | or h | or h | Position Angle | Fractional light | |||
|---|---|---|---|---|---|---|---|
| (′′) | (kpc) | ||||||
| (1) | (2) | (3) | (4) | (5) | (6) | (7) | (8) |
| Stage 1 | Sérsic | 154.4 | 28.8 | 5.11 | 0.54 | 69.0 | 100% |
| Stage 2 | Bulge | 11.5 | 2.15 | 1.02 | 0.38 | 68.5 | 17.4% |
| Disk | 32.8 | 6.12 | 1.00 | 0.84 | 81.1 | 82.6% | |
| Stage 3 | Bulge | 4.31 | 0.80 | 0.85 | 0.68 | -52.96 | 5.59% |
| Disk | 29.2 | 5.45 | 1.00 | 0.84 | 81.1 | 82.6% | |
| Bar | 14.1 | 2.64 | 0.39 | 0.22 | 66.37 | 9.97% |
Note. — Columns are: (1) Indicates whether the model is for Stage 1 (pure Sérsic profile), Stage 2 (bulge+disk or bar+disk), or Stage 3 (bulge+disk+bar). (2) One of pure Sérsic profile, Sérsic bulge, exponential disk, or Sérsic bar. (3) Effective radius of the bulge/bar or disk scalelength in arcseconds. (4) Effective radius of the bulge/bar or disk scalelength in kpc. (5) The Sérsic index of the profile. (6) Axis ratio of the component. (7) Position angle in degrees of the component. Positive angles are East of North. (8) The percentage of total galaxy light contributed by the component.
| Bulge | Bulge | Disk | Bar/ | Bar | Bar | |||
|---|---|---|---|---|---|---|---|---|
| (”) | (”) | (”) | ||||||
| (1) | (2) | (3) | (4) | (5) | (6) | (7) | (8) | (9) |
| NGC 4548 | ||||||||
| Initial guesses from 1D decomposition | 17.5% | 7.39 | 1.17 | 63.5% | 28.4 | 19.0% | 37.5 | 0.54 |
| Stage 3 Output | 13.0% | 6.98 | 1.56 | 68.6% | 58.2 | 18.4% | 44.9 | 0.51 |
| Initial guesses from from Stage 2 | 11.1% | 7.50 | 1.70 | 69.9% | 64.5 | 19.1% | 37.5 | 0.54 |
| Stage 3 Output | 13.0% | 6.98 | 1.56 | 68.6% | 58.2 | 18.4% | 44.9 | 0.51 |
| NGC 4643 | ||||||||
| Initial guesses from 1D decomposition | 33.6% | 7.18 | 0.86 | 40.4% | 37.5 | 26.0% | 22.0 | 0.60 |
| Stage 3 Output | 25.0% | 5.43 | 2.53 | 54.1% | 48.2 | 20.9% | 21.3 | 0.62 |
| Initial guesses from Stage 2 | 24.1% | 5.30 | 2.5 | 51.8% | 46.4 | 24.1% | 22.0 | 0.60 |
| Stage 3 Output | 25.0% | 5.43 | 2.53 | 54.1% | 48.2 | 20.9% | 21.3 | 0.62 |
Note. — For each galaxy, the rows are: (1) The initial guesses to Stage 3 provided by 1D decomposition. (2) The corresponding output for the input of row (1). (3) The initial guesses to Stage 3 provided by Stage 2. (4) The corresponding output for the input of row (3).
The columns are: (2) Bulge-to-total luminosity fraction. (3) Effective radius of the bulge in arcseconds. (4) The Sérsic index of the profile. (5) Disk-to-total luminosity fraction. (6) Disk scalelength in arcseconds. (7) Bar-to-total luminosity fraction. (8) Bar effective radius in arcseconds. (9) Bar Sérsic index.
| Type of Fit | Bulge | Bulge | Disk | Bar | Bar | Bar/ | |||
|---|---|---|---|---|---|---|---|---|---|
| (”) | (”) | (”) | |||||||
| (1) | (2) | (3) | (4) | (5) | (6) | (7) | (8) | (9) | (10) |
| NGC 3885 | |||||||||
| initial input | 11241.33 | 2.32 | 2.00 | 27.7% | 10.44 | 72.3% | - | - | - |
| n=free | 8210.12 | 3.13 | 0.46 | 27.1% | 11.94 | 72.9% | - | - | - |
| n=1 fixed | [8307.82] | [2.96] | [1.00] | [29.1%] | [12.90] | [70.9%] | - | - | - |
| n=4 fixed | [7373.55] | [6.28] | [4.00] | [53.7%] | [20.45] | [46.3%] | - | - | - |
| n=1 re-fit | 8210.12 | 3.13 | 0.46 | 27.1% | 11.94 | 72.9% | - | - | - |
| n=4 re-fit | 7258.46 | 7.11 | 4.49 | 57.3% | 19.87 | 42.7% | - | - | - |
| NGC 7213 | |||||||||
| initial input | 605757.39 | 5.80 | 4.00 | 56.4% | 9.25 | 43.6% | - | - | - |
| n=free | 71170.10 | 19.55 | 2.68 | 65.7% | 63.19 | 34.3% | - | - | - |
| n=1 fixed | [96312.29] | [7.81] | [1.00] | [31.4%] | [27.79] | [68.6%] | - | - | - |
| n=4 fixed | [70998.69] | [41.11] | [4.00] | [95.4%] | [6.75] | [4.6%] | - | - | - |
| n=1 re-fit | 71170.10 | 19.53 | 2.68 | 65.7% | 63.16 | 34.3% | - | - | - |
| n=4 re-fit | 69970.51 | 72.04 | 5.60 | 91.9% | 7.98 | 8.1% | - | - | - |
| NGC 4643 | |||||||||
| initial input | 7841.46 | 5.34 | 2.50 | 24.1% | 46.40 | 51.8% | 22.04 | 0.60 | 24.1% |
| n=free | 2111.59 | 5.43 | 2.53 | 25.0% | 48.22 | 54.1% | 21.30 | 0.62 | 20.9% |
| n=1 fixed | [3001.98] | [2.31] | [1.00] | [9.6%] | [53.37] | [57.0%] | [15.05] | [0.88] | [33.4%] |
| n=4 fixed | [2491.06] | [12.08] | [4.00] | [35.4%] | [87.22] | [51.7%] | [23.37] | [0.61] | [12.9%] |
| n=1 re-fit | 2111.59 | 5.43 | 2.53 | 25.0% | 48.21 | 54.1% | 21.30 | 0.62 | 20.9% |
| n=4 re-fit | 2111.59 | 5.43 | 2.53 | 25.0% | 48.22 | 54.1% | 21.30 | 0.62 | 20.9% |
| NGC 4151 | |||||||||
| initial input | 1388891.11 | 7.50 | 0.50 | 24.6% | 33.00 | 65.0% | 55.50 | 0.10 | 10.3% |
| n=free | 16391.66 | 9.36 | 0.44 | 41.3% | 37.74 | 50.3% | 57.00 | 0.10 | 8.4% |
| n=1 fixed | [18100.67] | [11.58] | [1.00] | [42.2%] | [86.28] | [41.1%] | [56.70] | [0.17] | [16.7%] |
| n=4 fixed | [20051.12] | [108.39] | [4.00] | [51.4%] | [8.21] | [20.4%] | [68.23] | [0.28] | [28.2%] |
| n=1 re-fit | 16391.58 | 9.38 | 0.44 | 41.2% | 38.31 | 49.7% | 55.57 | 0.12 | 9.0% |
| n=4 re-fit | 16390.93 | 9.36 | 0.44 | 41.3% | 38.20 | 49.8% | 55.88 | 0.11 | 8.8% |
Note. — For each galaxy, the rows are: (1) The model outputs (columns 2 to 10) from GALFIT based on the Stage 1 or Stage 2 fits. These outputs are used as initial guesses in the fits for rows 2 and 3. (2) The model outputs (columns 2 to 10) from GALFIT when the bulge is allowed to vary freely, and the input guesses are based on the parameters in columns 2 to 10 of row 1. (3) The model outputs (columns 2 to 10) from GALFIT when the bulge Sérsic index is held fixed at , and the input guesses are based on the parameters in columns 2 to 10 of row 1. The model is not always physically meaningful because the bulge index is fixed. (4) As in row 3, except that the bulge Sérsic index is now held fixed at . The model is not always physically meaningful because the bulge index is fixed. (5) The model outputs (columns 2 to 10) from GALFIT, when the bulge is allowed to vary freely, but the input guesses are now based on the parameters in columns 2 to 10 of row 3. (6) The model outputs (columns 2 to 10) from GALFIT, when the bulge is allowed to vary freely, but the input guesses are now based on the parameters in columns 2 to 10 of row 4. The columns are: (1) The type of fit whose model outputs are shown in columns 2 to 10. (2) The of the fit. (3) Effective radius of the bulge in arcseconds. (4) The Sérsic index of the bulge (in the case of Stage 2 bulge-disk fits in row 1 and in the case of all fits in rows 2 to 6), or the Sérsic index of a single component (in the case of Stage 1 fits in row 1). (5) Bulge-to-total luminosity fraction. (6) Disk scalelength in arcseconds. (7) Disk-to-total luminosity fraction. (8) Bar effective radius in arcseconds. (9) Bar Sérsic index. (10) Bar-to-total luminosity fraction.
| Structure | Mass |
|---|---|
| Bulges | |
| Disks | |
| Bars | |
| Bulges with | |
| Bulges with |
| Sample () | |
|---|---|
| Fraction of spirals with bulge | |
| Fraction of spirals with bulge | |
| Fraction of spirals with bulge | |
| Fraction of spirals with bulge | |
| Fraction of spirals with | |
| Fraction of spirals with | |
| Fraction of spirals with | |
| Fraction of spirals with | |
| Sample | |
| Fraction of spirals with bulge | |
| Fraction of spirals with bulge | |
| Fraction of spirals with bulge | |
| Fraction of spirals with bulge | |
| Fraction of spirals with | |
| Fraction of spirals with | |
| Fraction of spirals with | |
| Fraction of spirals with | |
| Sample () | |
|---|---|
| Bar fraction in spirals with bulge | |
| Bar fraction in spirals with bulge | |
| Bar fraction in spirals with bulge | |
| Bar fraction of spirals with bulge | |
| Bar fraction of spirals with | |
| Bar fraction of spirals with | |
| Bar fraction of spirals with | |
| Bar fraction of spirals with | |
| Sample | |
| Bar fraction of spirals with bulge | |
| Bar fraction of spirals with bulge | |
| Bar fraction of spirals with bulge | |
| Bar fraction of spirals with bulge | |
| Bar fraction of spirals with | |
| Bar fraction of spirals with | |
| Bar fraction of spirals with | |
| Bar fraction of spirals with | |
| Data | Model | Model spirals with | Model spirals with | All model | |
|---|---|---|---|---|---|
| major mergers | no major merger | spirals | |||
| since redshift | since redshfit | ||||
| (1) | (2) | (3) | (4) | (5) | (6) |
| For | For | ||||
| Fraction of spirals with | 66.4% 4.44% | SK | 0.1% | 67.2% | 67.3% |
| Fraction of spirals with | 25.7% 4.11% | SK | 2.2% | 16.6% | 18.8% |
| Fraction of spirals with | 8.0% 2.5% | SK | 11.2% | 2.6% | 13.8% |
| Fraction of spirals with | 100% | SK | 13.5% | 86.5% | 100.0% |
| For | For | ||||
| Fraction of spirals with | 66.4% 4.44% | SK | 1.6% | 65.7% | 67.3% |
| Fraction of spirals with | 25.7% 4.11% | SK | 5.5% | 13.3% | 18.8% |
| Fraction of spirals with | 8.0% 2.5% | SK | 12.6% | 1.3% | 13.9% |
| Fraction of spirals with | 100% | SK | 19.8% | 80.2% | 100.0% |
| For | For | ||||
| Fraction of spirals with | 66.4% 4.44% | PH | 3.0% | 67.7% | 70.7% |
| Fraction of spirals with | 25.7% 4.11% | PH | 7.1% | 13.1% | 20.1% |
| Fraction of spirals with | 8.0% 2.5% | PH | 5.9% | 3.1% | 9.0% |
| Fraction of spirals with | 100% | PH | 15.7% | 84.0% | 99.8% |
Note. — Column 2 shows the empirical fraction of high mass spirals with a given . Columns 3 to 6 show the fraction of high mass spirals with a given in the models, which define spirals as systems with . Column 3 indicates the model used: SK refers to the models by Khochfar & Burkert (2005) and Khochfar & Silk (2006), while PH refers to those by Hopkins et al. (2009). The models are described in §5.8 and have different prescriptions for the amount of mass that gets converted into bulge stars. Column 4 shows the fraction of spirals, which have a given and have had one or more major mergers since redshift . Column 5 shows the fraction of spirals, which have a given and have had no major merger since redshift . Column 6 is the sum of column 4 and 5, and shows the fraction of spirals with a given in the models. It can be directly compared to the data in column 2.
| Stellar mass limit: | |
|---|---|
| Model galaxies: 7674 | |
| Observed galaxies: 113 | |
| Test 1 | |
| % of model galaxies w/ with no major merger since : | 5040/7674 = |
| % of observed galaxies w/ and bulge : | 75/113 = |
| % of observed galaxies w/ and bulge : | 74/113 = |
| % of observed galaxies w/ and bulge : | 67/113 = |
| Test 2 | |
| % of model galaxies w/ and a major merger since : | 971/7674 = |
| % of observed spirals w/ and bulge : | 2/113 = |
| % of observed spirals w/ and bulge : | 4/113 = |
| % of observed spirals w/ and bulge : | 7/113 = |
| Test 3 | |
| % of model galaxies w/ and a major merger since : | 126/7674 = |
| % of observed galaxies w/ and bulge : | 0/113 = |
| % of observed galaxies w/ and bulge | 1/113 = |
| % of observed galaxies w/ and bulge | 8/113 = |