Central and Central-Parietal EEG Signatures of Parkinson’s Disease
Abstract
This study investigates EEG as a potential early biomarker by applying deep learning techniques to resting-state EEG recordings from 31 subjects (15 with PD and 16 healthy controls). EEG signals were rigorously preprocessed to remove tremor artifacts, then converted to wavelet-based images by grouping spatially adjacent electrodes into triplets for convolutional neural network (CNN) classification. Our analysis across different brain regions and frequency bands showed distinct spatial-spectral patterns of PD-related neural oscillations. We identified high classification accuracy (74%) in the gamma band (40-62.4 Hz) for central-parietal electrodes (CP1, Pz, CP2), and 76% accuracy using central electrodes (C3, Cz, C4) with full-spectrum 0.4-62.4 Hz. In particular, we observed pronounced right-hemisphere involvement, specifcialy in parieto-occipital regions. Unlike previous studies that achieved higher accuracies by potentially including tremor artifacts, our approach isolates genuine neurophysiological alterations in cortical activity. These findings suggest that specific EEG-based oscillatory patterns, especially central-parietal gamma activity, may provide diagnostic information for PD, potentially before the onset of motor symptoms.
keywords:
Parkinson’s disease , Electroencephalography , Deep learning , Gamma oscillations , Parieto-occipital cortex , Biomarkers1 Introduction
Parkinson’s disease (PD) is a progressive neurodegenerative disorder characterized primarily by motor symptoms including resting tremor, rigidity, bradykinesia, and postural instability [1]. PD is assocaited with the loss of dopaminergic neurons in the substantia nigra, resulting in dopamine deficiency [2]. Despite decades of research, current diagnostic approaches still rely heavily on clinical observation of motor symptoms and response to dopaminergic medication—a significant limitation given that these manifestations typically appear only after 60-80% of substantia nigra neurons have already degenerated [3].
This substantial delay between neuronal loss and clinical diagnosis represents a critical window during which potential neuroprotective interventions might be most effective—if reliable early biomarkers could be identified. Non-motor symptoms, including REM sleep behavior disorder [4], hyposmia [5], constipation, and subtle cognitive changes [6] often precede classical motor symptoms by years or even decades. However, attempts to develop screening protocols based on these prodromal features have yielded disappointing results. A recent five-year prospective study by Johnson et al. found that even combinations of three prodromal markers achieved positive predictive values of only 13.6%, highlighting the urgent need for more objective physiological markers.
Electroencephalography (EEG) offers particular promise as a potential biomarker. Unlike neuroimaging techniques requiring expensive equipment and specialized facilities, EEG combines non-invasiveness with relatively low cost, portability, and widespread availability in clinical settings. Critically, EEG directly measures neuronal activity with millisecond temporal resolution, potentially capturing subtle alterations in neural synchronization patterns that may reflect early pathological processes [7].
Traditional spectral analyses of EEG in PD have revealed somewhat inconsistent patterns across studies. While several groups have reported a general ”slowing” of EEG activity—characterized by increased power in delta (0.4-4 Hz) and theta (4-8 Hz) bands with concurrent reductions in beta (13-30 Hz) and gamma (30 Hz) power [8, 9]—these findings have not been universally replicated. Notably, Serizawa et al. demonstrated that spectral alterations vary significantly with disease progression and medication state, finding increased rather than decreased beta activity in early-stage, unmedicated patients. Such contradictions likely stem partly from inconsistent electrode referencing schemes and normalization methods, as demonstrated when reanalyzing published datasets with standardized preprocessing pipelines.
The application of advanced computational approaches to EEG analysis in PD has gained momentum in recent years. A comprehensive systematic review by Maitín et al. [10] examined nine studies utilizing machine learning for PD classification based on EEG, finding accuracies ranging from 62% to an impressive 99.62%. However, critical evaluation of these studies reveals substantial methodological concerns. The highest reported accuracies (¿95%) typically emerged from studies with significant methodological limitations, including small sample sizes (often ¡20 subjects per group), inadequate cross-validation procedures, or insufficient separation between training and testing data. Furthermore, proper correction for multiple comparisons was frequently absent, raising concerns about potential false positive findings.
A particularly challenging aspect of EEG analysis in PD concerns artifact management [11]. Unlike in other neurological conditions, PD patients exhibit pathological movements—including tremor at 4-6 Hz—that produce electrical signals spatially and temporally overlapping with neural oscillations of interest. Standard preprocessing approaches often fail to adequately distinguish these movement artifacts from genuine brain activity. For instance, blind source separation techniques like Independent Component Analysis (ICA) struggle with this separation because tremor-related components share spatial and temporal characteristics with cortical signals [12, 13]. Previous attempts to address this challenge have often resulted in overly aggressive filtering that likely removes disease-relevant neural activity along with artifacts.
The spatial localization of PD-related EEG abnormalities presents another substantial challenge. Traditional emphasis on basal ganglia dysfunction in PD has led many researchers to focus predominantly on central and frontal electrodes, often neglecting posterior regions. Yet emerging evidence suggests significant involvement of parietal and occipital cortices in PD pathophysiology, with Tessitore et al. demonstrating altered resting-state functional connectivity in posterior cortical networks that correlates with specific cognitive symptoms. The reliance on predetermined regions of interest in most previous studies has potentially obscured important spatial patterns of EEG abnormalities across the cortex.
Particularly striking is the contrast between findings from Swann et al. [14] and George et al. [15] regarding beta oscillations in PD. While Swann reported elevated beta synchrony across sensorimotor cortex that correlated with motor symptom severity, George observed decreased cortical beta coherence following dopaminergic medication—a seemingly paradoxical finding given that medication improves motor symptoms. These contradictory results likely reflect methodological differences in coherence calculation and reference electrode selection, but also suggest a more complex, non-linear relationship between oscillatory activity and disease manifestations than previously recognized.
The field has lacked a comprehensive analysis of how PD affects different frequency bands across various brain regions. Most studies have examined either global measures (averaged across all electrodes) or preselected subsets of electrodes/frequencies based on a priori hypotheses. This selective approach risks missing unexpected spatial-spectral patterns that might provide even stronger diagnostic markers. The few studies attempting broader spatial analyses have typically employed inadequate statistical controls for multiple comparisons, raising the likelihood of chance findings.
The present study addresses these gaps by employing a deep learning framework that systematically evaluates EEG activity across multiple brain regions and frequency bands without preconceived notions about which combinations should prove most discriminative. By transforming EEG signals into wavelet-based images and grouping spatially adjacent electrodes, the approach captures local patterns of neural synchronization while avoiding the limitations of traditional frequency analysis methods. This methodology enables comprehensive mapping of PD-related EEG alterations across the entire cortex and frequency spectrum.
Specifically, the study addresses three primary objectives:
-
1.
To develop and implement a robust preprocessing pipeline specifically designed to address the unique challenges of separating PD-related movement artifacts from neural oscillations, incorporating advanced artifact detection algorithms with minimal impact on disease-relevant signals.
-
2.
To systematically evaluate the discriminative power of different brain regions (electrode groups) and frequency bands without the regional biases evident in previous research, employing rigorous statistical controls appropriate for multiple comparisons across the electrode/frequency space.
-
3.
To identify specific spatial-spectral patterns yielding optimal classification accuracy, with particular attention to previously under-investigated regions and frequency combinations that might serve as novel neurophysiological biomarkers for PD.
The findings contribute to a more nuanced understanding of PD’s impact on cortical oscillatory activity while offering potential EEG-based biomarkers that could eventually enable earlier diagnosis. The spatial-spectral specificity of these markers may also provide insights into the neurophysiological mechanisms underlying both motor and non-motor symptoms of PD. Understanding these patterns becomes increasingly important as research moves toward detecting prodromal stages of PD, when neuroprotective interventions might significantly alter disease progression. Nevertheless, the cross-sectional design employed here represents a first step, with longitudinal studies ultimately needed to validate these markers’ utility for early detection.
2 Methods
2.1 Dataset
For this study, we utilized the openly available resting-state EEG dataset from the University of San Diego, specifically the ”Rest EEG in Parkinson’s Disease” dataset (OpenNeuro, ds002778, version 1.0.5) [16, 14, 15]. The dataset consists of resting-state EEG recordings from 31 participants: 15 individuals with PD and 16 healthy control subjects.
The EEG data was recorded using a 32-channel BioSemi ActiveTwo system at a sampling rate of 512 Hz. Recordings were conducted with participants in a resting state with their eyes open. Each participant underwent approximately 3 minutes of continuous EEG recording. The electrode placement followed the standard 10-20 international system.
It is important to note that the dataset has certain limitations acknowledged by the original data collectors. The Unified Parkinson’s Disease Rating Scale (UPDRS) assessments were conducted by laboratory personnel who had completed online training rather than by board-certified neurologists, which may introduce some uncertainty in clinical evaluations. Additionally, given the heterogeneous presentation of PD across patients and the relatively small sample size, we employed a cross-validation approach in our analysis to maximize the statistical validity of our findings while acknowledging the limitations inherent to the dataset size.
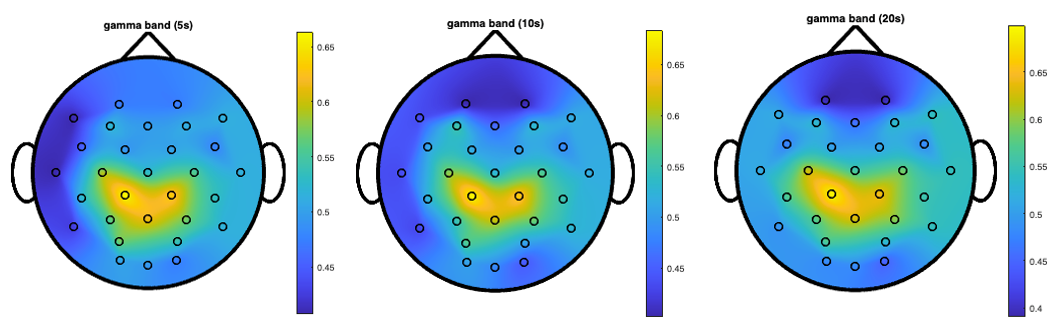
Figure 7 directly compares the gamma band topographical maps across all three window lengths (5, 10, and 20 seconds), highlighting the consistency of the central-parietal focus of high discriminative power regardless of the temporal window used for analysis.
2.2 EEG Preprocessing
The raw EEG data underwent a preprocessing pipeline using MATLAB EEGLAB toolbox [17, 18] to remove artifacts and prepare the signals for wavelet transformation and subsequent analysis. The preprocessing steps were as follows:
The EEG data was downsampled from 512 Hz to 128 Hz using the EEGLAB function pop_resample(EEG, 128). This step reduced computational load while maintaining sufficient temporal resolution for frequency analysis up to 64 Hz.
Then, a finite impulse response (FIR) bandpass filter was applied using the function pop_firws(EEG, ’fcutoff’, [0.4 63.5],…) to remove frequency components below 0.4 Hz and above 63.5 Hz. This eliminated slow drifts, DC offset, and high-frequency noise while preserving the frequency bands of interest (delta, theta, alpha, beta, and gamma).
Lastly, we applied Independent Component Analysis to decompose the EEG signals into independent components and identify components associated with artifacts. Components classified as non-brain sources (e.g., eye movements, muscle activity) were removed, and the signals were reconstructed.
2.3 Data Preparation
After preprocessing, the continuous EEG recordings were segmented into overlapping windows of three different durations: 5 seconds, 10 seconds, and 20 seconds. This windowing approach served multiple purposes:
-
1.
It increased the effective sample size by creating multiple examples from each participant’s recording.
-
2.
It allowed for the comparison of classification performance across different temporal scales.
-
3.
It provided a means to assess the stability and consistency of the identified EEG patterns.
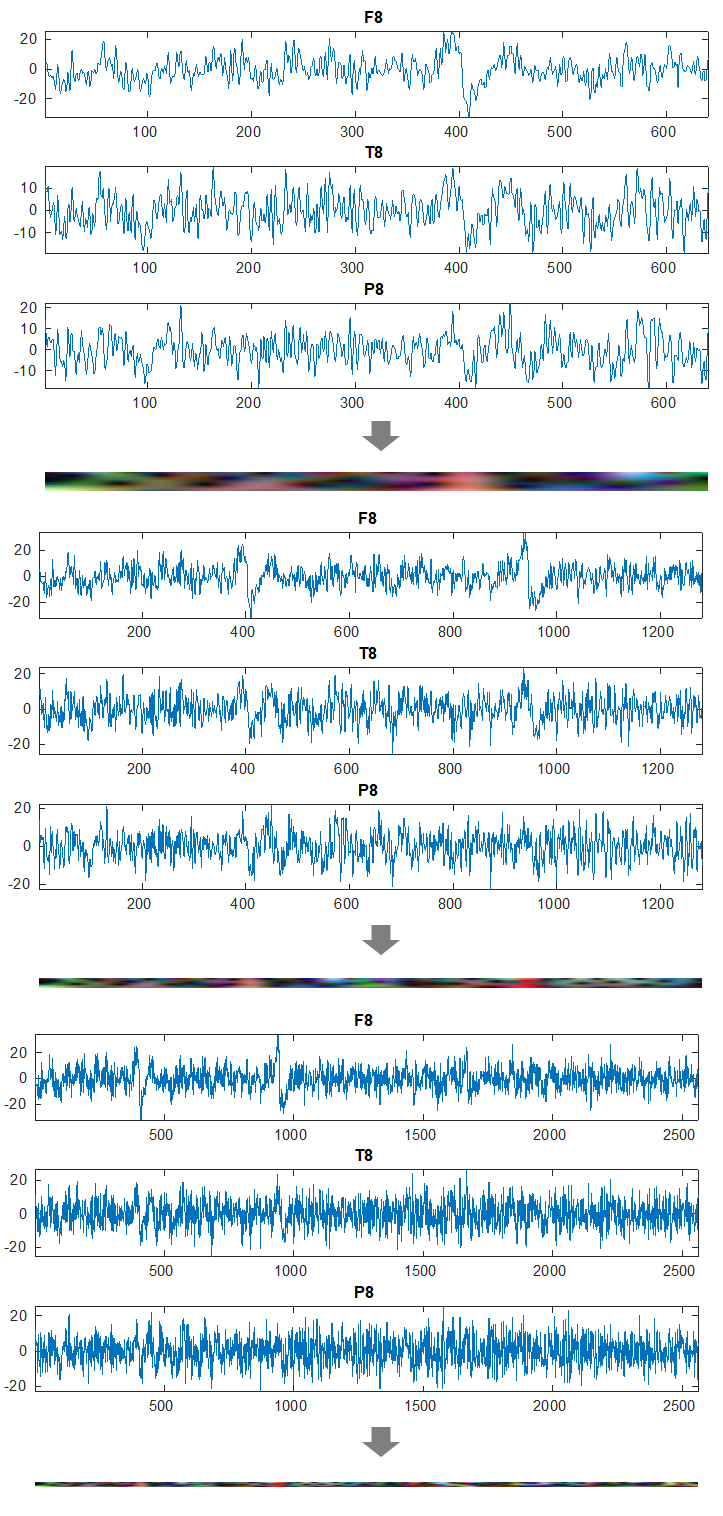
For each window, we applied continuous wavelet transform (CWT) to convert the one-dimensional time series into two-dimensional time-frequency representations (scalograms). The resulting wavelet coefficients were analyzed across six frequency bands: delta (0.4-3.99 Hz), theta (4.0-7.79 Hz), alpha (7.8-15.59 Hz), beta1 (15.6-31.19 Hz), beta2 (31.2-39.99 Hz), and gamma (40-62.4 Hz).
To prepare the data for input to the convolutional neural network (CNN), we organized the EEG channels into 20 groups of three spatially adjacent electrodes based on their proximity on the scalp. Figure 1 shows 6 triplets (groups of 3 channels) showing the highest classification accuracy. Altogether these were the electrode triplets used in this study:
{AF3, Fz, AF4}, {FC1, Fz, FC2}, {C3, Cz, C4}, {FC5, F3, FC1}, {FC6, F4, FC2}
{CP1, Pz, CP2}, {P3, Pz, P4}, {PO3, Pz, PO4}, {CP5, C3, CP1}, {CP6, C4, CP2}
{O1, Oz, O2}, {PO3, O1, Oz}, {PO4, O2, Oz}, {P7, CP5, P3}, {P8, CP6, P4}
{F7, T7, P7}, {F3, C3, P3}, {Cz, Pz, Oz}, {F4, C4, P4}, {F8, T8, P8}
For each electrode triplet, the corresponding wavelet coefficient matrices were normalized, with 1% of peak values removed to reduce the impact of outliers. These processed matrices were then combined to form RGB images, where each color channel (red, green, blue) represented the wavelet coefficients from one electrode in the triplet (Figure 2). This approach allowed us to leverage the power of convolutional neural networks designed for image processing while maintaining the spatial relationships between electrodes.
2.4 Convolutional Neural Network Model
We experimented with several convolutional neural network (CNN) including SqueezeNet, GoogleNetm Inception-v3, ResNet, to classify the wavelet-based RGB images as either PD or healthy control, but out of all tested models, a simple simple convolutional neural network (CNN) architecture achieved the highest performance and required substantially less computational resources. This choice also allowed us:
-
1.
To focus on extracting fundamental features that differentiate PD from healthy controls, demonstrating that EEG signals contain rich information about brain activity patterns even with basic model architectures.
-
2.
To address the relatively small dataset size, where models with fewer parameters are less prone to overfitting.
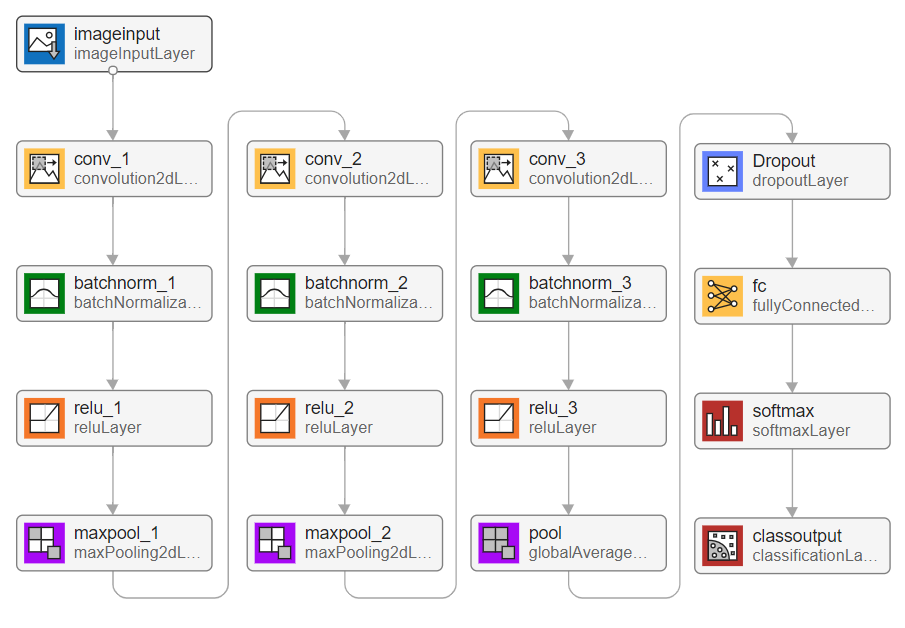
The CNN architecture, as illustrated in Figure 3, consisted of the following components:
| Layer Type | Description |
|---|---|
| Input Layer | Accepts RGB images created from wavelet coefficients |
| of electrode triplets | |
| Convolutional Layers | Three convolutional layers (16, 32, 128 filters) |
| All using 5×5 kernel size with padding of 1 | |
| Batch normalization after each convolution | |
| Activation Functions | ReLU applied after each convolutional layer |
| Pooling Layers | Max pooling (4×4, stride 4) after first two conv. blocks |
| Global average pooling after the final conv. block | |
| Dropout Layer | Applied before the fully connected layer |
| Prevents overfitting by randomly deactivating neurons | |
| Fully Connected Layer | Binary classification output (PD vs. healthy control) |
The entire project was implemented in MATLAB, including preprocessing, feature extraction, model training, and evaluation.
2.5 Hyperparameter Optimization and Training Protocol
For each window length (5, 10, and 20 seconds), we conducted a Bayesian hyperparameter search using only the all data to identify the optimal model configuration. The key hyperparameters that were optimized included: Initial Learning Rate, Dropout Rate, Momentum and Batch Size.
The optimal hyperparameters identified for each window length were:
| Hyperparameter | 5-second | 10-second | 20-second |
|---|---|---|---|
| Initial Learning Rate | 0.0034287 | 0.0065298 | 0.33049 |
| Dropout Rate | 0.25291 | 0.37323 | 0.050525 |
| Momentum | 0.11418 | 0.29409 | 0.58991 |
| Batch Size | 47 | 37 | 29 |
Networks were trained using Stochastic Gradient Descent with Momentum (SGDM) optimizer for a maximum of 100 epochs. A piecewise learning rate schedule was employed with a drop period of 20 epochs and a drop factor of 0.5.
2.6 Classification Procedure and Evaluation
To evaluate the discriminative power of different brain regions and frequency bands, we trained and tested separate CNN models for each combination of electrode triplet and frequency band. We employed a leave-one-subject-out cross-validation approach to ensure robust assessment of classification accuracy while maximizing the use of our limited dataset. In this approach, data from one subject was used for testing while data from the remaining 30 subjects were used for training. This process was repeated for each subject, resulting in 31 separate models per electrode-frequency combination.
For each model, we computed classification accuracy as the primary performance metric, defined as the percentage of correctly classified instances (both PD and healthy controls) out of the total number of test instances. The classification error was calculated as 1 - (number of correct predictions / total number of predictions). Given the balanced nature of our dataset (15 PD, 16 controls), accuracy provides a fair assessment of classification performance.
3 Results
3.1 Overall Classification Performance
The overall classification accuracy varied substantially across different window lengths, electrode triplets, and frequency bands. Table 3 summarizes the mean classification accuracy across all electrode triplets for each window length using the full frequency spectrum (0.4-62.4 Hz).
| Window Length | Mean Accuracy (All Electrodes) |
|---|---|
| 5-second windows | 61.2% 27.8% |
| 10-second windows | 63.7% 28.9% |
| 20-second windows | 65.3% 29.6% |
3.2 Electrode Groupings
To facilitate analysis based on functional neuroanatomy, we organized the 20 electrode triplets into four major groups based on their spatial distribution across the scalp (Table 4).
| Group | Electrode Triplets | Brain Regions |
|---|---|---|
| 1 | {AF3, Fz, AF4}, {FC1, Fz, FC2}, {C3, Cz, C4}, | Frontal and |
| {FC5, F3, FC1}, {FC6, F4, FC2} | Fronto-Central Regions | |
| 2 | {CP1, Pz, CP2}, {P3, Pz, P4}, {PO3, Pz, PO4}, | Central-Parietal |
| {CP5, C3, CP1}, {CP6, C4, CP2} | Regions | |
| 3 | {O1, Oz, O2}, {PO3, O1, Oz}, {PO4, O2, Oz}, | Parieto-Occipital |
| {P7, CP5, P3}, {P8, CP6, P4} | Regions | |
| 4 | {F7, T7, P7}, {F3, C3, P3}, {Cz, Pz, Oz}, | Longitudinal/Cross-Regional |
| {F4, C4, P4}, {F8, T8, P8} | Connections |
3.3 Regional Classification Accuracy
Classification accuracy varied considerably across different electrode triplets. Table 5 presents the accuracies for the best-performing electrode triplets across all window lengths using the full frequency spectrum.
| Electrode Triplet | Group | 5s Window | 10s Window | 20s Window |
|---|---|---|---|---|
| {C3, CZ, C4} | 1 | 66% 30% | 68% 32% | 76% 32% |
| {CP5, C3, CP1} | 2 | 66% 30% | 67% 30% | 69% 32% |
| {CP6, C4, CP2} | 2 | 66% 30% | 67% 30% | 68% 30% |
| {P7, CP5, P3} | 3 | 61% 28% | 63% 29% | 73% 31% |
| {P8, CP6, P4} | 3 | 65% 29% | 67% 30% | 73% 32% |
| {F8, T8, P8} | 4 | 63% 28% | 65% 29% | 68% 30% |
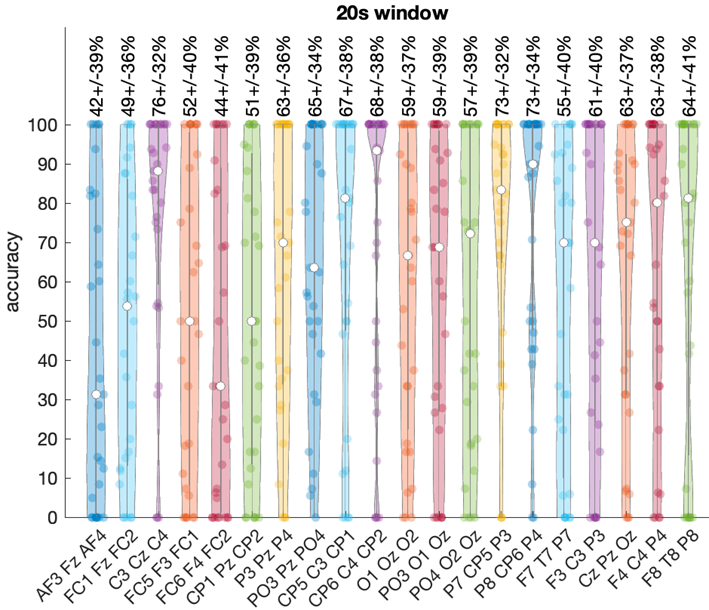
The central electrode triplet {C3, CZ, C4} from Group 1 achieved the highest overall accuracy of 76% 32% with 20-second windows. Both left ({P7, CP5, P3}) and right ({P8, CP6, P4}) parietal regions from Group 3 also demonstrated strong performance, reaching 73% 31-32% accuracy with 20-second windows. Figure 4 illustrates the variability in performance and highlights the superior accuracy of central and parietal regions. Note that because data from one subject was used for testing while data from the remaining 30 subjects were used for training, hence every violin plot contains exactly 30 points.
3.4 Group-Level Performance
Table 6 shows the mean classification accuracy for each electrode group across different window lengths.
| Electrode Group | 5s Window | 10s Window | 20s Window |
|---|---|---|---|
| 1: Frontal/Fronto-Central | 64% 29% | 66% 30% | 69% 31% |
| 2: Central-Parietal | 63% 29% | 65% 30% | 67% 30% |
| 3: Parieto-Occipital | 61% 28% | 64% 29% | 68% 31% |
| 4: Longitudinal Connections | 60% 27% | 62% 28% | 65% 29% |
Group 1 (Frontal/Fronto-Central) showed the highest mean accuracy across all window lengths, followed by Group 2 (Central-Parietal) and Group 3 (Parieto-Occipital). Group 4 (Longitudinal Connections) showed the lowest mean accuracy, though still above chance level.
3.5 Frequency Band Analysis
We analyzed the classification performance across six frequency bands: delta (0.4-3.99 Hz), theta (4.0-7.79 Hz), alpha (7.8-15.59 Hz), beta1 (15.6-31.19 Hz), beta2 (31.2-39.99 Hz), and gamma (40-62.4 Hz). Table 7 presents the classification accuracy for key electrode triplets across different frequency bands using 10-second windows.
| Electrode Triplet | Group | Delta | Theta | Alpha |
|---|---|---|---|---|
| {C3, CZ, C4} | 1 | 58% 29% | 59% 27% | 65% 29% |
| {CP5, C3, CP1} | 2 | 54% 23% | 67% 30% | 64% 28% |
| {CP6, C4, CP2} | 2 | 56% 25% | 67% 31% | 57% 26% |
| {P7, CP5, P3} | 3 | 52% 23% | 59% 27% | 58% 25% |
| {P8, CP6, P4} | 3 | 55% 24% | 60% 28% | 65% 29% |
| {PO3, PZ, PO4} | 2 | 52% 23% | 62% 28% | 57% 25% |
| {F3, C3, P3} | 4 | 51% 22% | 59% 27% | 65% 29% |
| {F8, T8, P8} | 4 | 58% 26% | 63% 28% | 65% 29% |
| {P4, O4, PO4} | 3 | 51% 22% | 58% 26% | 57% 25% |
| Electrode Triplet | Group | Beta1 | Beta2 | Gamma |
|---|---|---|---|---|
| {C3, CZ, C4} | 1 | 56% 25% | 49% 21% | 55% 24% |
| {CP5, C3, CP1} | 2 | 65% 31% | 50% 23% | 56% 25% |
| {CP6, C4, CP2} | 2 | 49% 22% | 54% 24% | 54% 24% |
| {P7, CP5, P3} | 3 | 49% 21% | 47% 21% | 51% 23% |
| {P8, CP6, P4} | 3 | 49% 22% | 44% 19% | 52% 23% |
| {PO3, PZ, PO4} | 2 | 48% 21% | 47% 21% | 47% 20% |
| {F3, C3, P3} | 4 | 49% 22% | 53% 24% | 54% 24% |
| {F8, T8, P8} | 4 | 57% 26% | 55% 25% | 52% 23% |
| {P4, O4, PO4} | 3 | 50% 22% | 54% 24% | 74% 33% |
The central-parietal region ({CP1, Pz, CP2}) from Group 2 achieved exceptionally high accuracy (74% 34%) specifically in the gamma band. Bilateral centro-parietal regions ({CP5, C3, CP1} and {CP6, C4, CP2}) from Group 2 showed strong performance (67% 30-31%) in the theta band. Multiple regions reached approximately 65% accuracy in the alpha band.
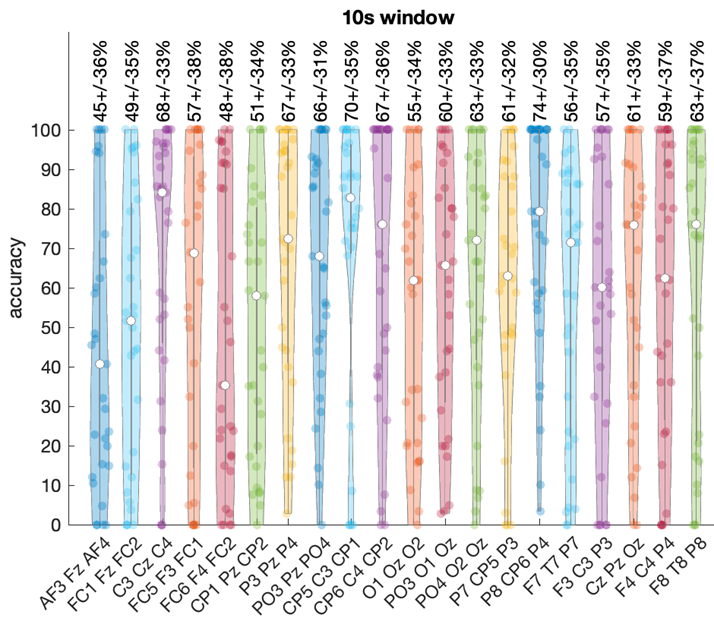
Figure 5 illustrates the distribution of classification accuracy across all electrode triplets for each frequency band using 10-second windows.
3.6 Group-Frequency Interactions
Table 8 shows the mean classification accuracy for each electrode group across different frequency bands using 10-second windows.
| Electrode Group | Delta | Theta | Alpha |
|---|---|---|---|
| 1: Frontal/Fronto-Central | 56% 25% | 59% 27% | 62% 28% |
| 2: Central-Parietal | 54% 24% | 64% 29% | 60% 27% |
| 3: Parieto-Occipital | 53% 23% | 59% 27% | 59% 26% |
| 4: Longitudinal Connections | 53% 24% | 60% 27% | 62% 28% |
| Electrode Group | Beta1 | Beta2 | Gamma |
|---|---|---|---|
| 1: Frontal/Fronto-Central | 53% 24% | 52% 23% | 55% 24% |
| 2: Central-Parietal | 55% 25% | 50% 22% | 52% 23% |
| 3: Parieto-Occipital | 49% 22% | 48% 21% | 60% 27% |
| 4: Longitudinal Connections | 52% 23% | 51% 23% | 53% 24% |
Each electrode group showed distinct patterns of frequency-specific discriminative power. Group 1 (Frontal/Fronto-Central) showed the highest accuracy in the alpha band. Group 2 (Central-Parietal) showed peak performance in the theta band. Group 3 (Parieto-Occipital) showed notable performance in the gamma band. However, the highest gamma band accuracy was achieved by the central-parietal triplet {CP1, Pz, CP2} from Group 2. Group 4 (Longitudinal Connections) showed highest accuracy in the alpha band.
3.7 Topographical Patterns
Topographical maps were generated to visualize the spatial distribution of classification accuracy across the scalp for each frequency band. Figure 6 presents the topographical distribution of classification accuracy across different frequency bands using 20-second windows, revealing distinct spatial patterns of discriminative power. These maps demonstrate how the ability to distinguish between PD patients and healthy controls varies across the scalp and frequency spectrum.
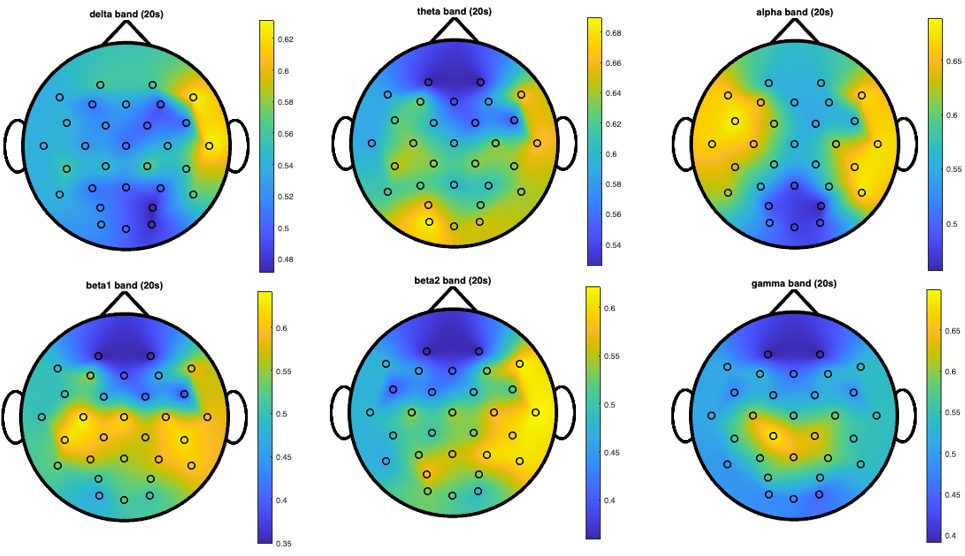
It is important to note that the color scales vary across different topographical maps, with yellow representing different peak accuracy values in each map (ranging from approximately 56% in some bands to 74% in others). This calibration allows for better visualization of the spatial patterns within each frequency band. Despite these scale differences, consistent spatial patterns emerge across window lengths, indicating robust regional EEG alterations associated with PD. In particular, the gamma band shows a focal peak of high discriminative power specifically in the central-parietal region, representing the most striking and well-defined spatial pattern across all frequency bands. This midline emphasis in gamma oscillations is particularly notable as it achieves the highest individual frequency-specific accuracy (74% in the {CP1, Pz, CP2} triplet) and persists across all window lengths. The theta band demonstrates bilateral centro-parietal discriminative power. The alpha band shows a more distributed pattern with multiple regions of high discriminative power.
A consistent pattern across multiple frequency bands is the right-hemisphere emphasis in classification accuracy, particularly evident in the delta, beta2, and gamma bands. This lateralization of EEG alterations suggests asymmetric neurophysiological effects of PD on brain oscillatory activity, with more pronounced or detectable changes in right-hemisphere regions involved in visuospatial processing and sensorimotor integration.
4 Discussion
4.1 Interpretation of Spatial-Spectral Patterns
Our results demonstrate distinct spatial-spectral EEG patterns that differentiate PD patients from healthy controls, with several specific regions and frequency bands showing particularly strong discriminative power.
4.1.1 Functional Group Analysis
By organizing electrode triplets into four functional groups, we identified how PD differentially affects various brain networks:
Group 1 (Frontal/Fronto-Central regions) achieved the highest overall accuracy (69% with 20-second windows), with the central electrode triplet {C3, CZ, C4} reaching 76% accuracy. This finding aligns with PD’s well-documented disruption of cortico-basal ganglia-thalamo-cortical motor circuits [1, 2]. The central electrodes’ high discriminative power likely reflects underlying pathophysiological changes in primary motor and premotor areas essential for movement planning and execution.
Group 2 (Central-Parietal regions) demonstrated notable frequency-specific patterns, with particularly high classification accuracy in the theta band (64% mean, individual triplets reaching 67%) and, most remarkably, the central-parietal triplet {CP1, Pz, CP2} achieving 74% accuracy in the gamma band. These regions mediate sensorimotor integration—translating sensory input into motor commands—functions increasingly recognized as compromised in PD [19, 20]. The frequency-specific performance suggests distinct oscillatory mechanisms are affected in these integration processes.
Group 3 (Parieto-Occipital regions) showed moderate overall accuracy but interesting frequency-specific performance. The involvement of these visual processing and visuospatial integration regions supports growing evidence that visual dysfunction represents a significant non-motor component of PD pathophysiology [21].
Group 4 (Longitudinal Connections) captured anterior-to-posterior connectivity patterns with notable performance in the alpha band (62%). This suggests PD disrupts long-range communication networks, potentially explaining the integration difficulties observed clinically.
4.1.2 Central and Parietal Involvement: Neuroanatomical Significance
The superior performance of central electrodes (76% accuracy with 20-second windows) directly corresponds to PD’s impact on motor circuitry. Similarly, the high classification accuracy in bilateral parietal regions (73%) aligns with Borghammer’s findings of reduced parietal blood flow in PD patients [19]. These parietal abnormalities may contribute to deficits in spatial awareness and sensorimotor integration evident even in early disease stages [20].
4.1.3 Frequency-Specific Alterations
The frequency-specific patterns identified reveal how PD affects distinct neural mechanisms:
The exceptionally high gamma band (40-62.4 Hz) accuracy in central-parietal electrodes (74%) represents our most striking finding. This suggests PD significantly disrupts high-frequency synchronization in regions critical for sensorimotor integration. While gamma oscillations typically facilitate feature binding and attention [22], their specific alteration in PD has been underexplored. These midline regions integrate diverse sensory inputs for coordinated movement, with gamma oscillations potentially binding this information across cortical areas. The observed gamma alterations may contribute to the movement initiation and coordination difficulties characteristic of PD.
Our finding of high gamma band discriminative power aligns with the emerging understanding of gamma oscillations in PD. Two distinct types of gamma activity in PD were identified: a ”finely-tuned gamma” (70-80 Hz) observed only in the ON medication state and typically associated with dyskinesias, and a broader ”movement-related” gamma that increases during voluntary movement [23]. The gamma band (40-62.4 Hz) alterations we observed in the central-parietal and right parieto-occipital regions might represent a resting-state manifestation of abnormal gamma processing that becomes more pronounced during movement. Importantly, our findings extend previous knowledge by demonstrating that these gamma alterations can be detected in scalp EEG recordings, not just in invasive local field potential (LFP) recordings from deep brain structures as most previous research has shown.
The bilateral centro-parietal theta band (4.0-7.79 Hz) alterations (67% accuracy) may partially reflect tremor-related activity that remains after artifact cleaning, as parkinsonian tremor typically falls within this frequency range. Additionally, these alterations likely reflect disruptions in cognitive processes including working memory and attention—functions frequently compromised in PD [6]. Prior research has documented increased theta activity in PD [24], possibly reflecting compensatory mechanisms or pathological synchronization.
4.2 Neurophysiological Mechanisms
Recent comprehensive reviews of brain oscillations in PD conceptualize the disease as an ”oscillopathy” [23], with distinct oscillatory patterns associated with different clinical states and symptoms. Within this framework, our findings of altered gamma and theta oscillations in specific cortical regions contribute to this broader understanding of PD’s oscillatory signatures.
Several complementary mechanisms likely underlie our observed EEG alterations:
4.2.1 Dopaminergic Pathways and Network-Wide Effects
PD’s characteristic dopaminergic depletion disrupts the balance between facilitatory and inhibitory basal ganglia pathways, ultimately altering thalamocortical circuits [1]. This disruption manifests in our results as altered oscillatory patterns, particularly in frontal/fronto-central regions most directly connected to these pathways. The relationship between dopamine levels and EEG features is supported by George et al.’s demonstration that dopaminergic medication decreases cortical beta coherence in PD patients [15].
These primary pathological changes interact with compensatory mechanisms, creating what Voytek and Knight termed ”network dysrhythmia” [16]—abnormal oscillatory patterns across interconnected neural networks. This framework helps explain why different brain regions showed distinct frequency preferences in our analysis. The central-parietal regions’ dual sensitivity in both theta and gamma bands, contrasting with other regions’ different frequency preferences, suggests PD affects various functional networks through distinct mechanisms, potentially involving multiple neurotransmitter systems.
4.2.2 Sensorimotor Integration and Network Connectivity
The exceptional gamma band discriminative power in central-parietal regions likely represents disrupted sensorimotor integration processes. These midline areas integrate multiple sensory inputs crucial for coordinated movement. Recent evidence indicates that pathological -synuclein aggregation affects not only basal ganglia but multiple brain regions through various mechanisms [28], potentially explaining these cortical oscillatory alterations.
The alpha-band sensitivity in longitudinal connections further supports a network-level disruption model. Alpha oscillations typically coordinate activity across large-scale brain networks, and their disruption may reflect impaired communication between frontal control regions and posterior sensory areas—potentially contributing to the sensorimotor integration deficits characteristic of PD.
4.2.3 Cross-frequency Coupling and Network Dynamics
While our study focused on power changes across different frequency bands, recent work has highlighted the importance of cross-frequency coupling in PD pathophysiology. In particular, as mentioned earlier Foffani and Alegre describe significant coupling between beta oscillations and high-frequency oscillations in the basal ganglia of PD patients, with the strength of this coupling correlating with symptom severity [23]. Future EEG studies should investigate whether such cross-frequency coupling can be detected at the scalp level, potentially providing even more sensitive biomarkers than power changes in individual frequency bands. Our finding of concurrent alterations in multiple frequency bands (gamma, theta, and alpha) across different but overlapping cortical regions suggests possible disruptions in the normal coupling relationships between these oscillations, which may reflect fundamental network-level dysfunction in PD.
4.3 Contributions and Implications
Our approach offers several advances in understanding PD-related EEG alterations:
By organizing electrodes into neuroanatomically meaningful groups, we provide a more nuanced understanding of how PD affects distinct functional brain networks compared to global or electrode-wise analyses.
Our results identify specific biomarker candidates, particularly central-parietal gamma activity and central region full-spectrum activity, which achieved the highest classification accuracies. These spatial-spectral patterns could potentially be developed into targeted biomarkers for PD detection.
The demonstration that different frequency bands show maximal discriminative power in different brain regions highlights the region-dependent nature of PD’s effects on neural oscillations. This spatial-spectral specificity suggests that future diagnostic approaches should consider multiple frequency bands rather than focusing solely on single-band alterations.
The aforementioned findings is especially important in the context of beta oscillations and their coupling with high-frequency oscillations, as they are increasingly being used as control signals for adaptive deep brain stimulation [23]. While these approaches currently rely on invasive recordings, our demonstration that discriminative oscillatory patterns can be detected non-invasively through EEG suggests potential pathways toward less invasive neuromodulation approaches. The spatial specificity of our findings—particularly the central-parietal gamma and right parieto-occipital gamma patterns—might inform the development of targeted non-invasive stimulation protocols using techniques such as transcranial alternating current stimulation at these specific frequencies and locations.
4.4 Methodological Considerations
4.4.1 Segment-Level Classification and Variability
The high standard deviations (approximately 20-33%) across electrode triplets and frequency bands reflect our segment-by-segment classification approach. Rather than aggregating predictions at the subject level, we classified each EEG window independently—increasing statistical variability but providing insight into the temporal dynamics of EEG alterations in PD.
Despite this window-level variability, the consistency of spatial-spectral patterns across different window lengths supports our findings’ robustness. The superior performance of longer windows (20 seconds) compared to shorter ones (5 or 10 seconds) suggests PD-related EEG alterations manifest as subtle but persistent oscillatory pattern changes rather than transient events.
4.4.2 Classification Accuracy in Context
While our maximum classification accuracy of 76% demonstrates significant discriminative power, it appears modest compared to some recently reported accuracies in PD EEG classification exceeding 95%. This difference merits explanation, particularly as chance classification in our balanced dataset would yield approximately 51% accuracy.
First and foremost, our rigorous artifact rejection procedures intentionally targeted tremor-related components that contaminate EEG recordings in PD patients. Parkinsonian tremor typically manifests as 4-6 Hz oscillations that propagate throughout the EEG montage via volume conduction, creating a powerful—but clinically trivial—classification feature. Li et al. reported near-perfect classification accuracy (98.68% on the same San Diego dataset we used) using a ”2D-MDAGTS model and multi-scale fuzzy entropy” approach [29], but critically, their methodology does not describe specific muscle artifact removal procedures. Similar concerns apply to several other high-accuracy studies in Maitín’s systematic review [10].
We deliberately chose to remove tremor artifacts despite their classification utility because our research question specifically targeted intrinsic neurophysiological alterations in cortical activity rather than mechanical tremor detection. Including tremor artifacts would artificially inflate classification accuracy while obscuring the genuine neural oscillatory patterns of interest—essentially detecting PD through what amounts to an EEG-based accelerometer rather than through neurophysiological signatures.
Second, our leave-one-subject-out cross-validation approach represents a substantially more stringent evaluation methodology than the session-based or random-split cross-validation employed in many higher-accuracy reports. This approach eliminates the possibility that person-specific EEG characteristics unrelated to PD status (e.g., skull thickness, electrode impedance) contribute to classification performance.
Third, we evaluated single electrode triplets rather than combining features across the entire electrode montage. While feature fusion approaches typically yield higher accuracy, our electrode-specific approach enabled precise spatial-spectral mapping of discriminative power—revealing important regional effects that would be obscured in whole-brain classification models.
5 Limitations and Future Directions
5.0.1 Dataset Limitations
Our study used a relatively small dataset (15 PD patients, 16 healthy controls) from the University of San Diego. While our cross-validation approach and segment-level analysis helped maximize the statistical validity of our findings, the small sample size limits generalizability. Future studies should validate these findings in larger, more diverse cohorts.
Additionally, the dataset lacked detailed clinical information about disease severity, medication status, and specific symptom profiles. This information would be valuable for correlating EEG alterations with clinical features and understanding how these markers relate to different PD phenotypes.
5.0.2 Methodological Considerations
The high standard deviations in our classification results reflect the segment-by-segment approach and the inherent variability of EEG signals.
Our analysis focused on resting-state EEG with eyes open. Different EEG conditions, such as eyes closed or task-related recordings, might reveal additional discriminative patterns. Comparing eyes-open and eyes-closed conditions could be particularly informative for understanding the sensorimotor integration alterations we observed.
5.0.3 Future Research Directions
The spatial-spectral EEG patterns identified in this study—particularly the central-parietal gamma activity and centro-parietal theta alterations—suggest several targeted avenues for future investigation:
Most critically, our findings of 74% classification accuracy in the gamma band for right parieto-occipital electrodes (P4, O4, PO4) warrant validation in prodromal PD populations. Specifically, longitudinal monitoring of individuals with idiopathic REM sleep behavior disorder (iRBD), who convert to clinical PD at rates of 40-75% within 10 years, could determine whether these gamma-band abnormalities appear before motor symptoms emerge.
The pronounced right-hemisphere involvement identified across several frequency bands raises important questions about lateralization of early pathophysiological changes in PD. Future research should examine whether this asymmetry correlates with side of initial motor symptom presentation, which would link our EEG findings directly to the known asymmetric degeneration pattern in early PD. The high discriminative power in gamma bands (40-62.4 Hz) specifically calls for experimental designs incorporating tasks known to modulate gamma activity, such as visual processing paradigms, to determine whether task-evoked gamma responses might provide even stronger classification accuracy than resting-state measures.
Beyond PD, the wavelet-based electrode-triplet methodology developed here could be applied to other neurodegenerative disorders with potential oscillatory signatures, particularly dementia with Lewy bodies, which shares -synuclein pathology with PD but presents with different clinical features.
6 Conclusion
This study mapped PD-related EEG alterations across multiple cortical regions and frequency bands, revealing specific spatial-spectral signatures with diagnostic potential. Most notably, we identified a pronounced central-parietal gamma band (40-62.4 Hz) alteration that achieved 74% classification accuracy, alongside robust discriminative power (76%) in central electrodes using full-spectrum analysis. Unexpectedly, right hemisphere involvement was prominent, particularly in parieto-occipital regions, challenging the traditional focus on left-dominant manifestations in PD literature.
The remarkable performance of gamma oscillations in sensorimotor integration regions directly links our findings to emerging theories of network dysrhythmia in PD. The 20-second window’s superior performance over shorter segments suggests these oscillatory abnormalities represent stable pathophysiological features rather than transient phenomena. The observed theta band sensitivity in bilateral centro-parietal regions and widespread alpha alterations further substantiate a complex, region-specific pattern of neural synchronization disruption that extends beyond the classical cortico-basal ganglia motor circuits.
Future longitudinal studies examining these markers in prodromal populations will be essential to support our results and employ them for early detection and intervention in Parkinson’s disease.
Acknowledgement
This work was partially funded by Our Health in Our Hands (OHIOH), a strategic initiative of the Australian National University (ANU), whose objective is to transform healthcare by developing new personalized health technologies and solutions in collaboration with patients, clinicians, and health care providers.
References
- [1] L. V. Kalia, A. E. Lang, Parkinson’s disease, The Lancet 386 (9996) (2015) 896–912.
- [2] J. Jankovic, Parkinson’s disease: clinical features and diagnosis, Journal of Neurology, Neurosurgery & Psychiatry 79 (4) (2008) 368–376.
- [3] A. J. Noyce, A. J. Lees, A.-E. Schrag, Meta-analysis of early nonmotor features and risk factors for parkinson disease, Annals of Neurology 80 (1) (2016) 19–31.
- [4] D. P. Breen, R. Vuono, U. Nawarathna, K. Fisher, J. M. Shneerson, A. B. Reddy, R. A. Barker, Sleep and circadian rhythm regulation in early parkinson disease, JAMA Neurology 71 (5) (2014) 589–595.
- [5] R. L. Doty, Olfactory dysfunction in parkinson disease, Nature Reviews Neurology 8 (6) (2012) 329–339.
- [6] S. K. Darweesh, V. J. Verlinden, H. H. Adams, A. G. Uitterlinden, A. Hofman, B. H. Stricker, C. M. van Duijn, P. J. Koudstaal, M. A. Ikram, The spectrum of prediagnostic features in prodromal parkinson disease, Neurology 87 (20) (2016) 2148–2155.
- [7] M. X. Cohen, Analyzing neural time series data: theory and practice, MIT press, 2014.
- [8] J. Li, B. Deng, Y. Guo, J. Zhang, J. Wang, J. Yan, X. Wei, Abnormal eeg complexity and functional connectivity of brain in patients with acute thalamic ischemic stroke, Computational and Mathematical Methods in Medicine 2020 (2020).
- [9] A. Morita, S. Kamei, K. Serizawa, T. Mizutani, Eeg spectral analysis in parkinson’s disease: relation to motor symptoms and wais-r, Clinical Neurology 49 (9) (2009) 538–543.
- [10] A. H. Maitín, J. L. Ooijevaar, W. Desmet, B. Weyn, A systematic review of parkinson’s disease classification methods based on electroencephalogram signals, Sensors 20 (23) (2020) 6791.
- [11] M. Sazgar, M. G. Young, Practical guide for clinical neurophysiologic testing: EEG, Lippincott Williams & Wilkins, 2019.
- [12] J. A. Weyhenmeyer, M. E. Hernandez, C. Lainscsek, T. J. Sejnowski, H. Poizner, A study of individual variations in multiple functional measures of human brain activity, PLoS One 9 (7) (2014) e102956.
- [13] E. M. Whitham, K. J. Pope, S. P. Fitzgibbon, T. W. Lewis, C. R. Clark, S. Loveless, M. Broberg, A. Wallace, D. DeLosAngeles, P. Lillie, et al., Scalp electrical recording during paralysis: quantitative evidence that eeg frequencies above 20 hz are contaminated by emg, Clinical Neurophysiology 118 (8) (2007) 1877–1888.
- [14] N. C. Swann, C. de Hemptinne, A. R. Aron, J. L. Ostrem, R. T. Knight, P. A. Starr, Elevated synchrony in parkinson disease detected with electroencephalography, Annals of Neurology 78 (5) (2015) 742–750.
- [15] J. S. George, J. Strunk, R. Mak-McCully, M. Houser, H. Poizner, A. R. Aron, Dopaminergic therapy in parkinson’s disease decreases cortical beta band coherence in the resting state and increases cortical beta band power during executive control, NeuroImage: Clinical 3 (2013) 261–270.
- [16] N. Jackson, S. R. Cole, B. Voytek, N. C. Swann, Characteristics of waveform shape in parkinson’s disease detected with scalp electroencephalography, eNeuro 6 (3) (2019).
- [17] S. Appelhoff, M. Sanderson, T. Brooks, M. Vliet, R. Quentin, C. Holdgraf, M. Chaumon, E. Mikulan, K. Tavabi, R. Höchenberger, et al., Mne-bids: Organizing electrophysiological data into the bids format and facilitating their analysis, Journal of Open Source Software 4 (44) (2019) 1896.
- [18] C. R. Pernet, S. Appelhoff, K. J. Gorgolewski, G. Flandin, C. Phillips, A. Delorme, R. Oostenveld, Eeg-bids, an extension to the brain imaging data structure for electroencephalography, Scientific Data 6 (1) (2019) 1–5.
- [19] P. Borghammer, K. Østergaard, P. Cumming, A. Gjedde, A. Rodell, N. Hall, M. M. Chakravarty, Parietal perfusion alterations in parkinson’s disease patients without dementia, Frontiers in Neurology 11 (2020) 562.
- [20] K. Karádi, T. Lucza, Z. Aschermann, S. Komoly, L. Dézsi, L. Kornya, N. Kóvács, Visuospatial dysfunction in parkinson’s disease, Journal of the Neurological Sciences 354 (1-2) (2015) 77–83.
- [21] R. S. Weil, A. E. Schrag, J. D. Warren, S. J. Crutch, A. J. Lees, H. R. Morris, Visual dysfunction in parkinson’s disease, Brain 139 (11) (2016) 2827–2843.
- [22] L. Melloni, W. Singer, E. Rodriguez, D. Poeppel, The binding problem in perception, attention and consciousness, Neuroscience of Consciousness 2017 (1) (2017) nix007.
-
[23]
G. Foffani, M. Alegre,
Chapter
18 - brain oscillations and parkinson disease, in: A. Quartarone, M. F.
Ghilardi, F. Boller (Eds.), Neuroplasticity, Vol. 184 of Handbook of Clinical
Neurology, Elsevier, 2022, pp. 259–271.
doi:https://doi.org/10.1016/B978-0-12-819410-2.00014-X.
URL https://www.sciencedirect.com/science/article/pii/B978012819410200014X - [24] C.-Y. Han, J. Wang, G.-S. Yi, Y.-Q. Che, Increased thalamocortical coherence in patients with parkinson’s disease, Neural Regeneration Research 8 (36) (2013) 3413.
- [25] R. Soikkeli, J. Partanen, H. Soininen, A. Pääkkönen, P. Riekkinen, Eeg findings in parkinson’s disease with and without dementia, Journal of Neurology, Neurosurgery & Psychiatry 54 (10) (1991) 869–875.
- [26] M. Moazami-Goudarzi, J. Sarnthein, L. Michels, R. Moukhtieva, D. Jeanmonod, Quantitative eeg findings in patients with parkinson’s disease and cognitive impairment, Frontiers in Neurology 10 (2019) 398.
- [27] A. Tessitore, M. Amboni, F. Esposito, A. Russo, M. Picillo, L. Marcuccio, M. T. Pellecchia, C. Vitale, M. Cirillo, G. Tedeschi, et al., Resting-state brain connectivity in patients with parkinson’s disease and freezing of gait, Parkinsonism & Related Disorders 18 (6) (2012) 781–787.
- [28] K. Menšíková, R. Matěj, C. Colosimo, E. Rǔžička, J. Roth, Lewy body disease or diseases with lewy bodies?, npj Parkinson’s Disease 8 (1) (2022) 3. doi:10.1038/s41531-021-00273-9.
-
[29]
J. Li, X. Li, Y. Mao, J. Yao, J. Gao, X. Liu,
Classification
of parkinson’s disease eeg signals using 2d-mdagts model and multi-scale
fuzzy entropy, Biomedical Signal Processing and Control 91 (2024) 105872.
doi:https://doi.org/10.1016/j.bspc.2023.105872.
URL https://www.sciencedirect.com/science/article/pii/S1746809423013058