Charge disproportionation and Hund’s insulating behavior in a five-orbital Hubbard model applicable to perovskites
Abstract
We explore the transition to a charge-disproportionated insulating phase in a five-orbital cubic tight-binding model applicable to transition-metal perovskites with a formal occupation of the transition-metal cation, such as ferrates or manganites. We use dynamical mean-field theory to obtain the phase diagram as a function of the average local Coulomb repulsion and the Hund’s coupling . The main structure of the phase diagram follows from the zero band-width (atomic) limit and represents the competition between high-spin and low-spin homogeneous and an inhomogeneous charge-disproportionated state. This results in two distinct insulating phases: the standard homogeneous Mott insulator and the inhomogeneous charge-disproportionated insulator, recently also termed Hund’s insulator. We characterize the unconventional nature of this Hund’s insulating state. Our results are consistent with previous studies of two- and three-orbital models applicable to isolated and subshells, respectively, with the added complexity of the low-spin/high-spin transition. We also test the applicability of an effective two-orbital (-only) model with disordered core spins. Our results show that the overall features of the phase diagram in the high-spin region are well described by this simplified two-orbital model but also that the spectral features exhibit pronounced differences compared to the full five-orbital description.
I Introduction
Many of the fascinating properties of transition-metal oxides can be understood as a result of the strong Coulomb interaction, experienced by electrons in the rather localized orbitals, in combination with their mixed ionic-covalent character, which is due to hybridization between the transition-metal orbitals and the orbitals of the surrounding oxygen ligands. The resulting electronic structure is then often in the border regime between itinerant and localized, where the electrons experience strong correlations that can give rise to a number of intriguing properties such as, e.g., metal-insulator transitions [1].
Such correlation effects and the emergence of a Mott-insulating state are usually associated with a large value of the Hubbard parameter , which describes the repulsion between electrons located on the same site in the seminal Hubbard model [2; 3]. However, in multi-band Hubbard models, strong correlations, i.e., pronounced deviations from the behavior of (effectively) non-interacting particles, can also be caused by the Hund’s coupling , even if the corresponding system is not particularly close to a Mott-insulating phase [4]. Such materials have recently been termed Hund’s metals [5; 6; 7].
Furthermore, a strong Hund’s coupling can even lead to the formation of an inhomogeneous, charge-ordered or charge-disproportionated, insulating phase, distinct from the usual (homogeneous) Mott-insulator. The existence of such a charge-disproportionated insulator (CDI) has been demonstrated both for a two-orbital and a three-orbital Hubbard model [8; 9; 10], which are applicable to materials with partially filled and sub-shells. Similar physics have also been discussed in the context of valence-skipping metals and insulators resulting from a negative effective Coulomb interaction [11].
The CDI phase has also been termed Hund’s insulator [9; 10; 12], to emphasize the crucial role of the Hund’s interaction for stabilizing the insulating state and to distinguish it from the usual (homogeneous) Mott-insulator. We use the terms CDI and Hund’s insulating phase interchangeably throughout this article, but we also note that earlier papers have used the term Hund’s insulator in slightly different contexts, e.g., to describe situations with half-filled shells where the Hund’s coupling cooperates with the Hubbard and the value of alone is not sufficient to reach an insulating state [13] or in specific cases where Hund’s coupling leads to the stabilization of a topological insulating phase [14].
The parameter regime where a CDI or Hund’s insulator is observed corresponds to an electronic structure where the Coulomb interaction is strongly screened, which leads to a moderate value of the Hubbard parameter , whereas the Hund’s parameter is less affected by the screening. This regime is expected to occur in transition-metal oxides with a pronounced charge transfer character, i.e., strong hybridization between the transition-metal and oxygen bands. This can generally be expected to occur towards the end of the 3 transition-metal series or for systems with high oxidation numbers of the transition-metal cation.
The formation of a charge-disproportionated insulating phase has been observed, e.g., in the series of rare earth nickelates, NiO3 [15; 16; 17; 18; 8; 19; 20]. Here, the Ni cations are in a formal electron configuration, which then disproportionates according to (or, equivalently, , where denotes a ligand hole in the surrounding oxygen network [21; 22]). In this case the subshell is always completely filled with six electrons, and the remaining Ni- electron occupies the subshell. It has been shown that the underlying physics can be well described within a minimal two-orbital Hubbard model with an average quarter-filling [8]. Furthermore, the charge disproportionation lowers the symmetry of the crystal structure and couples strongly with a lattice distortion corresponding to a breathing mode of the octahedral network with symmetry, resulting in a three-dimensional checkerboard-like pattern of alternating small and large oxygen octahedra surrounding the nominal and Ni sites, respectively.
Similar behavior has also been observed for the alkaline earth ferrate CaFeO3 [23; 24; 25; 26; 27] and in PbCrO3 [28; 29]. The case of PbCrO3 is potentially more complex due to the presence of the stereochemically active Pb2+ cation. However, the nominal configuration of the Cr4+ cation and the suggested charge disproportionation according to is consistent with recent theoretical predictions for the three-orbital Hubbard model [9]. On the other hand, the Fe4+ cation in CaFeO3 is assumed to be in a nominal high spin configuration [30], with partial filling of both and subshells, and thus requires a description using the full five-orbital manifold. Additionally, the competition between high-spin and low-spin states might introduce further complexity in the underlying physics.
Motivated by this, we study a full five-orbital Hubbard model with electron filling. We note that, while our main motivation is to study the possible emergence of a charge disproportionated state in a rather generic five-orbital TB model, we fit the parameters of this model to the actual bandstructure of CaFeO3 in order to work with realistic values for bandwidth and crystal-field splittings. Thus, we consider the physically relevant case with cubic symmetry by incorporating a crystal-field splitting between the three-fold degenerate lower-lying states and the two-fold degenerate higher-lying states. We use dynamical mean-field theory (DMFT) to calculate expectation values of this model around room temperature. This allows us to identify all relevant phases as function of the local interaction parameters and , describing the average Coulomb repulsion and Hund’s coupling within the -shell.
In particular, we establish the presence of a spontaneously charge-disproportionated insulating phase in this five-orbital model, in addition to the usual homogeneous Mott-phase. The overall structure of the phase diagram resembles analogous results for the two- and three-orbital models, but with the additional feature of low-/high-spin transitions. We analyze the character of the insulating state, and we explore the effect of a structurally induced energy difference between the states on the two different sub-lattices as well as the effect of a reduced band width. Furthermore, we compare the phase diagram obtained for the full five-orbital model, with an effective two-orbital model, applicable to the high-spin limit [31; 32]. This simplified model is able to quantitatively reproduce many features of the full five-orbital model, including, e.g, the phase boundaries as function of the interaction parameters, but also exhibits pronounced differences in the spectral properties.
II Model and methods
In this section, we first introduce the models that we are studying: the complete five-orbital model for the full shell and the effective two-orbital model with localized spins. We then describe how the parameters of the models are fitted to the band structure of CaFeO3 obtained from density functional theory (DFT). Finally, we describe the details of our DMFT calculations and introduce the observables used to characterize the different phases.
II.1 The Hamiltonian
We study the following model, which consists of a single-particle tight-binding (TB) part and a local interaction on each site :
| (1) |
The TB part consists of inter-site hopping terms as well as an on-site crystal-field splitting, , between and orbitals. We include hopping between nearest neighbors (NN) and next-nearest neighbors (NNN) on a cubic lattice, representing the sites of the transition-metal cations in the perovskite structure. The hopping amplitudes are assumed to have the cubic symmetry corresponding to and orbitals. Thus, between nearest neighbors there is only hopping between orbitals of the same type and no hopping connecting the and orbitals. For simplicity, we neglect next-nearest neighbor hopping between different and between and orbitals, and we assume the same fixed ratio between the NNN and NN hopping amplitudes for both and orbitals. For the orbitals, and correspond to the hopping between orbitals along and along or , respectively, see Ref. 33.
We also perform calculations where we introduce an intrinsic “site splitting” of the levels, by raising, respectively lowering, the local on-site energy of the orbitals on adjacent sites by . This mimics the effect of the structural breathing mode distortion that typically accompanies the charge disproportionation in perovskites (see, e.g., Ref. 34). As described in Sec. I, this distortion consists in a spatially alternating expansion and compression of the oxygen octahedra surrounding the transition-metal sites, resulting in a three-dimensional checkerboard-like pattern of large and small octahedra.
To describe the local electron-electron interaction within the five-orbital shell, we use the so-called Slater parametrization in the density-density approximation (see, e.g., Ref. 35):
| (2) |
This term is purely local and identical for each transition-metal site (we therefore suppress the site index in Eq. (II.1)). Thereby, is the occupation number operator for orbital with spin (on site ) and is short for . The matrix elements and are parametrized in terms of the Slater integrals , , and in the usual form [35]. The Slater integrals themselves are expressed in terms of the average Coulomb repulsion and Hund’s rule interaction , using a fixed ratio [35].
II.2 The effective two-orbital approximation
We also compare the full five-orbital -shell model to a simplified effective two-orbital model, applicable to the high-spin limit. In this model, the occupation of the states on each site is fixed to three electrons, giving rise to an core spin, and hopping in and out of these states is neglected [31; 32]. The remaining electron is thus constrained to the orbitals, but can still hop from site to site. Then, for every site, the core spin defines a local spin quantization axis, and the spins of the electrons are defined relative to this local axis, denoted by /.
The electrons interact with the core spins through an effective Hund’s rule interaction, which leads to a local spin splitting of the orbitals:
| (3) |
where is the effective magnetic field created by the core spin. The strength of this effective magnetic field can be related to the parameters of the full interaction Hamiltonian, Eq. (II.1), in particular to the Hund’s interaction parameter , by considering the energy gain (penalty) of an spin (anti-)parallel to the core spin, i.e., by considering the energy difference between and :
| (4) |
Furthermore, assuming a completely random, i.e., paramagnetic orientation of the core spins on the different sites results in a renormalization of the hopping amplitudes, enabling also hopping between and states corresponding to different sites. After averaging over all possible relative spin orientations, this can be described by a matrix , which does not affect the on-site Hamiltonian () but renormalizes and mixes the inter-site hopping terms () according to [31; 32]:
| (5) |
To enable a consistent comparison with the full five-orbital model, the interaction in the effective two-orbital model is described using the subspace of the full interaction Hamiltonian, Eq. (II.1). This is equivalent to the density-density approximation of the so-called Kanamori Hamiltonian [3], but with the corresponding interaction parameters defined in terms of the Slater integrals (or in terms of the average Coulomb repulsion and the corresponding Hund’s rule interaction ).
II.3 Fitting the parameters of the TB model
The purpose of this work is to study the physics of charge disproportionation in a relatively generic cubic five-orbital model. Nevertheless, we focus on realistic parameter regimes, applicable to perovskite transition-metal oxides and closely related materials. We therefore obtain parameters for the single-particle part of the Hamiltonian, , by comparison with the full band structure of CaFeO3, calculated within density functional theory (DFT).
We perform DFT calculations using the “Vienna Ab-initio Simulation Package” (VASP) [36; 37] employing the PBEsol exchange-correlation functional [38], both for the high-temperature structure, where all Fe sites are equivalent, and the charge-disproportionated crystal structure observed below [39; 27]. We use a -point mesh for the 20-atom unit cell and a plane-wave energy cutoff of to ensure well converged results.
We first relax unit-cell parameters as well as atomic positions within symmetry. In order to stabilize the high-spin state of the Fe cation, a Hubbard-corrected DFT+ treatment and the presence of antiferromagnetic (AFM) order is required. We find that moderate values of and and A-type antiferromagnetic order (as proxy for the more complicated helical spin structure in CaFeO3 [40]) result in structural parameters that are in good agreement with experimental data (e.g., the calculated unit cell volume is ) [39; 26]. We then re-relax the atomic positions within non-spin-polarized DFT (to exclude any structural effects or symmetry lowering stemming from the magnetic order) but with lattice parameters fixed to the ones obtained from the magnetic calculations. We note that a non-magnetic DFT calculation leads to a low-spin state of the Fe cation, which would result in an unrealistically low unit-cell volume.
To obtain a realistic estimate of the site-splitting , we manually add a breathing mode of , very similar to the experimentally observed amplitude [26], while keeping all other structural parameters unchanged. A full DFT+ study of CaFeO3 has been presented in Ref. 41.
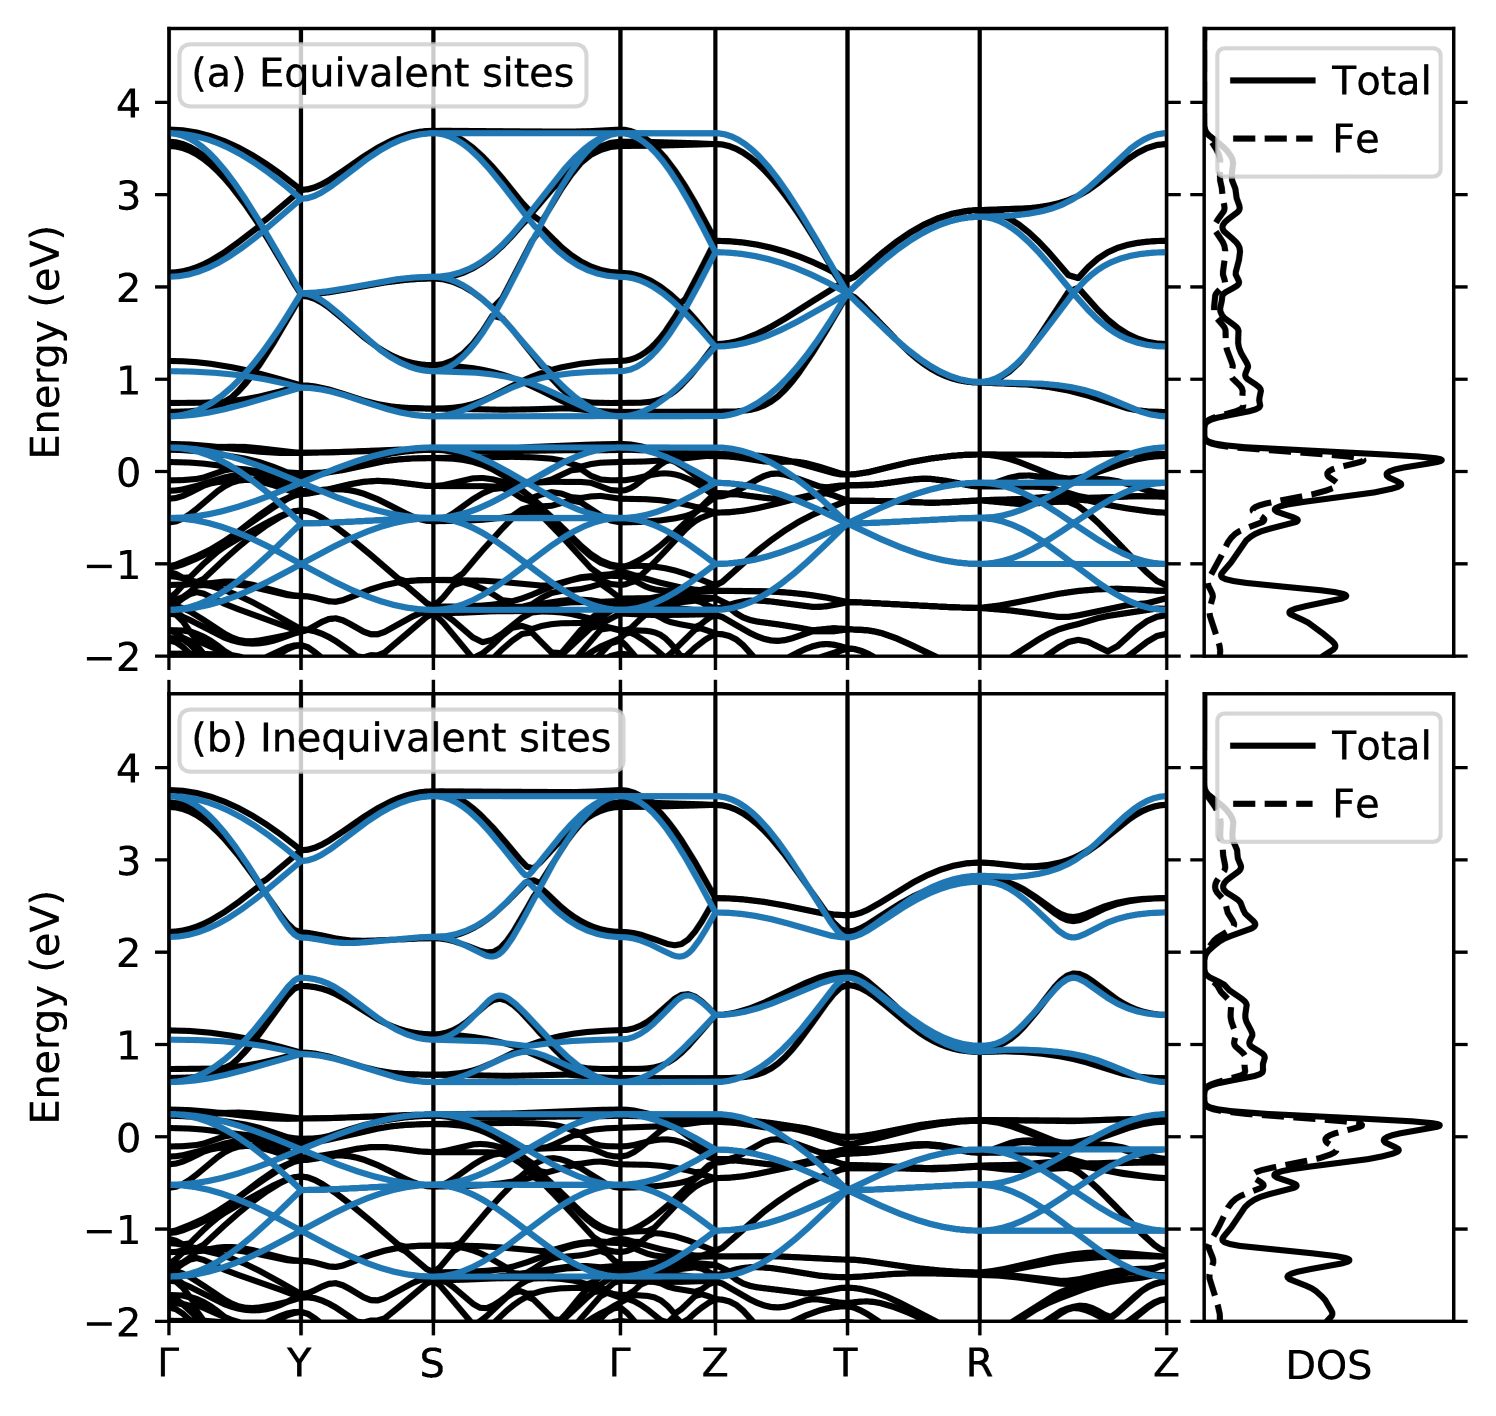
The calculated band structure and corresponding densities of states (DOS) in the relevant energy window around the Fermi level are shown in Fig. 1. It can be seen that a group of bands with dominant Fe character, located between 0.5 eV and 4 eV above the Fermi level, is separated from all other bands at higher and lower energies. Further inspection confirms that these are the Fe- bands. The bands between approximately 1 eV and 0.5 eV also have mostly Fe character and correspond to the Fe- states. Towards lower energies, there is some entanglement of these Fe- bands with other bands with dominant O- character. Comparing the band structures obtained with and without the structural breathing mode, one can see that its main effect is to introduce a splitting throughout the middle of the bands, analogously to what has been observed for nickelates [8; 42]. In contrast, the Fe- bands are not much affected by the structural distortion.
We fit the parameters of our TB model such that the corresponding band dispersion matches the bands obtained from our DFT calculations. Thereby, the ratio between NNN and NN hopping, , is obtained by fitting the well-separated bands, whereas the NN hopping is then mainly adjusted to obtain the correct band width. Note that the two cases with and without breathing mode are fitted with the same hopping amplitudes, whereas the average - splitting is slightly altered by the breathing mode. The resulting TB band structure is also shown in Fig. 1, and the corresponding parameters are listed in Table 1. It can be seen that the TB model results in an excellent fit of the Fe- bands, both in the and cases. For the bands, the overall band width is well described, while the dispersion of the individual bands shows notable deviations. This could be improved by introducing a separate for the hopping or other additional intra- and inter-site TB parameters. However, for simplicity, and since the specific form of the bands is not relevant in the context of this work, we refrain from introducing further parameters into our TB model.
| Å | Å | |
| () | 2.494 | 2.519 |
| () | 0.511 | 0.511 |
| () | 0.220 | 0.220 |
| 0.065 | 0.065 | |
| () | 0 | 0.436 |
| () | 3.069 | |
| () | 1.761 | |
II.4 DMFT calculations
We obtain the phase diagram of the model, Eq. (1), as function of the interaction parameters and using dynamical mean-field theory (DMFT) [43]. Within DMFT, the self-energy of the full lattice problem is approximated by a frequency-dependent but local self-energy, which is obtained by mapping each symmetry-inequivalent site on an effective impurity problem, defined via a self-consistency condition requiring that the impurity Green’s function is identical to the corresponding local Green’s function of the full lattice problem.
The calculations are implemented using the TRIQS and DFTTools libraries [44; 45; 46]. To solve the effective impurity problem, we use a continuous-time Quantum-Monte-Carlo solver (CT-HYB), also implemented in the TRIQS library [47], and an inverse temperature , corresponding to approximately room temperature. Green’s functions are represented by 40 Legendre coefficients [48] for the full five-orbital model (50 for the effective two-orbital model), which results in good convergence and a smooth behavior of the self-energy in imaginary frequency .
We average over both spin channels and also over the and manifolds separately to ensure a paramagnetic solution without orbital polarization in the two different subshells. Furthermore, to allow for a charge disproportionated solution, we divide the sites of the simple cubic lattice into two interpenetrating fcc lattices, (I) and (II), corresponding to the expected 3D checkerboard-like arrangement, and solve the two resulting effective impurity problems separately.
From the local Green’s function , where is the imaginary-time ordering operator and is the creation operator for an electron in orbital at the local site at imaginary time , we obtain the total occupation per site, , the (positively-defined) occupation difference between the two sub-lattices, , and the averaged spectral weight around the Fermi level, . Furthermore, we obtain an estimate for the (orbital-dependent) quasiparticle weight by fitting a fourth-order polynomial to the imaginary part of the local self-energy, , for the eight lowest positive Matsubara frequencies and extrapolate the slope at zero frequency from this fit, c.f. Appendix C in Ref. 49. We use the maximum-entropy method [50], implemented in the TRIQS library [51], to obtain both -averaged and -resolved spectral functions on the real frequency axis.
III Results
III.1 Atomic-limit predictions
Before presenting our results from the full DMFT calculations, we outline the general features of the expected phase diagram by considering the “atomic limit” of Eq. (1), i.e., the limit where all hopping amplitudes and thus the associated band widths go to zero, and the ground state configuration of the system is solely determined by the local part of the Hamiltonian, i.e., the interaction term plus the local crystal-field and site splitting.
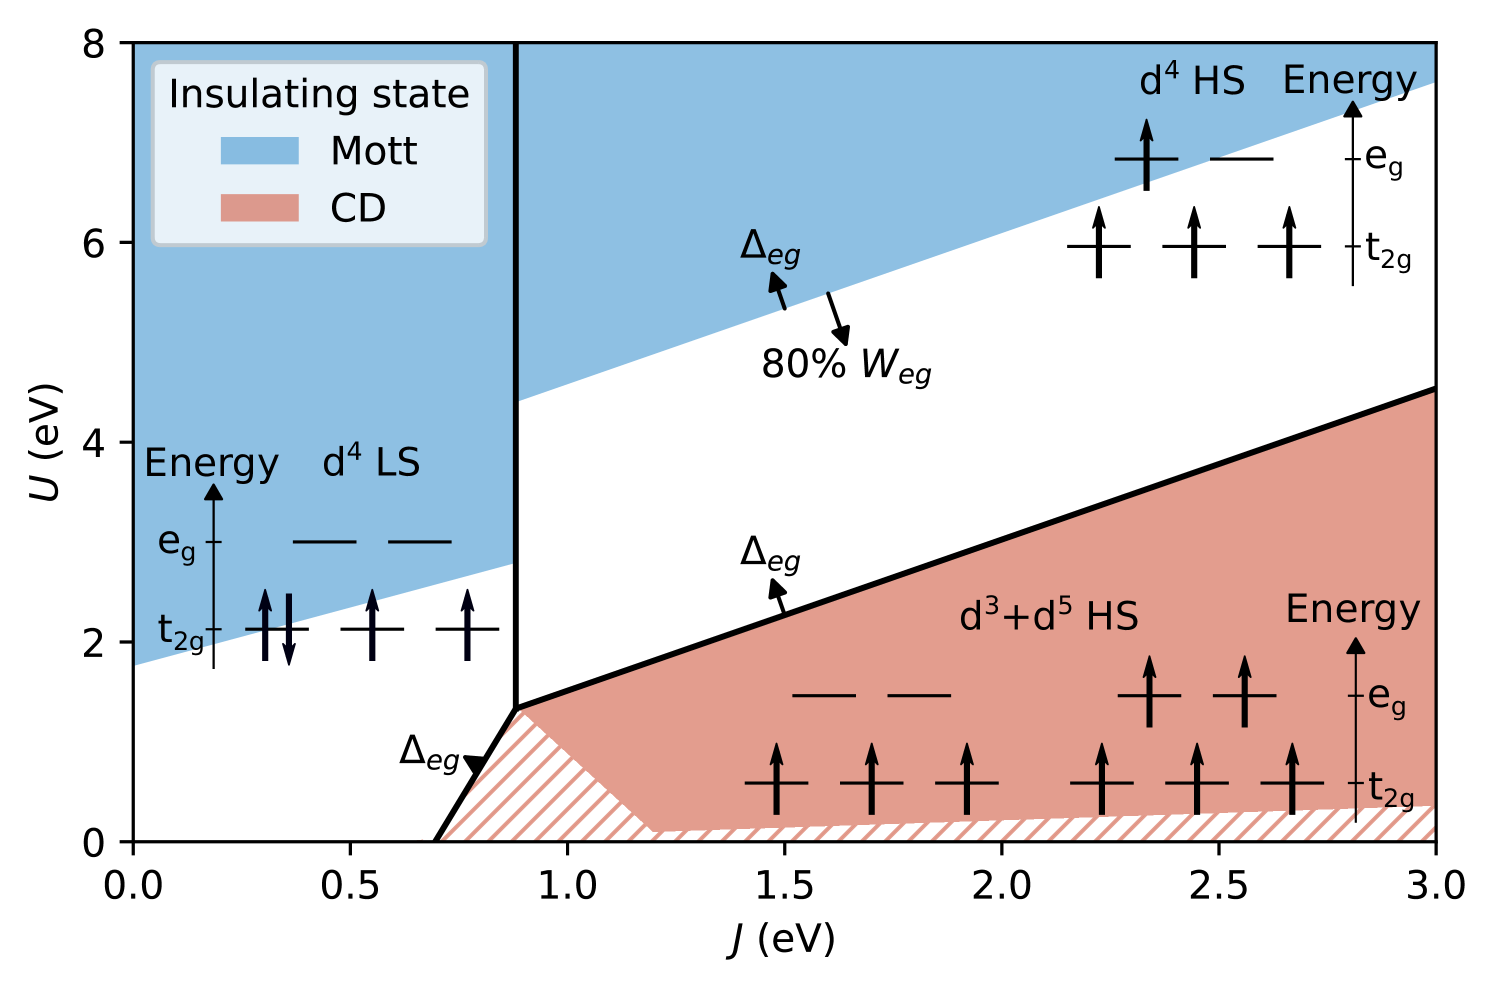
We first compare the energies of the three most relevant configurations: (i) homogeneous high-spin (HS) ; (ii) homogeneous low-spin (LS) ; and (iii) inhomogeneous HS + , also depicted by the schematic level diagrams in Fig. 2, and identify the ground state as function of interaction parameters and . Details are described in App. A. Fig. 2 depicts the case without an explicit site splitting, i.e., . Thick black lines separate the regions where the three different cases (i)-(iii) are the ground state configuration. The homogeneous LS configuration (ii) is generally favorable for small ( eV, except for the small part separating the LS and inhomogeneous HS regions, where the critical is further decreased by decreasing ). The inhomogeneous charge-disproportionated (CD) state (iii) is the ground state for larger and (except, again, for the small part separating CD and homogeneous LS regions, where the critical is smaller). For large and , the homogeneous HS state (i) is obtained. We note that in the Slater parametrization of the local interaction, a positive represents an average repulsive electron-electron interaction (independent of ), which is why we consider the whole region with as potentially physically relevant.
A simple estimate for the boundary between metallic and (Mott-) insulating regions can be obtained by comparing the lowest inter-site charge transfer excitation energy with the average electronic kinetic energy. For the homogeneous phases, this kinetic energy can be approximated by the relevant band width (see, e.g., Ref. 4), resulting in the blue-shaded “Mott-insulating” region in Fig. 2 (see App. A for details). Since the band width is smaller than the band width, the Mott phase extends to smaller values in the LS region than in the HS region.
For the CD region, a good estimate for the corresponding effective band width/kinetic energy is more difficult to obtain. For the transition to the homogeneous metallic phase it turns out to be significantly smaller than and essentially goes to zero when becomes large [8]. For simplicity, we therefore denote the whole region below the CD transition line as “CDI” in the atomic limit (red shaded area in Fig. 2). Considering only hopping among either nominal or sites defines limits for the CDI region towards small (see App. A). Simple band-width estimates for the kinetic energy result in the limits indicated by the red-striped regions in Fig. 2.
Introducing a nonzero site splitting (corresponding to a nonzero distortion of the underlying crystal structure), extends the CD region slightly by rigidly shifting the phase boundaries towards the homogeneous HS and LS phases (see App. A) as indicated by the small arrows in Fig. 2. This also shifts the metal/insulator phase boundary within the homogeneous HS region towards higher . In contrast, reducing the band width shifts the metal/insulator phase boundary in the homogeneous HS phase in the opposite direction, while not affecting any of the other main phase boundaries.
III.2 Phase diagram for equivalent sites
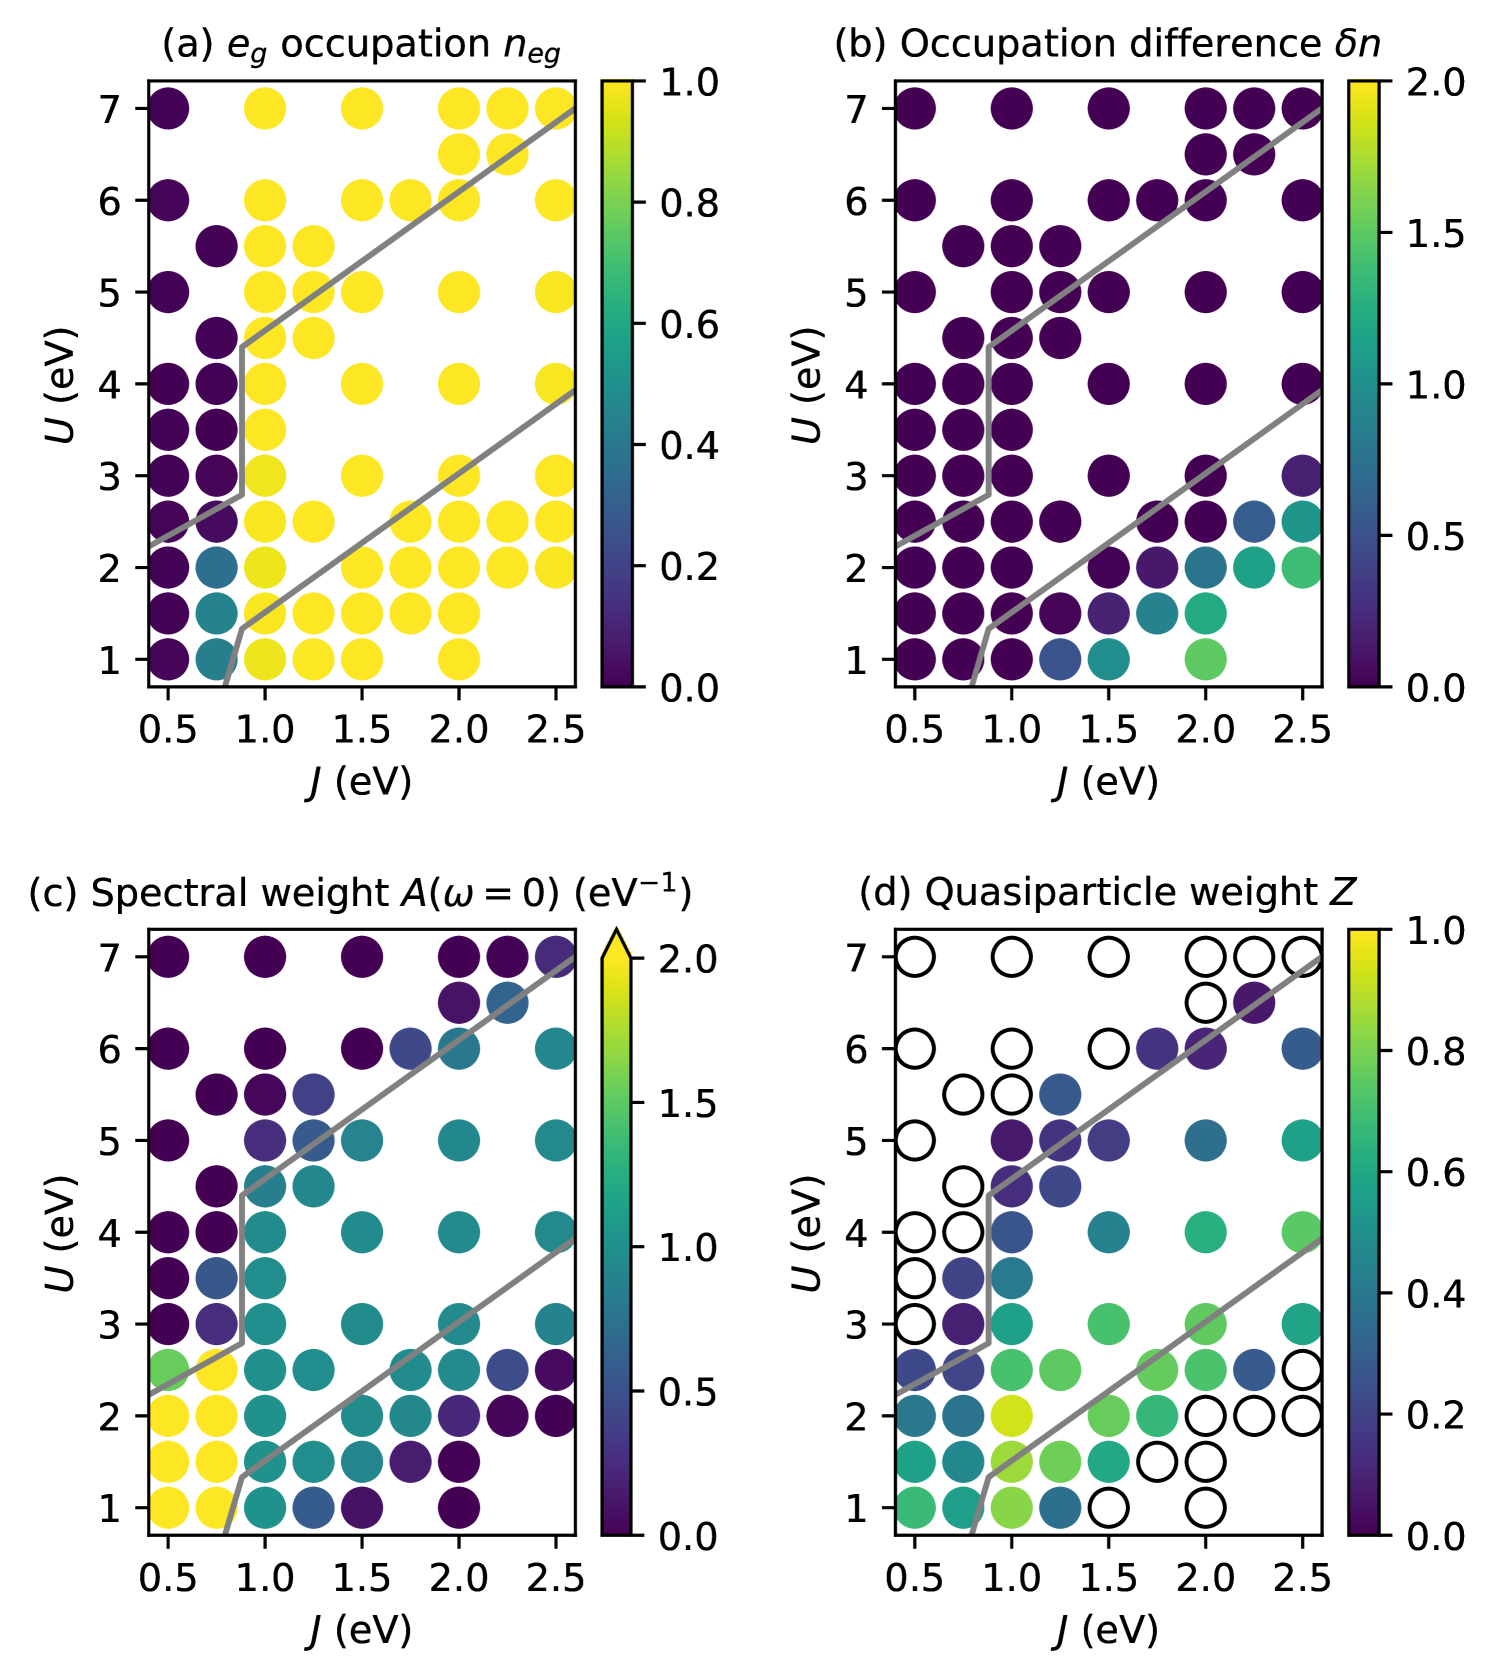
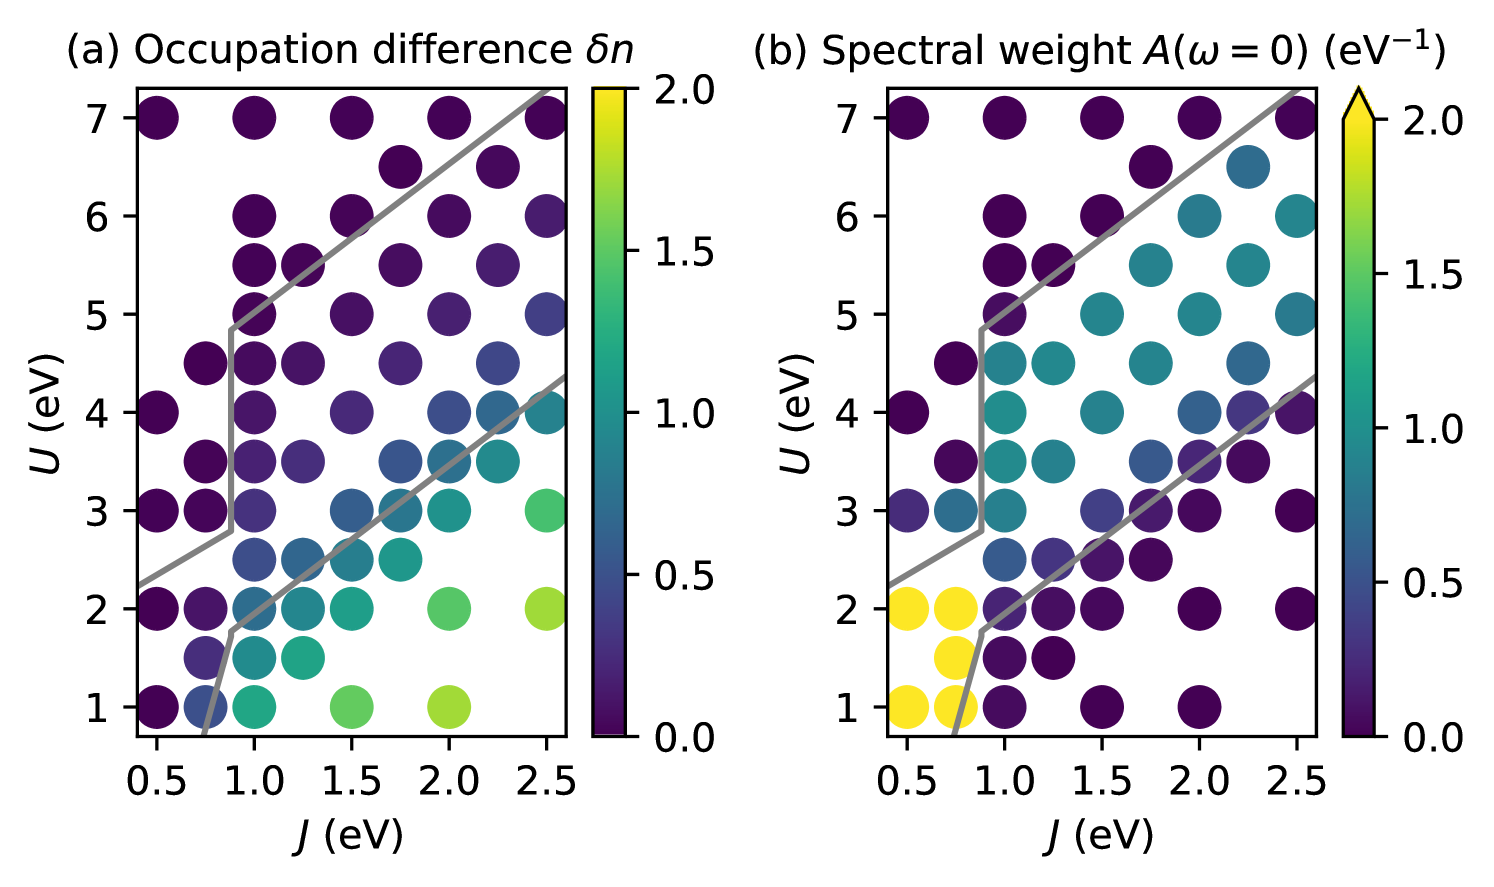
Next, we present the results of our full DMFT calculations for the TB model with , i.e., for the case without a site-dependent shift of the levels. Fig. 3 depicts various observables as function of interaction parameters and .
The total occupation per site, , shown in Fig. 3(a), indicates a sharp transition from LS () to HS () for eV, essentially independent of , in very good agreement with the expectation obtained from the atomic limit discussed in Sec. III.1. Only for eV and eV, we obtain a small intermediate-spin region where the occupation lies between 0 and 1.
The most important result is visible in the occupation difference between the two sublattices, , shown in Fig. 3(b). Here, in the region of small but large , i.e., in the region where the atomic limit predicts the inhomogeneous CD ground state, we indeed obtain a non-zero value for , indicating that the system exhibits a spontaneously symmetry-broken state with higher and lower occupation on the two sublattices. Note that this CD region lies fully within the HS region where the average occupation is equal to 1. Inspection of the spectral weight at zero energy, , shows that the charge disproportionation coincides with a transition to an insulating state, indicated by (dark regions in Fig. 3(c)). This CD insulating region is separated from the Mott-insulating regime, where and which occurs for large , by a metallic region. It can be seen that the boundary between the Mott-insulating and the metallic region (both in the HS and LS regime) also matches very well with the atomic limit prediction from Sec. III.1, indicated by the gray lines in Fig. 3. On the CD side, the MIT occurs together with the emerging charge disproportionation for , somewhat below the homogeneous-inhomogeneous transition line predicted from the atomic limit. However, we note that the distance of the atomic-limit prediction and the actual charge disproportionation is significantly less than the band width.
In Fig. 3(c), there is a significant change in spectral weight, , at the LS/HS transition in the metallic region. Fig. 4(a) shows corresponding spectral functions (for eV), separated in and contributions. It can be seen that for eV the full spectral weight is generated by the contribution, while the states are still unoccupied. Around eV the transition occurs, where both and states contribute to the spectral weight at zero energy. Above this LS/HS transition, at eV, the spectral function is gapped, and is entirely due to the states, i.e., a situation that corresponds to an orbitally selective Mott state. Here, the quasiparticle peak is lower and broader compared to the peak for eV, which results in the lower spectral weight in the phase diagram for the HS case.
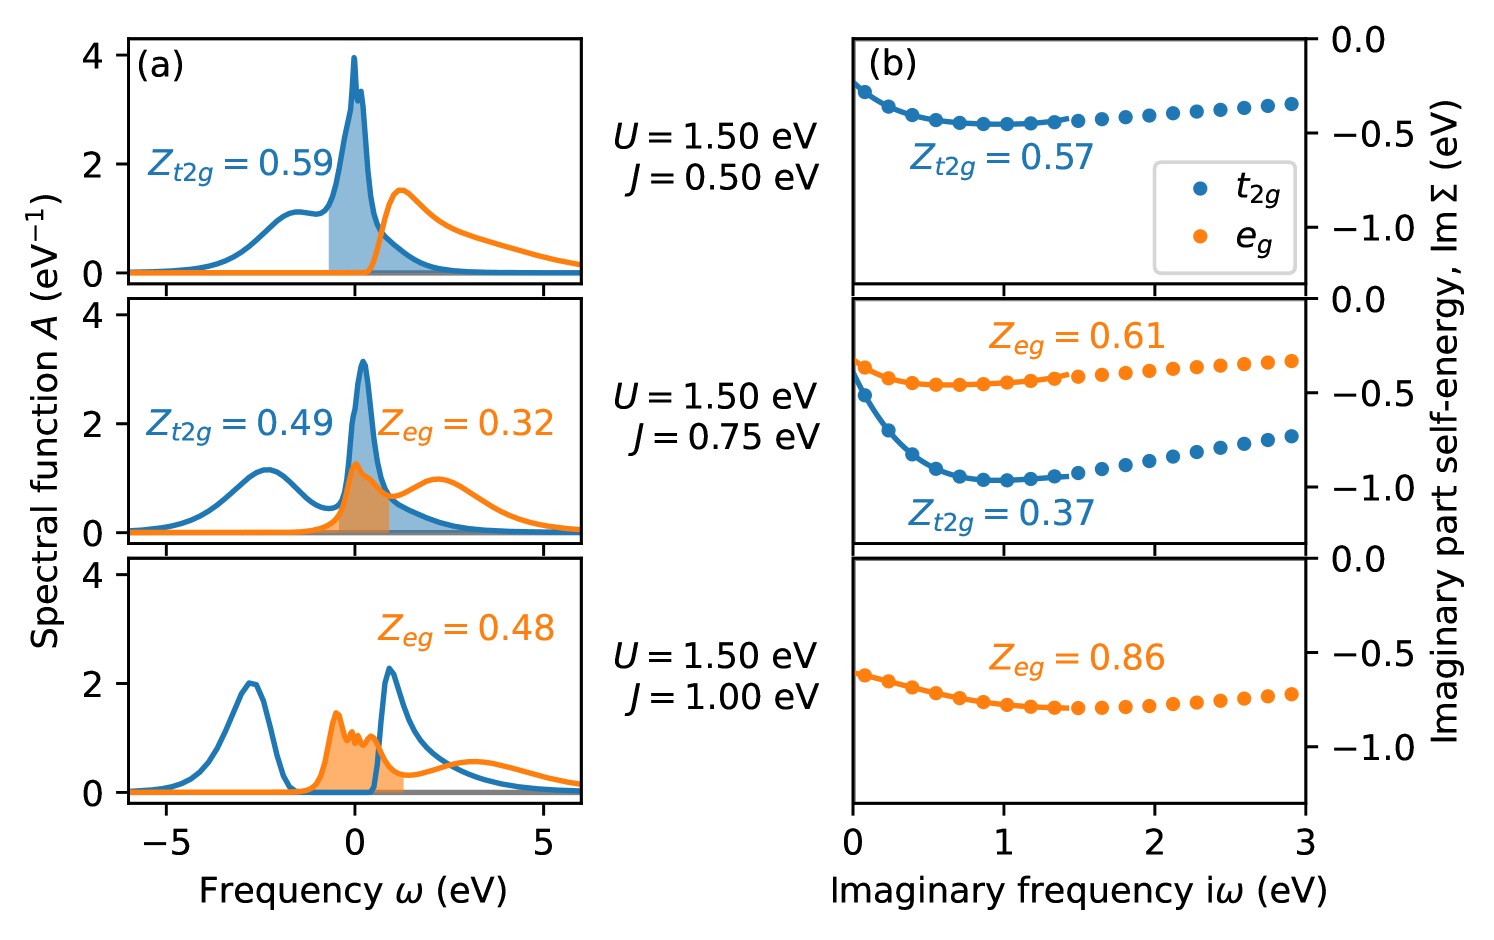
Fig. 3(d) shows the quasiparticle weight in the metallic region, averaged over all orbitals with non-vanishing spectral weight. is largest along the line separating homogeneous/inhomogeneous ground states in the atomic limit, and decreases towards both insulating phases. This is consistent with analogous results for the three-orbital case in Ref. 9, where this behavior was related to the competition between the two different insulating phases, resulting in the so-called “Janus effect” [52; 4].
Fig. 4(b) depicts the imaginary part of the self-energy on the Matsubara axis across the LS/HS transition within the metallic regime. As described in Sec. II.4, the quasiparticle weight is obtained by fitting the low-frequency behavior of . The corresponding fits are shown in Fig. 4(b). It can be seen that the self-energies exhibit rather strong deviations from simple Fermi liquid behavior. A linear dependence on can only be observed in a very small range close to , and there is a rather large non-vanishing imaginary part for zero frequency. This could in part be due to the relatively high temperature (eV, corresponding to approximately room temperature) in our calculations. Thus, the interpretation of as effective quasiparticle renormalization is somewhat approximate, here. This can also be inferred from the comparison with the “quasiparticle weights” extracted by integrating over the central peak of the corresponding spectral functions in Fig. 3. (Note that the latter of course also just represents a very rough and approximate measure of the quasiparticle renormalization.)
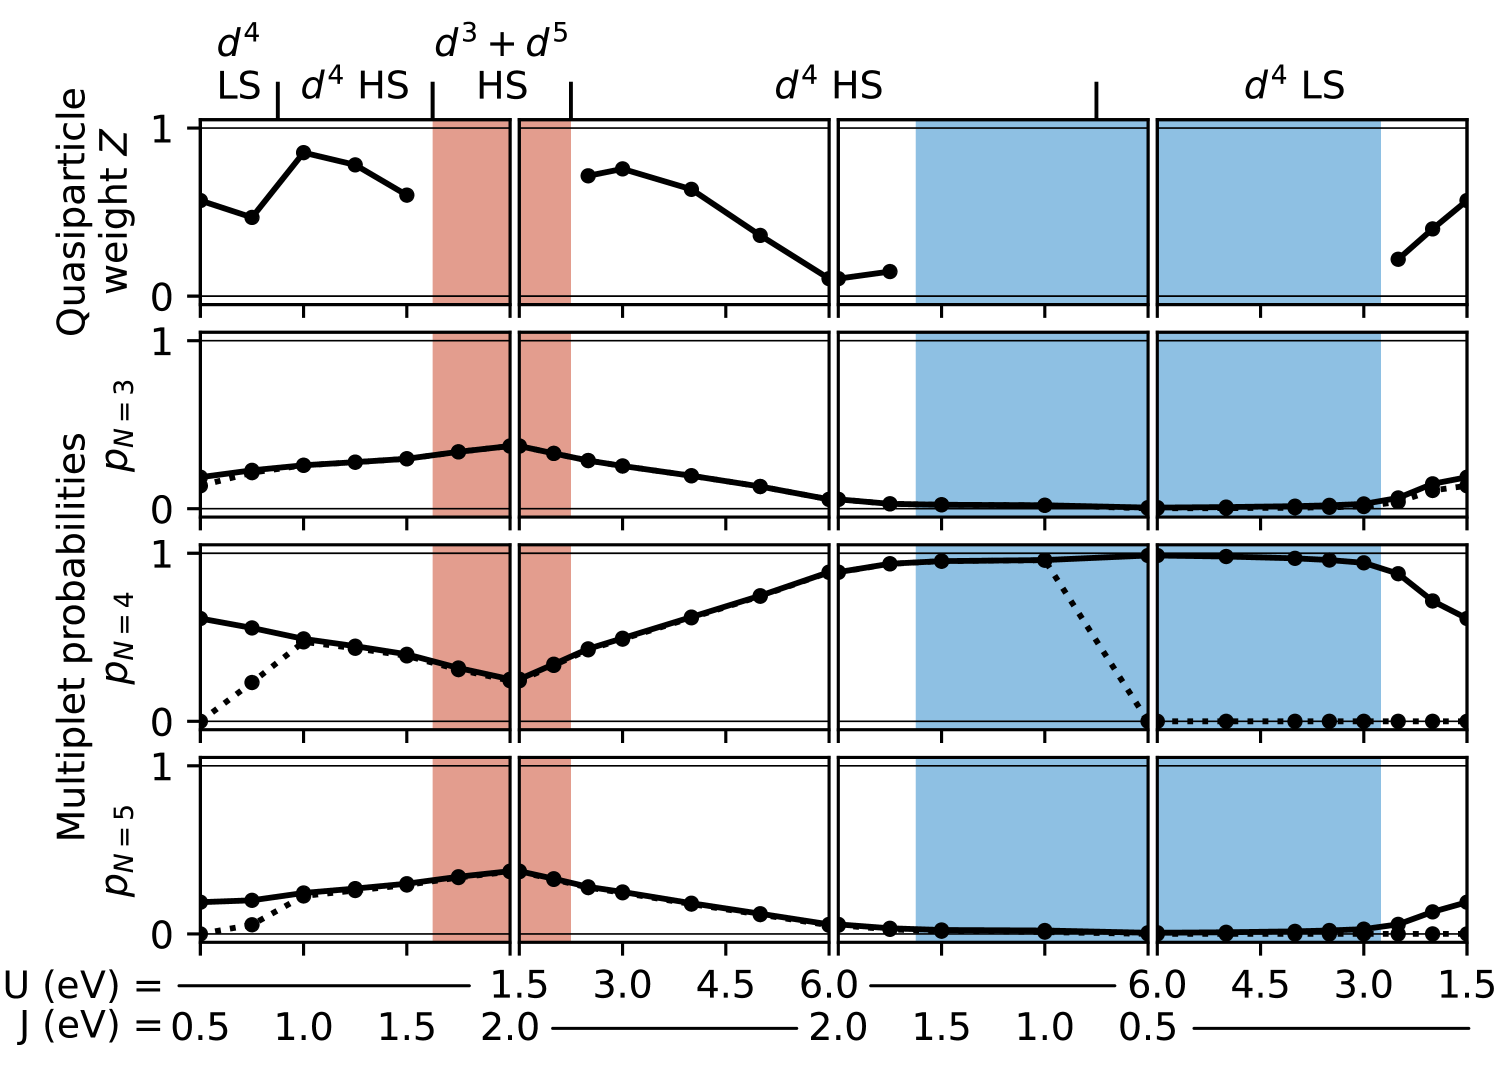
To obtain further insight into the different phases, we also analyze the probabilities of the different atomic multiplet states, obtained from the DMFT Quantum-Monte-Carlo solver. These probabilities describe how likely it is for the corresponding state to be visited during the simulation of the effective impurity problem and allow to distinguish between different occupations and LS/HS configurations in a more quantitative way than in the phase diagrams shown in Fig. 3. To simplify the analysis, we sum up the probabilities for Hilbert states with the same number of electrons and the same magnetic spin quantum number 111We note that within the density-density approximation for the interaction Hamiltonian, Eq. (II.1), the magnetic quantum number and not the total spin is the relevant quantum number indicating the spin state of the system.. It turns out that only states with , , and have significant probabilities; these together with the quasiparticle weight are shown along a rectangular path through the phase diagram in Fig. 5.
The first segment of this path corresponds to constant eV and increasing from 0.5 eV to 2.0 eV, i.e., starting from the LS metallic, then to the HS metallic, and then into the CDI phase. In the LS metallic phase for eV, all multiplets with , , and are visited, but the probabilities of the HS states (maximal ) for and 5 are close to zero. In the transition region between LS and HS metallic phases at eV, the HS multiplets with for and become more populated, while for eV, the HS states amount to nearly the total probabilities.
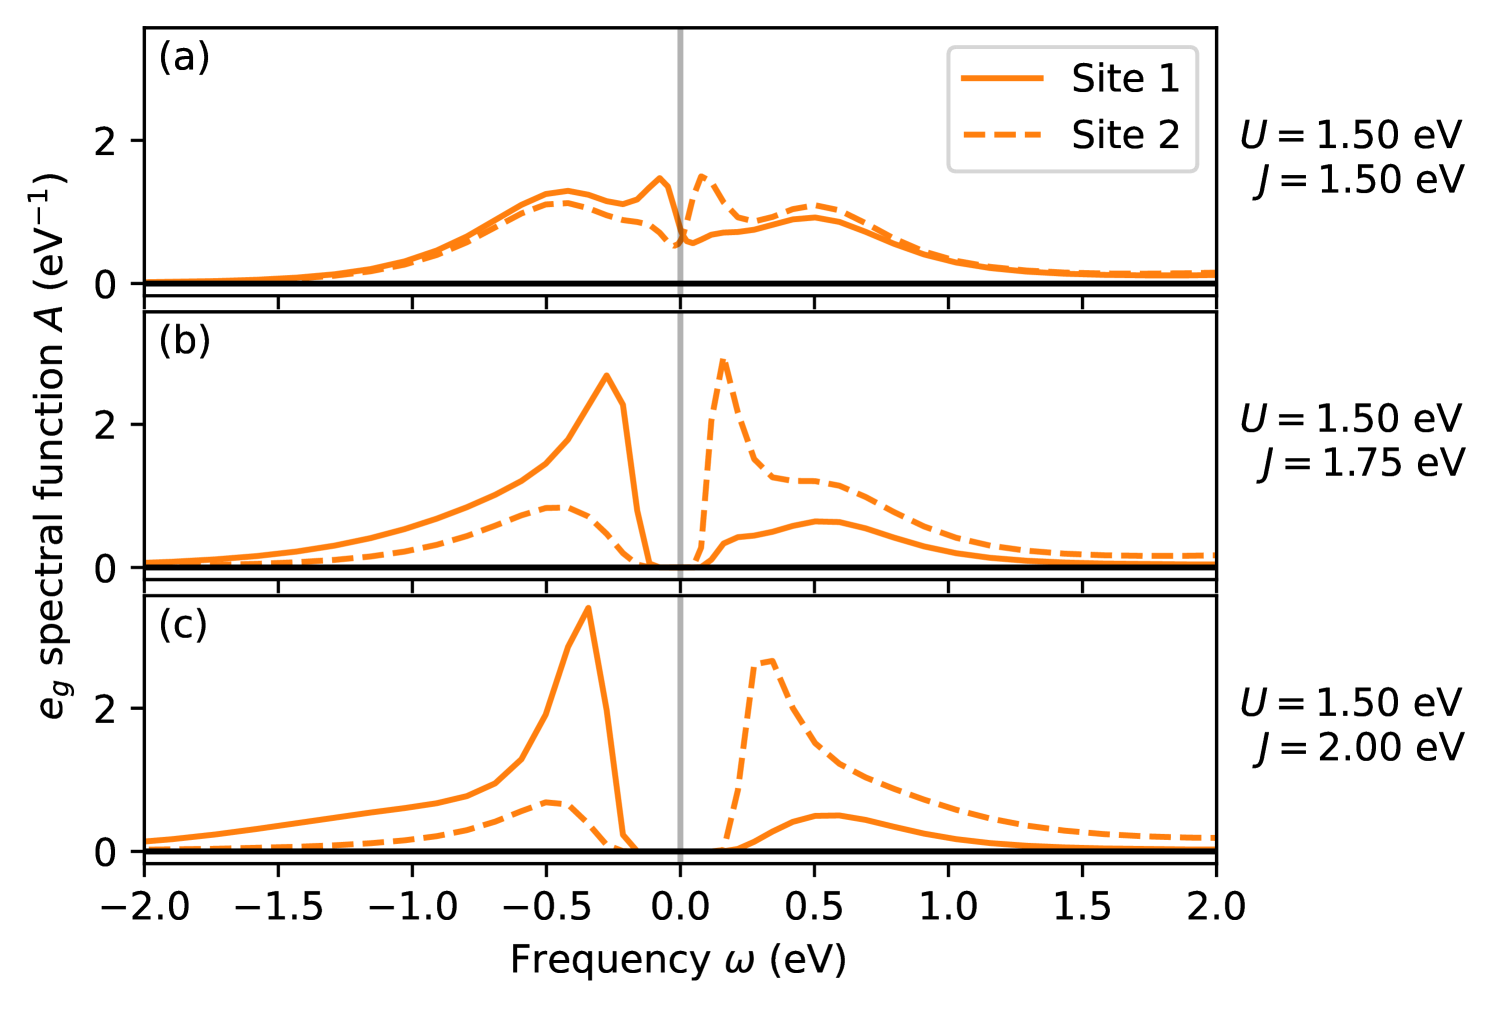
For increasing , the probability for decreases linearly while the probabilities for and increase accordingly. When the system enters the CDI phase ( eV), the probabilities on the two inequivalent sites become different, but the averages over both sites, shown in Fig. 5, continue their linear trend. In particular, even deep inside the CDI phase, for eV, the probability of remains relatively large on both sites, indicating significant fluctuations between multiplets with different , even in the insulating state. We note that the presence of such fluctuations and the finite probability of the multiplet is consistent with the gradual increase of the occupation difference within the CDI phase shown in Fig. 3.
Fig. 6 shows the site-resolved spectral functions in this regime ( eV and eV). The spectral functions for eV exhibit a clear gap, consistent with the zero spectral weight in Fig. 3, despite the system not being in a pure local charge state, as follows from the multiplet probabilities. This differs from a recent study using a slave-boson method [9], where the Hund’s insulator in the two-orbital model was characterized by a complete charge disproportionation where only the nominal charge multiplets are populated. It also indicates that the transition to the CDI state cannot be understood purely in terms of atomic-limit considerations such as the ones in Sec. III.1.
Increasing from 1.5 eV to 6.0 eV for fixed eV (second segment in Fig. 5) results in a transition from the CDI phase back to the HS metallic region and then moves the system towards the Mott insulating region. Here, the probability increases again, while the and probabilities decrease accordingly, and become zero at the boundary to the Mott insulator. Also, the quasiparticle weight decreases continuously towards zero when approaching the Mott phase, while it remains quite large even very close to the CDI phase boundary. However, as discussed above, it is unclear whether is really a good quantitative measure for the quasiparticle renormalization, here. Nevertheless, we note that a rather sharp drop of on approaching the Hund’s insulator (equivalent to our CDI phase) has also been observed in Ref. 9 for a three-orbital model.
Finally, when crossing the HS/LS transition within the Mott insulating region, the HS multiplet vanishes abruptly, and then, when leaving the Mott phase towards the LS metallic region, the and multiplets appear again, together with a gradual increase of .
Thus, to preliminary summarize the results in this section, we emphasize that we establish the presence of a spontaneously charge-disproportionated insulating phase, for strong and intermediate values of , in the cubic five-orbital multi-band Hubbard model with an average of four electrons per site, analogous to results obtained for similar two- and three-orbital models [8; 9]. The CDI phase is characterized by a gap opening at zero frequency, but still exhibits a strong local mixing of multiplets with different number of electrons . This is in contrast to the Mott insulating phase, which can be characterized by a unique local multiplet with . In addition to the metallic and two distinct insulating phases, a LS/HS transition occurs. This transition is very sharp inside the Mott-insulating regime but a small intermediate spin region can be observed for small in the metallic phase.
III.3 Introducing an intrinsic site splitting and effect of reduced band width
Next, we investigate the effect of an intrinsic energy difference between the levels on the two sublattices, which is introduced, for example, by the structural distortion that generally accompanies the charge disproportionation, i.e., the breathing mode of the oxygen octahedra surrounding the transition-metal sites in the perovskite structure. We use a splitting of eV as obtained from our fit to the band structure of CaFeO3 described in Sec. II.3.
Fig. 7 shows the spectral weight and occupation difference for this case. It can be seen that the region corresponding to the CDI phase is significantly increased compared to the case with in Fig. 3. The transition to the insulating state now occurs already very close to the homogeneous/inhomogeneous transition line estimated from the atomic limit. Similar behavior has also been observed for the two-band model [8]. Furthermore, due to the intrinsic energy difference, a small already develops in the metallic phase. On the other hand, this small occupation difference is completely suppressed when approaching the Mott-insulating phase, and the corresponding MIT occurs again very close to the atomic limit predictions based on the band width. Note that the corresponding lines in Fig. 7 are shifted relative to those in Fig. 3 for as indicated in the schematic phase diagram, Fig. 2.
Due to the large extent of the CDI phase, there is now a direct competition between the CDI and the homogeneous LS metallic phase for small . Nevertheless, also in this case, the corresponding phase boundary appears to be rather well described by the atomic limit prediction (gray lines in Fig. 7). Similar to the case with , we obtain a small intermediate-spin region (without significant charge disproportionation) for eV and eV (data not shown in Fig. 7).
Finally, we also assess the effect of reducing the band width, while keeping the local crystal field and the inter-site splitting constant. To simplify the corresponding analysis, we use the observation that within the HS region ( eV), the gradient of all quantities depicted in the - phase diagrams in Fig. 3 and Fig. 7 appears to be perpendicular to the two transition lines bordering the metallic phase, i.e., perpendicular to lines with . In Fig. 8, we therefore plot all available data points for the spectral weight within the HS region of the phase diagram, both for full and reduced band width, as a function of the “effective” interaction parameter (which corresponds to the difference in the local interaction energies between and ).
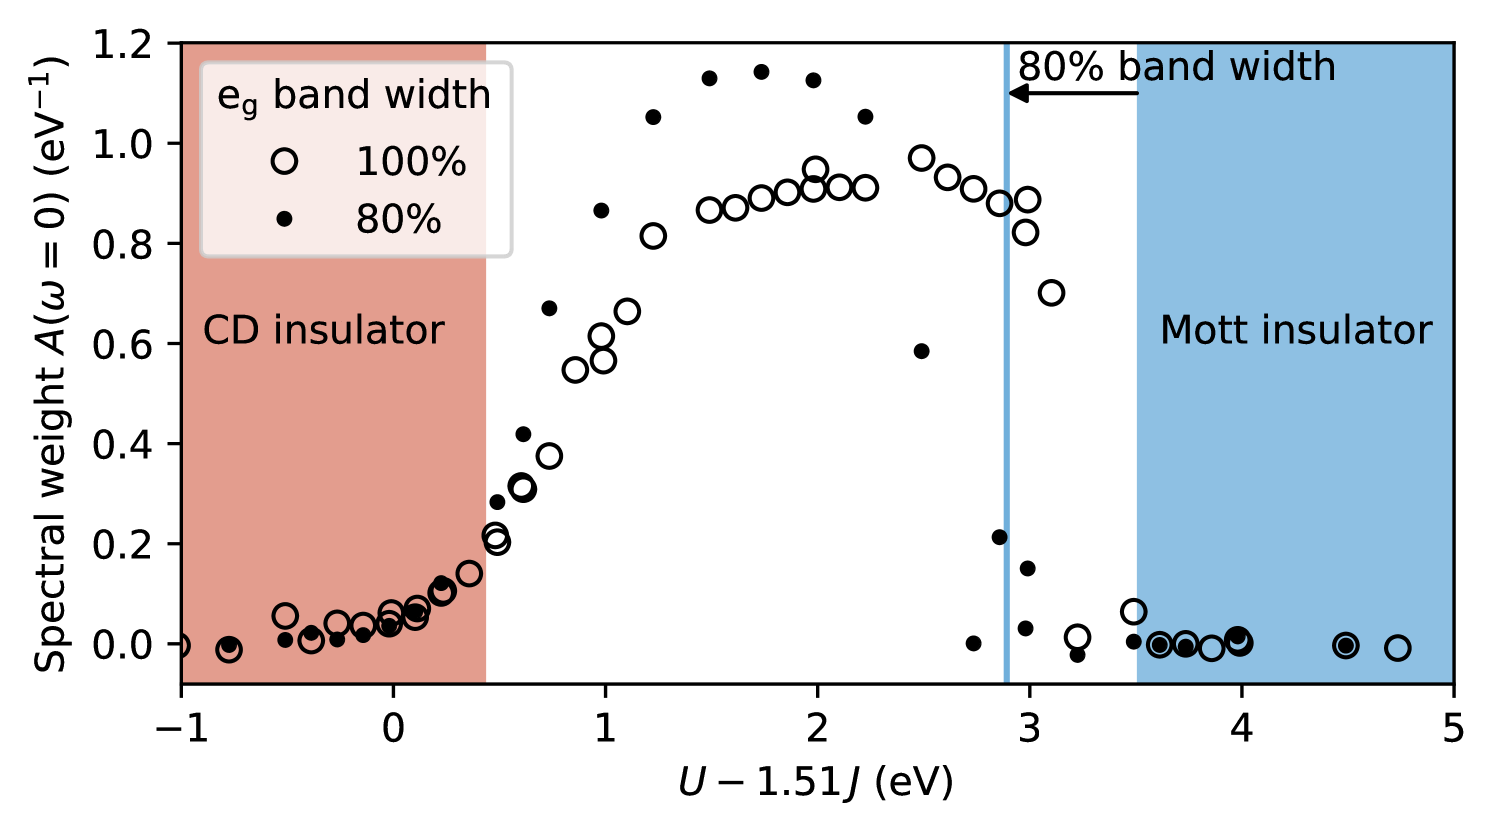
Indeed, all data points plotted in this way essentially condense to a single line. In agreement with the simple atomic-limit prediction (indicated in Fig. 8 as vertical line or shaded regions), the transition to the Mott-insulating phase is shifted towards smaller interaction parameters if the band width is reduced, while the transition to the CD phase is barely affected by this change. However, the occupation difference in the CD region (not shown) is slightly increased for the case with reduced band width. Furthermore, one can also see that spectral weight disappears only very gradually towards the CDI state, while it disappears rather abruptly at the Mott transition.
We note that, even though the reduction of the band width does not significantly affect the CDI phase boundary in our calculations, the band width could nevertheless affect the coupling to the structural distortion and can thus be an important control parameter of the system. In Ref. 20, it was shown that in the two-orbital model the band width controls the relevant electronic susceptibility and is therefore crucial for stabilizing the CD through coupling to the structural distortion.
III.4 Comparison with an effective two-orbital model for equivalent sites
After establishing and analyzing the phase diagram of the full five-orbital model, we now compare this model to the simplified effective two-orbital description introduced in Sec. II.2. Since by construction the effective two-orbital model assumes a HS configuration on each site, we only compare the HS part of the phase diagram. Our objective is to test how qualitatively and quantitatively accurate the computationally less demanding simplified model is. To ensure a meaningful comparison with the full five-orbital model, the interaction parameters of the two-orbital model are always chosen to be consistent with the corresponding parameters of the full model, as described in Sec. II.2. Furthermore, we only present the case with , i.e., without an intrinsic site splitting between the two sublattices. Our test calculations (not shown) indicate that a site splitting does not alter the quality of the comparison between the full five-orbital model and the effective two-orbital case.
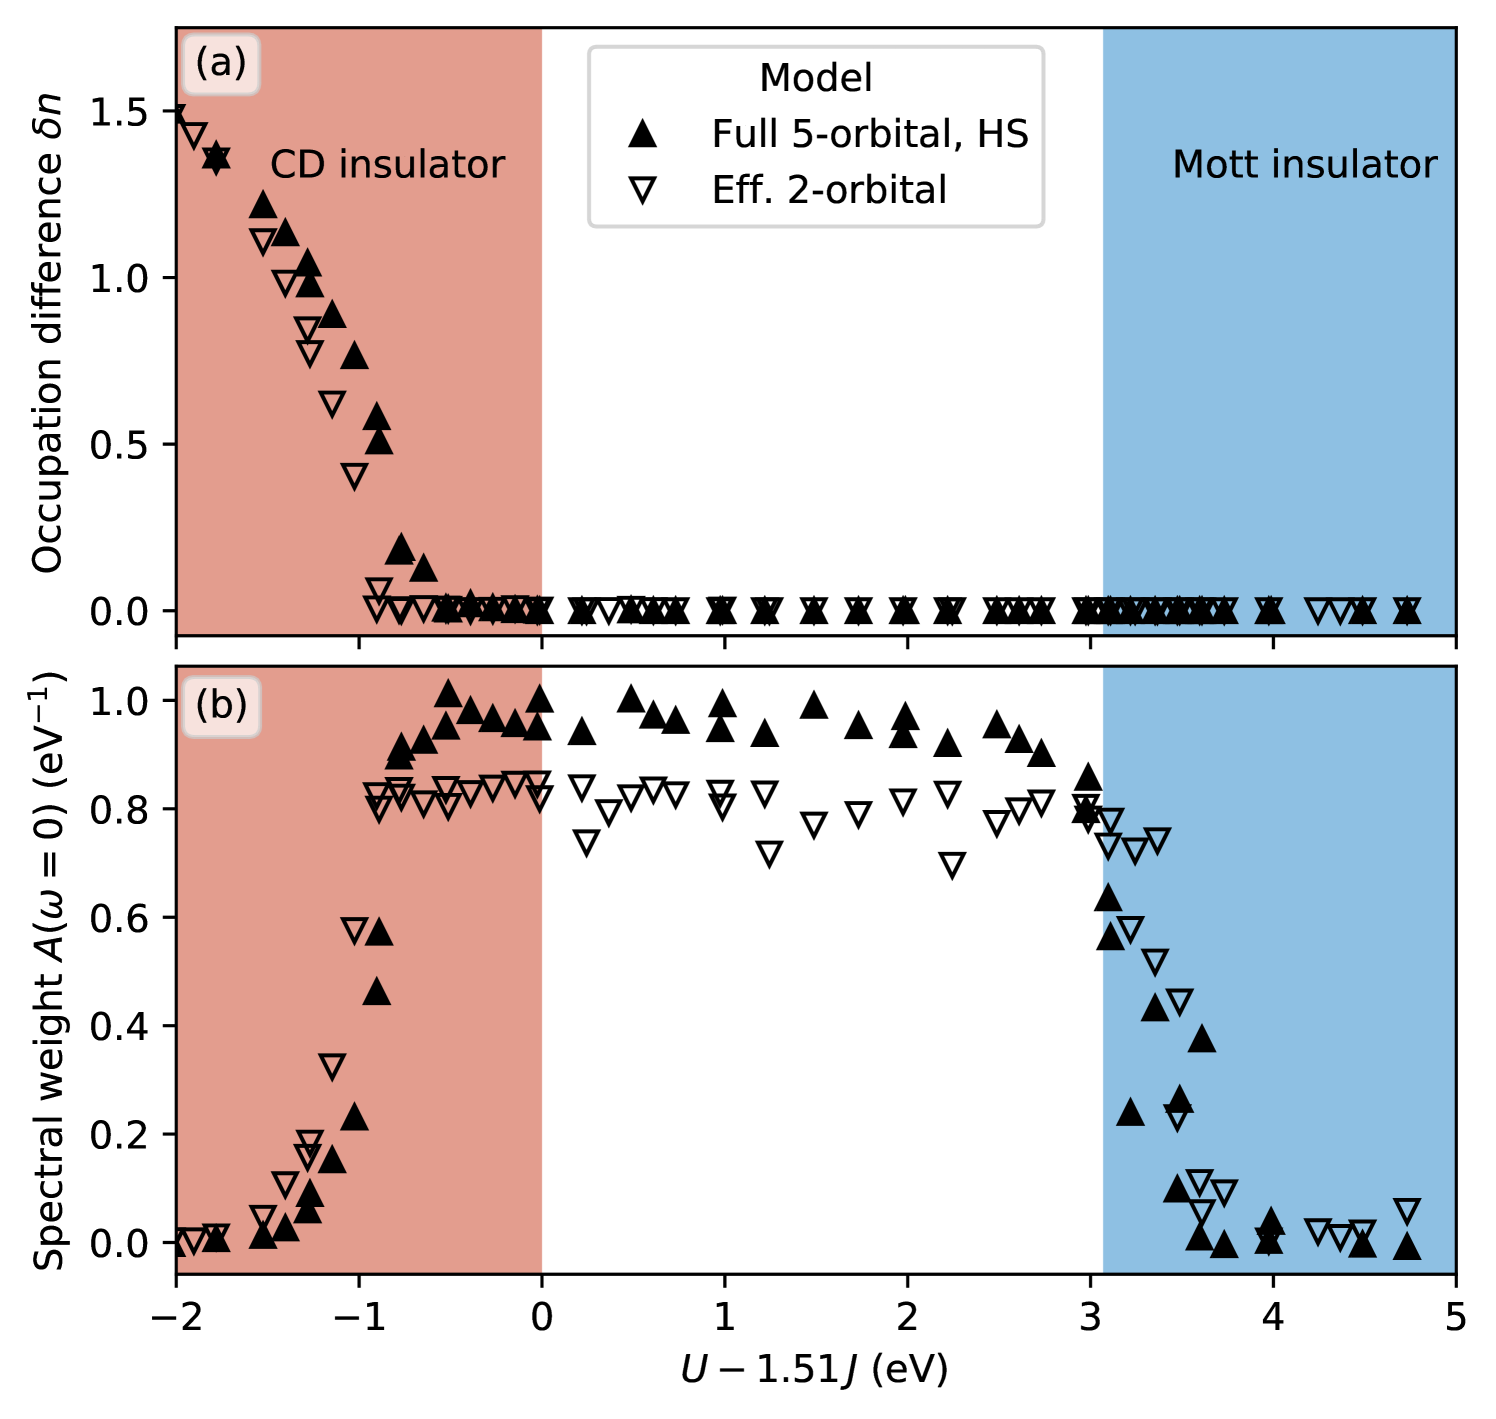
Fig. 9 depicts the occupation difference and spectral weight as function of the effective interaction , both for the effective two-orbital model and the full five-orbital model. Similar to the case presented in Fig. 8, all points for the same data set, obtained for different combinations of and , essentially reduce to a single line, demonstrating that is indeed the relevant interaction parameter characterizing the behavior of the model in the HS regime.
Both models give very similar results, with only two small quantitative differences. First, the transition to the CDI phase occurs for slightly smaller effective interaction in the simplified two-orbital model. Due to the large increase of at the transition, this can lead to quantitative differences in the charge disproportionation of up to 0.5 electrons, but only in a very small region close to the phase transition. Second, the spectral weight at zero energy in the metallic phase is slightly reduced in the effective two-orbital model.
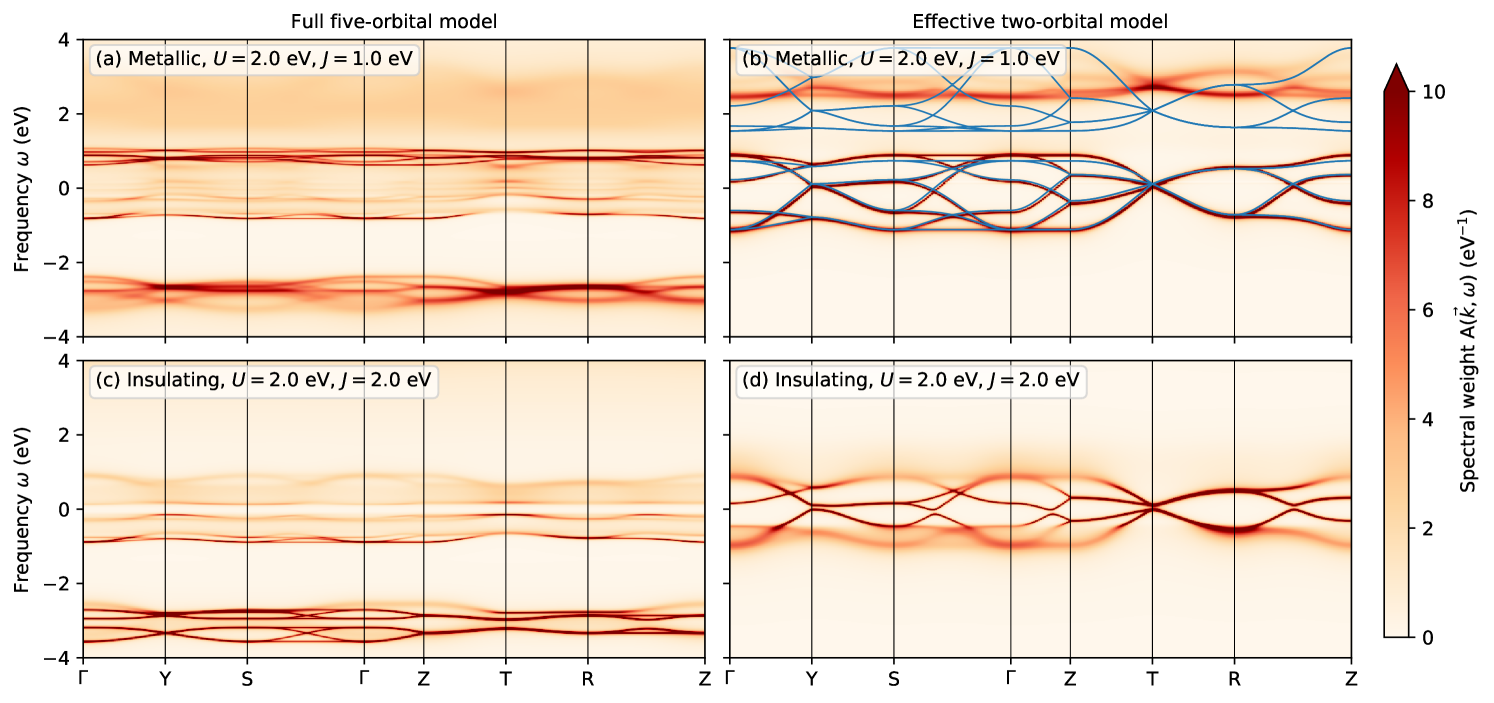
Thus, it appears that the basic observables, such as occupations and the resulting phase boundaries, as well as the gap opening at the Mott transition, obtained from the simplified two-orbital model agree well with the corresponding results for the full five-orbital model. However, this is not true for more complex spectral properties, as can be seen from the -resolved spectral functions shown in Fig. 10 (obtained through analytic continuation of the self-energy).
For the full five-orbital model, the occupied and unoccupied bands appear as rather sharp features. For the case with eV and eV these bands are situated at around 3 eV and 1 eV. The spectral weight is much more incoherent, with significant lifetime broadening due to many-body correlations. In the metallic state obtained for eV, some dispersion is still visible between and . At higher energies, a broad incoherent spectral background is present at around 2 eV.
In contrast, the -resolved spectral functions obtained from the effective two-orbital model exhibit much weaker many-body effects. In the metallic regime for eV, a sharp band structure is visible, in particular around . The band dispersion is essentially identical to the one following from the renormalized and spin-mixed hopping amplitudes, also shown as blue lines for comparison in Fig. 10(b). The Coulomb interaction between the electrons only leads to a weak lifetime broadening of the individual bands and mostly increases the splitting between local majority and minority spin channels. Close to the CDI transition at eV, the local minority spin bands are shifted to even higher energies and a gap starts opening at zero frequency, consistent with the full five-orbital model. However, in the two-orbital model, the bands around the gap seem to remain rather well defined, while the band edges at approximately eV become rather fuzzy, which does not happen in the five-orbital case.
The fact that the effective two-orbital model exhibits much weaker many-body correlations than the full five-orbital model is to be expected, since the interaction with the core spins merely enters via the renormalized hopping amplitudes and in the form of “classical” Zeeman fields. However, the local self-energies also seem to exhibit some non-trivial differences, leading to pronounced lifetime broadening in different energy regions. Nevertheless, these differences do not seem to critically affect integrated quantities such as occupations or the spectral weight around zero energy (see Fig. 9).
IV Conclusions and Summary
In summary, we have established the existence of a charge-disproportionated insulating phase (or Hund’s insulator) within a generic cubic five-orbital full -shell model and an average filling of four electrons per site. Our results are consistent with previous studies of two- and three-orbital models [8; 9], which all show the same overall phase diagram with two distinct insulating phases, the standard homogeneous Mott insulator for large and a spontaneously charge disproportionated insulator for large and moderate , separated by a metallic region.
For the present case of the cubic five-orbital model, additional complexity arises from the presence of the LS/HS transition. In particular for eV and eV, the metallic LS state competes with the CDI state. We note that this parameter regime is realistic for materials such as ferrates, where the Coulomb repulsion between the electrons can be strongly screened due to the (potentially negative) charge-transfer character and the resulting strong hybridization with the oxygen bands. Furthermore, it can be expected that the incorporation of intersite Coulomb interactions, neglected in the present study to focus on the effect of the local Hund’s coupling, will also favor the charge disproportionated state and thus further reduce the minimal required to obtain the CDI phase for a given [54].
Our results also show that the CDI phase is strongly affected by a small energy splitting of the levels between the charge-disproportionated sublattices, introduced here to mimic the effect of an additional structural distortion that accompanies the CD. Again, this is analogous to previous results obtained for the two-orbital case [8], and shows that the CDI couples very strongly to such a structural distortion. Thus, for quantitative studies of specific materials, it is crucial to account for this coupling and treat the structural distortion as a free variable [20].
An interesting aspect is also the unconventional nature of the CDI state. While for the case of the homogeneous Mott insulator, the critical and values for the MIT can be estimated with rather good accuracy from the atomic limit, this is not the case for the transition to the (spontaneous) CDI state. Our results show that a gap in the spectral function opens even though there are still significant fluctuations between different local multiplets. This is also consistent with the gradual increase of the charge disproportionation. Nevertheless, for the case with a nonzero site splitting , the homogeneous/CD phase boundary is well approximated by the corresponding atomic limit.
Finally, we have also compared the full five-orbital model with a simplified effective two-orbital description applicable to the HS limit. The simplified model gives results very similar to the full model in the HS region, even though the transition to the CDI state occurs at slightly lower effective interaction than in the full model. In spite of clear differences in the -resolved spectral functions, integrated quantities such as occupations or the zero-energy spectral weight agree very well between the two models. However, assuming a realistic parameter regime for perovskite transition-metal oxides such as CaFeO3 around eV and 1-2 eV, our calculated phase diagrams indicates that these materials could be rather close to the LS/HS transition, and therefore might require a treatment within the full model.
Our work shows that the formation of a charge-disproportionated insulator, in a regime where the Hund’s coupling outweighs the strongly screened Coulomb repulsion, is a general feature of multi-band Hubbard models at specific filling levels. Based on this observation, our rather generic cubic five-orbital model represents a good starting point and can serve as reference for future studies of specific materials including, e.g., ferrates and manganites.
*
Acknowledgements.
We thank Sophie Beck and Alexander Hampel for their help regarding the use of soliDMFT and TRIQS/DFTTools as well as for many enlightening discussions, and Alexander Gillmann, who performed initial calculations related to this project for his BSc thesis. This work was supported by ETH Zurich and the Swiss National Science Foundation through NCCR-MARVEL. Calculations have been performed on the cluster “Piz Daint” hosted by the Swiss National Supercomputing Centre and supported under project IDs s889 (User Lab) and mr26 (MARVEL).Appendix A Atomic-limit calculations
The local interaction energies for all low-energy configurations (both LS and HS) with electrons per site, corresponding to the interaction Hamiltonian in Eq. (II.1) are listed in Table 2. The corresponding energies can be expressed exactly in terms of the Slater integrals , , and (see, e.g., Ref. 35), while for the expression in terms of and we use the definitions described in Sec. II.1. The full local energies in the atomic limit are then easily obtained by adding multiples of the crystal-field energy according to the corresponding occupation and the relevant sublattice.
| , LS | ||
|---|---|---|
| , HS | ||
| , LS | ||
| , HS | ||
| , LS | ||
| , HS |
The transition boundary between the homogeneous HS and LS states is then obtained by comparing the corresponding energies:
| (6) |
For the transition between the inhomogeneous CD region and the homogeneous HS and LS regions, respectively, we compare the corresponding energies per two sites:
| (7) |
and:
| (8) |
Here, of course, we assume that in the presence of an site splitting, the HS state is formed on the site with the lower energy.
The border of the Mott insulating regions within the homogeneous HS and LS phases are estimated by comparing the energy of the lowest inter-site charge transfer excitation () with the relevant band width. Note that for the homogeneous HS region, this results in the same energy terms as in Eq. (7), , but now this is set equal to the band width . The same argument is also applied to identify the metal-insulator boundary within the homogeneous LS phase, where the electrons are restricted to states within the sub-manifold and therefore the inter-site charge transfer energy is compared to the band width :
| (9) |
Note that if the right side of Eq. (A) is set to zero, this also defines a potential transition to an inhomogeneous LS phase, which is indeed more favorable than the HS CD state for . However, with eV, this requires eV and simultaneously eV. Since we do not consider this parameter range in our DMFT calculations, we neglect the corresponding phase also in the schematic phase diagram in Fig. 2.
The estimation of the metal-insulator boundary within the inhomogeneous CD region is less straightforward. As mentioned in Sec. III.1, the effective kinetic energy required to destabilize the CDI state towards the homogeneous metal cannot be estimated from simple band-width considerations (at least for ). In addition, the CDI state can be destabilized towards low values through an effective kinetic hopping within only one specific sublattice. As pointed out in Ref. 8, this involves indirect hopping processes, which again complicates a simple band-width estimation of the corresponding kinetic energy.
For the case with hopping only among the nominal sites (), one obtains:
| (10) |
Note that here we have used the average band width as an upper limit for the effective kinetic energy, which corresponds to the red-hatched area around eV in Fig. 2. The true effective band width corresponds to an indirect hopping between sites and is, therefore, expected to be significantly smaller, and thus this transition barely plays a role in our considerations. We can also identify leading to
| (11) |
For the case with hopping only between nominal sites, and assuming that the involved state is LS, one obtains (again using the full band width as upper limit):
| (12) |
This only predicts a metallic state in the region where the hopping between sites is already active, and is therefore not relevant. However, if one considers also hopping through a HS state, and using an average band width as in Eq. (A), one obtains:
| (13) |
This can in principle destabilize the CDI state for very low and very high and is also indicated by the red-hatched area in Fig. 2.
Finally, we note that none of the multiplet energies listed above would be affected by the spin-flip and pair-hopping terms that we ignore within the density-density approximation, Eq. (II.1). These additional terms would only affect higher energy multiplets, which are not crucial for a correct description of the ground state phase diagram, as they do not affect the phase boundaries obtained from this atomic limit consideration. This provides a good a priori justification for our use of the density-density approximation.
References
- Imada et al. [1998] M. Imada, Y. Tokura, and A. F. Fujimori, Reviews of Modern Physics 70, 1039 (1998).
- Hubbard [1963] J. Hubbard, Proceedings of the Royal Society of London. Series A. Mathematical and Physical Sciences 276, 238 (1963).
- Kanamori [1963] J. Kanamori, Progress of Theoretical Physics 30, 275 (1963).
- Georges et al. [2013] A. Georges, L. d. Medici, and J. Mravlje, Annual Review of Condensed Matter Physics 4, 137 (2013).
- Yin et al. [2011] Z. P. Yin, K. Haule, and G. Kotliar, Nature Materials 10, 932 (2011).
- Chatzieleftheriou et al. [2020] M. Chatzieleftheriou, M. Berović, P. Villar Arribi, M. Capone, and L. de’ Medici, Physical Review B 102, 205127 (2020).
- Richaud et al. [2021] A. Richaud, M. Ferraretto, and M. Capone, Physical Review B 103, 205132 (2021).
- Subedi et al. [2015] A. Subedi, O. E. Peil, and A. Georges, Physical Review B 91, 075128 (2015).
- Isidori et al. [2019] A. Isidori, M. Berović, L. Fanfarillo, L. de’ Medici, M. Fabrizio, and M. Capone, Physical Review Letters 122, 186401 (2019).
- Ryee et al. [2020] S. Ryee, P. Sémon, M. J. Han, and S. Choi, npj Quantum Materials 5, 1 (2020).
- Strand [2014] H. U. R. Strand, Physical Review B 90, 155108 (2014).
- Springer et al. [2020] D. Springer, B. Kim, P. Liu, S. Khmelevskyi, S. Adler, M. Capone, G. Sangiovanni, C. Franchini, and A. Toschi, Physical Review Letters 125, 166402 (2020).
- McNally et al. [2015] D. E. McNally, S. Zellman, Z. P. Yin, K. W. Post, H. He, K. Hao, G. Kotliar, D. Basov, C. C. Homes, and M. C. Aronson, Physical Review B 92, 115142 (2015).
- Budich et al. [2013] J. C. Budich, B. Trauzettel, and G. Sangiovanni, Physical Review B 87, 235104 (2013).
- Alonso et al. [1999] J. A. Alonso, J. L. García-Muñoz, M. T. Fernández-Díaz, M. A. G. Aranda, M. J. Martínez-Lope, and M. T. Casais, Physical Review Letters 82, 3871 (1999).
- Alonso et al. [2000] J. A. Alonso, M. J. Martínez-Lope, M. T. Casais, J. L. García-Muñoz, and M. T. Fernández-Díaz, Physical Review B 61, 1756 (2000).
- Mazin et al. [2007] I. I. Mazin, D. I. Khomskii, R. Lengsdorf, J. A. Alonso, W. G. Marshall, R. M. Ibberson, A. Podlesnyak, M. J. Martínez-Lope, and M. M. Abd-Elmeguid, Physical Review Letters 98, 176406 (2007).
- Park et al. [2012] H. Park, A. J. Millis, and C. A. Marianetti, Physical Review Letters 109, 156402 (2012).
- Varignon et al. [2017] J. Varignon, M. N. Grisolia, J. Íñiguez, A. Barthélémy, and M. Bibes, npj Quantum Materials 2, 1 (2017).
- Peil et al. [2019] O. E. Peil, A. Hampel, C. Ederer, and A. Georges, Physical Review B 99, 245127 (2019).
- Mizokawa et al. [2000] T. Mizokawa, D. I. Khomskii, and G. A. Sawatzky, Physical Review B 61, 11263 (2000).
- Johnston et al. [2014] S. Johnston, A. Mukherjee, I. Elfimov, M. Berciu, and G. A. Sawatzky, Physical Review Letters 112, 106404 (2014).
- Takano et al. [1977] M. Takano, N. Nakanishi, Y. Takeda, S. Naka, and T. Takada, Materials Research Bulletin 12, 923 (1977).
- Takeda et al. [1978] Y. Takeda, S. Naka, M. Takano, T. Shinjo, T. Takada, and M. Shimada, Materials Research Bulletin 13, 61 (1978).
- Kawasaki et al. [1998] S. Kawasaki, M. Takano, R. Kanno, T. Takeda, and A. Fujimori, Journal of the Physical Society of Japan 67, 1529 (1998).
- Woodward et al. [2000] P. M. Woodward, D. E. Cox, E. Moshopoulou, A. W. Sleight, and S. Morimoto, Physical Review B 62, 844 (2000).
- Takeda et al. [2000] T. Takeda, R. Kanno, Y. Kawamoto, M. Takano, S. Kawasaki, T. Kamiyama, and F. Izumi, Solid State Sciences 2, 673 (2000).
- Wu et al. [2014] M. Wu, L. Zheng, S. Chu, Z. Qin, X.-J. Chen, C. Lin, Z. Tang, and T. Hu, The Journal of Physical Chemistry C 118, 23274 (2014).
- Cheng et al. [2015] J. Cheng, K. E. Kweon, S. A. Larregola, Y. Ding, Y. Shirako, L. G. Marshall, Z.-Y. Li, X. Li, A. M. dos Santos, M. R. Suchomel, K. Matsubayashi, Y. Uwatoko, G. S. Hwang, J. B. Goodenough, and J.-S. Zhou, Proceedings of the National Academy of Sciences 112, 1670 (2015).
- Takano et al. [1991] M. Takano, S. Nasu, T. Abe, K. Yamamoto, S. Endo, Y. Takeda, and J. B. Goodenough, Physical Review Letters 67, 3267 (1991).
- Ahn and Millis [2000] K. H. Ahn and A. J. Millis, Physical Review B 61, 13545 (2000).
- Pavarini and Koch [2010] E. Pavarini and E. Koch, Physical Review Letters 104, 086402 (2010).
- Ederer et al. [2007] C. Ederer, C. Lin, and A. J. Millis, Physical Review B 76, 155105 (2007).
- Hampel [2019] A. Hampel, Interplay between structural, electronic, and magnetic properties in rare-earth nickelates, Ph.D. thesis, ETH Zurich (2019).
- Pavarini et al. [2011] E. Pavarini, E. Koch, D. Vollhardt, and A. Lichtenstein, eds., The LDA+DMFT approach to strongly correlated materials: Lecture Notes of the Autumn School 2011 (Forschungszentrum Jülich, Jülich, 2011).
- Kresse and Hafner [1993] G. Kresse and J. Hafner, Physical Review B 47, 558 (1993).
- Kresse and Furthmüller [1996] G. Kresse and J. Furthmüller, Physical Review B 54, 11169 (1996).
- Perdew et al. [2008] J. P. Perdew, A. Ruzsinszky, G. I. Csonka, O. A. Vydrov, G. E. Scuseria, L. A. Constantin, X. Zhou, and K. Burke, Physical Review Letters 100, 136406 (2008).
- Morimoto et al. [1996] S. Morimoto, T. Yamanaka, and M. Tanaka, Acta Crystallographica Section A Foundations of Crystallography 52, C310 (1996).
- Rogge et al. [2019] P. C. Rogge, R. J. Green, R. Sutarto, and S. J. May, Physical Review Materials 3, 084404 (2019).
- Zhang et al. [2018] Y. Zhang, M. M. Schmitt, A. Mercy, J. Wang, and P. Ghosez, Physical Review B 98, 081108(R) (2018).
- Mercy et al. [2017] A. Mercy, J. Bieder, J. Íñiguez, and P. Ghosez, Nature Communications 8, 1677 (2017).
- Georges et al. [1996] A. Georges, G. Kotliar, W. Krauth, and M. J. Rozenberg, Reviews of Modern Physics 68, 13 (1996).
- Parcollet et al. [2015] O. Parcollet, M. Ferrero, T. Ayral, H. Hafermann, I. Krivenko, L. Messio, and P. Seth, Computer Physics Communications 196, 398 (2015).
- Aichhorn et al. [2016] M. Aichhorn, L. Pourovskii, P. Seth, V. Vildosola, M. Zingl, O. E. Peil, X. Deng, J. Mravlje, G. J. Kraberger, C. Martins, M. Ferrero, and O. Parcollet, Computer Physics Communications 204, 200 (2016).
- Hampel et al. [2020] A. Hampel, S. Beck, and M. E. Merkel, “soliDMFT,” https://github.com/materialstheory/soliDMFT (2020).
- Seth et al. [2016] P. Seth, I. Krivenko, M. Ferrero, and O. Parcollet, Computer Physics Communications 200, 274 (2016).
- Boehnke et al. [2011] L. Boehnke, H. Hafermann, M. Ferrero, F. Lechermann, and O. Parcollet, Physical Review B 84, 075145 (2011).
- Schäfer et al. [2021] T. Schäfer, N. Wentzell, F. Šimkovic, Y.-Y. He, C. Hille, M. Klett, C. J. Eckhardt, B. Arzhang, V. Harkov, F.-M. Le Régent, A. Kirsch, Y. Wang, A. J. Kim, E. Kozik, E. A. Stepanov, A. Kauch, S. Andergassen, P. Hansmann, D. Rohe, Y. M. Vilk, J. P. LeBlanc, S. Zhang, A.-M. Tremblay, M. Ferrero, O. Parcollet, and A. Georges, Physical Review X 11, 011058 (2021).
- Jarrell and Gubernatis [1996] M. Jarrell and J. E. Gubernatis, Physics Reports 269, 133 (1996).
- Kraberger and Zingl [2020] G. J. Kraberger and M. Zingl, “MaxEnt,” https://github.com/TRIQS/maxent (2020).
- de’ Medici et al. [2011] L. de’ Medici, J. Mravlje, and A. Georges, Physical Review Letters 107, 256401 (2011).
- Note [1] We note that within the density-density approximation for the interaction Hamiltonian, Eq. (II.1), the magnetic quantum number and not the total spin is the relevant quantum number indicating the spin state of the system.
- Seth et al. [2017] P. Seth, O. E. Peil, L. Pourovskii, M. Betzinger, C. Friedrich, O. Parcollet, S. Biermann, F. Aryasetiawan, and A. Georges, Physical Review B 96, 205139 (2017).