Coincident detection significance in multimessenger astronomy
Abstract
We derive a Bayesian criterion for assessing whether signals observed in two separate data sets originate from a common source. The Bayes factor for a common vs. unrelated origin of signals includes an overlap integral of the posterior distributions over the common source parameters. Focusing on multimessenger gravitational-wave astronomy, we apply the method to the spatial and temporal association of independent gravitational-wave and electromagnetic (or neutrino) observations. As an example, we consider the coincidence between the recently discovered gravitational-wave signal GW170817 from a binary neutron star merger and the gamma-ray burst GRB 170817A: we find that the common source model is enormously favored over a model describing them as unrelated signals.
tablenum \restoresymbolSIXtablenum
1 Introduction
On August 17th 2017, the observation by LIGO-Virgo of GW170817, a binary neutron star coalescence (BNS) (Abbott et al., 2017b, a), and by Fermi and INTEGRAL of GRB 170817A, a short gamma-ray burst (GRB) (Goldstein et al., 2017; Savchenko et al., 2017), began an unprecedented multimessenger observing campaign (Abbott et al., 2017c). Detections and non-detections across the electromagnetic (EM) spectrum and by neutrino observatories have already produced new insights and will continue to do so for some time yet.
Many of these insights critically depend on the significance of the association between the independent observations. Often, such significance is established by estimating a p-value, the probability of such an event or a more extreme event occurring under the null hypothesis that the observations originate from unrelated distinct sources. Specific applications include, e.g. Abbott et al. (2017a); Coulter et al. (2017); Soares-Santos et al. (2017) for GW170817 and its counterparts, Baret et al. (2012); Aartsen et al. (2014); Keivani et al. (2015) for offline triggered search methods, and Urban (2016) for online rapid identification. A small p-value demonstrates the data is inconsistent with the null hypothesis. The p-value cannot, though, be interpreted as the probability of the null hypothesis itself (Gelman et al., 2013). On the other hand, a large p-value does not necessarily imply that the null hypothesis has to be accepted, only that it cannot be rejected (Gregory, 2005).
We introduce a different, generic model comparison method to determine whether two events in separate data sets are produced by a common source or by unrelated phenomena. This Bayesian measure of significance asks fundamentally different questions compared to the Frequentist p-value approach: it quantifies a degree of belief or confidence when comparing two hypotheses, given a particular non-repeatable observation, while the p-value determines the consistency of the null hypothesis with the data and the error rate of determining significance (which is important for initial identification). (See Finn (1998) for a related discussion in the context of detection itself). The method is a direct comparison of the probabilities of alternative models and does not require empirical estimates of a background distribution for the interpretation of its result (although this may be necessary if the assumptions about the background are not trusted). Moreover, the framework requires explicit statements of the necessary assumptions; in particular, prior distributions on the relevant parameters and conditions for which significance can be factorized for different common model parameters (discussed later in Sec. 2.3). This approach is distinct from that of Kelley et al. (2013) in which the EM data is used as prior information to understand improvements in sensitivity for triggered searches.
In Sec. 2 we introduce the method in a general context; Eq. (16) is our primary result and describes how to calculate the Bayes factor for a common-source origin of two signals seen in separate data streams. In Sec. 3 we focus on the application of the method to multimessenger astronomy, considering a calculation of spatial and temporal significance. As an example, we apply it to the gravitational-wave and gamma-ray events GW170817 and GRB 170817A, showing that it strongly supports the hypothesis that they originate from a common source.
2 Generic derivation
2.1 Model comparisons
Given two detections and in different data sets and , we would like to assess the hypothesis that they originate from a common source. In general, the two detections will be described by different physical signal models and , respectively. Each signal model will imply a likelihood, a set of parameters and an associated prior for those parameters. To assess whether they originate from a common source, the models must share a common set of parameters .
We’ll use notation where denotes a hypothesis with a particular choice for the parameters , while by itself denotes a hypothesis with unknown parameters, i.e. “for any choice of parameters ”. We can formally write this as .
Then, we define the common-source hypothesis:
| (1) |
We also define as the noise hypotheses (by which we mean any non-signal) for each data set. Then we can define any alternative hypothesis for which the observed detections in and are unrelated:
| (2) |
where , . We write this in a general form, but note that the noise hypothesis will not have any common model parameters. In total, there are four possible realizations of , which we consider in detail below. However, is of particular interest in this work, being two unrelated signals from distinct sources.
These hypotheses imply priors on which in general differ from those implied by individually: if a common source can only be detected in some subset of , then can only have prior support restricted to this subset. If this is not true, we identify the special case
| (3) |
The probability of the common-source hypothesis is given by
| (4) |
In this work, we will calculate the odds between and different choices of
| (5) | ||||
where
| (6) |
is the Bayes factor and is the prior odds. In Sec. 2.2 we discuss the calculation of the Bayes factor in general. The prior odds will depend on the context, but in Sec. 3.1.3 we calculate the prior odds modeling and as realizations of a Poisson point process.
2.2 Derivation of the Bayes factor
If both data sets contain a signal from the same event, then they are not independent: . Instead we must compute
| (7) | ||||
where the domain of the integral in the second line is restricted to the prior support of , namely
| (8) |
The need for this restriction arises because assuming that and are both true would be a contradiction if , and so would be undefined. Rearranging the likelihood in the integrand
| (9) | ||||
where in the second step we have used that the likelihoods conditional on can be separated for the two data sets, provided that is the set of all model parameters common between the two likelihoods. In the last step, we again used that within the integration interval. A subtle point is that is the posterior distribution for the common model parameters (given either ) marginalized over all other model parameters and using the prior implied by .
Substituting Eq. (9) into Eq. (7)
| (10) |
where the posterior overlap integral
| (11) |
quantifies the agreement between the posterior distributions of derived independently. In this integral, the prior has the effect of setting a scale against which the degree of overlap can be compared.
Eq. (10)-(11) demonstrate how probabilities from separate data sets combine when each provides independent inferences about a common model parameter.
Returning to the Bayes factor, by our definition of the alternative hypothesis
| (12) |
So from Eq. (6),
| (13) |
We now specify three particular cases of interest for the alternative hypothesis. First, consider : both and are caused by noise. Then Eq. (13) specializes to
| (14) |
where , in analogy with Eq. (6), is the common-source against noise Bayes factor. In the special case of Eq. (3), it can be shown that , i.e. the independent signal against noise Bayes factor for each data stream.
This agrees with our intuition: if both signals are strong compared to the background noise and there is a good overlap of their common model parameters (quantified by the integral), we believe they originate from a common event. This is a powerful result as one can compute the joint Bayes factor from the common-source against noise Bayes factor for each detection individually, and the posterior overlap integral of . Eq. (14) has analogous applications to the Fisher combined probability test used in Aartsen et al. (2014).
Second, consider : was due to a signal, but was due to noise. For this case, Eq. (13) gives
| (15) |
For us to believe that detection is a real signal and originates from the same source as , we require that the product of the Bayes factor for common-source against noise in and the posterior overlap be large. The case is analogous and the same special cases apply as mentioned previously.
Finally, consider , the distinct-source hypothesis: both and are of the same nature as in the common-source hypothesis , but they are physically distinct (i.e. they belong to unrelated sources with different parameters ). Then,
| (16) |
This equation and the posterior overlap integral of Eq. (11) are the main results of this paper. This provides a simple and intuitive way to assess whether two detections originate from the same event, based on the posterior overlap of their common model parameters.
2.3 Factorization of the posterior overlap integral
When calculating , it is often convenient to factorize the posterior overlap integral, e.g. where and . This factorization can only be performed, however, if . There are situations in which this is the case, for example if the joint posterior distribution is an uncorrelated multivariate normal distribution. But generally, this will not be the case and the posterior over the full common parameter space must be used. There are however cases where, under certain assumptions, the integral can be approximately factorized. We will explore one such setting in the next Section.
3 Application to multimessenger transient astronomy
We now focus on the application of the above formalism to multimessenger transient astronomy. To guide our intuition, we consider a transient gravitational wave (GW) candidate and a detection made by an EM instrument, although, we could just as well consider any pair of EM, GW or neutrino detectors. Assuming that detections are made in both the GW and EM detectors and are independently significant, we aim to calculate , the odds quantifying the probability of the common-source hypothesis to a distinct-source hypothesis.
The Bayes factor should be calculated from all common source parameters; typically, this will involve parameters such as a characteristic time of the event, source direction, luminosity distance, and source orientation (Troja et al., 2017; Margutti et al., 2017). Ideally, the posterior overlap integral should be computed over the complete joint distribution of parameters since it will not generally factorize (see Sec. 2.3).
However, to illustrate the utility of the method, we will calculate the result considering only the spatial and temporal common parameters (specifically, the source direction and coalescence time of the BNS system ) and make assumptions under which the posterior overlap integral may be factorized. We also consider both observatories to be all-sky, neglecting non-isotropic and non-stationary sensitivity. The Bayes factor can then be calculated from Eq. (17) since the special case of Eq. (3) applies.
3.1 Example
To calculate the Bayes factor, Eq. (17), we first write down the posterior overlap integral over the conditional joint distribution of the spatial and temporal parameters
| (18) | ||||
We will now show that this can be factorized into a spatial and temporal overlap under the following assumptions. First, that the prior itself factors, . Second, that inferred from the GW data is exactly determined, i.e.
| (19) |
where the “hat” indicates the observed value. Then, Eq. (18) can be factorized as , where
| (20) |
and
| (21) |
This factorization is exact under the two assumptions made. However, the coalescence time is typically known with a nonzero uncertainty. For this case, taking to be a point estimate (the mean for example), the factorization is approximate, but applicable provided that over the uncertainty in , , , and do not vary substantially. In Sec. 3.1.1 and Sec. 3.1.2, we will provide approximations for Eq. (20) and (21) under some reasonable assumptions and illustrate some of the subtleties in their calculation.
We note that a similar result to Eq. (21) was previously derived in Urban (2016); in particular, Eq. (3.6) of that work is equivalent to Eq. (21) assuming an isotropic prior. Then the resulting joint likelihood ratio is defined using the alternative hypothesis that went into Eq. (15).
3.1.1 Temporal overlap
To evaluate Eq. (20), the temporal overlap, we first need to consider how to compute , the coalescence time given the EM observations. Typically, EM observations do not directly infer , but some other well defined time , e.g. the time of peak luminosity. We therefore need to specify a model that relates these two times. One simple model is that both signals travel at the speed of light, but there is a delay between the coalescence time and the EM emission which will depend on the physics (see, e.g. Finn et al. (1999); Abadie et al. (2012) for GRB delay time predictions), but also on how is defined. To fold these predictions into the analysis, we must specify , a prior distribution on the delay-time (at the Earth), given the model. Assuming and are independent, the posterior can be transformed as
| (22) |
where denotes the posterior distribution of .
Having defined how to relate the time inferred by the EM data to the coalescence time with a suitable model, we now calculate Eq. (20) under some simple assumptions. Eq. (19) was the first of these assumptions and was already applied in factorizing the full posterior overlap integral. In addition, let
| (23) |
Next we need a prior for the delay in the GW-EM arrival time, which could be due to differences in emission time or propagation speed of GW and EM radiation. For simplicity we take a uniform distribution,
| (24) |
That is, the EM emission can arrive any time between a minimum and maximum value compared to the GW-inferred coalescence time; outside of that interval, we are certain the two events are not related. Inserting these definitions into Eq. (22), we obtain
| (25) |
from which the numerator of Eq. (20) can be calculated.
The prior on the coalescence time, given and a co-observing time of duration , is , where is chosen to be zero at the start of the co-observing time. The period should cover the entire range of for which the posteriors (in this example, Eq. (19) and (25)) have nonzero support from the data, but is otherwise an arbitrary normalization of the time prior. Then, Eq. (20) gives
| (28) |
where . The dependence on would suggest that we can arbitrarily change the significance through the Bayes factor by adjusting . However, as will be shown in Sec. 3.1.3, this factor cancels with the prior odds , which depends on both and the rate of events, such that the odds themselves are -independent. We also will see that in a particular class of cases the temporal odds can be well approximated by this Bayes factor, setting to the average interval between signals detectable in EM, (i.e. the inverse of the rate of such signals).
3.1.2 Spatial overlap
We now discuss calculating Eq. (21), the spatial posterior overlap integral. The EM counterparts to GW events are expected to originate from the same source direction and hence can be directly computed from Eq. (21).
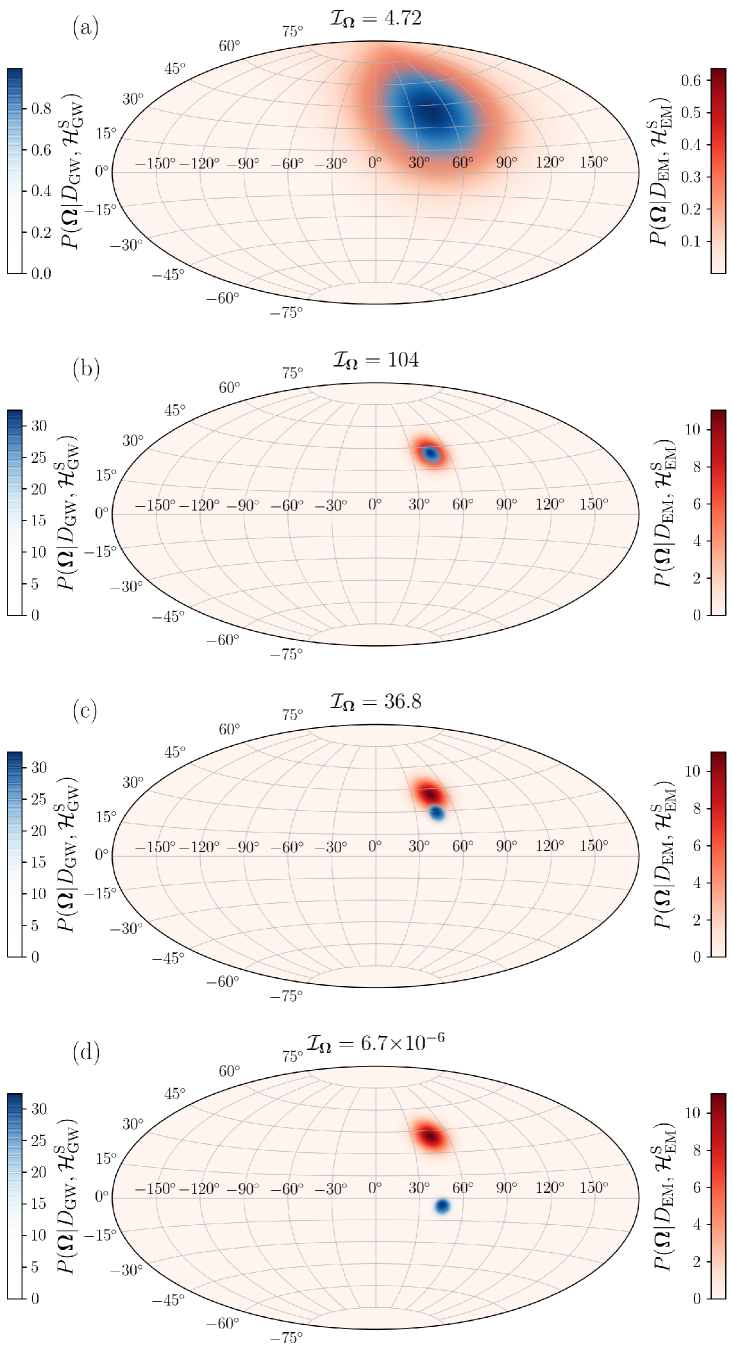
To illustrate the subtleties of and provide some intuition, in Fig. 1, we show four examples varying the size of the uncertainty region and angular separation of the means of the EM and GW sky localizations. For all examples, a uniform all-sky prior is used. In Fig. 1(a), the means of both posteriors are aligned, but the uncertainty on both is large with respect to the all-sky prior; therefore, is greater than one, but not large enough to be of note. For Fig. 1(b), strongly indicates the two detections are from the same event: the means are aligned and the uncertainties are small with respect to the all-sky prior. In Fig. 1(c) and (d), the means of the distributions are not aligned. While in (c) this results in modest evidence in favor of a common event, the separation is sufficiently wide in (d) to strongly disfavor a common source.
To help guide our intuition, we can also calculate for the simplified case where the posterior distributions on the sky are uniform distributions, i.e. constant inside the sets and and zero outside. Labeling the area of set in square radians, we obtain
| (29) | ||||
The prefactor comes from the all-sky prior and acts as a metric to compare the size of the overlap. For example, if is entirely contained within , then : the Bayes factor is determined entirely by the fraction of the sky covered by the uncertainty on the EM detections (or vice versa if the EM posterior is contained within the GW posterior).
3.1.3 The spatial and temporal odds
To calculate the odds in this example via Eq. (5), we require the prior odds. We consider a Poisson point process which produces events detectable via either (or both) their GW or EM emission with a total rate per unit time, acting during the co-observing time . Further, we let : the total rate is the sum of the rates of events detectable only in GW, events detectable only in EM, and events jointly detectable in both. Then refers to a signal seen by both detectors, and to signals detected in one or other, but not both. Choosing such that , and defining to be the probability of one event given an expected number of signals , we obtain
| (30) | ||||
This prior odds clearly depends on the co-observing time . Combining this with the spatial and temporal Bayes factor (Eq. (21) and (28)) then gives
| (31) |
which is not dependent on the co-observing time. One special case is when , i.e. if signals detectable in EM only are much more frequent than in GW, but we otherwise have little information on the rates of GW detections with or without EM counterparts. This may typically occur if our estimates of and are based on detection. The odds are then proportional to , which reproduces the temporal Bayes factor Eq. (28) setting , i.e. the waiting time between EM detections (where the great majority have no GW counterpart).
As can be expected intuitively, the association becomes less significant if the prior is broader or the prior background rate of signals is higher, but increases with the prior expected rate of joint detections.
3.2 Application to GW170817 and GRB 170817A
We now apply the example calculated in Sec. 3.1 to GW170817 and GRB 170817A, the result of which can be compared with Abbott et al. (2017a). We note that, the calculation presented here could be improved by using the full joint distribution without making assumptions that allow the result to be factorized, and including other pertinent model parameters such as the luminosity distance (for Fermi-GBM, this may be as simple as estimating the range of conceivable values).
The sky localization for the BNS inspiral and short GRB can be seen in Fig. 1 of Abbott et al. (2017a). Using the published localization FITS files (Singer, 2017; Goldstein et al., 2017) and a uniform prior distribution on the whole sky, Eq. (21) yields . The spatial overlap alone provides moderate support for the common-event model, the main limitation being the uncertainty on the localization of GRB 170817A.
If we did not have the actual FITS files, we could still use the published 90% confidence intervals for the sky localization of GW170817 and GRB 170817A and take the localization posterior distributions to be uniform within those intervals. The intervals cover respectively (Abbott et al., 2017c) and (Goldstein et al., 2017) and the GW170817 interval is entirely contained within GRB 170817A. A straightforward application of Eq. (29) then yields an approximate spatial Bayes factor of , which is close to the exact value. Since we do have the full posteriors, however, we can repeat this calculation with different confidence levels. We find that can be biased by a factor of a few in both directions, depending on what confidence level is used; the 90% interval just happens to produce a particularly close number.
In calculating the odds from Eq. (31), there are large uncertainties on the three rates. However, the rate of short GRB detections by Fermi-GBM is well known and must satisfy . One could model the uncertainties to produce beaming and volume corrected estimates for these rates (see e.g. Fong et al. (2015); Siellez et al. (2016)). However, for a simple estimate we assume that and are of similar magnitude, and take to be approximately per-day (Abbott et al., 2017a). Then using s (as used in the Abadie et al. (2012) search) in Eq. (31), the odds, including the spatial overlap, are : the odds provide decisive evidence that the two detections originate from the same event.
3.3 Comparison with p-values
There are parallels that can be drawn between the odds calculated in Sec. 3.1 and the p-value approach of (Abbott et al., 2017a); namely, the spatial overlap Eq. (21) with the statistic and the form of the temporal overlap (i.e. inversely proportional to the background rate).
However, the two methods are not equivalent and the numerical values themselves cannot be directly compared, as they answer different questions. The odds is exactly our relative degrees of belief for the common- vs. distinct-source hypotheses, given the assumptions made in the calculation; the p-value tests whether the data is consistent or not with the null (distinct-source) hypothesis, and is typically interpreted as the rate at which a rule for deciding the significance of a joint detection leads to false positives (Finn et al., 1999).
Finally, a more practical difference is that while Eq. (21) can be directly interpreted as a Bayes factor for the spatial overlap, interpreting the statistic requires numerical calculation of the background by randomly rotating a set of observed short GRB sky localizations.
4 Conclusions
We introduce a Bayesian model comparison approach to estimating our confidence that two multimessenger observations are due to a common source as opposed to an accidental coincidence of distinct sources. The primary result of this work is Eq. (16), which generically allows the calculation of the Bayes factor (and, hence, the odds) from the joint posterior distributions of common model parameters inferred independently from two data sets. This approach forces us to recognize the conditions under which the contributions to the Bayes factor can be factorized.
We provide an example where the spatial and temporal overlap calculation can be approximately factorized for two independent observations with isotropic observatories and apply the result to GW170817 and GRB 170817A. We find decisive evidence in favor of their association, consistent with Abbott et al. (2017a).
References
- Aartsen et al. (2014) Aartsen, M. G., Ackermann, M., Adams, J., et al. 2014, Phys. Rev. D, 90, 102002
- Abadie et al. (2012) Abadie, J., Abbott, B. P., Abbott, R., et al. 2012, ApJ, 760, 12
- Abbott et al. (2017a) Abbott, B. P., Abbott, R., Abbott, T. D., et al. 2017a, ApJ, 848, L13
- Abbott et al. (2017b) —. 2017b, Phys. Rev. Lett., 119, 161101
- Abbott et al. (2017c) —. 2017c, ApJ, 848, L12
- Baret et al. (2012) Baret, B., Bartos, I., Bouhou, B., et al. 2012, Phys. Rev. D, 85, 103004
- Coulter et al. (2017) Coulter, D. A., Foley, R. J., Kilpatrick, C. D., et al. 2017, Science
- Finn (1998) Finn, L. S. 1998, in Second Edoardo Amaldi Conference on Gravitational Wave Experiments, ed. E. Coccia, G. Veneziano, & G. Pizzella, 180
- Finn et al. (1999) Finn, L. S., Mohanty, S. D., & Romano, J. D. 1999, Phys. Rev. D, 60, 121101
- Fong et al. (2015) Fong, W., Berger, E., Margutti, R., & Zauderer, B. A. 2015, ApJ, 815, 102
- Gelman et al. (2013) Gelman, A., Carlin, J. B., Stern, H. S., et al. 2013, Bayesian Data Analysis (CRC press)
- Goldstein et al. (2017) Goldstein, A., Veres, P., Burns, E., et al. 2017, ApJ, 848, L14
- Gorski et al. (2005) Gorski, K. M., Hivon, E., Banday, A. J., et al. 2005, ApJ, 622, 759
- Gregory (2005) Gregory, P. 2005, Bayesian Logical Data Analysis for the Physical Sciences: A Comparative Approach with Mathematica® Support (Cambridge University Press)
- Haris et al. (2017) Haris, K., Mehta, A. K., Kumar, S., & Ajith, P. 2017, private communication
- Keivani et al. (2015) Keivani, A., Fox, D. B., Tešić, G., Cowen, D. F., & Fixelle, J. 2015, ArXiv e-prints, arXiv:1508.01315 [astro-ph.HE]
- Kelley et al. (2013) Kelley, L. Z., Mandel, I., & Ramirez-Ruiz, E. 2013, Phys. Rev. D, 87, 123004
- Margutti et al. (2017) Margutti, R., Berger, E., Fong, W., et al. 2017, ApJ, 848, L20
- Savchenko et al. (2017) Savchenko, V., Ferrigno, C., Kuulkers, E., et al. 2017, ApJ, 848, L15
- Siellez et al. (2016) Siellez, K., Boer, M., Gendre, B., & Regimbau, T. 2016, ArXiv e-prints, arXiv:1606.03043 [astro-ph.HE]
- Singer (2017) Singer, L. 2017, GW170817 sky localization, https://dcc.ligo.org/LIGO-G1701985/public
- Soares-Santos et al. (2017) Soares-Santos, M., Holz, D. E., Annis, J., et al. 2017, ApJ, 848, L16
- Troja et al. (2017) Troja, E., Piro, L., van Eerten, H., et al. 2017, Nature
- Urban (2016) Urban, A. L. 2016, Ph.D. dissertation, University of Wisconsin-Milwaukee, https://search.proquest.com/docview/1806791084