Collective sensing of -cells generates the metabolic code at optimal islet size
Abstract
Major part of a pancreatic islet is composed of beta cells that secrete insulin, a key hormone regulating influx of nutrients into all cells in a vertebrate organism to support nutrition, housekeeping or energy storage. Beta cells constantly communicate with each other using both direct, short-range interactions through gap junctions, and paracrine long-range signaling. However, how these cell interactions shape collective sensing and cell behavior in islets that leads to insulin release is unknown. When stimulated by specific ligands, primarily glucose, beta cells collectively respond with expression of a series of transient Ca2+ changes on several temporal scales. Here we analyze a set of Ca2+ spike trains recorded in acute rodent pancreatic tissue slice under physiological conditions. We found strongly correlated states of co-spiking cells coexisting with mostly weak pairwise correlations widespread across the islet. Furthermore, the collective Ca2+ spiking activity in islet shows on-off intermittency with scaling of spiking amplitudes, and stimulus dependent autoassociative memory features. We use a simple spin glass-like model for the functional network of a beta cell collective to describe these findings and argue that Ca2+ spike trains produced by collective sensing of beta cells constitute part of the islet metabolic code that regulates insulin release and limits the islet size.
I Introduction
Endocrine cells in vertebrates act both as coders and decoders of metabolic code Tomkins (1975) that carries information from primary endocrine sensors to target tissues. In endocrine pancreas, energy-rich ligands provide a continuous input to a variety of specific receptor proteins on and in individual beta cells and initiate signaling events in and between these cells Henquin (2009). In an oversimplified medical physiology textbook interpretation, glucose is transported into a beta cell through facilitated diffusion, is phosphorylated and converted within a metabolic black box to ATP, leading to closure of KATP channels, cell membrane depolarization and activation of voltage-activated calcium channels (VACCs), followed by a rise in cytosolic Ca2+ to a micromolar range and triggering of SNARE-dependent insulin release Ashcroft and Rorsman (1989). However, glucose may influence beta cells signaling through several additional routes. There may be alternative glucose entry routes, like for example active Na-glucose cotransport Tomita (1976); Trautmann and Wollheim (1987), alternative calcium release sites, like ryanodine Islam (2002) and IP3 receptors Lang (1999) or glucose may directly activate the sweet taste receptor and initiate signaling Henquin (2012), to name a few. Activation of a beta cell on a single cell level therefore likely involves triggering of a variety of elementary Ca2+ events Berridge et al. (2000), which interfere in space and time into a unitary beta cell Ca2+ response to support Ca2+-dependent insulin release. This Ca2+-dependent insulin release can be further modulated by activation of different protein phosphorylation/dephosphorylation patterns (PKA, PKC, Cdk5, etc) Skelin and Rupnik (2011); Mandic et al. (2011) or other protein modifications Paulmann et al. (2009) to either reduce or increase the insulin output.
One of the important features of the sensory collectives is the optimization of the spatial relations between its elements to maximize the precision of sensing Fancher and Mugler (2017). In islets of Langerhans, beta cells dwell as morphologically well defined cellulo-social collectives. These ovoid microorgans are typically not longer than 150 micrometers. The relatively small and constant pancreatic islet size is an intriguing feature in vertebrate biology. The size distribution of islets is comparable in humans, rodents and wider within different vertebrate species, irrespective of evident differences in overall body and pancreas size as well as total beta cell mass Dolenšek et al. (2015); Kim et al. (2009). In mice, islet sizes range between 50 m and 600 m, with a median values below 150 m Lamprianou et al. (2011). To accommodate differences in the body size, there is nearly a linear relationship between the total number of similarly sized islets and body mass across different vertebrate species Montanya et al. (2000); Bouwens and Rooman (2005). However, why are islets so conserved in size is unknown.
All beta cells within an islet collective represent a single functional unit, electrically and chemically coupled network, with gap junction proteins, Connexins 36 (Cx36) Bavamian et al. (2007), for short-range interactions and with paracrine signalling Caicedo (2013) for long-range interactions between cells. The unitary cell response in one beta cell influences the formation of similar responses in neighboring beta cells and contributes to coordination of a large number of beta cells Stožer et al. (2013a); Cigliola et al. (2013). Explorations of these functional beta cell networks, constructed from thresholded pairwise correlations of Ca2+ imaging signals Stožer et al. (2013b); Markovič et al. (2015); Johnston et al. (2016), showed that strongly correlated subsets of beta cell collective organize into modular, broad-scale networks with preferentially local correlations reaching up to 40 m Markovič et al. (2015), but understanding of mechanisms that lead to these strongly correlated networks states in beta cell populations is still lacking. We argue that beta cells sense, compute and respond to information as a collective, organized in a network similar to sensory neuron populations Schneidman et al. (2006); Tkačik and Bialek (2016), and not as a set of independent cells strongly coupled only when stimulation is high enough.
Here we analyze pairwise correlations of Ca2+ spike trains (unitary beta cell responses on the shortest temporal scale) in beta cell collective recorded in fresh pancreatic tissues slice under changing glucose stimulation conditions (6 mM subtreshold - 8 mM stimulatory). We look at weak correlations between beta cells which we found to be widely spread across the islet Azhar and Bialek (2010). Guided by the use of statistical physics models in describing populations of neurons Schneidman et al. (2006); Tkacik et al. (2009), we use a simple spin glass model for Ca2+ beta cells activity and show that it well captures the features observed in the measured data. In a way, we recognize this efficiency of simple models in both neuronal and endocrine cell collectives as one manifestation of the ”beauty in function” Rasmussen (1970).
II Spin model of a -cell collective
Spin models have been borrowed from statistical physics to describe the functional behavior of large, highly interconnected systems like sensory neurons Schneidman et al. (2006); Tkacik et al. (2009); Tkačik et al. (2014), immune system Parisi (1990), protein interactions Bryngelson and Wolynes (1987), financial markets Bornholdt (2001); Krawiecki et al. (2002), and social interactions between mammals Daniels et al. (2016, 2017).
The model of the islet consist of cells; at time each of the cells can be in one of two states, spiking or silent, represented by a spin variable , (). The effective field of the i-th cell has two contributions: one from the cell interacting with all other cells with interaction strength , and one from external field . We assume that interactions extend over the whole system.
| (1) |
At the next moment (t+1) each cell updates its state with the probability to and with the probability to . The probability depends on the effective field that the i-th cell senses:
| (2) |
The interaction strength is a fluctuating quantity with contributions from amplitude J common to all links and from the pairwise contributions with amplitude I Krawiecki et al. (2002): . Here are the fluctuations and random variables uniformly distributed in the interval . The external field is also a random variable, uniformly distributed in the interval . In the mean-field approximation the average state of the system , evolves with time according to Krawiecki et al. (2002):
| (3) |
where we set . For the computations here, we estimate the boundaries of the external field interval from non-interacting mean field model () corresponds to non-stimulating glucose concentration (6 mM), so that and . In our models we set for the pairwise interaction amplitude.
III Results
The functional multicellular imaging (fMCI) records a full temporal activity trace for every cell in an optical plane of an islet from which meaningful quantitative statements about the dynamics of unitary Ca2+ responses and information flow in the beta cell collective are possible Stožer et al. (2013a); Dolenšek et al. (2013). Briefly, after the stimulation with increased glucose level, first asynchronous Ca2+ transients appear, followed by a sustained plateau phase with oscillations on different temporal scales, from slow oscillations (100-200 secs) to trains of fastest Ca2+ spikes (1-2 secs). As the relation between the rate of insulin release and cytosolic Ca2+ activity shows saturation kinetics with high cooperativity Skelin and Rupnik (2011), the insulin release probability is significantly increased during these Ca2+ spikes.
Initially, fMCI has been done at the glucose concentrations much higher than those at which beta cells usually operate. The main reason for this was to ensure comparability of the results with the mainstream research in the field using mostly biochemical approaches. At 16 mM glucose, a collective of beta cells responds in a fast, synchronized, and step-like manner. Therefore the first interpretation has been that gap junction coupling between neighboring beta cells presents a major driving force for the beta cell activation and inhibitory dynamics Markovič et al. (2015); Hraha et al. (2014). Accordingly, the removal of Cx36 proteins does cause hyperinsulinemia at resting glucose levels and blunted responses to stimulatory glucose concentration Speier et al. (2007). Since beta cells in fresh pancreatic tissue slices are sensitive to physiological concentration of glucose (6-9 mM) Speier and Rupnik (2003), we here focused on this less explored concentration range. We looked at the spiking part of the Ca2+ imaging signals for which it has been previously shown to contain enough information to allow reconstruction of functional cell networks Stetter et al. (2012).
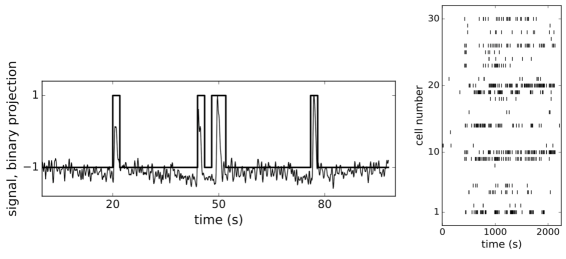
For the present analysis we used a dataset of individual Ca2+-dependent events from ROIs with known positions from the central part of the fresh rodent pancreatic oval shaped islet (370 um in length and 200 um wide), representing beta cells, recorded with fMCI technique at 10 Hz over period of 40 minutes. During the recording the glucose concentration in the solution filling the recording chamber has been increased from 6 mM to 8 mM, reaching equilibration at around 200 s after the start of the experiment, and then decreased to initial concentration near the end of experiment at around 2000 s. We applied ensemble empirical mode decomposition Luukko et al. (2016) on recorded traces to isolate the Ca2+ spiking component of the signal. Finally, we binarized the signals using 2 s wide bins (Fig. 1, left panek) and obtained binary spike trains , (), of beta cells’ Ca2+ activity, each cell represented as a spin. An example of spiking dynamics of 30 randomly chosen spins is shown as a raster plot in the right panel of Fig. 1.
Similarly to previous work in neuronal populations in vertebrate retina, we used the principle of maximum entropy mostly based on pairwise correlation between cells and which has been successfully used in predicting spiking patterns in cell populations Schneidman et al. (2006); Tkačik et al. (2014); Tkacik et al. (2009); Ferrari et al. (2017). It may seem surprising that models with first and second-order correlation structure work not only when the cell activity is very sparse so the correlations could be described by perturbation theory Roudi et al. (2009), but can reproduce the statistics of multiple co-spiking activity Barton and Cocco (2013); Merchan and Nemenman (2016); Ferrari et al. (2017). We computed truncated correlations
| (4) |
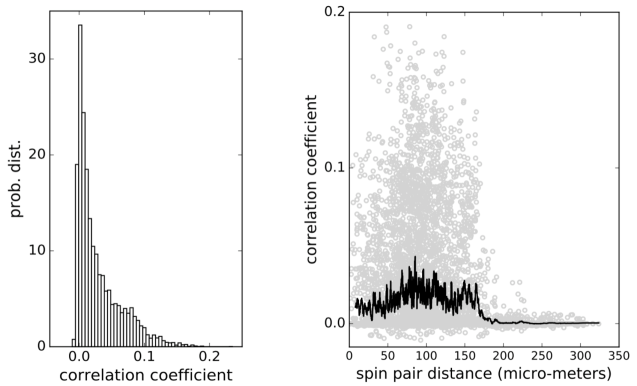
for all pairs of cells. The pairwise correlations found are mostly weak with the distribution shown in Fig. 2 (left panel), but they extend widely over the distances up to 170 m across the islet, which is larger than an average vertebrate islet size (Fig2., right panel). At distances larger than 170 m the correlations decrease sharply towards zero. Such weak and long-ranging pairwise correlations could be the root of criticality and of strongly correlated network states in biological systems Mora and Bialek (2011); Schneidman et al. (2006); Azhar and Bialek (2010); Tkačik et al. (2015).
To check for the existence of strongly correlated states in weakly correlated beta cell collective we computed probability distributions of simultaneously spiking cells in groups of cells. While the of randomly reshuffled spike trains expectedly follows Poisson distribution (left panel in Fig. 3, black crosses and dashed line for spins), the observed co-spiking probabilities are orders of magnitude higher (diamonds in left panel of Fig. 3 for spins) than corresponding probabilities in groups of independent spins. The statistics of these co-spiking events were described by an exponential distribution Schneidman et al. (2006), by finding the effective potential Tkačik et al. (2013, 2014) matching the observed and adding it to the hamiltonian of pairwise maximum entropy model, or by using beta-binomial distribution Nonnenmacher et al. (2016) where is binomial coefficient and is the beta function.
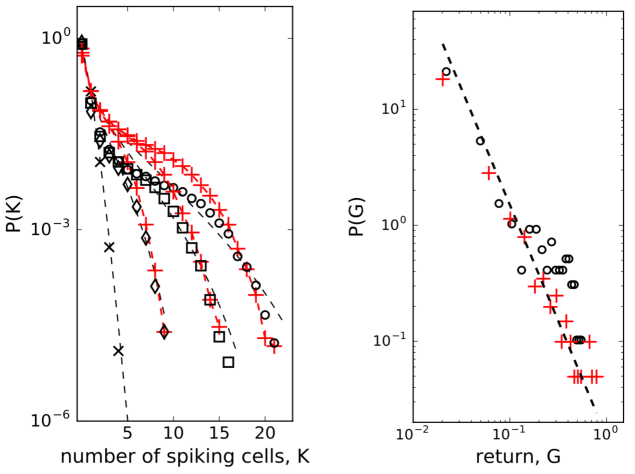
We next run the spin model of 200 -cells and then sampled the computed spike trains to obtain from the model for . Despite its simple structure, the model matches order of magnitude of the observed well when we set the interaction strength at , as shown in the left panel of Fig. 3 (red pluses and red dashed line), particularly for larger values. For comparison, we also show how the beta-binomial model fits to the observed data using the parameters , in all cases. These values are also close to the best-fitting parameters (, ) to the simulated and observer correlated neural population activity data as reported in Nonnenmacher et al. (2016).
The microscopic model of interacting spins with interactions randomly varying in time Krawiecki et al. (2002), adopted here to describe interacting -cell collective, exhibits scaling of price fluctuations Bornholdt (2001) observed in financial markets Gopikrishnan et al. (1999) and on-off intermittency with attractor bubbling dynamics of average price Krawiecki et al. (2002). Following this idea, we looked at the logarithmic return of average state of -cell collective at time Bornholdt (2001): . As presented in the right panel of Fig. 3, the distribution (of positive values) can indeed be approximated with a scaling law: with . Computing the average state with the eq.(3) of the model, we can reproduce the observed distribution by setting on the interaction strength to at s and off to at s. The amplitude of the interaction is consistent with the computation of the co-spiking probability.
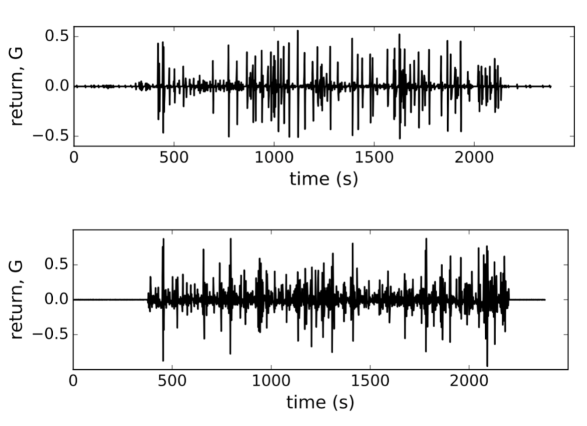
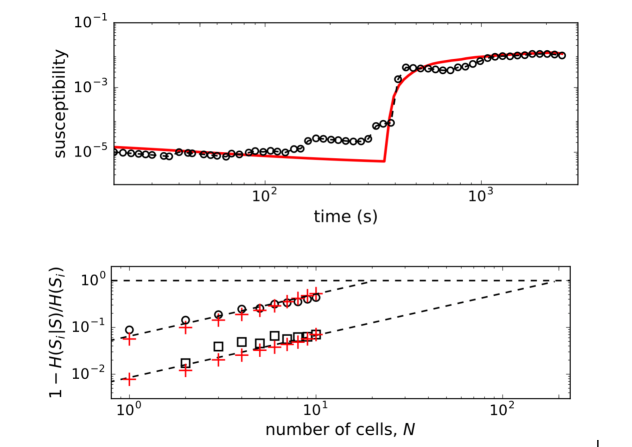
In Fig. 4 we show the plots of both, observed and computed, returns of average state of interacting -cells for comparison. The glucose concentration was changed during the experiment in a stepwise manner: from 6-8 mM at the beginning and back to 6 mM near the end of recording period. The effect of both changes is nicely visible in the plot (upper panel, Fig. 4) where the on-off intermittent dynamics of the average state starts around s and lasts until around s in the experiment. Both observed events are delayed with respect to the times of glucose concentration change due to the asynchronous Ca2+ transients Stožer et al. (2013a). We expect that the response of -cell collective to the stimulus increase must be visible in the variance of average state which is in Ising-like model we are using here equal to susceptibility of the system . In upper panel of Fig. 5 (open black dots) we show the plot of susceptibility as a function of recording time, focusing around the transition to increased glucose concentration during the experiment. There is a sharp increase of susceptibility at around , the same time the on-off intermittency starts to appear in . Using mean field approximation of the spin model eq.(3) for computation of susceptibility (averaged over many runs) and setting for and for we can well describe the observed evolution of susceptibility and capture the rapid onset of increased sensibility of the islet (red line in upper part of Fig. 5).
Pairwise correlation structure enables error-correction features of population coding in neural systems Schneidman et al. (2006). To check for memory-like or error-correcting properties in islets, we use the conditional entropy , the measure for the information we need to determine the state of -th cell (i.e. spiking or not) if we know the states of cells () in a group of cells. If the state of the -th cell is completely determined by other cells, the conditional entropy is zero and the error correction is perfect. When are independent random states, the conditional entropy equals the entropy of the -th cell .
We computed the quantity (normalized mutual information) as a function of number of cells (for small groups of cells) and extrapolate the trend towards the limit that determines the critical number of cells, , needed to predict the state of another cell. As seen in the lower panel of Fig. 5, the predictability is a glucose-dependent parameter. With non-stimulatory glucose concentration, the complete set of data is required for predictions, whereas at 8 mM glucose we find that order of magnitude smaller number of measured cells are needed to predict the states of other cells.
IV Discussion
Pancreatic beta cell continuously intercepts a variety of energy-rich or signaling ligands using the whole spectrum of specific receptors on the cell membrane, as well as in metabolic and signaling pathways within the cell. The cell converts these signals into a binary cellular code, for example a trains of Ca2+ spikes, which drive insulin release that fits current physiological needs of the body. This way, already a single cell can sense its chemical environment with extraordinary, often diffusion limited precision Bialek and Setayeshgar (2005), however, judging by their heterogeneous secretory behavior in cell culture, the precision of sensing among the individual beta cells is quite diverse Hiriart and Ramirez-Medeles (1991). Recent experimental evidence and modeling have shown that cell collectives sense better compared to an individual cell. The precise mechanism of this collective sensing improvement depends on cell-cell communication type, which can be short-range with direct cell contacts or long-range with paracrine signaling Fancher and Mugler (2017). Furthermore, also long-range interaction have its finite reach which can poise a limit to the cell collective size and therefore determines its optimal as well as maximal size. As mentioned in the Introduction, it is intriguing how well conserved is the pancreatic islet size in vertebrates of dramatically different body dimensions Montanya et al. (2000). In a single vertebrate organism the size of the islets can be bigger that 150 um, but functional studies revealed that the islets bigger than 200 um secrete 50% less insulin after glucose stimulation Fujita et al. (2011). These functional differences between small and large islets have been partially attributed to diffusion barriers for oxygenation and nutrition, limiting the survival of core beta cells in bigger islets after isolation. However, reducing these diffusion barriers had no influence on insulin secretory capacity Williams et al. (2010) suggesting other factors, like diffusion of paracrine signaling molecules Caicedo (2013) could limit the collective beta cell function in bigger islets. This dominance of a long-range information flow, likely limited to some physical constraints, has indicated the use of the mathematical equivalency with spin glass-like systems Tkačik and Bialek (2016).
We strongly believe that advanced complex network analysis based on strong short-range correlations can continue to provide valuable information regarding the beta cell network topologies, network on network interactions and describe the functional heterogeneity of individual beta cells Markovič et al. (2015); Johnston et al. (2016); Gosak et al. (2015). However, the main goal of the present study was to determine the influence of weak long-range correlations between pairs of beta cells on the probability of activation of single beta cells. As has recently been shown that it is sufficient to use pairwise correlations to fully quantitatively describe the collective behavior of cell collectives Merchan and Nemenman (2016). The typically small values of pairwise correlation coefficients with the median values below 0.02, would intuitively be ignored and beta cells described as if they act independently. However, it has been shown that in larger populations of cells this assumption fails completely Schneidman et al. (2006). In fact, at physiological stimulatory glucose levels between 6 and 9 mM, beta cell collectives are entirely dominated by weak average pairwise correlations (Fig. 2). Nevertheless, this is the glucose concentration range, where beta cells are most responsive to the nutrient to, as a collective, compute their activity state and pulsatile insulin release, and to meet the organismal needs between the environmental and behavioral extremes of food shortage and excess Schmitz et al. (2008)?
Based on the range of the calculated weak pairwise correlations of up to 170 um (Fig. 2), we predict that beta cells collective falls into a category of sparse packed tissues with dominant paracrine interactions and that cell-cell distances contribute to optimal sensing and functional response in creating the metabolic code governing the release of insulin. It remains unclear whether and how the position of beta cells within an islet is controllable. As many other cells, beta cells are polarized and possess a primary cilium Gan et al. (2017), which should have a primary role in sensory function, i.e. insulin sensing in paracrine signaling Doğaner et al. (2016), and not in cell motility. It is quite interesting though, that the ciliopathies are highly associated with reduced beta cell function and increased susceptibility to diabetes mellitus Gerdes et al. (2014). Future experiments are required to test for the possible motility of beta cells within the islet to adopt an optimal separation of key sensitive beta cells. To further extrapolate the collective sensing idea, it is also possible that the diffuse arrangement of a collective of islets within different parts of pancreas, which are exposed to different vascular inputs Dolenšek et al. (2015), serves to optimize nutrient sensing experience, yet on a higher organizational level, providing a topological information regarding the nutrient levels in different parts of the gastrointestinal tract. The nature and level of interactions between individual islets in the pancreas are currently also unknown.
As in retinal neuron networks, beta cells encode information about the presence of energy-rich nutrients into sequences of intermittent Ca2+ spikes. In a natural setting of sensory neural networks with stimuli derived from a space with very high dimensionality the coding seems challenging and interpretations require some strong assumptions Tkačik et al. (2014). We currently do not understand the input dimensionality of a typical ligand mixture around the beta cells, we simply assume it is not high. As in retinal networks Tkačik et al. (2014); Schneidman et al. (2006), the predictability regarding the functional state of individual beta cells is defined by the network and not the chemical environment. This suggests that the sensory information at physiological glucose levels is substantially redundant. It is likely that the nutrient mixture presents a noisy challenge for the information transfer which is typical for biological system. But why study the insulin release pattern or the metabolic code? The beta cell network possess associative or error-correcting properties (Fig. 5), so this idea from the sensory neuron networks can be generalized also to populations of endocrine cells Schneidman et al. (2006), which may again influence the optimal islet size and suggest the presence of functional subunits within the islet that could adapt, for example, to changing environment in a dynamic fashion. Furthermore, error-correction properties are glucose dependent and can be physiologically modulated (Fig. 5). The trains of Ca2+ spikes at constant glucose stimulation (8 mM) are inhomogeneous, display on-off intermittency (Fig. 4) and scaling of log returns of average state (Fig. 3) analog to models of financial time series Krawiecki et al. (2002). Also here, the sources of stochasticity in an islet collective are various. On one hand, the beta cells make decisions on activation under the influence of the external environment and other beta cells. Second, also the time-dependent interaction strength among beta cells is random, which could reflect their socio-cellular communication network and indicate that the external environment can be sensed differently between different beta cells in an islet.
Biological systems seem to poise themselves at criticality, with a major advantage of enhanced reactivity to external perturbations Mora and Bialek (2011). Often a limited number of individual functional entities, cell or groups of cells as found in pancreatic islets, appeared to be limiting to address criticality. However, it has been recently demonstrated that even in biological systems with small number of interacting entities one can operationally define criticality and observe changes in robustness and sensitivity of adaptive collective behavior Daniels et al. (2017). Our results suggest that beta cells collective within the islet sits near its critical point and we could determine the susceptibility in the islet. Stimulatory glucose concentration (8 mM) has been decreasing distance to criticality by increasing sensitivity (Fig. 5). Smaller distance to criticality at unphysiologically high glucose levels has its possible adverse consequences in a phenomenon called critical slowing down as the system takes more and more time to relax as it comes nearer to the critical point Mora and Bialek (2011). Our preliminary results show that at very strong stimulation (i.e. glucose levels above 12 mM) the whole system freezes into a certain state where short-term interaction take over enabling global phenomena within the islets, e.g. Ca2+ waves Stožer et al. (2013b) requiring progressively longer periods to relax to baseline with increasing glucose concentrations.
The exact nature of the relation between the islet size and collective sensing in pancreatic islets is not clear. In the pathogeneses of different types of diabetes mellitus, the islet size is an important parameter. Until recently it has been thought that in type 1 diabetes mellitus, insulin release is no longer functional. We now know that even in type 1 diabetic patients small and functional collectives of beta cells persist in the pancreata of these patients even decades after the diagnosis Faustman (2014). On the other hand, the beta cells mass in an islet can be increased in type 2 diabetic patients in the initial phases after the diagnosis Rahier et al. (2008) or in animal models Daraio et al. (2017) and can only be reduced in the later phases Rahier et al. (2008). It remains to be established what are the relations between the reduced or increased insulin release, changed islet size and therefore changed circumstances for paracrine signaling in disturbed collective nutrient sensing and during the aforementioned pathogeneses of diabetes mellitus.
Acknowledgements
The authors acknowledge the financial support from the Slovenian Research Agency (research core funding, No. P3-0396), as well as research project, No. N3-0048).
References
- Tomkins (1975) G. M. Tomkins, Science 189, 760 (1975).
- Henquin (2009) J.-C. Henquin, Diabetologia 52, 739 (2009).
- Ashcroft and Rorsman (1989) F. M. Ashcroft and P. Rorsman, Progress in biophysics and molecular biology 54, 87 (1989).
- Tomita (1976) T. Tomita, FEBS letters 65, 140 (1976).
- Trautmann and Wollheim (1987) M. E. Trautmann and C. B. Wollheim, Biochemical Journal 242, 625 (1987).
- Islam (2002) M. S. Islam, Diabetes 51, 1299 (2002).
- Lang (1999) J. Lang, The FEBS Journal 259, 3 (1999).
- Henquin (2012) J.-C. Henquin, Sci. Signal. 5, pe36 (2012).
- Berridge et al. (2000) M. J. Berridge, P. Lipp, and M. D. Bootman, Nature reviews Molecular cell biology 1, 11 (2000).
- Skelin and Rupnik (2011) M. Skelin and M. Rupnik, Cell calcium 49, 89 (2011).
- Mandic et al. (2011) S. A. Mandic, M. Skelin, J. U. Johansson, M. S. Rupnik, P.-O. Berggren, and C. Bark, Journal of Biological Chemistry 286, 28026 (2011).
- Paulmann et al. (2009) N. Paulmann, M. Grohmann, J.-P. Voigt, B. Bert, J. Vowinckel, M. Bader, M. Skelin, M. Jevšek, H. Fink, M. Rupnik, et al., PLoS biology 7, e1000229 (2009).
- Fancher and Mugler (2017) S. Fancher and A. Mugler, Physical Review Letters 118, 078101 (2017).
- Dolenšek et al. (2015) J. Dolenšek, M. S. Rupnik, and A. Stožer, Islets 7, e1024405 (2015).
- Kim et al. (2009) A. Kim, K. Miller, J. Jo, G. Kilimnik, P. Wojcik, and M. Hara, Islets 1, 129 (2009).
- Lamprianou et al. (2011) S. Lamprianou, R. Immonen, C. Nabuurs, A. Gjinovci, L. Vinet, X. C. Montet, R. Gruetter, and P. Meda, Diabetes 60, 2853 (2011).
- Montanya et al. (2000) E. Montanya, V. Nacher, M. Biarnés, and J. Soler, Diabetes 49, 1341 (2000).
- Bouwens and Rooman (2005) L. Bouwens and I. Rooman, Physiological reviews 85, 1255 (2005).
- Bavamian et al. (2007) S. Bavamian, P. Klee, A. Britan, C. Populaire, D. Caille, J. Cancela, A. Charollais, and P. Meda, Diabetes, Obesity and Metabolism 9, 118 (2007).
- Caicedo (2013) A. Caicedo, in Seminars in cell & developmental biology, Vol. 24 (Elsevier, 2013) pp. 11–21.
- Stožer et al. (2013a) A. Stožer, J. Dolenšek, and M. S. Rupnik, PloS one 8, e54638 (2013a).
- Cigliola et al. (2013) V. Cigliola, V. Chellakudam, W. Arabieter, and P. Meda, Diabetes research and clinical practice 99, 250 (2013).
- Stožer et al. (2013b) A. Stožer, M. Gosak, J. Dolenšek, M. Perc, M. Marhl, M. S. Rupnik, and D. Korošak, PLoS computational biology 9, e1002923 (2013b).
- Markovič et al. (2015) R. Markovič, A. Stožer, M. Gosak, J. Dolenšek, M. Marhl, and M. S. Rupnik, Scientific reports 5 (2015).
- Johnston et al. (2016) N. R. Johnston, R. K. Mitchell, E. Haythorne, M. P. Pessoa, F. Semplici, J. Ferrer, L. Piemonti, P. Marchetti, M. Bugliani, D. Bosco, et al., Cell metabolism 24, 389 (2016).
- Schneidman et al. (2006) E. Schneidman, M. J. Berry, R. S. II, and W. Bialek, Nature 440, 1007 (2006).
- Tkačik and Bialek (2016) G. Tkačik and W. Bialek, Annual Review of Condensed Matter Physics 7, 89 (2016).
- Azhar and Bialek (2010) F. Azhar and W. Bialek, arXiv preprint arXiv:1012.5987 (2010).
- Tkacik et al. (2009) G. Tkacik, E. Schneidman, I. Berry, J. Michael, and W. Bialek, arXiv preprint arXiv:0912.5409 (2009).
- Rasmussen (1970) H. Rasmussen, Science 170, 404 (1970).
- Tkačik et al. (2014) G. Tkačik, O. Marre, D. Amodei, E. Schneidman, W. Bialek, and M. J. Berry II, PLoS computational biology 10, e1003408 (2014).
- Parisi (1990) G. Parisi, Proceedings of the National Academy of Sciences 87, 429 (1990).
- Bryngelson and Wolynes (1987) J. D. Bryngelson and P. G. Wolynes, Proceedings of the National Academy of Sciences 84, 7524 (1987).
- Bornholdt (2001) S. Bornholdt, International Journal of Modern Physics C 12, 667 (2001).
- Krawiecki et al. (2002) A. Krawiecki, J. Hołyst, and D. Helbing, Physical review letters 89, 158701 (2002).
- Daniels et al. (2016) B. C. Daniels, C. J. Ellison, D. C. Krakauer, and J. C. Flack, Current opinion in neurobiology 37, 106 (2016).
- Daniels et al. (2017) B. C. Daniels, D. C. Krakauer, and J. C. Flack, Nature Communications 8 (2017).
- Dolenšek et al. (2013) J. Dolenšek, A. Stožer, M. S. Klemen, E. W. Miller, and M. S. Rupnik, PLoS One 8, e82374 (2013).
- Hraha et al. (2014) T. H. Hraha, M. J. Westacott, M. Pozzoli, A. M. Notary, P. M. McClatchey, and R. K. Benninger, PLoS computational biology 10, e1003819 (2014).
- Speier et al. (2007) S. Speier, A. Gjinovci, A. Charollais, P. Meda, and M. Rupnik, Diabetes 56, 1078 (2007).
- Speier and Rupnik (2003) S. Speier and M. Rupnik, Pflügers Archiv 446, 553 (2003).
- Stetter et al. (2012) O. Stetter, D. Battaglia, J. Soriano, and T. Geisel, PLoS computational biology 8, e1002653 (2012).
- Luukko et al. (2016) P. Luukko, J. Helske, and E. Räsänen, Computational Statistics 31, 545 (2016).
- Ferrari et al. (2017) U. Ferrari, T. Obuchi, and T. Mora, Physical Review E 95, 042321 (2017).
- Roudi et al. (2009) Y. Roudi, S. Nirenberg, and P. E. Latham, PLoS computational biology 5, e1000380 (2009).
- Barton and Cocco (2013) J. Barton and S. Cocco, Journal of Statistical Mechanics: Theory and Experiment 2013, P03002 (2013).
- Merchan and Nemenman (2016) L. Merchan and I. Nemenman, Journal of Statistical Physics 162, 1294 (2016).
- Mora and Bialek (2011) T. Mora and W. Bialek, Journal of Statistical Physics 144, 268 (2011).
- Tkačik et al. (2015) G. Tkačik, T. Mora, O. Marre, D. Amodei, S. E. Palmer, M. J. Berry, and W. Bialek, Proceedings of the National Academy of Sciences 112, 11508 (2015).
- Tkačik et al. (2013) G. Tkačik, O. Marre, T. Mora, D. Amodei, M. J. Berry II, and W. Bialek, Journal of Statistical Mechanics: Theory and Experiment 2013, P03011 (2013).
- Nonnenmacher et al. (2016) M. Nonnenmacher, C. Behrens, P. Berens, M. Bethge, and J. H. Macke, arXiv preprint arXiv:1603.00097 (2016).
- Gopikrishnan et al. (1999) P. Gopikrishnan, V. Plerou, L. A. N. Amaral, M. Meyer, and H. E. Stanley, Physical Review E 60, 5305 (1999).
- Bialek and Setayeshgar (2005) W. Bialek and S. Setayeshgar, Proceedings of the National Academy of Sciences of the United States of America 102, 10040 (2005).
- Hiriart and Ramirez-Medeles (1991) M. Hiriart and M. C. Ramirez-Medeles, Endocrinology 128, 3193 (1991).
- Fujita et al. (2011) Y. Fujita, M. Takita, M. Shimoda, T. Itoh, K. Sugimoto, H. Noguchi, B. Naziruddin, M. F. Levy, and S. Matsumoto, Islets 3, 1 (2011).
- Williams et al. (2010) S. J. Williams, H.-H. Huang, K. Kover, W. V. Moore, C. Berkland, M. Singh, I. S. Smirnova, R. MacGregor, and L. Stehno-Bittel, Organogenesis 6, 115 (2010).
- Gosak et al. (2015) M. Gosak, J. Dolenšek, R. Markovič, M. S. Rupnik, M. Marhl, and A. Stožer, Chaos, Solitons & Fractals 80, 76 (2015).
- Schmitz et al. (2008) O. Schmitz, J. Rungby, L. Edge, and C. B. Juhl, Ageing research reviews 7, 301 (2008).
- Gan et al. (2017) W. J. Gan, M. Zavortink, C. Ludick, R. Templin, R. Webb, R. Webb, W. Ma, P. Poronnik, R. G. Parton, H. Y. Gaisano, et al., J Cell Sci 130, 143 (2017).
- Doğaner et al. (2016) B. A. Doğaner, L. K. Yan, and H. Youk, Trends in cell biology 26, 262 (2016).
- Gerdes et al. (2014) J. M. Gerdes, S. Christou-Savina, Y. Xiong, T. Moede, N. Moruzzi, P. Karlsson-Edlund, B. Leibiger, I. B. Leibiger, C.-G. Östenson, P. L. Beales, et al., Nature communications 5, 5308 (2014).
- Faustman (2014) D. L. Faustman, Diabetologia 57, 1 (2014).
- Rahier et al. (2008) J. Rahier, Y. Guiot, R. Goebbels, C. Sempoux, and J.-C. Henquin, Diabetes, Obesity and Metabolism 10, 32 (2008).
- Daraio et al. (2017) T. Daraio, L. K. Bombek, M. Gosak, I. Valladolid-Acebes, M. S. Klemen, E. Refai, P.-O. Berggren, K. Brismar, M. S. Rupnik, and C. Bark, Scientific Reports 7 (2017).