Combining machine learning with data assimilation to improve the quality of phytoplankton forecasting in a shelf sea environment
Abstract
We demonstrate that combining machine learning with data assimilation leads to a major improvement in phytoplankton short-range (1-5 day) forecasts for the North-West European Shelf (NWES) seas. We show that excess nitrate concentrations are a major reason behind known biases in phytoplankton forecasts during late Spring and Summer, which can grow fast with lead time. Assimilating observations of nitrate would potentially help address this, but NWES nitrate data are typically not available in sufficient abundance to be effectively assimilated. We have therefore used a recently developed and validated neural network (NN) model predicting surface nitrate concentrations from a range of observable variables and implemented its assimilation within a research and development version of the Met Office’s NWES operational forecasting system. As a result of nitrate assimilation the phytoplankton forecast skill improves by up to 30%. We show that although much of this improvement can be achieved by using a weekly nitrate climatology predicted by the NN model, there is a clear advantage in using flow-dependent nitrate data. We discuss the impacts of this improvement on a range of additional eutrophication indicators, such as dissolved inorganic phosphorus and sea bottom oxygen. We argue that it should be feasible to implement this hybrid machine learning - data assimilation approach within the near-real time NWES operational forecasting system.
QJRMS
Plymouth Marine Laboratory, Plymouth, UK National Centre for Earth Observation, Plymouth, UK Met Office, Exeter, UK
Jozef Skákalajos@pml.ac.uk
1 Introduction
Operational monitoring and forecasting of marine biogeochemistry can provide an essential source of information for water quality, fisheries and aquaculture management, as well as climate mitigation and adaptation planning and policy (e.g., Fennel \BOthers. (\APACyear2019)). One of the regional seas monitored and predicted by operational systems is the North West European Shelf (NWES). NWES plays a significant role in global biogeochemical cycles, i.e. it acts as a sink for atmospheric CO2 through biological productivity and eventually exports organic matter to the open ocean, influencing the global carbon budget (Legge \BOthers., \APACyear2020). Additionally, efficient nutrient cycling through riverine discharge, atmospheric deposition and shallow bathymetry supports the maintenance of a diverse marine ecosystem, making NWES vital for the European economy (Pauly \BOthers., \APACyear2002).
NWES ecosystem is characterized by strongly seasonal dynamics: i.e. during spring, the sunlight, onset of stratification, and abundance of nutrients, accumulated over the last winter near the ocean surface through mixing by storms, set up ideal conditions for phytoplankton to bloom. This spring bloom contributes a major portion of annual primary production (e.g., Silva \BOthers. (\APACyear2021); González-Gil \BOthers. (\APACyear2022)). During the bloom, phytoplankton, especially diatoms, start rapidly assimilating nutrients, causing a sharp decrease in nutrient concentrations in the upper oceanic layer. Through this process the surface water becomes eventually depleted in nutrients (especially nitrate and phosphate), which limits any further production. This continues until Autumn, since strong stratification of the water column separates the surface from the nutrient-rich water below the pycnocline, with phytoplankton growth often limited to deep chlorophyll maxima occurring around/under the pycnocline (e.g., Weston \BOthers. (\APACyear2005); Skákala \BOthers. (\APACyear2021); Loveday \BOthers. (\APACyear2021)). However, sometimes in late summer or early autumn, due to wind driven mixing (often due to storms), the stratification breaks down and nutrients upwell from deeper water to the surface causing a secondary bloom (Capuzzo \BOthers., \APACyear2018). Then, during winter, strong persistent winds cause stratification to break down completely, cooling the ocean surface and increasing the water density, which triggers convective mixing (Sharples \BOthers., \APACyear2006). As a result of strong winter mixing, the remineralised nutrients accumulated during late summer and autumn get upwelled near to the surface setting up conditions for the next spring bloom (Lohse \BOthers., \APACyear1995).
The Met Office runs an operational physics-biogeochemistry forecasting system for the NWES, each day producing forecasts with up to 6-day lead-time for a range of key variables, such as phytoplankton biomass, nutrients, oxygen and underwater visibility (see https://www.metoffice.gov.uk/services/data/met-office-marine-data-service and also Skákala \BOthers. (\APACyear2025)). These forecasts are potentially relevant for identifying the risk of eutrophication, a recurring problem in parts of NWES (e.g., Axe \BOthers. (\APACyear2017); Devlin \BOthers. (\APACyear2023)), with impact on aquaculture operations and coastal management. Furthermore, the underwater visibility forecasts inform underwater operations (e.g., Skákala \BOthers. (\APACyear2025)), with other applications for the biogeochemistry forecasts including navigating autonomous observing platforms (Ford \BOthers., \APACyear2022), and potentially providing useful information to models predicting toxic algal blooms. However, a key operationally forecasted variable, phytoplankton biomass, has known biases that grow with forecast lead time (Skákala \BOthers., \APACyear2018). These biases can then impact the forecast quality of other biogeochemical variables, due to the central role of phytoplankton in the marine ecosystem.
The phytoplankton forecast biases can be understood based on the interaction between the model dynamics and the data assimilation design. The NWES biogeochemistry model, the European Regional Seas Ecosystem Model (ERSEM, Baretta \BOthers. (\APACyear1995); Butenschön \BOthers. (\APACyear2016)) has major seasonal phytoplankton chlorophyll- biases relative to both satellite and in situ data. It tends to substantially overestimate phytoplankton concentrations during the bloom period, with the bloom onset often modelled too late (e.g., Kay \BOthers. (\APACyear2021); Skákala \BOthers. (\APACyear2018, \APACyear2020, \APACyear2022)). These biases in chlorophyll- concentrations are corrected by assimilating satellite ocean color-derived surface chlorophyll into the model, substantially lowering phytoplankton concentrations during the bloom.
However, due to a lack of other available observations, ocean colour-derived chlorophyll is the only biogeochemical variable currently assimilated operationally. The data assimilation (DA) scheme used only directly updates the phytoplankton size-class chlorophyll and biomass variables (Skákala \BOthers., \APACyear2018), meaning that other biogeochemical variables are not directly constrained by observations. Due to the routine reduction of phytoplankton biomass by DA during the Spring bloom, productivity and therefore nutrient uptake is lower in the analysis, meaning surface nutrients do not get depleted during Summer (Kay \BOthers., \APACyear2021; Banerjee \BBA Skákala, \APACyear2025). During the forecast, when the model is no longer constrained by DA, in the Spring-Summer season this leads to phytoplankton experiencing good light conditions combined with the availability of nutrients, which triggers its rapid growth. This results in positive biases in phytoplankton concentration developing during the forecast period, degrading the forecast skill with lead time.
In recent decades, machine learning (ML) has emerged as a transformative tool to address several challenges across a wide range of fields, from healthcare and finance to environmental sciences. ML algorithms are a branch of artificial intelligence that learn patterns and trends from datasets and resolve non-linear and complex relationships that are not immediately apparent. ML has already become a vital part of marine science (e.g. Sonnewald \BOthers. (\APACyear2021)), including having impacts on operational oceanography (e.g., Kochkov \BOthers. (\APACyear2021); Heimbach \BOthers. (\APACyear2024)) and marine biogeochemistry modelling (e.g., Mattern \BOthers. (\APACyear2013); Schartau \BOthers. (\APACyear2017); Skákala \BOthers. (\APACyear2023); Wu \BOthers. (\APACyear2025)). A neural network model has been recently developed by Banerjee \BBA Skákala (\APACyear2025) to predict gap-free surface nitrate concentrations on the NWES from a set of routinely observed variables. This model, trained on in situ nitrate observations from the International Council for the Exploration of the Sea (ICES) database (https://www.ices.dk), was demonstrated to be highly skilled in reproducing independent in situ data, albeit with slightly coarsened spatial and temporal effective resolution (Banerjee \BBA Skákala, \APACyear2025). The work of Banerjee \BBA Skákala (\APACyear2025) presents us with a new opportunity to tackle the phytoplankton forecasting problem, i.e. if nitrate concentrations predicted from the observable variables were assimilated into the model together with the (already assimilated) satellite chlorophyll, they could effectively correct nitrate alongside phytoplankton biomass. Since nitrate is a key limiting nutrient on the NWES (e.g. Axe \BOthers. (\APACyear2017); Devlin \BOthers. (\APACyear2023)), we anticipate (and consequently demonstrate) that correcting the nitrate biases through ML-informed data assimilation will have a major positive impact on the phytoplankton forecast skill. The approach undertaken here could be presented as a form of ML-bias correction of a biogeochemistry model, and broadly understood within the area of combined ML-DA approaches, a subject that has become very popular in recent years (e.g. see the review by Cheng \BOthers. (\APACyear2023)). It should be said that in situ nitrate concentrations (both real and synthetic observations) have been already assimilated in the past into marine biogeochemistry models (Anderson \BOthers., \APACyear2000; Ourmières \BOthers., \APACyear2009; Ford, \APACyear2021), furthermore work deriving nitrate concentrations using ML is not entirely new (Sauzède \BOthers., \APACyear2017; Chen \BOthers., \APACyear2023). However, unlike the previous studies, here we assimilate flow-dependent gridded gap-free surface nitrate data, allowing for rapid, domain-wide improvements to the model forecasting capability in the mixed layer.
In this study, we conducted three experiments: (i) a reference run with a set-up reasonably close to the one used operationally, i.e. including assimilation of physics observations and ocean color-derived chlorophyll (it will be further labeled as “no-nit DA”), (ii) an experiment additionally assimilating flow-dependent ML-generated nitrate data (labeled “ML-nit DA”), (iii) an equivalent experiment to experiment (ii), but assimilating a climatology of those ML-generated nitrate data instead of the flow-dependent nitrate (labeled “clim-nit DA”). The last experiment enables us to assess how much of the phytoplankton forecast improvement can be achieved by a form of relaxation towards the nitrate climatology values, and how important it is to have an “online” ML nitrate prediction. All three experiments were performed for the biologically productive period (March-September) of 2018. In this study, the nitrate data were generated ”offline”, meaning the ML-generated nitrate data were separately predicted from a previously-run reanalysis rather than as part of the assimilation step. However, it should be noted that the reanalysis used was produced using a broadly similar model and assimilation set-up to that used in this study, ensuring a reasonable level of consistency. It should be also noted that the longer-term objective is to develop an ”online” setup: In this future framework, at each model integration step, the system will trigger ML to predict the nitrate field on the fly using relevant predictors derived from observations and model state variables, subsequently updating the ecosystem model’s nitrate field. We argue that our experiments demonstrate the potential feasibility of running the system in its online mode.
2 Methodology
2.1 UK Met Office operational biogeochemical forecasting system
The Met Office runs an operational forecasting system for NWES biogeochemistry (Edwards \BOthers., \APACyear2012; Kay \BOthers., \APACyear2021), with products made freely available for a range of users (https://www.metoffice.gov.uk/services/data/met-office-marine-data-service). This uses the hydrodynamic model Nucleus for European Modelling of the Ocean (NEMO, Madec \BOthers. (\APACyear2015)) coupled with ERSEM (Baretta \BOthers., \APACyear1995; Butenschön \BOthers., \APACyear2016; Marine Systems Modelling Group, \APACyear2020), through the Framework for Aquatic Biogeochemical Models (FABM, Bruggeman \BBA Bolding (\APACyear2014, \APACyear2020)). The system assimilates data into the model using the variational DA software NEMOVAR (Mogensen \BOthers., \APACyear2009, \APACyear2012).
2.1.1 The physical model
The physical model NEMO is a finite difference, hydrostatic, primitive equation ocean general circulation model (Madec \BOthers., \APACyear2015). The NEMO configuration used in this study is very similar to e.g. Skákala \BOthers. (\APACyear2021, \APACyear2022, \APACyear2024) and has been described therein: it uses the CO6 NEMO version, based on NEMOv3.6, a development of the CO5 configuration explained in detail by O’Dea \BOthers. (\APACyear2017). The model has approximately 7 km spatial resolution on the Atlantic Margin Model (AMM7) domain using a terrain-following coordinate system with 51 vertical levels (Siddorn \BBA Furner, \APACyear2013). In these experiments the lateral boundary conditions for physical variables at the Atlantic boundary were taken from the North Atlantic deep ocean model (Storkey \BOthers., \APACyear2010) and the Baltic boundary conditions from the Copernicus operational Baltic Sea model (Berg \BBA Poulsen, \APACyear2012). We have used river discharge based on data from Lenhart \BOthers. (\APACyear2010). The atmospheric forcing came from the Met Office Unified Model global numerical weather prediction system (Tonani \BOthers., \APACyear2019).
2.1.2 The biogeochemistry model
ERSEM is a lower trophic level ecosystem model based on pelagic plankton, and benthic fauna (Blackford, \APACyear1997). The model divides autotrophs into four phytoplankton functional types (PFTs) largely based on their size (Baretta \BOthers., \APACyear1995): picophytoplankton, nanophytoplankton, diatoms and dinoflagellates. ERSEM uses variable stoichiometry for the simulated plankton groups (Geider \BOthers., \APACyear1997; Baretta-Bekker \BOthers., \APACyear1997) and each PFT biomass is represented in terms of chlorophyll, carbon, nitrogen and phosphorus, with diatoms also represented by silicon. ERSEM predators are represented by three zooplankton types (mesozooplankton, microzooplankton and heterotrophic nanoflagellates), with organic material being decomposed by one functional type of heterotrophic bacteria (Butenschön \BOthers., \APACyear2016). The ERSEM inorganic component consists of nutrients (nitrate, phosphate, silicate, ammonium and carbon) and dissolved oxygen. The carbonate system is also included in the model (Artioli \BOthers., \APACyear2012).
2.1.3 The data assimilation system
NEMOVAR is used here in a 3DVar configuration (Mogensen \BOthers., \APACyear2009, \APACyear2012; Waters \BOthers., \APACyear2015) and its specific implementation in the NWES system has been described in a range of recent papers, e.g. see King \BOthers. (\APACyear2018); Tonani \BOthers. (\APACyear2019) for the physics, and Skákala \BOthers. (\APACyear2018); Kay \BOthers. (\APACyear2019); Skákala \BOthers. (\APACyear2020, \APACyear2021); Fowler \BOthers. (\APACyear2023); Ford \BOthers. (\APACyear2022); Skákala \BOthers. (\APACyear2022, \APACyear2024) for the biogeochemistry. NEMOVAR uses First Guess at Appropriate Time (FGAT), which is applied to calculate the innovations between the observed values and model background at the nearest model timestep to the observation times, during a 24 hour forecast. Then NEMOVAR is used to produce a set of increments to update the model state variables. The increments are added into the model gradually over the same 24 hours to avoid generating sudden shocks, using incremental analysis updates (IAU, Bloom \BOthers. (\APACyear1996); Waters \BOthers. (\APACyear2015); King \BOthers. (\APACyear2018)). In the physical DA application, NEMOVAR applies balancing relationships within the assimilation step and delivers a set of increments for temperature, salinity, sea surface height (SSH) and the horizontal velocity components. In its biogeochemical application it calculates a set of increments separately for each assimilated variable and in specific cases balancing relationships are subsequently used to distribute those increments into a selected range of other ecosystem model variables.
In the operational NWES context NEMOVAR assimilates with a daily cycle sea surface temperature (SST), satellite sea level anomaly, temperature and salinity profiles, and satellite ocean-color derived total (log-)chlorophyll-. However, other options for assimilating biogeochemistry variables are available, e.g. PFT (log-)chlorophyll- assimilation has been developed in (Skákala \BOthers., \APACyear2018) and has been applied in multi-decadal reanalysis (Kay \BOthers., \APACyear2021), used for the ML nitrate prediction. Furthermore, PFT absorption DA has been established in (Skákala \BOthers., \APACyear2020) and (log-)chlorophyll- and oxygen concentrations from gliders were assimilated in (Skákala \BOthers., \APACyear2021; Ford \BOthers., \APACyear2022). In unpublished experiments (see https://meetingorganizer.copernicus.org/EGU25/EGU25-14292.html), assimilation of nitrate (measured and ML-derived), chlorophyll- and oxygen from BGC-Argo and ships has been also established.
In this study, in line with the multi-decadal reanalysis of Kay \BOthers. (\APACyear2019) used within the ML model, we have assimilated SST from the European Space Agency (ESA) Climate Change Initiative (CCI) v1.1 product, in situ SST from International Comprehensive Ocean-Atmosphere Data Set (ICOADS), temperature and salinity profiles from EN4 data (Good \BOthers., \APACyear2013), and PFT (log-)chlorophyll from ESA CCI v3.1 data (Sathyendranath \BOthers., \APACyear2019). In the (log-)chlorophyll- assimilation NEMOVAR is used to calculate increments to surface chlorophyll-. When PFT chlorophyll- is assimilated increments are directly calculated for each PFT; when total chlorophyll-a is assimilated the increments to total chlorophyll- produced by NEMOVAR are converted to increments to PFT chlorophyll- based on the forecast (background) PFT-to-total chlorophyll ratio at each grid point. The increments are further propagated to other PFT biomass components (carbon, nitrogen, phosphorus, silicon) based on forecast PFT stoichiometry.
NEMOVAR uses for both physics and biogeochemistry externally supplied, spatio-temporally varying observation error variances (the observation error correlations are unaccounted for), and horizontal background error covariances, as described by King \BOthers. (\APACyear2018). The chlorophyll- background error variances are based on the work of Skákala \BOthers. (\APACyear2018) using ensemble simulations from Ciavatta \BOthers. (\APACyear2016). For physics variables vertical correlations are as described by King \BOthers. (\APACyear2018), based on flow-dependent vertical length scales, which are a linear function of depth until the base of the mixed layer and then scale with the spacing of the vertical layers in the model grid (for details see Eq.1 in Skákala \BOthers. (\APACyear2021)). For biogeochemistry, in this study NEMOVAR was just used to calculate surface increments, which were then applied equally throughout the model mixed layer.
2.2 Nitrate data assimilation based on a neural-network prediction
A feed-forward neural network model (NN) was trained by Banerjee \BBA Skákala (\APACyear2025) using the Copernicus Marine Service NWES reanalysis product NWSHELF_MULTIYEAR_BIO_004_011 (Kay \BOthers., \APACyear2021) combined with ERA5 atmospheric data, riverine discharge data originating from Lenhart \BOthers. (\APACyear2010) and International Council for the Exploration of the Sea (ICES) data for nitrate. The NWES surface nitrate concentrations were predicted from a range of structural (e.g. coordinates, bathymetry), atmospheric (e.g. short-wave radiation, wind stress), riverine discharge inputs and variables from the ocean reanalysis with a very close proximity to satellite observations (i.e. SST, surface salinity, surface PFT chlorophyll, total surface net primary production and total surface phytoplankton carbon). The NN model has been successfully used to produce a bi-decadal (1998-2020) gap-free, gridded daily and 7 km resolution data-set for surface nitrate across the NWES reanalysis domain. The NN model and the data-set showed good skill against independent observations (Banerjee \BBA Skákala, \APACyear2025), however due to the relative simplicity of the NN model, the effective spatial and temporal resolution of the data-set has been shown to be coarser than the data grid (about 30km spatial and 10 day temporal resolution).
In this work we have assimilated the surface nitrate values from the NN-generated bi-decadal data-set of Banerjee \BBA Skákala (\APACyear2025) into the NEMO-FABM-ERSEM model. For methodological simplicity, we have assimilated nitrate with a daily cycle, to match the other assimilated variables. To handle the coarser effective spatial resolution, as well as the potential impact of observational error spatial correlations, we have thinned the assimilated nitrate data to a 35 km spatial resolution scale. Since no observational error information was available, in this initial proof-of-concept work we used a constant background:observation error ratio of 3:1, based on the average ratio found for chlorophyll in (Skákala \BOthers., \APACyear2018). The nitrate assimilation updated only the modelled nitrate values, i.e. it was applied independently of the chlorophyll assimilation and associated balancing scheme.
2.3 The experiments
The three experiments (no-nit DA, ML-nit DA and clim-nit DA) assimilated the same data as the multi-decadal reanalysis (Kay \BOthers., \APACyear2021), rather than the data currently assimilated in the operational forecasts (Tonani \BOthers., \APACyear2019). This includes PFT (log-)chlorophyll- being assimilated rather than the total chlorophyll-. The reason for this choice is to increase consistency with the assimilated nitrate data-set, which was predicted from the multi-decadal reanalysis, using PFTs as the inputs. This choice should not introduce major issues in evaluating improvement to total chlorophyll- forecasts, since the impact of PFT (log-)chlorophyll- DA on total chlorophyll- has been shown to be nearly identical to the impact of total chlorophyll- assimilation, with the extra benefit of correcting the phytoplankton community structure (Skákala \BOthers., \APACyear2018).
The three experiments in this study (no-nit DA, ML-nit DA, clim-nit DA) were performed for the biologically active period between March and September 2018, being initialized on the 01/03/2018 from the Copernicus reanalysis. The assimilation cycle in the experiments was daily, and at each day the model produced a separate 5-day forecast. As mentioned in the introduction, the ML-nit DA experiment assimilates the same data as no-nit DA plus the NN-derived surface nitrate from Banerjee \BBA Skákala (\APACyear2025). The clim-nit DA experiment replaces assimilation of the flow-dependent nitrate with assimilation of weekly varying surface nitrate climatology derived from the same 1998-2020 data of Banerjee \BBA Skákala (\APACyear2025).
It should be noted that the system set-up run in the experiments combined elements of both the Met Office operational forecasting system and the Copernicus reanalysis of Kay \BOthers. (\APACyear2021). Due to the offline nature of this work and some existing differences in the Met Office reanalysis and forecasting systems, it is challenging to demonstrate the impact of nitrate assimilation in the Met Office operational forecasting suite, whilst ensuring complete consistency with the Copernicus reanalysis used to predict the assimilated nitrate. We have used a set-up similar to the one used for operational forecasts, with certain tweaks to bring it closer to the Copernicus reanalysis set-up, such as introducing PFT chlorophyll- assimilation and assimilating the same version of satellite data as in the reanalysis. The hope is that this modelling choice would ensure that the experiments are ideally within reasonable proximity of both the nitrate-predicting reanalysis and the operational application used for forecasting. The drawback of this approach is that the analysis state in ML-nit DA deviates to a degree from the Copernicus reanalysis. As already mentioned, one of the goals of this study is to demonstrate the potential skill of a future “online” system, where nitrate is NN-predicted using inputs from the analysis state of the same run where it is being assimilated. If there is a major discrepancy between the analysis state in ML-nit DA and the reanalysis used by the NN-model, we risk that our “offline” system will significantly underestimate the skill of the future “online” system, as it lacks the full consistency of the online implementation. However, if such imperfect offline system substantially improves phytoplankton forecast skill through nitrate assimilation, it indicates that the impact of nitrate assimilation on phytoplankton forecasts is indeed robust. We have calculated the differences between the ML-nit DA analysis and the Copernicus reanalysis and estimated the size of the impact of those differences on our results. This is discussed in the Results section.
2.4 Skill metrics
We have used a range of skill metrics to assess the assimilation as well as model forecast performance. Two of the metrics, “the bias” and “the bias-corrected Root-Mean Square Error” (RMSE) were defined:
| (1) |
and
| (2) |
In the above the denote averaging. Another metric used is RMSE skill improvement , which is simply defined as
| (3) |
in the above means RMSE skill of a new product as measured relative to RMSE skill of a reference product (). We define also RMSE relative improvement, , as
| (4) |
The values vary between -1 and infinity, with negative values meaning RMSE improvement relative to the reference and positive values meaning RMSE degradation relative to the reference.
2.5 Validation at the L4 station
L4 station is operated by the Western Channel Observatory (WCO, https://www.westernchannelobservatory.org.uk/) in the western English Channel (50.25∘N, 4.217∘W) within the broader coastal zone 13km from the Plymouth Sound (see its location marked in Fig.1). The location is relatively shallow (50m), within a region that is seasonally stratified and highly biologically productive (Pingree \BBA Griffiths, \APACyear1978). The L4 station provides one of the longest time-series for a range of biogeochemistry variables worldwide, starting in 1988 (Harris, \APACyear2010). This typically includes measurements for total chlorophyll- derived from fluorescence, data for nutrients (nitrate, phosphate, silicate, ammonium) and oxygen. The L4 observations are most abundant at/near the sea surface, but provided also for a range of depths across the water column.
3 Results and discussion
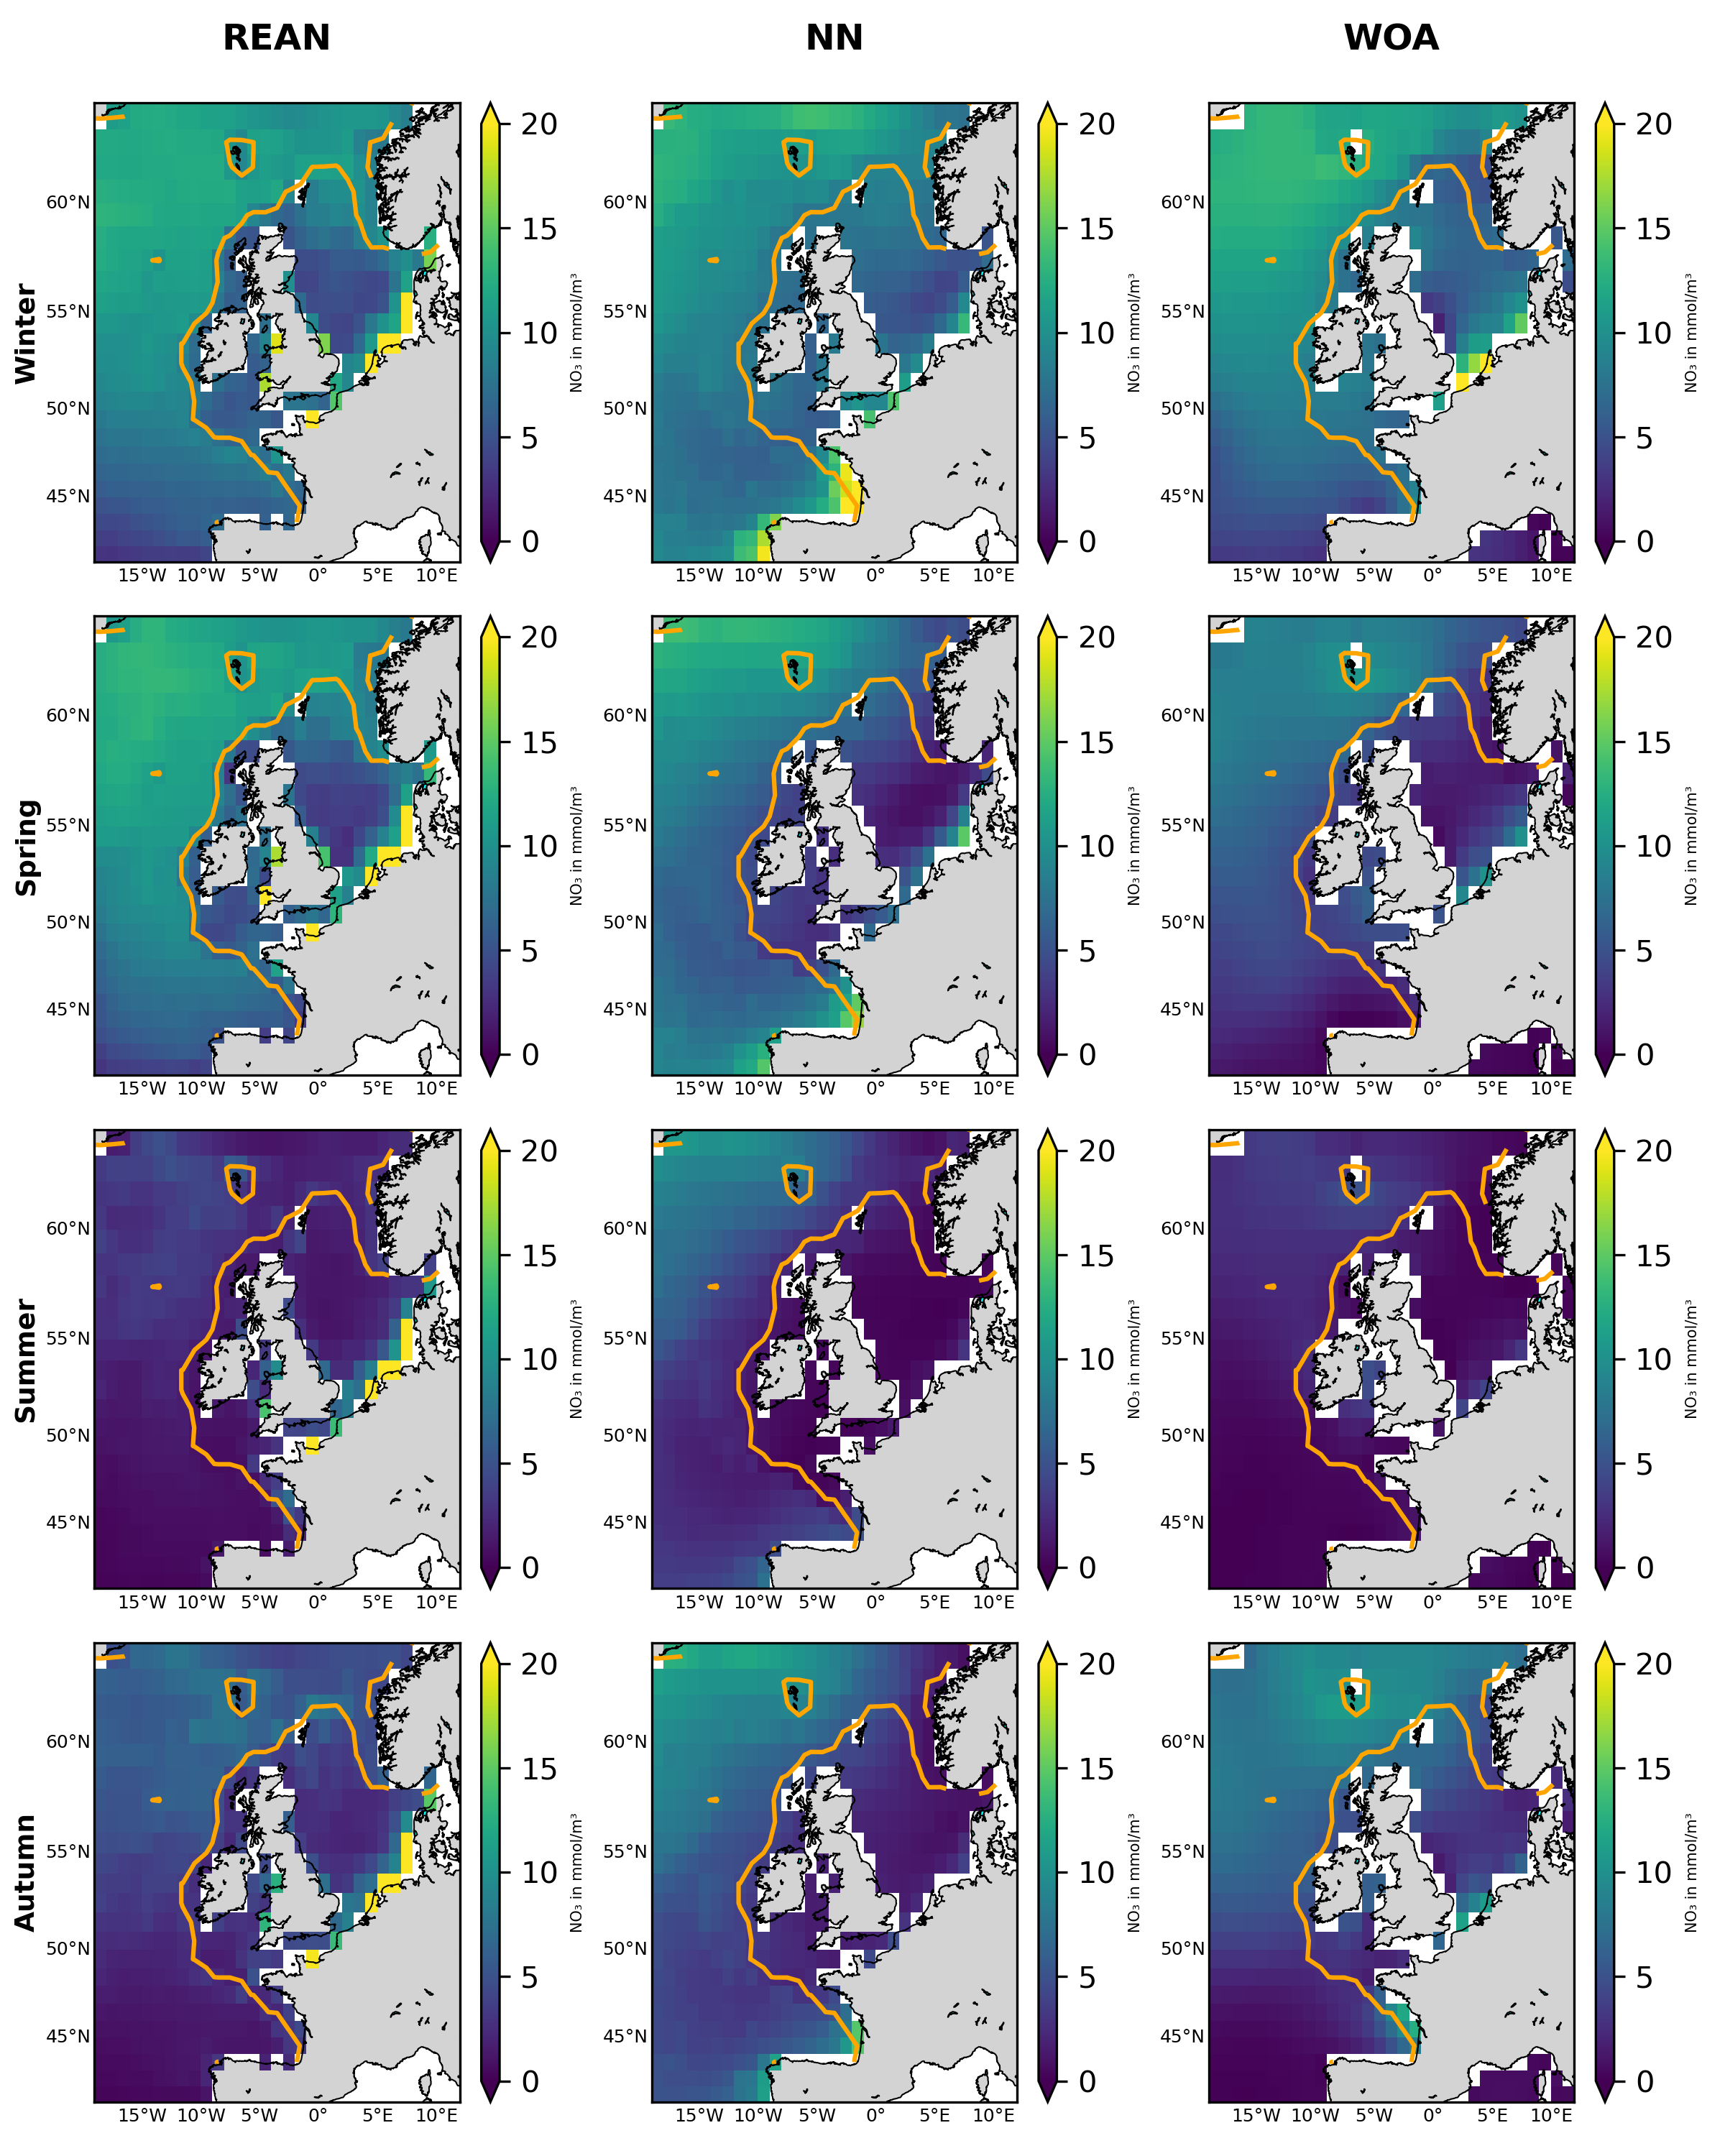
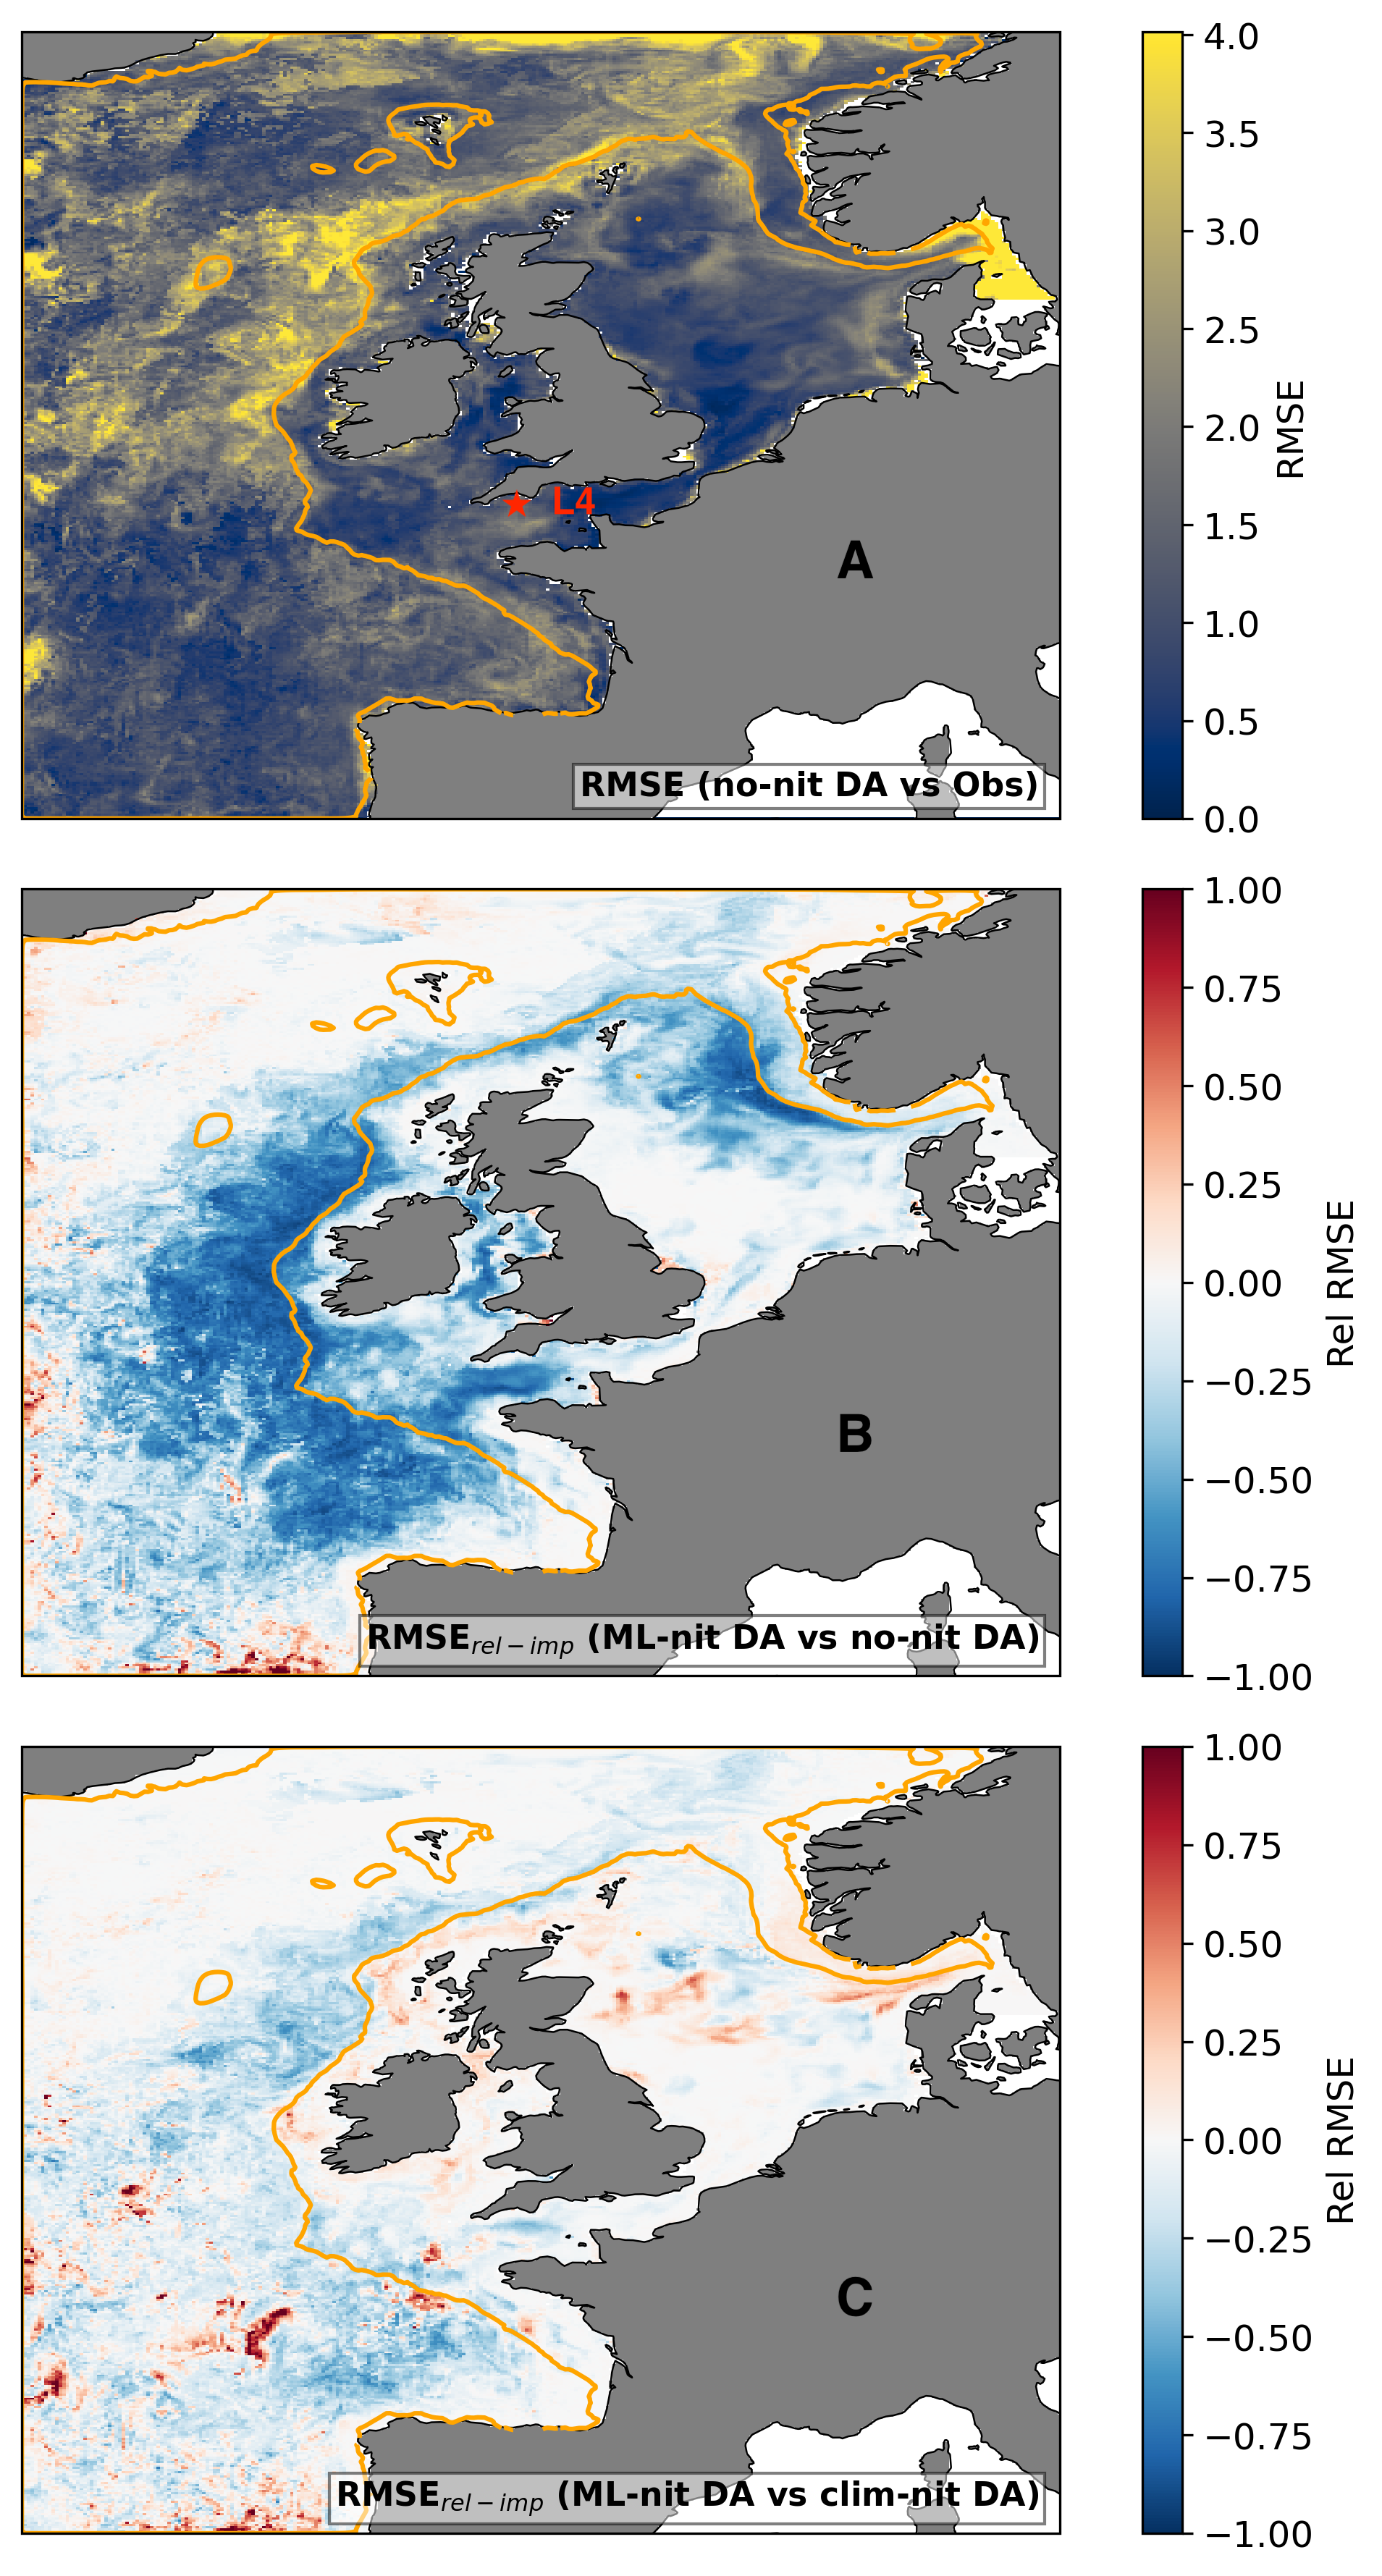
Fig.2 compares Copernicus nitrate reanalysis with World Ocean Atlas (WOA, Garcia \BOthers. (\APACyear2019)) and clearly demonstrates that substantial excess surface nitrate is left in the Spring-Summer period across the NWES in the reanalysis (see also values at specific observing stations throughout NWES in Banerjee \BBA Skákala (\APACyear2025), or Fig.11 in Kay \BOthers. (\APACyear2021)). Unlike the reanalysis, the NN-predicted surface nitrate shows near-zero values across most of the NWES in the Summer, which is consistent with the WOA climatology. Fig.1-3 show how these excess nitrate concentrations map into biases in phytoplankton chlorophyll- forecasts. Fig.3 demonstrates the growth of the phytoplankton bias with the forecast lead-time in the no-nit DA run, showing the largest skill degradation in the bloom-to-post bloom period in May-June. This corresponds to nitrate overestimate in the no-nit DA run relative to the NN-predicted nitrate (Fig.4:C). Fig.1:A shows the spatial distribution of the 5-th forecasting day RMSE in phytoplankton chlorophyll-. It is clear by comparing Fig.1:A and Fig.4:B, that the regions of lowest forecast skill (Fig.1:A) correspond to the areas where the no-nit DA nitrate had the largest errors (Fig.4:B), which demonstrates that the misrepresentation of nitrate is a key driver behind biases in forecast chlorophyll.
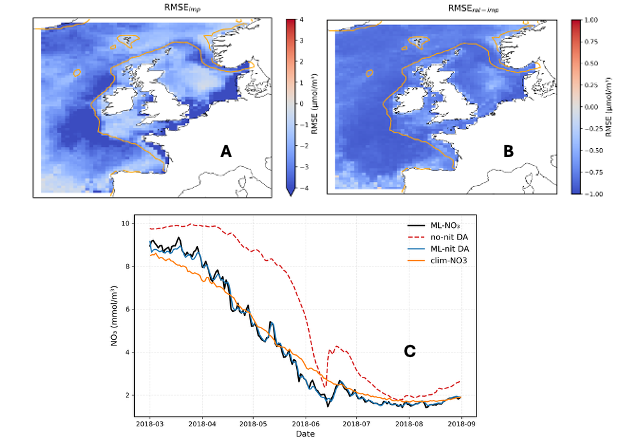
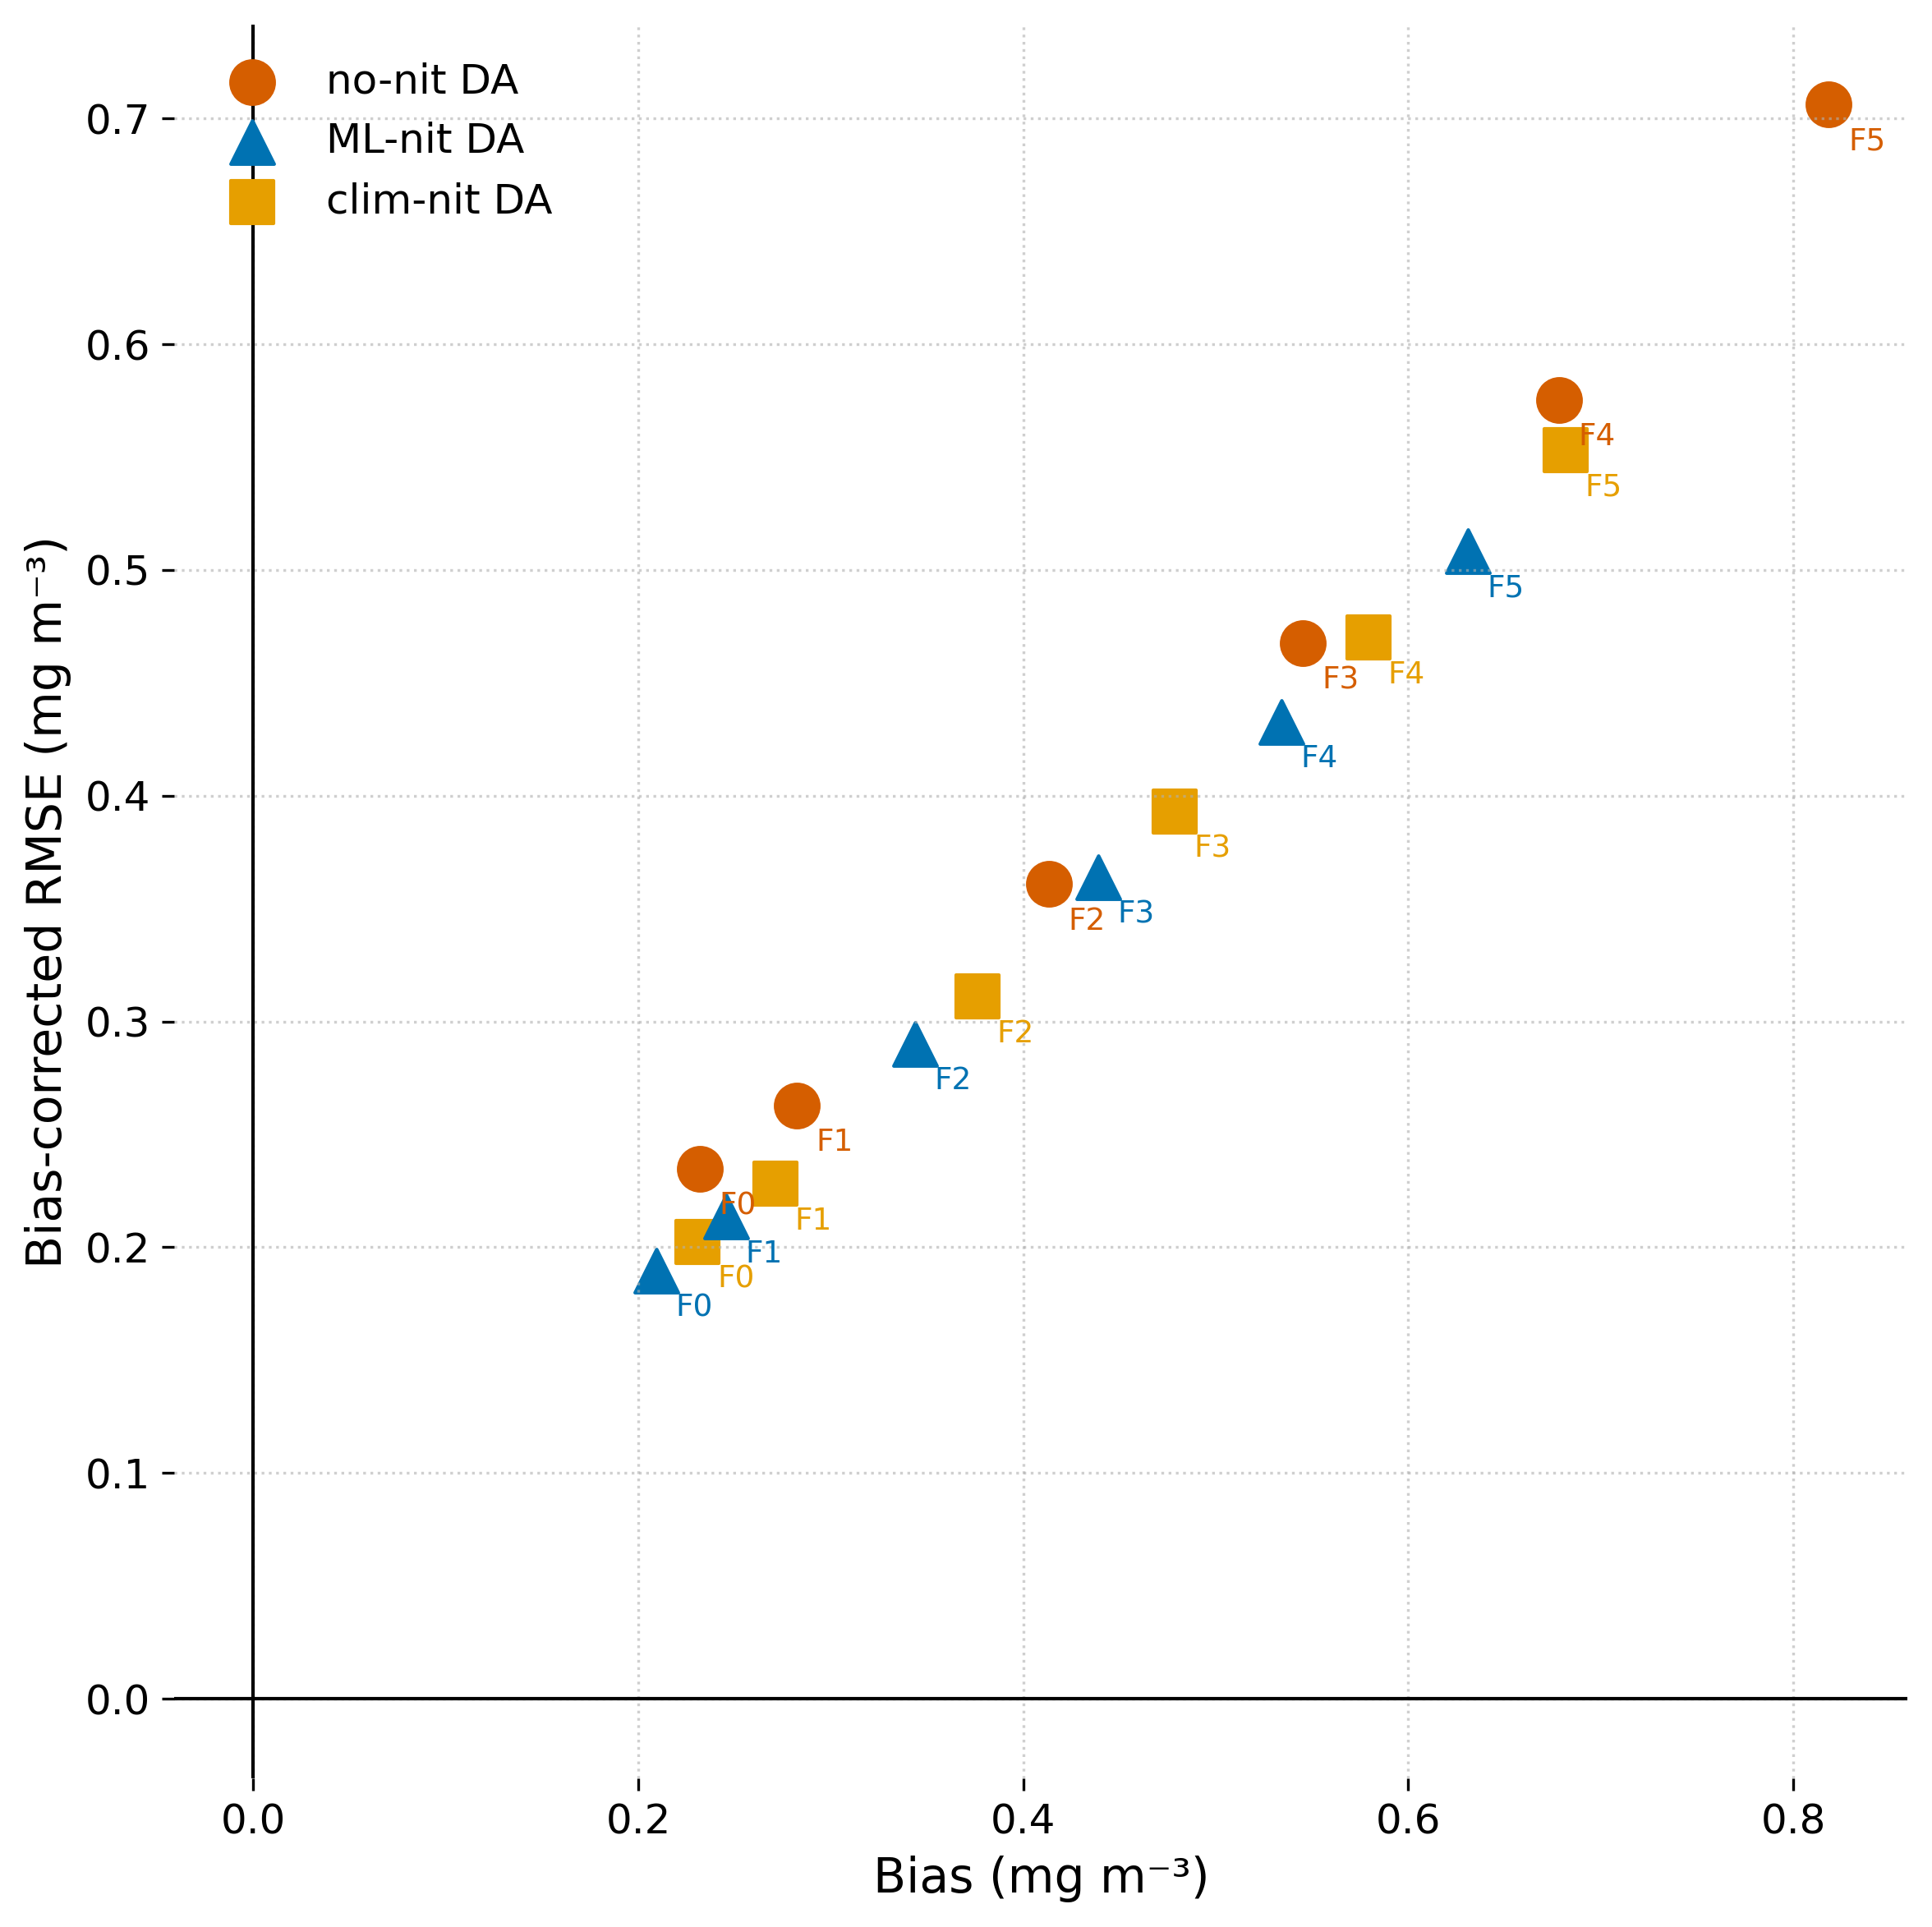
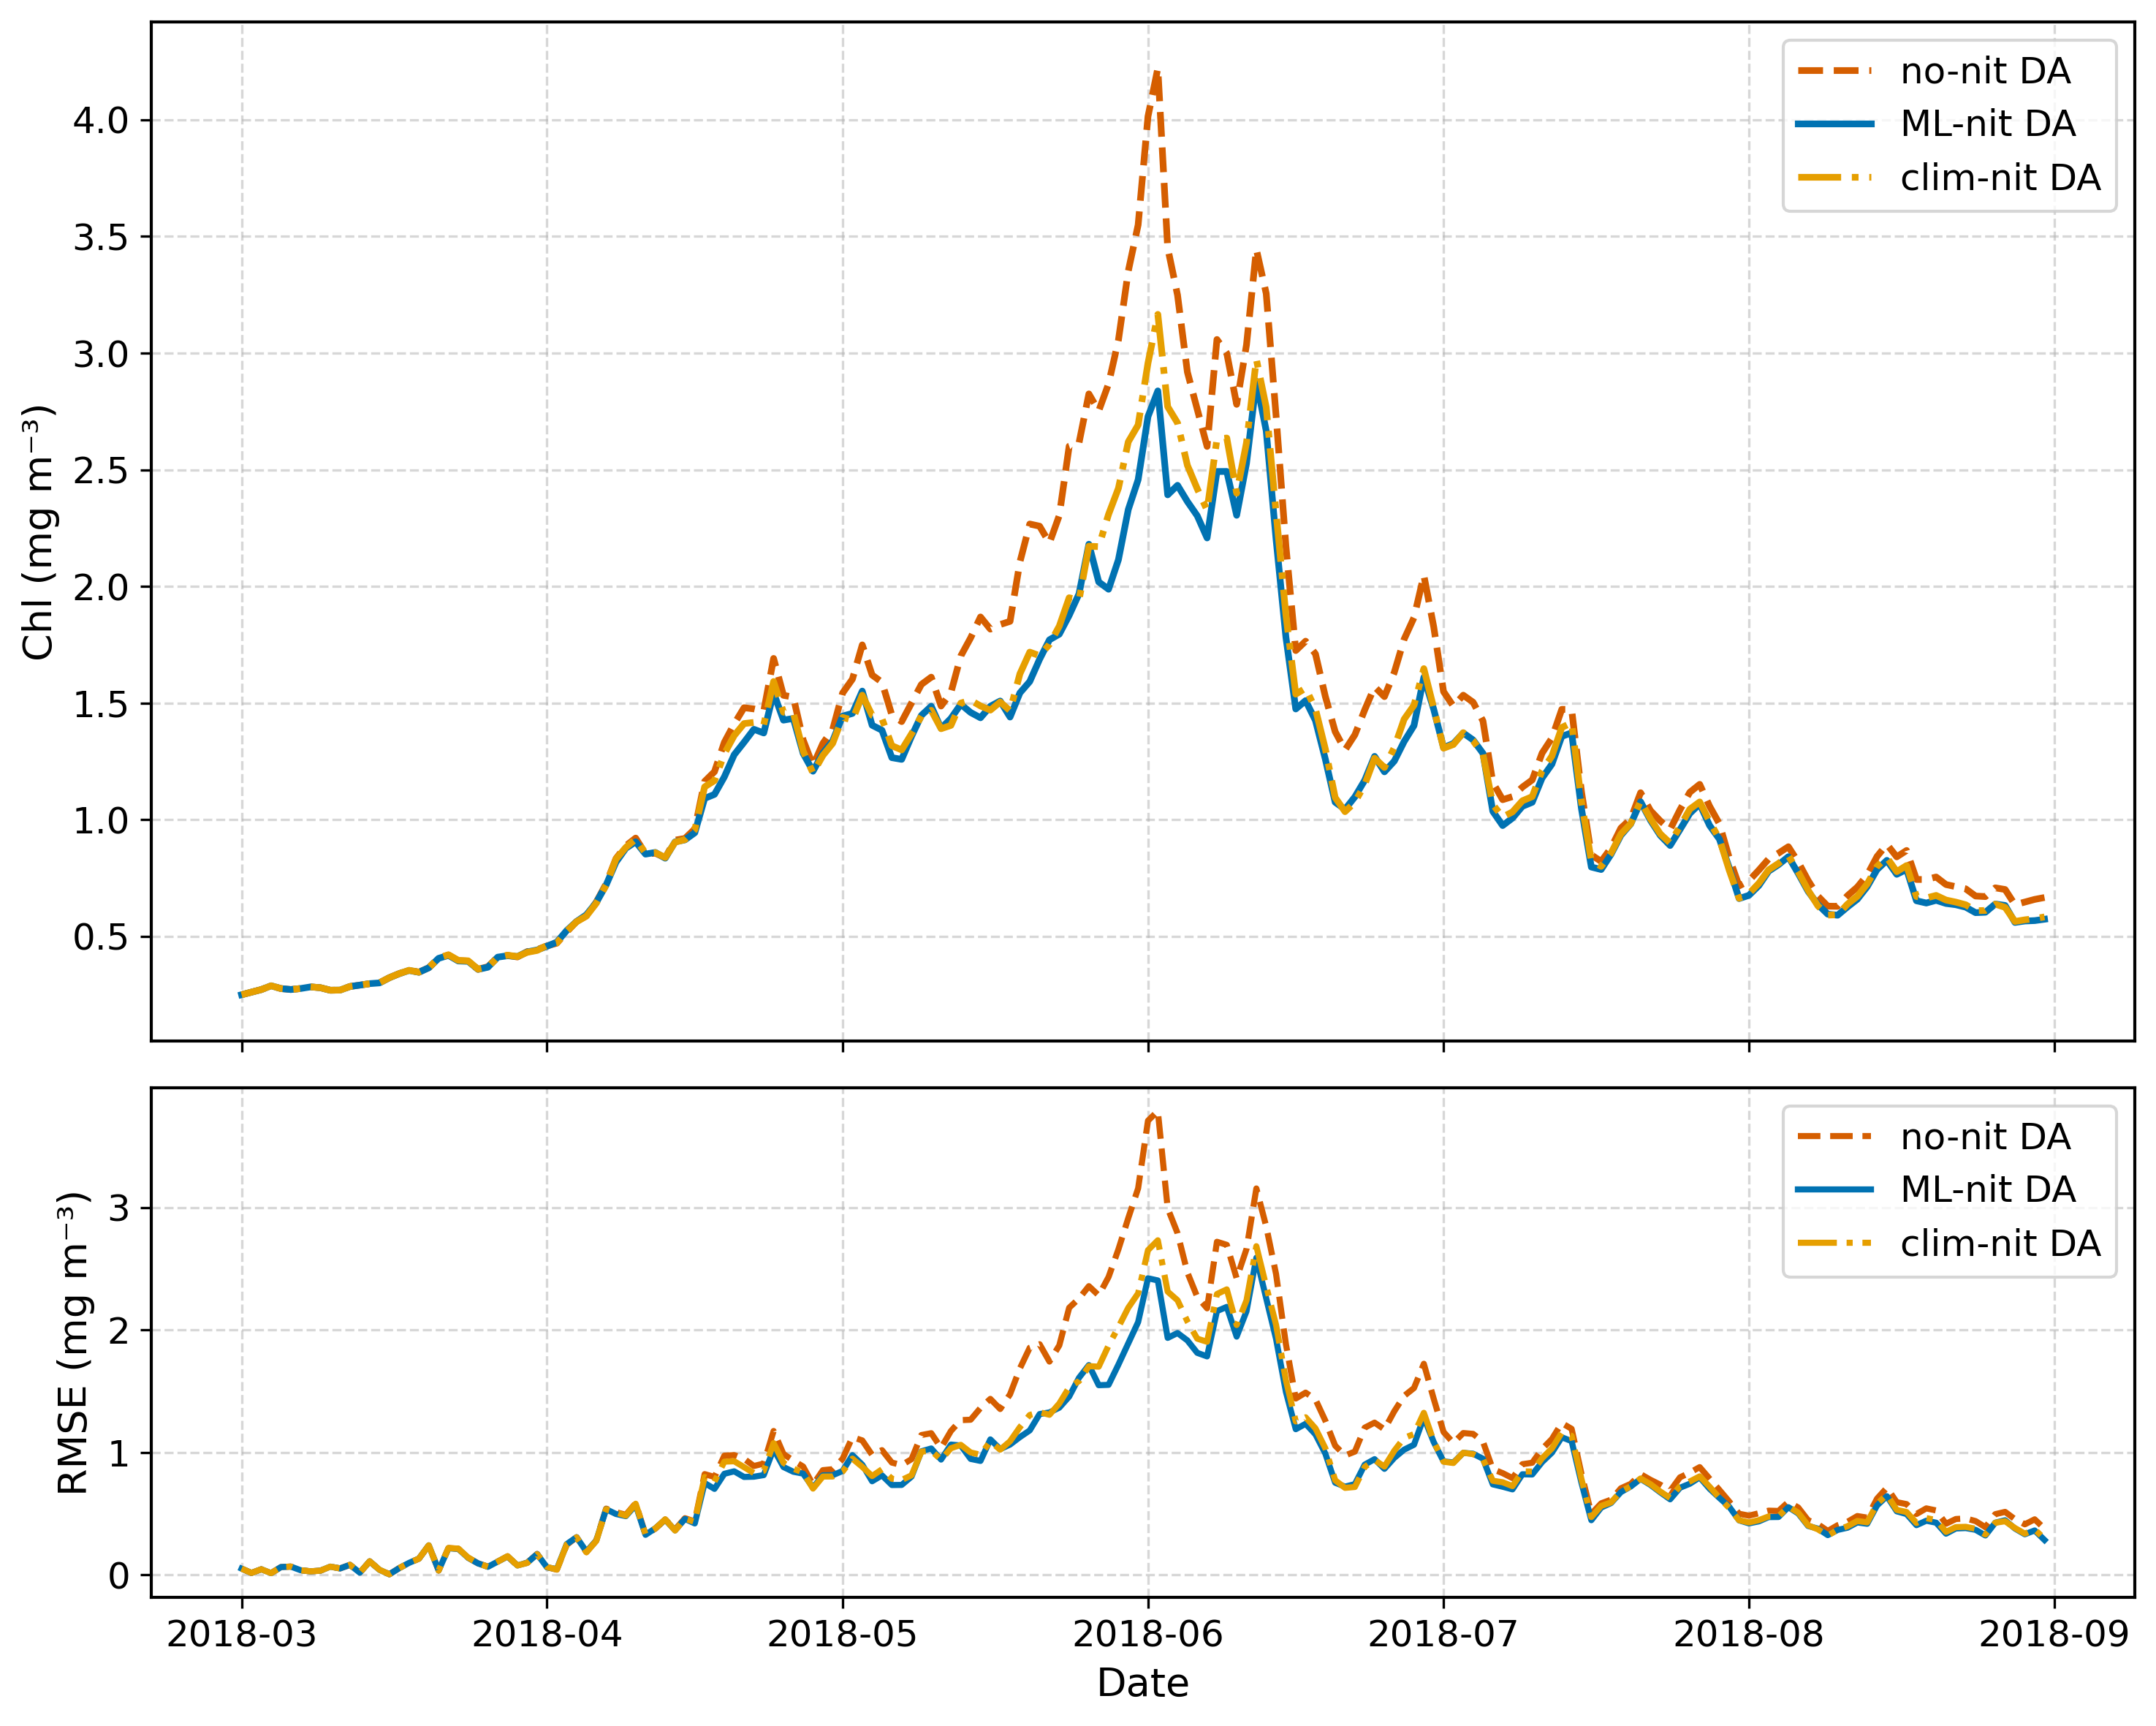
Fig.4 also demonstrates that assimilating nitrate into the model achieves its stated purpose, i.e. it substantially reduces nitrate RMSE relative to the assimilated data-set (RMSEimp in Fig.4:A). This also means the assimilation removes the excess nitrate in the Spring-Summer period (Fig.4:C). This has then desirable impact on the phytoplankton chlorophyll- forecast, substantially reducing both the bias and also the bias-corrected RMSE (Fig.5). The average forecast skill is improved consistently across the whole 5-day forecasting period, with the improvement increasing with the forecast lead time (Fig.5). The forecast is improved throughout the dynamical May-June period, during the peak and the recession of the forecast bloom (Fig.6). Spatially, the relative improvement (RMSEimp from Eq.3) of the phytoplankton forecast happens dominantly in the outer parts of the NWES, in the north-east part of the North Sea, in the Celtic Sea, Irish Sea, western English Channel, and in the off-shelf region west from Ireland (Fig.1:B). The areas of highest relative improvement closely overlap with areas where the model forecast skill is lowest (Fig.1:A), making these relative improvements especially beneficial.
A key question that needs exploring is how much benefit there is from assimilating nitrate time-evolving values, as opposed to relying on nitrate (ML-derived) seasonal climatology, which can be always supplied “offline” with lower computational cost. Fig.5 shows that clim-nit DA significantly improves the forecast compared to the no-nit DA run, but not as much as the ML-nit DA run, with the difference in their performance steadily growing with lead time. The ML-nit DA run performs better than the clim-nit DA run on large parts of the outer NWES boundary with RMSE improvement (RMSEimp) broadly in the range of 10-50% (Fig.1:C). The relative RMSE degradation with ML-nit DA relative to clim-nit DA happens on much smaller areas of the domain than the improvement, even though in some very specific locations the degradation can be quite substantial (as high as 100%, see Fig.1:C).
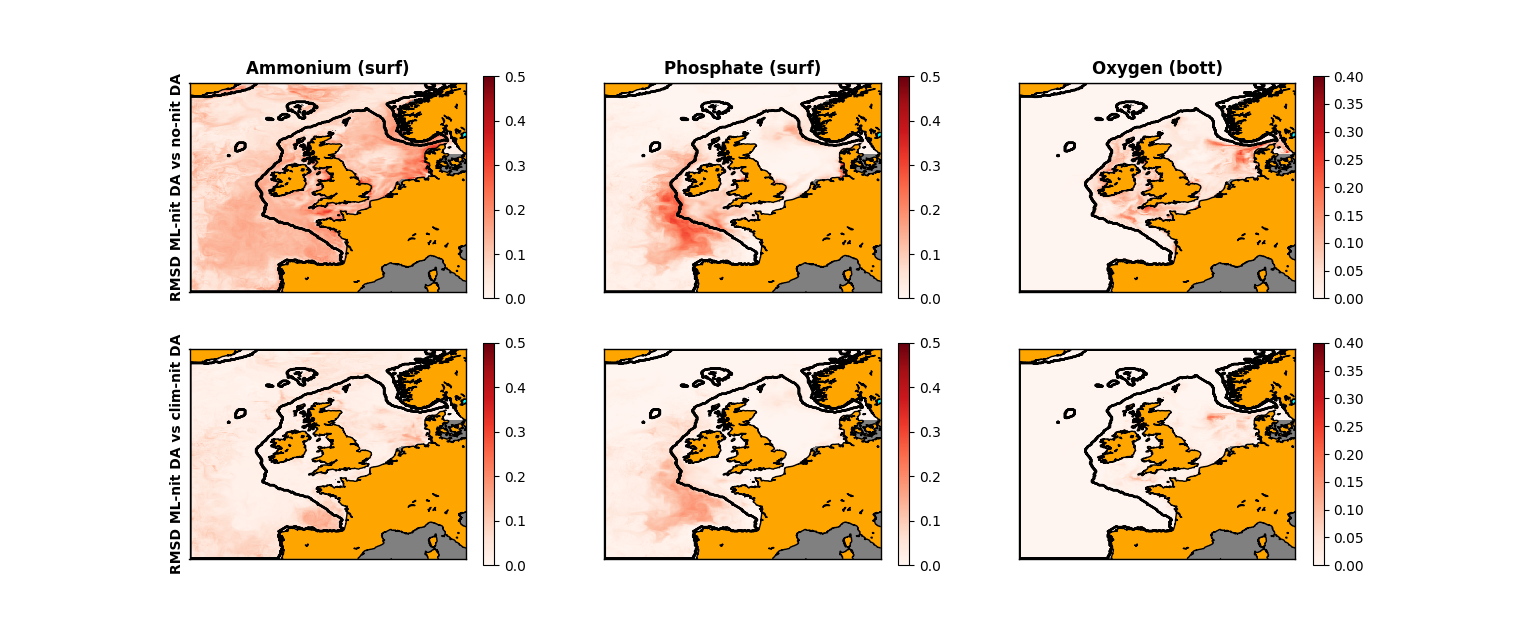
One potentially important application of short-range NWES forecasts is predicting eutrophication events. The improvement in model phytoplankton forecast skill, along with improved forecast nitrate concentrations, should significantly contribute to the operational capability to forecast such events. Furthermore, when it comes to capturing extreme events, such as eutrophication, there is an obvious advantage in predicting time-evolution of nitrate “online” by ML, as opposed to using nitrate climatology. In Fig.7 we focus on a range of standard eutrophication indicators beyond chlorophyll- (e.g. see OSPAR report Axe \BOthers. (\APACyear2017)): (i) dissolved surface inorganic nitrogen, represented in the model by the sum of nitrate and ammonium, (ii) dissolved surface inorganic phosphorus, represented in the model by phosphate, and (iii) dissolved oxygen near the sea bottom. Fig.7 shows the difference nitrate assimilation makes to 5-th forecasting lead day prediction of these indicators. It can be seen that the difference is quite significant especially for ammonium, which is understandable, since nitrogen cycling has been significantly altered through the assimilation of nitrate. The difference to phosphate is mainly outside of coastal zones, so it has lower impact on eutrophication monitoring, whereas the difference to the dissolved oxygen at the sea bottom is overall relatively small, but occurs mainly in certain interesting coastal areas, including the south-east North Sea (near the Danish coastline), which has seen hypoxia previously (Topcu \BBA Brockmann, \APACyear2015). Fig.7 also shows that the difference (measured by RMSD) between ML-nit DA and clim-nit DA is significantly smaller (roughly 5-times) than between ML-nit DA and no-nit DA.
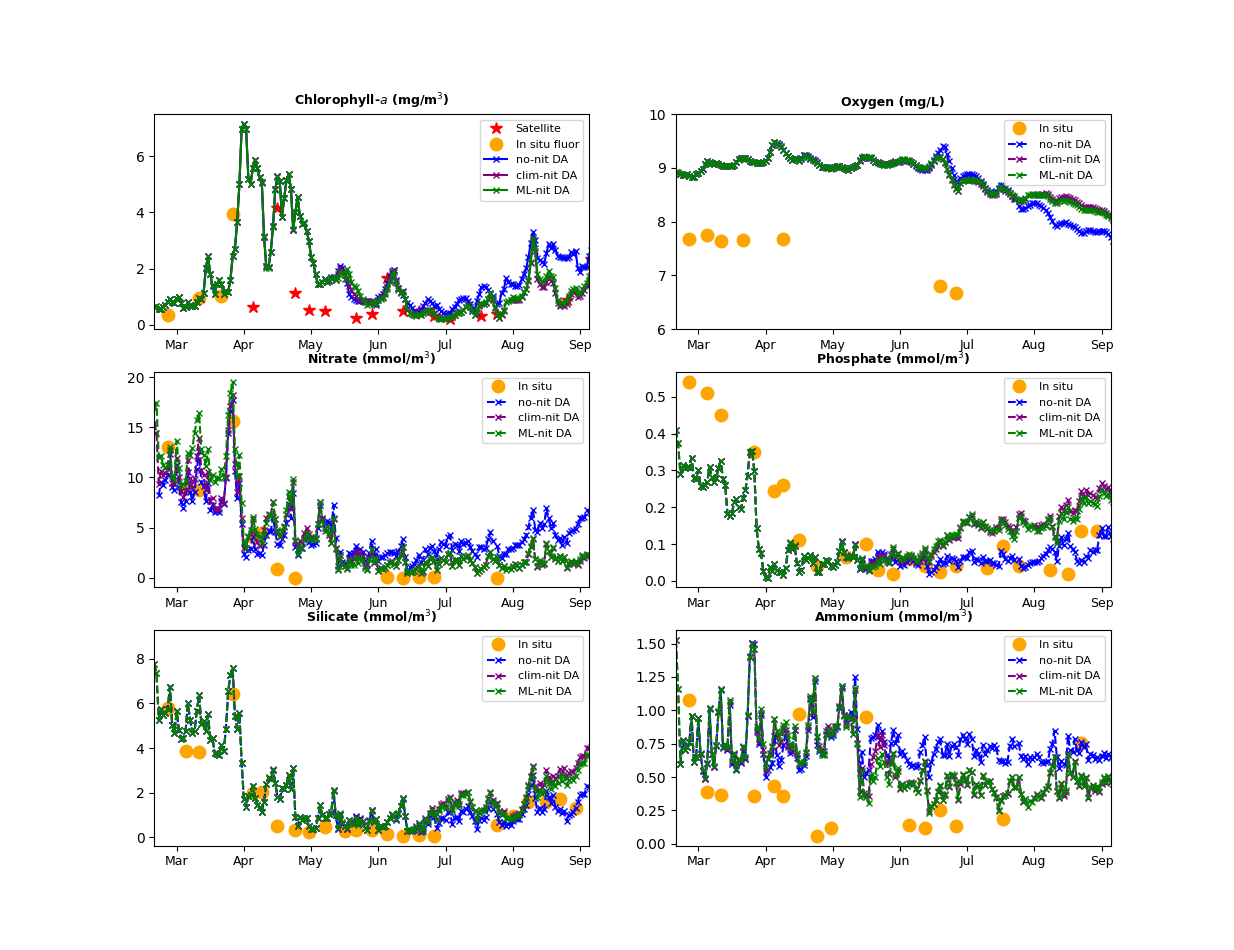
Fig.8 validates the skill of the 5-th day model forecast of some key eutrophication indicators at the L4 observing station in the western English Channel. Unfortunately, although the overall impact of nitrate assimilation on phytoplankton chlorophyll- forecasting was large in the western English Channel (Fig.1), this area of large impact excludes the coastal area where L4 is located. As shown in Fig.8, there is a distinctive (generally positive) impact of nitrate assimilation on the nitrate in March-April and the Summer period. Consistent with Fig.6 there is little impact of nitrate assimilation on chlorophyll- forecast in March-April, but there is more significant and positive impact in the Summer. Unlike the domain-wide results where the nitrate assimilation impact on chlorophyll- forecast is mostly visible around June (Fig.6), here it becomes larger as the simulation progresses. The progressive shift in chlorophyll- forecast (Fig.8) triggers changes in the other nutrients (phosphate, ammonium and silicate), which in some cases improve forecast skill (ammonium) and in others degrade it (phosphate and silicate). The improvement in ammonium forecast is however particularly interesting as it is part of broader improvement in forecasting inorganic nitrogen (in the model represented by nitrate and ammonium).
Finally, to evaluate the limitations of the offline system implemented in this work (the nitrate has been predicted from the Copernicus reanalysis rather than from the ML-nit DA analysis state), we have calculated the differences between ML-nit DA analysis and the Copernicus reanalysis in several variables used as inputs within the NN model. Our analysis (not shown here) demonstrated that these inputs differed between the ML-nit DA analysis and the Copernicus analysis, but the size of their difference (measured by RMSD) was at most about half of what it is between the Copernicus reanalysis and the weekly climatology calculated from the reanalysis. Based on this we would anticipate that the difference between the phytoplankton forecast skill of the online and the offline systems would be smaller than the difference between clim-nit DA and ML-nit DA shown in Fig.5. We would also conjecture that assimilating nitrate in the online system might further improve the phytoplankton forecast relative to ML-nit DA, as it is more self-consistent than the offline assimilation. These conjectures however need to be proven when such a system is developed in the future.
4 Conclusions
In this work we have demonstrated that a combined (hybrid) machine learning - data assimilation (DA) system where surface nitrate is being predicted by a neural network (NN) from the model analysis state (as well as atmospheric, structural and riverine data) and subsequently assimilated into the model, can have major positive impact on phytoplankton short-range (up to 5 day) forecasts in a shelf sea environment. We have argued that this happens because the degradation to phytoplankton forecast skill is due to an imbalance between the simulated light and nutrients, triggered by the lack of update to nutrients in the assimilation step within the existing operational system. We have shown that although significant improvement to the phytoplankton forecast skill can be achieved through assimilating the NN-derived surface nitrate weekly climatology, the flow-dependent prediction of nitrate outperforms the climatology approach. We have also evaluated the broader impact of nitrate assimilation on the forecast of a wider range of eutrophication indicators and performed some validation of this impact at the L4 location.
This work is complementary to some other current attempts on how to combine ML with DA to make the Met Office operational system more multi-variate and improve the short term forecasts (Higgs \BOthers., \APACyear2025). We anticipate that the technique developed here might have important use in future operational forecasting delivered by the Met Office for the North-West European Shelf. In future work we will also look to expand this approach to include other important variables currently not updated by the assimilation system, such as phosphate and oxygen. Another update that we envision for the future is to improve the spatial and temporal resolution of the NN-predicted nitrate by increasing the complexity of the NN model (as discussed in Banerjee \BBA Skákala (\APACyear2025)). This could bring additional benefit for the phytoplankton forecast and also increase the relative benefit of flow-dependent prediction of nitrate compared to assimilating nitrate climatology. We also propose to utilize the machine learning models for uncertainty estimates of the assimilated nitrate. The methods presented here demonstrate that implementing machine learning within DA offers a cheaper and skilled alternative to using expensive ensemble techniques such as ensemble Kalman filters to provide multivariate updates from assimilation of observed variables.
Acknowledgments We acknowledge use of the MONSooN2 system, a collaborative facility supplied under the Joint Weather and Climate Research Programme, a strategic partnership between the Met Office and the UK Natural Environment Research Council (NERC). The model runs used river data prepared by Sonja van Leeuwen and Helen Powley as part of UK Shelf Sea Biogeochemistry programme (contract no.NE/K001876/1) of the NERC and the Department for Environment, Food and Rural Affairs (DEFRA). The riverine data contained also climatological values from the Global River Discharge Data Base and the Centre for Ecology and Hydrology (Young \BBA Holt, \APACyear2007).
Funding: This work was partly funded by the Horizon Europe project The New Copernicus Capability for Tropic Ocean Networks (NECCTON, grant agreement no.101081273). We also acknowledge support from the UK NERC, including the single centre national capability programme – Climate Linked Atlantic Sector Science (CLASS,379NE/R015953/1).
Conflict of Interest statement: The authors declare no conflict of interest.
Permission to reproduce material from other sources: No material from other sources was reproduced in this work.
Authors’ contributions: DB developed the ML model used to predict the nitrate, set-up and run the experiments from this study, with an important input from DF. DB also prepared majority of the Figures, with two Figures prepared by JS. JS provided conceptualization of the study, overall supervision and funding acquisition. JS prepared the first draft of the manuscript, using parts of DB’s initial draft of the Introduction section. All authors subsequently provided comments and edits on the manuscript.
Data availability statement: The ML model can be downloaded from https://github.com/neccton-algo/nn-bg (Banerjee, 2025). The simulation outputs as well as the assimilated data are stored on the MonSOON facility MASS and can be obtained upon request.
References
- Anderson \BOthers. (\APACyear2000) \APACinsertmetastaranderson2000physical{APACrefauthors}Anderson, L\BPBIA., Robinson, A\BPBIR.\BCBL \BBA Lozano, C\BPBIJ. \APACrefYearMonthDay2000. \BBOQ\APACrefatitlePhysical and biological modeling in the Gulf Stream region:: I. Data assimilation methodology Physical and biological modeling in the gulf stream region:: I. data assimilation methodology.\BBCQ \APACjournalVolNumPagesDeep Sea Research Part I: Oceanographic Research Papers47101787–1827. \PrintBackRefs\CurrentBib
- Artioli \BOthers. (\APACyear2012) \APACinsertmetastarartioli2012carbonate{APACrefauthors}Artioli, Y., Blackford, J\BPBIC., Butenschön, M., Holt, J\BPBIT., Wakelin, S\BPBIL., Thomas, H.\BDBLAllen, J\BPBII. \APACrefYearMonthDay2012. \BBOQ\APACrefatitleThe carbonate system in the North Sea: Sensitivity and model validation The carbonate system in the north sea: Sensitivity and model validation.\BBCQ \APACjournalVolNumPagesJournal of Marine Systems1021–13. \PrintBackRefs\CurrentBib
- Axe \BOthers. (\APACyear2017) \APACinsertmetastaraxe2017eutrophication{APACrefauthors}Axe, P., Clausen, U., Leujak, W., Malcolm, S.\BCBL \BBA Harvey, E. \APACrefYearMonthDay2017. \BBOQ\APACrefatitleEutrophication status of the OSPAR maritime area Eutrophication status of the ospar maritime area.\BBCQ \APACjournalVolNumPagesThird Integrated Report on the Eutrophication Status of the OSPAR Maritime Area. \PrintBackRefs\CurrentBib
- Banerjee \BBA Skákala (\APACyear2025) \APACinsertmetastarbanerjee2025improved{APACrefauthors}Banerjee, D\BPBIS.\BCBT \BBA Skákala, J. \APACrefYearMonthDay2025. \BBOQ\APACrefatitleImproved understanding of eutrophication trends, indicators and problem areas using machine learning Improved understanding of eutrophication trends, indicators and problem areas using machine learning.\BBCQ \APACjournalVolNumPagesBiogeosciences (in press). {APACrefDOI} doi.org/10.22541/essoar.171405637.76928549/v1 \PrintBackRefs\CurrentBib
- Baretta \BOthers. (\APACyear1995) \APACinsertmetastarbaretta1995european{APACrefauthors}Baretta, J., Ebenhöh, W.\BCBL \BBA Ruardij, P. \APACrefYearMonthDay1995. \BBOQ\APACrefatitleThe European regional seas ecosystem model, a complex marine ecosystem model The european regional seas ecosystem model, a complex marine ecosystem model.\BBCQ \APACjournalVolNumPagesNetherlands Journal of Sea Research333-4233–246. \PrintBackRefs\CurrentBib
- Baretta-Bekker \BOthers. (\APACyear1997) \APACinsertmetastarbaretta1997microbial{APACrefauthors}Baretta-Bekker, J., Baretta, J.\BCBL \BBA Ebenhöh, W. \APACrefYearMonthDay1997. \BBOQ\APACrefatitleMicrobial dynamics in the marine ecosystem model ERSEM II with decoupled carbon assimilation and nutrient uptake Microbial dynamics in the marine ecosystem model ersem ii with decoupled carbon assimilation and nutrient uptake.\BBCQ \APACjournalVolNumPagesJournal of Sea Research383-4195–211. \PrintBackRefs\CurrentBib
- Berg \BBA Poulsen (\APACyear2012) \APACinsertmetastarberg2012implementation{APACrefauthors}Berg, P.\BCBT \BBA Poulsen, J\BPBIW. \APACrefYear2012. \APACrefbtitleImplementation details for HBM Implementation details for hbm. \APACaddressPublisherDanish Meteorological Institute. \PrintBackRefs\CurrentBib
- Blackford (\APACyear1997) \APACinsertmetastarblackford1997analysis{APACrefauthors}Blackford, J. \APACrefYearMonthDay1997. \BBOQ\APACrefatitleAn analysis of benthic biological dynamics in a North Sea ecosystem model An analysis of benthic biological dynamics in a north sea ecosystem model.\BBCQ \APACjournalVolNumPagesJournal of Sea Research383-4213–230. \PrintBackRefs\CurrentBib
- Bloom \BOthers. (\APACyear1996) \APACinsertmetastarbloom1996data{APACrefauthors}Bloom, S., Takacs, L., Da Silva, A.\BCBL \BBA Ledvina, D. \APACrefYearMonthDay1996. \BBOQ\APACrefatitleData assimilation using incremental analysis updates Data assimilation using incremental analysis updates.\BBCQ \APACjournalVolNumPagesMonthly Weather Review12461256–1271. \PrintBackRefs\CurrentBib
- Bruggeman \BBA Bolding (\APACyear2014) \APACinsertmetastarbruggeman2014general{APACrefauthors}Bruggeman, J.\BCBT \BBA Bolding, K. \APACrefYearMonthDay2014. \BBOQ\APACrefatitleA general framework for aquatic biogeochemical models A general framework for aquatic biogeochemical models.\BBCQ \APACjournalVolNumPagesEnvironmental modelling & software61249–265. \PrintBackRefs\CurrentBib
- Bruggeman \BBA Bolding (\APACyear2020) \APACinsertmetastarfabm{APACrefauthors}Bruggeman, J.\BCBT \BBA Bolding, K. \APACrefYearMonthDay2020. \APACrefbtitleFramework for Aquatic Biogeochemical Models. Framework for aquatic biogeochemical models. {APACrefDOI} http://doi.org/10.5281/zenodo.3817997 \PrintBackRefs\CurrentBib
- Butenschön \BOthers. (\APACyear2016) \APACinsertmetastarbutenschon2016ersem{APACrefauthors}Butenschön, M., Clark, J., Aldridge, J\BPBIN., Allen, J\BPBII., Artioli, Y., Blackford, J.\BDBLothers \APACrefYearMonthDay2016. \BBOQ\APACrefatitleERSEM 15.06: a generic model for marine biogeochemistry and the ecosystem dynamics of the lower trophic levels Ersem 15.06: a generic model for marine biogeochemistry and the ecosystem dynamics of the lower trophic levels.\BBCQ \APACjournalVolNumPagesGeoscientific Model Development941293–1339. \PrintBackRefs\CurrentBib
- Capuzzo \BOthers. (\APACyear2018) \APACinsertmetastarcapuzzo2018a{APACrefauthors}Capuzzo, E., Lynam, C\BPBIP., Barry, J., Stephens, D., Forster, R\BPBIM., Greenwood, N.\BDBLEngelhard, G\BPBIH. \APACrefYearMonthDay2018. \BBOQ\APACrefatitleA decline in primary production in the North Sea over 25 years, associated with reductions in zooplankton abundance and fish stock recruitment A decline in primary production in the north sea over 25 years, associated with reductions in zooplankton abundance and fish stock recruitment.\BBCQ \APACjournalVolNumPagesGlobal Change Biology241e352-e364. {APACrefURL} https://onlinelibrary.wiley.com/doi/abs/10.1111/gcb.13916 {APACrefDOI} https://doi.org/10.1111/gcb.13916 \PrintBackRefs\CurrentBib
- Chen \BOthers. (\APACyear2023) \APACinsertmetastarchen2023estimation{APACrefauthors}Chen, S., Meng, Y., Lin, S., Yu, Y.\BCBL \BBA Xi, J. \APACrefYearMonthDay2023. \BBOQ\APACrefatitleEstimation of sea surface nitrate from space: Current status and future potential Estimation of sea surface nitrate from space: Current status and future potential.\BBCQ \APACjournalVolNumPagesScience of The Total Environment899165690. \PrintBackRefs\CurrentBib
- Cheng \BOthers. (\APACyear2023) \APACinsertmetastarcheng2023machine{APACrefauthors}Cheng, S., Quilodrán-Casas, C., Ouala, S., Farchi, A., Liu, C., Tandeo, P.\BDBLothers \APACrefYearMonthDay2023. \BBOQ\APACrefatitleMachine learning with data assimilation and uncertainty quantification for dynamical systems: a review Machine learning with data assimilation and uncertainty quantification for dynamical systems: a review.\BBCQ \APACjournalVolNumPagesIEEE/CAA Journal of Automatica Sinica1061361–1387. \PrintBackRefs\CurrentBib
- Ciavatta \BOthers. (\APACyear2016) \APACinsertmetastarciavatta2016decadal{APACrefauthors}Ciavatta, S., Kay, S., Saux-Picart, S., Butenschön, M.\BCBL \BBA Allen, J. \APACrefYearMonthDay2016. \BBOQ\APACrefatitleDecadal reanalysis of biogeochemical indicators and fluxes in the North West European shelf-sea ecosystem Decadal reanalysis of biogeochemical indicators and fluxes in the north west european shelf-sea ecosystem.\BBCQ \APACjournalVolNumPagesJournal of Geophysical Research: Oceans12131824–1845. \PrintBackRefs\CurrentBib
- Devlin \BOthers. (\APACyear2023) \APACinsertmetastardevlin2023first{APACrefauthors}Devlin, M\BPBIJ., Prins, T\BPBIC., Enserink, L., Leujak, W., Heyden, B., Axe, P\BPBIG.\BDBLothers \APACrefYearMonthDay2023. \BBOQ\APACrefatitleA first ecological coherent assessment of eutrophication across the North-East Atlantic waters (2015–2020) A first ecological coherent assessment of eutrophication across the north-east atlantic waters (2015–2020).\BBCQ \APACjournalVolNumPagesFrontiers in ocean sustainability11253923. \PrintBackRefs\CurrentBib
- Edwards \BOthers. (\APACyear2012) \APACinsertmetastaredwards2012validation{APACrefauthors}Edwards, K., Barciela, R.\BCBL \BBA Butenschön, M. \APACrefYearMonthDay2012. \BBOQ\APACrefatitleValidation of the NEMO-ERSEM operational ecosystem model for the North West European Continental Shelf Validation of the nemo-ersem operational ecosystem model for the north west european continental shelf.\BBCQ \APACjournalVolNumPagesOcean Science86983–1000. \PrintBackRefs\CurrentBib
- Fennel \BOthers. (\APACyear2019) \APACinsertmetastarfennel2019advancing{APACrefauthors}Fennel, K., Gehlen, M., Brasseur, P., Brown, C\BPBIW., Ciavatta, S., Cossarini, G.\BDBLothers \APACrefYearMonthDay2019. \BBOQ\APACrefatitleAdvancing marine biogeochemical and ecosystem reanalyses and forecasts as tools for monitoring and managing ecosystem health Advancing marine biogeochemical and ecosystem reanalyses and forecasts as tools for monitoring and managing ecosystem health.\BBCQ \APACjournalVolNumPagesFrontiers in Marine Science689. \PrintBackRefs\CurrentBib
- Ford (\APACyear2021) \APACinsertmetastarford2021assimilating{APACrefauthors}Ford, D. \APACrefYearMonthDay2021. \BBOQ\APACrefatitleAssimilating synthetic Biogeochemical-Argo and ocean colour observations into a global ocean model to inform observing system design Assimilating synthetic biogeochemical-argo and ocean colour observations into a global ocean model to inform observing system design.\BBCQ \APACjournalVolNumPagesBiogeosciences182509–534. \PrintBackRefs\CurrentBib
- Ford \BOthers. (\APACyear2022) \APACinsertmetastarford2022solution{APACrefauthors}Ford, D., Grossberg, S., Rinaldi, G., Menon, P\BPBIP., Palmer, M\BPBIR., Skákala, J.\BDBLCiavatta, S. \APACrefYearMonthDay2022. \BBOQ\APACrefatitleA solution for autonomous, adaptive monitoring of coastal ocean ecosystems: Integrating ocean robots and operational forecasts A solution for autonomous, adaptive monitoring of coastal ocean ecosystems: Integrating ocean robots and operational forecasts.\BBCQ \APACjournalVolNumPagesFrontiers in Marine Science91067174. \PrintBackRefs\CurrentBib
- Fowler \BOthers. (\APACyear2023) \APACinsertmetastarfowler2023validating{APACrefauthors}Fowler, A\BPBIM., Skákala, J.\BCBL \BBA Ford, D. \APACrefYearMonthDay2023. \BBOQ\APACrefatitleValidating and improving the uncertainty assumptions for the assimilation of ocean-colour-derived chlorophyll a into a marine biogeochemistry model of the northwest European shelf seas Validating and improving the uncertainty assumptions for the assimilation of ocean-colour-derived chlorophyll a into a marine biogeochemistry model of the northwest european shelf seas.\BBCQ \APACjournalVolNumPagesQuarterly Journal of the Royal Meteorological Society149750300–324. \PrintBackRefs\CurrentBib
- Garcia \BOthers. (\APACyear2019) \APACinsertmetastargarcia2019world{APACrefauthors}Garcia, H., Weathers, K., Paver, C., Smolyar, I., Boyer, T., Locarnini, M.\BDBLothers \APACrefYearMonthDay2019. \BBOQ\APACrefatitleWorld ocean atlas 2018. Vol. 4: Dissolved inorganic nutrients (phosphate, nitrate and nitrate+ nitrite, silicate) World ocean atlas 2018. vol. 4: Dissolved inorganic nutrients (phosphate, nitrate and nitrate+ nitrite, silicate).\BBCQ \APACjournalVolNumPagesNOAA Atlas NESDIS 84, 35pp.. \PrintBackRefs\CurrentBib
- Geider \BOthers. (\APACyear1997) \APACinsertmetastargeider1997dynamic{APACrefauthors}Geider, R., MacIntyre, H.\BCBL \BBA Kana, T. \APACrefYearMonthDay1997. \BBOQ\APACrefatitleDynamic model of phytoplankton growth and acclimation: responses of the balanced growth rate and the chlorophyll a: carbon ratio to light, nutrient-limitation and temperature Dynamic model of phytoplankton growth and acclimation: responses of the balanced growth rate and the chlorophyll a: carbon ratio to light, nutrient-limitation and temperature.\BBCQ \APACjournalVolNumPagesMarine Ecology Progress Series148187–200. \PrintBackRefs\CurrentBib
- González-Gil \BOthers. (\APACyear2022) \APACinsertmetastargonzalez2022onset{APACrefauthors}González-Gil, R., Banas, N\BPBIS., Bresnan, E.\BCBL \BBA Heath, M\BPBIR. \APACrefYearMonthDay2022. \BBOQ\APACrefatitleThe onset of the spring phytoplankton bloom in the coastal North Sea supports the Disturbance Recovery Hypothesis The onset of the spring phytoplankton bloom in the coastal north sea supports the disturbance recovery hypothesis.\BBCQ \APACjournalVolNumPagesBiogeosciences1992417–2426. \PrintBackRefs\CurrentBib
- Good \BOthers. (\APACyear2013) \APACinsertmetastargood2013en4{APACrefauthors}Good, S\BPBIA., Martin, M\BPBIJ.\BCBL \BBA Rayner, N\BPBIA. \APACrefYearMonthDay2013. \BBOQ\APACrefatitleEN4: Quality controlled ocean temperature and salinity profiles and monthly objective analyses with uncertainty estimates En4: Quality controlled ocean temperature and salinity profiles and monthly objective analyses with uncertainty estimates.\BBCQ \APACjournalVolNumPagesJournal of Geophysical Research: Oceans118126704–6716. \PrintBackRefs\CurrentBib
- Harris (\APACyear2010) \APACinsertmetastarharris2010l4{APACrefauthors}Harris, R. \APACrefYearMonthDay2010. \BBOQ\APACrefatitleThe L4 time-series: the first 20 years The l4 time-series: the first 20 years.\BBCQ \APACjournalVolNumPagesJournal of Plankton Research325577–583. \PrintBackRefs\CurrentBib
- Heimbach \BOthers. (\APACyear2024) \APACinsertmetastarheimbach2024crafting{APACrefauthors}Heimbach, P., O’Donncha, F., Garcia-Valdecasas, J\BPBIM., Arnaud, A.\BCBL \BBA Wan, L. \APACrefYearMonthDay2024. \BBOQ\APACrefatitleCrafting the Future: Machine Learning for Ocean Forecasting Crafting the future: Machine learning for ocean forecasting.\BBCQ \APACjournalVolNumPagesState of the Planet Discussions20241–11. \PrintBackRefs\CurrentBib
- Higgs \BOthers. (\APACyear2025) \APACinsertmetastarhiggs2025hybrid{APACrefauthors}Higgs, I., Bannister, R., Skákala, J., Carrassi, A.\BCBL \BBA Ciavatta, S. \APACrefYearMonthDay2025. \BBOQ\APACrefatitleHybrid machine learning data assimilation for marine biogeochemistry Hybrid machine learning data assimilation for marine biogeochemistry.\BBCQ \APACjournalVolNumPagessubmitted to Biogeosciences, arXiv:2504.05218. \PrintBackRefs\CurrentBib
- Kay \BOthers. (\APACyear2019) \APACinsertmetastarkay2019north{APACrefauthors}Kay, S., McEwan, R.\BCBL \BBA Ford, D. \APACrefYearMonthDay2019. \BBOQ\APACrefatitleNorth West European Shelf Production Centre NORTHWESTSHELF_ANALYSIS_FORECAST_BIO_004_011, Quality Information Document North west european shelf production centre northwestshelf_analysis_forecast_bio_004_011, quality information document.\BBCQ \APACjournalVolNumPagesCopernicus Marine Environment Monitoring Service. \PrintBackRefs\CurrentBib
- Kay \BOthers. (\APACyear2021) \APACinsertmetastarkay2016north{APACrefauthors}Kay, S., McEwan, R.\BCBL \BBA Ford, D. \APACrefYearMonthDay2021. \BBOQ\APACrefatitleNorth West European Shelf Production Centre NWSHELF_MULTIYEAR_BIO_004_011 North west european shelf production centre nwshelf_multiyear_bio_004_011.\BBCQ \APACjournalVolNumPagesCMEMS Report321. \PrintBackRefs\CurrentBib
- King \BOthers. (\APACyear2018) \APACinsertmetastarking2018improving{APACrefauthors}King, R\BPBIR., While, J., Martin, M\BPBIJ., Lea, D\BPBIJ., Lemieux-Dudon, B., Waters, J.\BCBL \BBA O’Dea, E. \APACrefYearMonthDay2018. \BBOQ\APACrefatitleImproving the initialisation of the Met Office operational shelf-seas model Improving the initialisation of the met office operational shelf-seas model.\BBCQ \APACjournalVolNumPagesOcean Modelling1301–14. \PrintBackRefs\CurrentBib
- Kochkov \BOthers. (\APACyear2021) \APACinsertmetastarkochkov2021machine{APACrefauthors}Kochkov, D., Smith, J\BPBIA., Alieva, A., Wang, Q., Brenner, M\BPBIP.\BCBL \BBA Hoyer, S. \APACrefYearMonthDay2021. \BBOQ\APACrefatitleMachine learning–accelerated computational fluid dynamics Machine learning–accelerated computational fluid dynamics.\BBCQ \APACjournalVolNumPagesProceedings of the National Academy of Sciences11821e2101784118. \PrintBackRefs\CurrentBib
- Legge \BOthers. (\APACyear2020) \APACinsertmetastarlegge2020carbon{APACrefauthors}Legge, O., Johnson, M., Hicks, N., Jickells, T., Diesing, M., Aldridge, J.\BDBLBurrows, M\BPBIT\BPBIe\BPBIa. \APACrefYearMonthDay2020. \BBOQ\APACrefatitleCarbon on the northwest European shelf: Contemporary budget and future influences Carbon on the northwest european shelf: Contemporary budget and future influences.\BBCQ \APACjournalVolNumPagesFrontiers in Marine Science7143. \PrintBackRefs\CurrentBib
- Lenhart \BOthers. (\APACyear2010) \APACinsertmetastarlenhart2010predicting{APACrefauthors}Lenhart, H\BHBIJ., Mills, D\BPBIK., Baretta-Bekker, H., Van Leeuwen, S\BPBIM., Van Der Molen, J., Baretta, J\BPBIW.\BDBLothers \APACrefYearMonthDay2010. \BBOQ\APACrefatitlePredicting the consequences of nutrient reduction on the eutrophication status of the North Sea Predicting the consequences of nutrient reduction on the eutrophication status of the north sea.\BBCQ \APACjournalVolNumPagesJournal of Marine Systems811-2148–170. \PrintBackRefs\CurrentBib
- Lohse \BOthers. (\APACyear1995) \APACinsertmetastarLohse01021995{APACrefauthors}Lohse, L., Malschaert, J\BPBIF\BPBIP., Slomp, C\BPBIP., Helder, W.\BCBL \BBA van Raaphorst and, W. \APACrefYearMonthDay1995. \BBOQ\APACrefatitleSediment-water fluxes of inorganic nitrogen compounds along the transport route of organic matter in the North Sea Sediment-water fluxes of inorganic nitrogen compounds along the transport route of organic matter in the north sea.\BBCQ \APACjournalVolNumPagesOphelia411173–197. {APACrefDOI} 10.1080/00785236.1995.10422043 \PrintBackRefs\CurrentBib
- Loveday \BOthers. (\APACyear2021) \APACinsertmetastarloveday2021daily{APACrefauthors}Loveday, B., Smyth, T., Akpinar, A., Hull, T., Inall, M., Kaiser, J.\BDBLPalmer, M. \APACrefYearMonthDay2021. \BBOQ\APACrefatitleDaily to annual net primary production in the North Sea determined using autonomous underwater gliders and satellite Earth observation Daily to annual net primary production in the north sea determined using autonomous underwater gliders and satellite earth observation.\BBCQ \APACjournalVolNumPagesEarth System Science Data Discussions20211–30. \PrintBackRefs\CurrentBib
- Madec \BOthers. (\APACyear2015) \APACinsertmetastarmadec2015nemo{APACrefauthors}Madec, G.\BCBT \BOthersPeriod. \APACrefYearMonthDay2015. \BBOQ\APACrefatitleNEMO ocean engine Nemo ocean engine.\BBCQ \PrintBackRefs\CurrentBib
- Marine Systems Modelling Group (\APACyear2020) \APACinsertmetastarersem{APACrefauthors}Marine Systems Modelling Group, P\BPBIM\BPBIL. \APACrefYearMonthDay2020. \APACrefbtitleEuropean Regional Seas Ecosystem Model. European regional seas ecosystem model. {APACrefDOI} http://doi.org/10.5281/zenodo.3817997 \PrintBackRefs\CurrentBib
- Mattern \BOthers. (\APACyear2013) \APACinsertmetastarmattern2013sensitivity{APACrefauthors}Mattern, J\BPBIP., Fennel, K.\BCBL \BBA Dowd, M. \APACrefYearMonthDay2013. \BBOQ\APACrefatitleSensitivity and uncertainty analysis of model hypoxia estimates for the Texas-Louisiana shelf Sensitivity and uncertainty analysis of model hypoxia estimates for the texas-louisiana shelf.\BBCQ \APACjournalVolNumPagesJournal of Geophysical Research: Oceans11831316–1332. \PrintBackRefs\CurrentBib
- Mogensen \BOthers. (\APACyear2009) \APACinsertmetastarmogensen2009nemovar{APACrefauthors}Mogensen, K., Balmaseda, M., Weaver, A., Martin, M.\BCBL \BBA Vidard, A. \APACrefYearMonthDay2009. \BBOQ\APACrefatitleNEMOVAR: A variational data assimilation system for the NEMO ocean model Nemovar: A variational data assimilation system for the nemo ocean model.\BBCQ \APACjournalVolNumPagesECMWF newsletter12017–22. \PrintBackRefs\CurrentBib
- Mogensen \BOthers. (\APACyear2012) \APACinsertmetastarmogensen2012nemovar{APACrefauthors}Mogensen, K., Balmaseda, M\BPBIA., Weaver, A.\BCBL \BOthersPeriod. \APACrefYearMonthDay2012. \BBOQ\APACrefatitleThe NEMOVAR ocean data assimilation system as implemented in the ECMWF ocean analysis for System 4 The nemovar ocean data assimilation system as implemented in the ecmwf ocean analysis for system 4.\BBCQ \PrintBackRefs\CurrentBib
- O’Dea \BOthers. (\APACyear2017) \APACinsertmetastaro2017co5{APACrefauthors}O’Dea, E., Furner, R., Wakelin, S., Siddorn, J., While, J., Sykes, P.\BDBLHewitt, H. \APACrefYearMonthDay2017. \BBOQ\APACrefatitleThe CO5 configuration of the 7 km Atlantic Margin Model: large-scale biases and sensitivity to forcing, physics options and vertical resolution The co5 configuration of the 7 km atlantic margin model: large-scale biases and sensitivity to forcing, physics options and vertical resolution.\BBCQ \APACjournalVolNumPagesGeoscientific Model Development1082947. \PrintBackRefs\CurrentBib
- Ourmières \BOthers. (\APACyear2009) \APACinsertmetastarourmieres2009key{APACrefauthors}Ourmières, Y., Brasseur, P., Lévy, M., Brankart, J\BHBIM.\BCBL \BBA Verron, J. \APACrefYearMonthDay2009. \BBOQ\APACrefatitleOn the key role of nutrient data to constrain a coupled physical–biogeochemical assimilative model of the North Atlantic Ocean On the key role of nutrient data to constrain a coupled physical–biogeochemical assimilative model of the north atlantic ocean.\BBCQ \APACjournalVolNumPagesJournal of Marine Systems751-2100–115. \PrintBackRefs\CurrentBib
- Pauly \BOthers. (\APACyear2002) \APACinsertmetastarpauly2002towards{APACrefauthors}Pauly, D., Christensen, V., Guénette, S., Pitcher, T\BPBIJ., Sumaila, U\BPBIR., Walters, C\BPBIJ.\BDBLZeller, D. \APACrefYearMonthDay2002. \BBOQ\APACrefatitleTowards sustainability in world fisheries Towards sustainability in world fisheries.\BBCQ \APACjournalVolNumPagesNature4186898689–695. \PrintBackRefs\CurrentBib
- Pingree \BBA Griffiths (\APACyear1978) \APACinsertmetastarpingree1978tidal{APACrefauthors}Pingree, R.\BCBT \BBA Griffiths, D. \APACrefYearMonthDay1978. \BBOQ\APACrefatitleTidal fronts on the shelf seas around the British Isles Tidal fronts on the shelf seas around the british isles.\BBCQ \APACjournalVolNumPagesJournal of Geophysical Research: Oceans83C94615–4622. \PrintBackRefs\CurrentBib
- Sathyendranath \BOthers. (\APACyear2019) \APACinsertmetastarsathyendranath2019ocean{APACrefauthors}Sathyendranath, S., Brewin, R\BPBIJ., Brockmann, C., Brotas, V., Calton, B., Chuprin, A.\BDBLothers \APACrefYearMonthDay2019. \BBOQ\APACrefatitleAn Ocean-Colour Time Series for Use in Climate Studies: The Experience of the Ocean-Colour Climate Change Initiative (OC-CCI) An ocean-colour time series for use in climate studies: The experience of the ocean-colour climate change initiative (oc-cci).\BBCQ \APACjournalVolNumPagesSensors19194285. \PrintBackRefs\CurrentBib
- Sauzède \BOthers. (\APACyear2017) \APACinsertmetastarsauzede2017estimates{APACrefauthors}Sauzède, R., Bittig, H\BPBIC., Claustre, H., Pasqueron de Fommervault, O., Gattuso, J\BHBIP., Legendre, L.\BCBL \BBA Johnson, K\BPBIS. \APACrefYearMonthDay2017. \BBOQ\APACrefatitleEstimates of water-column nutrient concentrations and carbonate system parameters in the global ocean: A novel approach based on neural networks Estimates of water-column nutrient concentrations and carbonate system parameters in the global ocean: A novel approach based on neural networks.\BBCQ \APACjournalVolNumPagesFrontiers in Marine Science4128. \PrintBackRefs\CurrentBib
- Schartau \BOthers. (\APACyear2017) \APACinsertmetastarschartau2017reviews{APACrefauthors}Schartau, M., Wallhead, P., Hemmings, J., Löptien, U., Kriest, I., Krishna, S.\BDBLOschlies, A. \APACrefYearMonthDay2017. \BBOQ\APACrefatitleReviews and syntheses: parameter identification in marine planktonic ecosystem modelling Reviews and syntheses: parameter identification in marine planktonic ecosystem modelling.\BBCQ \APACjournalVolNumPagesBiogeosciences1461647–1701. \PrintBackRefs\CurrentBib
- Sharples \BOthers. (\APACyear2006) \APACinsertmetastarSHARPLES2006733{APACrefauthors}Sharples, J., Ross, O\BPBIN., Scott, B\BPBIE., Greenstreet, S\BPBIP.\BCBL \BBA Fraser, H. \APACrefYearMonthDay2006. \BBOQ\APACrefatitleInter-annual variability in the timing of stratification and the spring bloom in the North-western North Sea Inter-annual variability in the timing of stratification and the spring bloom in the north-western north sea.\BBCQ \APACjournalVolNumPagesContinental Shelf Research266733-751. {APACrefURL} https://www.sciencedirect.com/science/article/pii/S0278434306000392 {APACrefDOI} https://doi.org/10.1016/j.csr.2006.01.011 \PrintBackRefs\CurrentBib
- Siddorn \BBA Furner (\APACyear2013) \APACinsertmetastarsiddorn2013analytical{APACrefauthors}Siddorn, J.\BCBT \BBA Furner, R. \APACrefYearMonthDay2013. \BBOQ\APACrefatitleAn analytical stretching function that combines the best attributes of geopotential and terrain-following vertical coordinates An analytical stretching function that combines the best attributes of geopotential and terrain-following vertical coordinates.\BBCQ \APACjournalVolNumPagesOcean Modelling661–13. \PrintBackRefs\CurrentBib
- Silva \BOthers. (\APACyear2021) \APACinsertmetastarsilva2021twenty{APACrefauthors}Silva, E., Counillon, F., Brajard, J., Korosov, A., Pettersson, L\BPBIH., Samuelsen, A.\BCBL \BBA Keenlyside, N. \APACrefYearMonthDay2021. \BBOQ\APACrefatitleTwenty-one years of phytoplankton bloom phenology in the Barents, Norwegian, and North Seas Twenty-one years of phytoplankton bloom phenology in the barents, norwegian, and north seas.\BBCQ \APACjournalVolNumPagesFrontiers in Marine Science8746327. \PrintBackRefs\CurrentBib
- Skákala \BOthers. (\APACyear2023) \APACinsertmetastarskakala2023future{APACrefauthors}Skákala, J., Awty-Carroll, K., Menon, P\BPBIP., Wang, K.\BCBL \BBA Lessin, G. \APACrefYearMonthDay2023. \BBOQ\APACrefatitleFuture digital twins: emulating a highly complex marine biogeochemical model with machine learning to predict hypoxia Future digital twins: emulating a highly complex marine biogeochemical model with machine learning to predict hypoxia.\BBCQ \APACjournalVolNumPagesFrontiers in Marine Science101058837. \PrintBackRefs\CurrentBib
- Skákala \BOthers. (\APACyear2020) \APACinsertmetastarskakala2019improved{APACrefauthors}Skákala, J., Bruggeman, J., Brewin, R\BPBIJ., Ford, D\BPBIA.\BCBL \BBA Ciavatta, S. \APACrefYearMonthDay2020. \BBOQ\APACrefatitleImproved representation of underwater light field and its impact on ecosystem dynamics: a study in the North Sea Improved representation of underwater light field and its impact on ecosystem dynamics: a study in the north sea.\BBCQ \APACjournalVolNumPagesJournal of Geophysical Research: Oceanse2020JC016122. \PrintBackRefs\CurrentBib
- Skákala \BOthers. (\APACyear2022) \APACinsertmetastarskakala2022impact{APACrefauthors}Skákala, J., Bruggeman, J., Ford, D., Wakelin, S., Akpınar, A., Hull, T.\BDBLothers \APACrefYearMonthDay2022. \BBOQ\APACrefatitleThe impact of ocean biogeochemistry on physics and its consequences for modelling shelf seas The impact of ocean biogeochemistry on physics and its consequences for modelling shelf seas.\BBCQ \APACjournalVolNumPagesOcean Modelling172101976. \PrintBackRefs\CurrentBib
- Skákala \BOthers. (\APACyear2018) \APACinsertmetastarskakala2018assimilation{APACrefauthors}Skákala, J., Ford, D., Brewin, R\BPBIJ., McEwan, R., Kay, S., Taylor, B.\BDBLCiavatta, S. \APACrefYearMonthDay2018. \BBOQ\APACrefatitleThe assimilation of phytoplankton functional types for operational forecasting in the northwest European Shelf The assimilation of phytoplankton functional types for operational forecasting in the northwest european shelf.\BBCQ \APACjournalVolNumPagesJournal of Geophysical Research: Oceans12385230–5247. \PrintBackRefs\CurrentBib
- Skákala \BOthers. (\APACyear2024) \APACinsertmetastarskakala2024how{APACrefauthors}Skákala, J., Ford, D., Fowler, A., Lea, D., Martin, M\BPBIJ.\BCBL \BBA Ciavatta, S. \APACrefYearMonthDay2024. \BBOQ\APACrefatitleHow uncertain and observable are marine ecosystem indicators in shelf seas? How uncertain and observable are marine ecosystem indicators in shelf seas?\BBCQ \APACjournalVolNumPagesProgress in Oceanography224103249. \PrintBackRefs\CurrentBib
- Skákala \BOthers. (\APACyear2025) \APACinsertmetastarskakala2024marine{APACrefauthors}Skákala, J., Ford, D., Haines, K., Lawless, A., Martin, M., Browne, P.\BDBLLea, D\BPBIe\BPBIa. \APACrefYearMonthDay2025. \BBOQ\APACrefatitleMarine data assimilation in the UK: the past, the present and the vision for the future Marine data assimilation in the uk: the past, the present and the vision for the future.\BBCQ \APACjournalVolNumPagesaccepted for publication in Ocean Science20241–45. \PrintBackRefs\CurrentBib
- Skákala \BOthers. (\APACyear2021) \APACinsertmetastarskakala2020towards{APACrefauthors}Skákala, J., Ford, D\BPBIA., Bruggeman, J., Hull, T., Kaiser, J., King, R\BPBIR.\BDBLCiavatta, S. \APACrefYearMonthDay2021. \BBOQ\APACrefatitleTowards a multi-platform assimilative system for ocean biogeochemistry Towards a multi-platform assimilative system for ocean biogeochemistry.\BBCQ \APACjournalVolNumPagesEarth and Space Science Open Archive ESSOAr, submitted to JGR-Oceans. \PrintBackRefs\CurrentBib
- Sonnewald \BOthers. (\APACyear2021) \APACinsertmetastarsonnewald2021bridging{APACrefauthors}Sonnewald, M., Lguensat, R., Jones, D\BPBIC., Dueben, P\BPBID., Brajard, J.\BCBL \BBA Balaji, V. \APACrefYearMonthDay2021. \BBOQ\APACrefatitleBridging observations, theory and numerical simulation of the ocean using machine learning Bridging observations, theory and numerical simulation of the ocean using machine learning.\BBCQ \APACjournalVolNumPagesEnvironmental Research Letters167073008. \PrintBackRefs\CurrentBib
- Storkey \BOthers. (\APACyear2010) \APACinsertmetastarstorkey2010forecasting{APACrefauthors}Storkey, D., Blockley, E., Furner, R., Guiavarc’h, C., Lea, D., Martin, M.\BDBLSiddorn, J. \APACrefYearMonthDay2010. \BBOQ\APACrefatitleForecasting the ocean state using NEMO: The new FOAM system Forecasting the ocean state using nemo: The new foam system.\BBCQ \APACjournalVolNumPagesJournal of operational oceanography313–15. \PrintBackRefs\CurrentBib
- Tonani \BOthers. (\APACyear2019) \APACinsertmetastartonani2019impact{APACrefauthors}Tonani, M., Sykes, P., King, R\BPBIR., McConnell, N., Péquignet, A\BHBIC., O’Dea, E.\BDBLSiddorn, J. \APACrefYearMonthDay2019. \BBOQ\APACrefatitleThe impact of a new high-resolution ocean model on the Met Office North-West European Shelf forecasting system The impact of a new high-resolution ocean model on the met office north-west european shelf forecasting system.\BBCQ \APACjournalVolNumPagesOcean Science1541133–1158. \PrintBackRefs\CurrentBib
- Topcu \BBA Brockmann (\APACyear2015) \APACinsertmetastartopcu2015seasonal{APACrefauthors}Topcu, H.\BCBT \BBA Brockmann, U. \APACrefYearMonthDay2015. \BBOQ\APACrefatitleSeasonal oxygen depletion in the North Sea, a review Seasonal oxygen depletion in the north sea, a review.\BBCQ \APACjournalVolNumPagesMarine pollution bulletin991-25–27. \PrintBackRefs\CurrentBib
- Waters \BOthers. (\APACyear2015) \APACinsertmetastarwaters2015implementing{APACrefauthors}Waters, J., Lea, D\BPBIJ., Martin, M\BPBIJ., Mirouze, I., Weaver, A.\BCBL \BBA While, J. \APACrefYearMonthDay2015. \BBOQ\APACrefatitleImplementing a variational data assimilation system in an operational 1/4 degree global ocean model Implementing a variational data assimilation system in an operational 1/4 degree global ocean model.\BBCQ \APACjournalVolNumPagesQuarterly Journal of the Royal Meteorological Society141687333–349. \PrintBackRefs\CurrentBib
- Weston \BOthers. (\APACyear2005) \APACinsertmetastarweston2005primary{APACrefauthors}Weston, K., Fernand, L., Mills, D., Delahunty, R.\BCBL \BBA Brown, J. \APACrefYearMonthDay2005. \BBOQ\APACrefatitlePrimary production in the deep chlorophyll maximum of the central North Sea Primary production in the deep chlorophyll maximum of the central north sea.\BBCQ \APACjournalVolNumPagesJournal of plankton research279909–922. \PrintBackRefs\CurrentBib
- Wu \BOthers. (\APACyear2025) \APACinsertmetastarwu2025neural{APACrefauthors}Wu, B., Zheng, S., Li, S.\BCBL \BBA Wang, S. \APACrefYearMonthDay2025. \BBOQ\APACrefatitleNeural emulator based on physical fields for accelerating the simulation of surface chlorophyll in an Earth System Model Neural emulator based on physical fields for accelerating the simulation of surface chlorophyll in an earth system model.\BBCQ \APACjournalVolNumPagesOcean Modelling102491. \PrintBackRefs\CurrentBib
- Young \BBA Holt (\APACyear2007) \APACinsertmetastaryoung2007prediction{APACrefauthors}Young, E.\BCBT \BBA Holt, J. \APACrefYearMonthDay2007. \BBOQ\APACrefatitlePrediction and analysis of long-term variability of temperature and salinity in the Irish Sea Prediction and analysis of long-term variability of temperature and salinity in the irish sea.\BBCQ \APACjournalVolNumPagesJournal of Geophysical Research: Oceans112C1. \PrintBackRefs\CurrentBib