Combining Mathematical Morphology and the Hilbert Transform for Fully Automatic Nuclei Detection in Fluorescence Microscopy
Abstract
Accurate and reliable nuclei identification is an essential part of quantification in microscopy. A range of mathematical and machine learning approaches are used but all methods have limitations. Such limitations include sensitivity to user parameters or a need for pre-processing in classical approaches or the requirement for relatively large amounts of training data in deep learning approaches. Here we demonstrate a new approach for nuclei detection that combines mathematical morphology with the Hilbert transform to detect the centres, sizes and orientations of elliptical objects. We evaluate this approach on datasets from the Broad Bioimage Benchmark Collection and compare it to established algorithms and previously published results. We show this new approach to outperform established classical approaches and be comparable in performance to deep-learning approaches. We believe this approach to be a competitive algorithm for nuclei detection in microscopy.
Keywords:
Nuclei Detection Hilbert Transform Mathematical Morphology Nuclei Counting.1 Introduction
Quantitative biology relies heavily on the analysis of fluorescence microscopy images. Key to a large number of experiments is the ability to detect and count the number of cells or nuclei in an image or region of interest. Frequently, such as for high-throughput and large-scale imaging experiments, this is the first step in an automated analysis pipeline. As such, the scientific community requires novel, robust and automatic approaches to this essential step.
Manual cell counting and annotation, by visual inspection, is difficult, labour intensive, time consuming and subjective to the annotator involved. As such, a large number of groups have proposed a variety of approaches for automatic nuclei detection in fluorescent microscopy images. In recent years proposed methods have included:
-
•
variations upon thresholding-based segmentation, which are limited in performance due to intensity inhomogeneity and nuclei/cell clustering [5];
-
•
H-minima transforms [8];
-
•
voting-based techniques [18], which both show good results but are sensitive to parameters;
- •
-
•
using Laplacian of Gaussian filters [17], which is low computational complexity but struggles with variation in size, shape and rotation of objects within an image; and
-
•
graph-cut optimisation approaches [12], which requires the finding of initial seed points for each nucleus.
-
•
convolutional neural networks, which generally require copious amounts of manually labelled training data, and struggle to separate overlapping objects [7]
In our experience, nuclei size (scale) is an important contributor to 1. whether or not an algorithm is successful 2. how robust an algorithm is to image variation and 3. to the running time of an algorithm. We have also found that many excellent algorithms exist for detecting small blobs, on the scale of a few pixels diameter, that fail or are less reliable for medium or large blobs, i.e. over ten pixels diameter, when such objects tend to display significant eccentricity. At this and larger scales the number of algorithms available decrease or make some assumptions on the data.
In this paper we apply a new ellipse detection algorithm based on mathematical morphology and the Hilbert transform to the task of counting medium blobs, i.e. nuclei, on the scale of pixels in fluorescence microscopy images. This new algorithm requires no preprocessing and no training. Simplistically, the algorithm performs three steps: 1. Mathematical morphology is used to create an object sparse search space over different orientations and scales; 2. The Hilbert transform is used to search this space and range object edges and for determining the ellipse/nucleus geometry at all pixels of the image; 3. Prominent ellipses/nuclei are extracted and post-detection pruning is used to eradicate over detection. We call this method Hilbert Edge Detection and Ranging (HEDAR). All code is available on GitHub at https://github.com/ChasNelson1990/Ellipse-Detection-by-Hilbert-Edge-Detection-and-Ranging.
In the rest of this paper we introduce HEDAR (Section 2) and compare this method to several traditional and new algorithms for blob/nuclei counting in fluorescence microscopy (Section 3). We have used the Broad Bioimage Benchmark Collection [11] throughout this paper to ensure comparison with previously published results, which we have reported where appropriate.
2 Methods
Our new algorithm, Hilbert Edge Detection and Ranging, is a three step process. First, we erode the original 2D, greyscale image with a bank of line structuring elements of different integer pixel lengths and rotations . We then stack the resulting eroded images into a four dimensional array , such that . We note that in 2D pixel-space we can define the limit on the number of rotations as , i.e. the perimeter of the bounding box of the half-circle covered by all (symmetric) line structuring elements of length . Thus, for a given where the point lies inside a bright ellipse, yields a morphological intensity signal that drops off at the distance from to the boundary of the ellipse along the direction .
Next, we calculate the 1D Hilbert transform over all morphological signals. The transform will be maximal at a step in the morphological signal from high to low (and minimal at a step from low to high). By identifying the maxima in each signal we can range the distance from the current pixel to the nearest edge along that angle. Mathematically, we can define this as,
| (1) |
The major axis of any ellipse, i.e. nucleus, centred at in the image will be,
| (2) |
We can concurrently identify the orientation of any nucleus centred at in the image as,
| (3) |
We then extract the distance to any edge at to the major axis to determine the minor axis of any nucleus centred at in the image. Using the Hilbert transform makes this process robust to noise and blurring.
Like other mathematical morphological image processing approaches, such as neuriteness in vessel enhancement, so far the algorithm has assumed the presence of an ellipse at all points (c.f. assuming a vessel in neuriteness), the next step is to identify likely ellipses/nuclei. To accomplish this we element-wise multiply the minor and major axes at every pixel. This produces a heat-map with high prominence peaks at the centres of any possible nuclei.
The prominence map is masked with a minimum threshold size for Hilbert steps in morphological signals. This acts similarly to local thresholding of the image: as each step must be at least as large as the threshold, we only consider pixels where the possible nucleus is brighter than its local background by at least . This suppresses false positives caused by background noise. After smoothing the masked prominence map with a pixels median filter we then identify the regional maxima. Each maximum represents a nucleus and we determine the major axis, minor axis and orientation from previous steps.
In post-processing, we cycle through all detected ellipses, removing the more overlapped ellipse of any pair with intersection-over-union greater than .
3 Results
3.1 Combined Mathematical Morphology and Hilbert Transform for Accurate Nuclei Counting
Combined mathematical morphology and the Hilbert transform in our Hilbert Edge Detection and Ranging algorithm enables accurate nuclei counting in fluorescence microscopy, as show in Figure˜1. Most nuclei are accurately counted giving a low mean percentage error. HEDAR does fail to detect a small number of cells, specifically irregular cells and some clustered or overlapping cells.
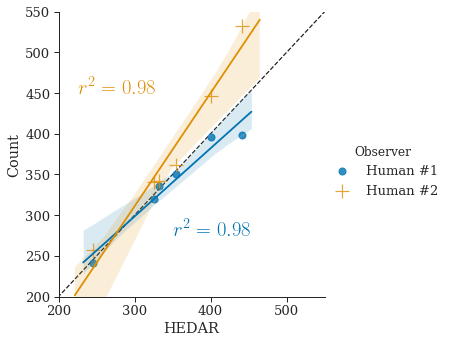
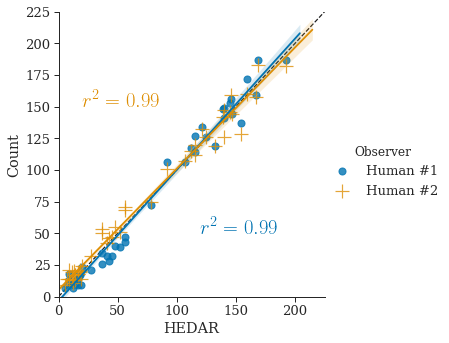
By comparing the counting results of our automated algorithm to the counts by two human observers (see Section 3.4 for details of datasets), we can show the accuracy of our HEDAR algorithm (Figure˜2(d) and Figure˜2(e)). The sample Pearson’s correlation coefficient ( value) gives a measure of the correlation between the results of our automated HEDAR algorithm and human observers — an value closer to represents better correlation, i.e. agreement. For the BBBC001 datatset, the value between the two human observers is . With values of (with human observer #1) and (with human observer #2) we clearly show that our HEDAR algorithm has excellent performance for counting nuclei in fluorescent microscopy on dataset BBBC001. Likewise, for the BBBC002 dataset we achieve values of and (with human observer #1 and #2, respectively); the value between the two human observers is .
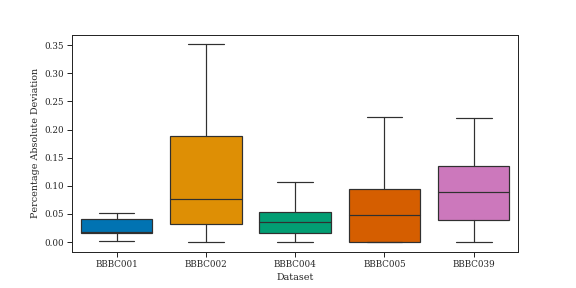
This can be further compared using the mean percentage absolute deviation from the human mean, as reported by other papers (Figure˜2(b) and Figure˜2(c)). We note that, as seen in Figure˜1, the distribution of percentage absolute deviation is often skewed; as such, when comparing to full results from comparison methods we report the median and not the mean, which can be affected by outliers.
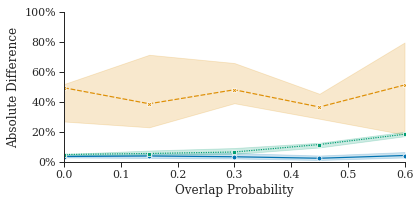
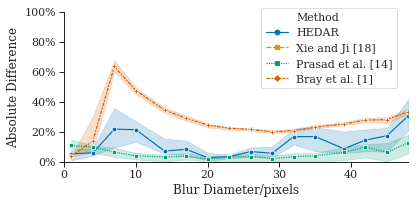
For completeness, we compared the count accuracy of our HEDAR algorithm against all the Broad Bioimage Benchmark Collections datasets with 2D fluorescence microscopy images on fluorescently labelled nuclei (see Section 3.4 for details of datasets). These datasets also enable the exploration of how our HEDAR algorithm is able to cope with overlapping nuclei (Figure˜3(a)), increasing blur (Figure˜3(b)) and relative focus (Figure˜3(b)). Our Hilbert Edge Detection and Ranging algorithm consistently enables accurate counting of nuclei in fluorescence microscopy images under these challenging conditions. Figure˜3 shows the median percentage absolute difference compared to ground truth (BBBC004 and BBBC005; see Section 3.4).
3.2 HEDAR is Able to Accurately Extract Ellipse Parameters from Detected Ellipses
To investigate the accuracy of ellipse parameters using our HEDAR algorithm we have emulated the synthetic experiments first shown in [4]. We ran our method and two ellipse detection algorithms on synthetic images of a single ellipse without noise. First, we compare to a well-cited, efficient, randomised elliptical Hough transform[16]. Second, we compare to a more recent but established non-iterative, geometric method for ellipse fitting: Ellifit[14]. Note that these algorithms are not optimised specifically for nuclei but have been shown to accurately extract nuclei in a variety of real world images; comparing to these methods in synthetic data sets a high standard for comparing our HEDAR algorithm.
Figure˜4(b) shows how robust these methods are to size and eccentricity Figure˜4(a) as well as orientation (Figure˜4(b)). In these plots each ‘pixel’ intensity value corresponds to the Jaccard similarity index [6] between the input image and the result of a given algorithm. Hence, a yellow pixel (with a value closer to ) indicates that the given method was able to correctly identify the ellipse, i.e. accurately extract ellipse parameters. A deep blue pixel (with a value of ) indicates that no ellipse was detected or that more than one ellipse was detected, under which situations a Jaccard similarity of zero is assigned. Any pixel between these two extremes can be considered to have found an ellipse with more (yellow) or less (blue) accurate parameters. Note that the Jaccard similarity index was chosen as it satisfies the triangle inequality..
0.0 0.5 1.0
Jaccard Similarity Index
In Figure˜4(a) each pixel represents the minimum Jaccard similarity for all ellipses of a given major axis length and axis ratio (minor axis over major axis; ) over all rotations. Although HEDAR does get as consistently high a Jaccard similarity index as the Ellifit algorithm, HEDAR covers a much greater range of major axis and axis ratios, more like the range covered by the elliptical Hough transform. These results shows that HEDAR is able to accurately extract ellipse parameters over a wide range of ellipse sizes and axes ratios (c.f. eccentricity).
In Figure˜4(b) each pixel represents the minimum Jaccard similarity for ellipses of a given orientation () and axis ratio for pixels. HEDAR shows consistently higher Jaccard similarity indices over small axes ratios (i.e.high eccentricity) when compared to both the Ellifit and elliptical Hough algorithms.
3.3 HEDAR is Able to Accurately Count Ellipses
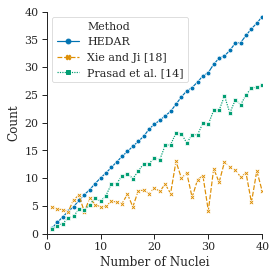
Not only is the overall accuracy of any method important for its application but so too is the method’s ability to deal with many objects. Figure˜5 shows how HEDAR is able to correctly detect the number of ellipses in an image. We ran HEDAR on a set of synthetic images with a known number of small ellipses. Each trial image was of of size and contained small ellipses of varied size, position and orientation. The plot shows how, as the number of ellipses increases, both the elliptical Hough transform and Ellifit struggle to correctly count the number of objects, whilst HEDAR is able to maintain a correct count for most values of .
3.4 Details of Benchmarking Data
We have tested our new ellipse detection algorithm, Hilbert Edge Detection and Ranging, on five image datasets of fluorescent nuclei, all freely available from the Broad Bioimage Benchmark Collection [11]. Full details of the datasets can be retrieved online but are summarised in section˜3.4. All datasets are two dimensional.
Optimal parameters for HEDAR were manually determined using a single image from each subset of data, e.g. each z-focus in BBBC004, and those parameters were used to analyse each subset. Parameters are also shown in section˜3.4.
BBBC datasets used to evaluate HEDAR and compare to existing algorithms. Table indicates the number of images used from the dataset, whether the dataset was synthetic data (as opposed to real data) and whether the ground truth provide is a count of nuclei or a labelled, segmented image. Indicative HEDAR parameters ( and ) are also provided. Accession Citation Number Synthetic Truth Count Labels BBBC001v1 [3] 6 Human ✓ 20 0.25 BBBC002v1 [3] 50 Human ✓ 45 0.5 BBBC004v1 [15] 100 ✓ Known ✓ ✓ 40 0.2 BBBC005v1 [11, 1] 3201 ✓ Known ✓ ✓ 30 0.6 BBBC039v1 [2] 50 Human ✓2 ✓
| 1 | Although the whole dataset includes images of nuclei, only 20 randomly selected images per blur were used. |
|---|---|
| 2 | Nuclei count has been extracted from labelled ground truth. |
4 Conclusions
These results show that Hilbert Edge Detection and Ranging is a competitive approach for nuclei counting and detection. HEDAR performs at the same or better level of error than commonly used solutions and recent state-of-the-art solutions and gives results that agree with ground truth data with a high level of accuracy.
In this paper we have highlighted both the benefits of this method and those scenarios where this method may falter. We believe this information to be essential before users should use this method on their own data. We expect that further development of this method, such as optimisation for larger nuclei and adaptations to the Hilbert-edge ranging stages, will further improve the performance and the applicability of this technique.
5 Acknowledgements
During this work, CJN was supported by an EPSRC (UK) Doctoral Scholarship (EP/K502832/1). PTGJ is supported by an EPSRC (UK) Doctoral Scholarship (EP/M507854/1). The work in this paper was supported by an academic grant from The Royal Society (UK; RF080232).
References
- [1] Bray, M.A., Fraser, A.N., Hasaka, T.P., Carpenter, A.E.: Workflow and Metrics for Image Quality Control in Large-Scale High-Content Screens. Journal of Biomolecular Screening 17(2), 266–274 (2012)
- [2] Caicedo, J.C., Roth, J., Goodman, A., Becker, T., Karhohs, K.W., McQuin, C., Singh, S., Theis, F., Carpenter, A.E.: Evaluation of Deep Learning Strategies for Nucleus Segmentation in Fluorescence Images. bioRxiv (2018)
- [3] Carpenter, A.E., Jones, T.R., Lamprecht, M.R., Clarke, C., Kang, I.H., Friman, O., Guertin, D.A., Chang, J.H., Lindquist, R.A., Moffat, J., Golland, P., Sabatini, D.M.: CellProfiler: image analysis software for identifying and quantifying cell phenotypes. Genome Biology 7(10), 1–11 (2006)
- [4] Fornaciari, M., Prati, A., Cucchiara, R.: A fast and effective ellipse detector for embedded vision applications 47(11), 3693 – 3708 (2014)
- [5] Gurcan, M.N., Pan, T., Shimada, H., Saltz, J.: Image Analysis for Neuroblastoma Classification: Segmentation of Cell Nuclei. In: International Conference of the IEEE Engineering in Medicine and Biology Society. pp. 4844–4847 (2006)
- [6] Jaccard, P.: The Distribution of Flora in the Alpine Zone. New Phytologist 11(2), 37–50 (1912)
- [7] Jackson, P.T.G., Obara, B.: Avoiding Over-Detection: Towards Combined Object Detection and Counting. In: Artificial Intelligence and Soft Computing. pp. 75–85. Springer International Publishing (2017)
- [8] Jung, C., Kim, C.: Segmenting Clustered Nuclei Using H-minima Transform-Based Marker Extraction and Contour Parameterization. IEEE Transactions on Biomedical Engineering 57(10), 2600–2604 (2010)
- [9] Kong, J., Wang, F., Teodoro, G., Liang, Y., Zhu, Y., Tucker-Burden, C., Brat, D.J.: Automated cell segmentation with 3D fluorescence microscopy images. In: IEEE International Symposium on Biomedical Imaging. pp. 1212–1215 (2015)
- [10] Li, G., Liu, T., Tarokh, A., Nie, J., Guo, L., Mara, A., Holley, S., Wong, S.T.C.: 3D cell nuclei segmentation based on gradient flow tracking. BMC Cell Biology 8(1), 1–10 (2007)
- [11] Ljosa, V., Sokolnicki, K.L., Carpenter, A.E.: Annotated high-throughput microscopy image sets for validation. Nature Methods 9(7), 637–637 (2012)
- [12] Nandy, K., Chellappa, R., Kumar, A., Lockett, S.J.: Segmentation of Nuclei From 3D Microscopy Images of Tissue via Graphcut Optimization. IEEE Journal of Selected Topics in Signal Processing 10(1), 140–150 (2016)
- [13] Prasad, D.K., Leung, M.K.H., Quek, C.: ElliFit: An unconstrained, non-iterative, least squares based geometric Ellipse Fitting method. Pattern Recognition 46(5), 1449–1465 (2013)
- [14] Prasad, D.K., Leung, M.K., Cho, S.Y.: Edge curvature and convexity based ellipse detection method 45(9), 3204 – 3221 (2012)
- [15] Ruusuvuori, P., Lehmussola, A., Selinummi, J., Rajala, T., Huttunen, H., Yli-Harja, O.: Benchmark set of synthetic images for validating cell image analysis algorithms. In: European Signal Processing Conference. pp. 1–5 (2008)
- [16] Xie, Y., Ji, Q.: A new efficient ellipse detection method. In: Proceedings of the 16th International Conference on Pattern Recognition. vol. 2, pp. 957 – 960 (2002)
- [17] Xu, H., Lu, C., Berendt, R., Jha, N., Mandal, M.: Automatic Nuclei Detection based on Generalized Laplacian of Gaussian Filters. IEEE Journal of Biomedical and Health Informatics PP(99), 1–12 (2016)
- [18] Xu, H., Lu, C., Mandal, M.: An Efficient Technique for Nuclei Segmentation Based on Ellipse Descriptor Analysis and Improved Seed Detection Algorithm. IEEE Journal of Biomedical and Health Informatics 18(5), 1729–1741 (2014)