Core-Level X-Ray Spectroscopy of Infinite-Layer Nickelate: LDA+DMFT Study
Abstract
Motivated by recent core-level x-ray photoemission spectroscopy, x-ray absorption spectroscopy (XAS), and resonant inelastic x-ray scattering (RIXS) experiments for the newly discovered superconducting infinite-layer nickelate, we investigate the core-level spectra of the parent compounds NdNiO2 and LaNiO2 using the combination of local density approximation and dynamical mean-field theory (LDA+DMFT). Adjusting a charge-transfer energy to match the experimental spectra, we determine the optimal model parameters and discuss the nature of the NdNiO2 ground state. We find that self-doping from the Nd 5 states in the vicinity of the Fermi energy prohibits opening of a Mott-Hubbard gap in NdNiO2. The present Ni XAS and RIXS calculation for LaNiO2 cannot explain the difference from NdNiO2 spectra.
I Introduction
High- superconductivity of cuprates has been a focal point of 3 transition-metal oxide (TMO) physics over the past 30 years Bednorz and Müller (1986); Imada et al. (1998); Dagotto (1994); nevertheless, the underlying mechanism remains elusive. Superconductivity Li et al. (2019) reported recently in layered nickelate Nd0.8Sr0.2NiO2 ( = 9–15 K) with a similar crystal structure may provide new clues. The fundamental question is whether the electronic structure of NdNiO2 (and LaNiO2) is similar to that of high- cuprates. Naively, one might presume that Ni in the undoped systems is monovalent and, thus, hosts the () ground state similar to cuprates. However, theoretical studies Botana and Norman (2020); Krishna et al. (2020); Lee and Pickett (2004); Zhang et al. (2020); Hepting et al. (2020) suggest a self-doping from Nd (or La) 5 orbitals. Additionally, holes doped to a low-valence Ni1+ compound may reside in Ni 3 orbitals, unlike in cuprates Zaanen et al. (1985); Imada et al. (1998); Dagotto (1994) or NiO with Ni2+ Kuneš et al. (2007a), where they occupy the O 2 states.
The Ni 2 core-level x-ray photoemission spectroscopy (XPS) Fu et al. (2019), x-ray absorption spectroscopy (XAS), and resonant inelastic x-ray scattering (RIXS) Hepting et al. (2020); Rossi et al. (2020) are employed to probe the electronic structure of infinite-layer nickelates. A shoulder observed in the main line of the Ni 2 XPS spectra in NdNiO2 Fu et al. (2019) is attributed to Ni-Ni charge-transfer (CT) response to the creation of the core hole, a process traditionally called nonlocal screening (NLS) van Veenendaal and Sawatzky (1993). Generally, NLS provides valuable information about the electronic structure of TMOs van Veenendaal (2006); Hariki et al. (2017); Taguchi and Panaccione (2016); Taguchi et al. (2008). For high- cuprates, the NLS in Cu 2 XPS is extensively used to determine key parameters, such as the CT energy , and more recently to analyze electronic reconstructions due to doping Taguchi et al. (2005a); Horio et al. (2018); Okada and Kotani (1995); van Veenendaal et al. (1994); Taguchi et al. (2005b).
Further information can be obtained with charge-conserving spectroscopies XAS and RIXS. The Ni -edge XAS and RIXS spectra are measured in both NdNiO2 Hepting et al. (2020); Rossi et al. (2020) and LaNiO2 Hepting et al. (2020). Interestingly, a side peak (852.0 eV) is observed in -XAS of LaNiO2, while it is absent in NdNiO2. A low-energy RIXS feature (=0.6 eV) associated with the XAS side peak is observed in LaNiO2. The difference between the Ni XAS and RIXS spectra of NdNiO2 and LaNiO2 poses an open question.
In this paper, we use the local-density approximation (LDA) + dynamical mean-field theory (DMFT) Metzner and Vollhardt (1989); Georges et al. (1996); Kotliar et al. (2006) to calculate XPS, XAS, and RIXS spectra Hariki et al. (2017, 2018, 2020); Ghiasi et al. (2019); Hariki et al. (2020); Kolorenč (2018) of undoped infinite-layer nickelates. By comparison with the available experimental data, we identify the most appropriate CT energy and use it for classification within the Zaanen-Sawatzky-Allen scheme Zaanen et al. (1985).
Material-specific DMFT calculations for NdNiO2 or LaNiO2 were performed by several authors, leading to contradictory conclusions, which can be sorted into two groups: (i) Multiorbital (Hund’s metal) physics is crucial Wang et al. (2020); Kang and Kotliar (2021); Petocchi et al. (2020); Lechermann (2020), and (ii) (single-orbital) Mott-Hubbard physics is relevant with little influence of charge-transfer effects or with a small self-doping by Nd 5 electrons Karp et al. (2020a); Kitatani et al. (2020); Karp et al. (2020b). The differences, recently addressed blueby Karp, Hampel, and Millis Karp et al. (2021), can be traced to the model parameters, which are not uniquely defined, such as the interaction strength, orbital basis, and, in particular, the double-counting correction. To settle the debate, an experimental input is needed to provide a benchmark for selecting the model parameters.
II Computational Method
The XPS, XAS and RIXS simulations start with a standard LDA+DMFT calculation Georges et al. (1996); Kotliar et al. (2006); Kuneš et al. (2009); Hariki et al. (2017, 2018, 2020). First, LDA bands for the experimental crystal structure of NdNiO2 and LaNiO2 Hayward et al. (1999); Li et al. (2019) are calculated using the Wien2K package Blaha et al. 111The Nd 4 states in NdNiO2 are treated as partially-filled core states. and projected onto Wannier basis spanning the Ni 3, O 2, and Nd (La) 5 orbitals Kuneš et al. (2010); Mostofi et al. (2014). The model is augmented with a local electron-electron interaction within the Ni shell, parametrized by Coulomb’s =5.0 eV and Hund’s =1.0 eV Kang and Kotliar (2021); Wang et al. (2020); Ryee et al. (2020). The strong-coupling continuous-time quantum Monte Carlo impurity solver Werner et al. (2006); Boehnke et al. (2011); Hafermann et al. (2012); Hariki et al. (2015) is employed with the DMFT cycle to obtain the Ni self-energy , which is analytically continued Jarrell and Gubernatis (1996) to real frequency after having reached the self-consistency . The calculations are performed at temperature K.
The XPS, XAS, and RIXS spectra are calculated from the Anderson impurity model augmented with the 2 core states and the real-frequency hybridization function discretized into 40–50 levels (per spin and orbital). To this end, we use the configuration-interaction solver; for details, see Refs. Hariki et al., 2017; Ghiasi et al., 2019 for XPS and Refs. Hariki et al., 2018, 2020; Winder et al., 2020 for XAS and RIXS simulation.
Determination of Ni site energies in the model studied by DMFT involves subtracting the so-called double-counting correction from the respective LDA values (), a procedure accounting for the effect of the interaction present in the LDA description. It is clear that is of the order of Hartree energy , but a generally accepted universal expression is not available Kotliar et al. (2006); Karolak et al. (2010); Haule (2015). While a similar uncertainty exists also for interaction parameters and , impact of their variation on physical properties is usually minor (see Supplemental Material SM for NdNiO2-specific discussion). Variation of , on the other hand, may have a profound effect. Therefore we choose to adjust by comparison to the experimental data. Although is the parameter entering the calculation, in the discussion we use its linear function , which sets the scale for the energy necessary to transfer an electron from O to Ni orbital. Here, is the average interorbital interaction, and 9 is the Ni occupation in the Ni+ formal valence (similar to the definition of the charge-transfer energy in the cluster model de Groot and Kotani (2014); Ghiasi et al. (2019); Hariki et al. (2020)).
III Electronic structure
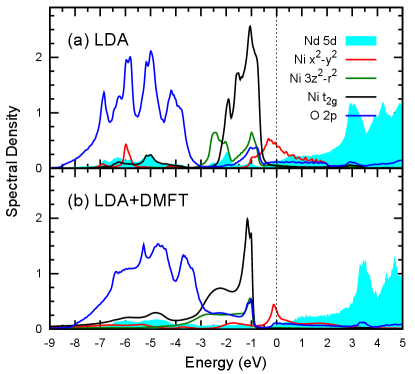
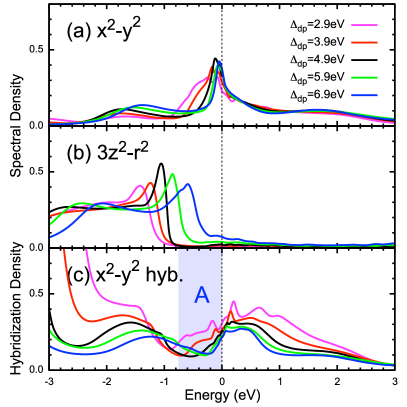
Figure. 1 shows the orbitally resolved spectral densities (projected density of states) of NdNiO2 obtained by LDA and LDA+DMFT for eV, which we later identify as the optimal parameter choice. Both the LDA and LDA+DMFT yield a metallic state with the Ni orbital character dominating around the Fermi level. This general picture is valid in the entire range of studied – eV. In Fig. 2, we show the dependence of Ni and spectra on . Increasing corresponds to an upward shift of the bare Ni site energies, which is indirectly reflected in the shift of the band. The peak at the Fermi level, rather than being shifted, exhibits an increased mass renormalization (reduced width). The amplitude of the hybridization function around the Fermi level is reduced with increasing ; in particular, the sizable decrease just below the Fermi level (blue region) has an important implication for the XPS spectra as discussed later. The evolution of and occupancies in Fig. 4 shows that, up to eV the is completely filled (the deviation from 2.0 is due to hybridization with empty bands). The physics is , thus, effectively of a single-orbital Hubbard model, and the Ni ion takes a monovalent (Ni) character.
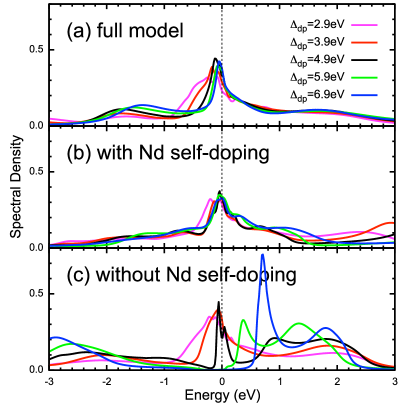
Different from cuprates, the stoichiometric parent compound is metallic. In order to analyze the role of Nd bands, we study two modified models: (i) hybridization between NiO2 planes and the Nd orbitals is switched off, and (ii) Nd orbitals are removed from the model. In the former case (i) self-doping of the NiO2 planes from Nd orbitals is possible, while in the latter case (ii) the stoichiometry of the NiO2 planes cannot change. The evolution of the spectral density with for (i) and (ii) is shown in Fig. 3. Like the full model, the low-energy spectrum of model (i) remains metallic over the whole studied range of . Removing the Nd orbitals (ii) results in progressive mass renormalization with increasing and eventually opening of a gap above eV. This can be understood as a result of effective weakening of the Ni-O hybridization, i.e., a bandwidth-driven Mott transition. The NiO2 layers in NdNiO2 can, thus, be viewed as a strongly correlated system in the vicinity of Mott transition, where the insulating state is precluded by the presence of Nd bands Hirayama et al. (2020).
IV Comparison to experimental x-ray spectroscopies
A Ni XPS
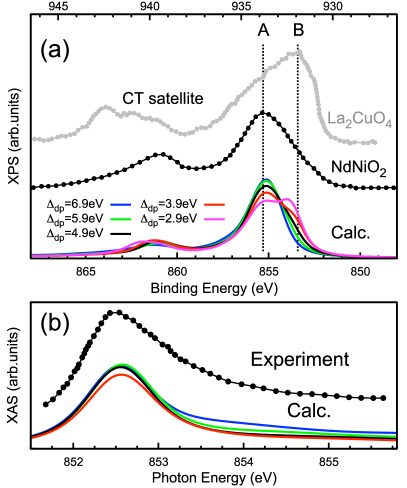
Next, we investigate the impact of the variation of on the core-level spectra. Figure 5 shows the calculated Ni XPS spectra of NdNiO2 together with the experimental data Fu et al. (2019). The Ni 2 XPS spectrum consists of two components: the main-line (852–857 eV) and the CT satellite (861 eV) Hariki et al. (2017); de Groot and Kotani (2014). The core hole created by x rays represents an attractive potential, which induces CT from surrounding atoms to the empty 3 orbital on the excited Ni site. The main line corresponds to the CT screened final states, while the CT satellite corresponds to unscreened ones van Veenendaal and Sawatzky (1993); Taguchi et al. (2005b); Hariki et al. (2017). Fu . Fu et al. (2019) observe a shoulder (approximately eV) in the main line. Unlike , the peak is absent in the cluster-model spectra Ghiasi et al. (2019); van Veenendaal and Sawatzky (1993) and, thus, can be ascribed to NLS Fu et al. (2019). The sensitivity of the relative intensity of and to can be used to locate its value to the interval – eV. The observed behavior of the NLS feature reflects the amplitude of the hybridization function just below the Fermi level Hariki et al. (2017), the shaded area in Fig. 2(c).
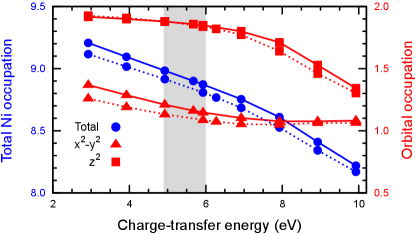
The NLS () is known to dominate over the local screening () in cuprates, as shown in Fig. 5 for Cu 2 XPS in La2CuO4 Taguchi et al. (2005a). For small eV, a typical value for high- cuprates Taguchi et al. (2005b); Zaanen et al. (1985); Taguchi et al. (2005a); van Veenendaal and Sawatzky (1993); Ghijsen et al. (1988), the spectra of NdNiO2 resemble that of La2CuO4. Thus our analysis shows that in NdNiO2 is by 2–3 eV larger than in cuprates. The relative size and the Hubbard would place NdNiO2 somewhere between the Mott-Hubbard () and CT () systems in the Zaanen-Sawatzky-Allen classification of TMOs Zaanen et al. (1985); Nomura et al. (2020, 2019); Karp et al. (2020b). The calculated occupations for doped Nd0.775Sr0.225NiO2, shown in Fig. 4 and in Supplementary Material SM , reveal that for optimal doped holes are almost equally shared by Ni, Nd and O sites. This is a remarkable difference to monovalent cuprates or divalent NiO. In these systems of strong charge-transfer character, the doped holes reside predominantly in O orbitals, irrespective of a substantial spectral weight just below the Fermi level Kuneš et al. (2007b). Moreover, for the optimal values inferred above, the doped holes in NdNiO2 do not enter the Ni orbitals (Fig. 4). The single-band Hubbard description is thus valid for not only the parent NdNiO2 but also the superconducting one Nd0.8Sr0.2NiO2, as suggested by Refs. Karp et al. (2020a); Kitatani et al. (2020); Karp et al. (2020b).
Proximity to NiO2 layers to a Mott state (precluded by self-doping from Nd) suggests that a superexchange interaction still plays a role despite the metallic state. Using the optimal we arrive SM at the nearest Ni–Ni anti-ferromagnetic exchange in the range 40–60 meV. Given the oversimplification of representing spin response of a metal in terms of local moments interactions, this value is consistent with 69 meV inferred from the RIXS experiment on a related compound La4Ni3O8 Lin et al. (2021)
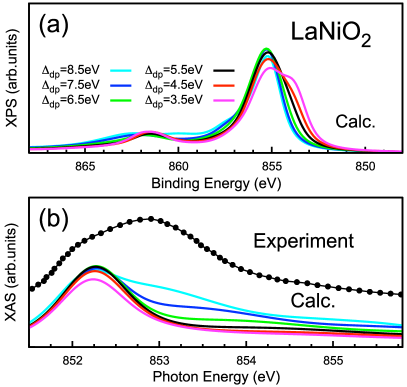
The calculated LaNiO2 spectra in Fig. 6(a) show similar behavior to NdNiO2.
B Ni XAS and RIXS
As expected for Ni1+ systems with a configuration, the experimental Ni XAS of NdNiO2 shows a sharp peak corresponding to the electron excitation from the 2 to an empty orbital [Fig. 5(b)]. The XAS main peak is accompanied by a broad tail attributed to the hybridization with metallic bands. The theoretical results in Fig. 5(b) reproduce the experimental data reasonably well; however, the weak dependence on does not allow to draw conclusions about its value.
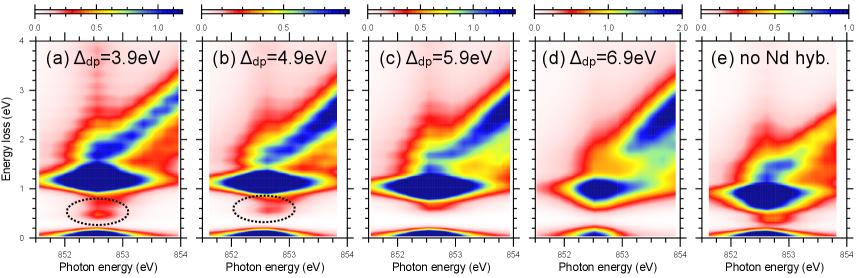
The RIXS spectra, on the other hand, exhibit fine changes with the values, see Fig. 7. The spectra at all values contain a strong Raman-like (RL) feature (at constant irrespective of the incident photon energies ) at 1 eV and a fluorescence-like (FL) feature ( linearly increases with ). The RL feature arises from excitation, and its width (in ) reflects a rapid decay of this local ”exciton”. With increasing , the RL feature shifts to lower energies, due upward shift to the bands similar to shown in Fig. 2(b), while the peaks remain pinned in the vicinity of the Fermi level. The main variation of the RIXS spectra with increasing concerns the behavior of the FL part, the onset of which is pushed to higher . For =4.9 eV, deduced from the XPS data, the FL feature sets in below the RL feature at around 0.6 eV. The coexisting RL and FL features above well capture the experimental data by Hepting . Hepting et al. (2020) and Rossi . Rossi et al. (2020). Artificial suppression of hybridization to Nd states [Fig. 7(e)] leads to a reduced intensity of the FL feature and only a moderate modification of the low-energy spectra supporting the conclusion about the electron-reservoir role of Nd states.
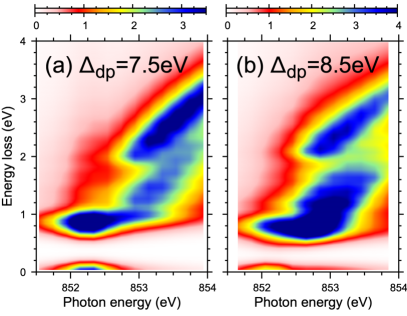
Finally we discuss XAS and RIXS spectra in LaNiO2 (the experimental XPS data are not available at the moment). The experimental XAS spectra of LaNiO2 Hepting et al. (2020) are clearly distinct from NdNiO2. A side peak at 852.0 eV is attributed to Ni–La hybridization effect by Hepting Hepting et al. (2020) based on a simplified impurity model simulation. The LDA+DMFT calculations (including Ni–La hybridization) do not support this conclusion as they do not match the experimental XAS spectra. While large gives rise to a high-energy XAS shoulder (Fig. 6), it does not improve the agreement of the RIXS spectra, shown in Fig. 8. We have to conclude that the present LDA+DMFT description of LaNiO2 does not match the experiment for any choice of .
We propose that the problem lies on the experimental side; i.e., the measured spectra do not represent a perfect LaNiO2 crystal. We argue by the success of the present method for a broad spectrum of transition-metal oxides Hariki et al. (2017) including NdNiO2 as well as the absence of an obvious source of difference between NdNiO2 and LaNiO2. On the experimental side, we point out recent studies Zeng et al. (2021); Osada et al. (2021) reporting superconductivity in Sr-doped LaNiO2, suggesting that NdNiO2 and LaNiO2 are not that different after all. Spectroscopic experiments on these new LaNiO2 samples are needed to resolve the present discrepancy.
V Conclusions
We have presented a comprehensive analysis of Ni 2 core-level XPS, XAS, and RIXS in infinite-layer nickelates (NdNiO2 and LaNiO2) with the LDA+DMFT approach. Comparison to the experimental spectra allowed us to determine the CT parameter (double-counting correction) and make the following conclusions about the electronic structure. Undoped NdNiO2 is nearly monovalent (Ni) with a small self-doping from the Nd 5 band. Only the Ni orbitals are partially filled and multiorbital physics does not play an important role for the stoichiometric as well as slightly hole-doped compound. Unlike in cuprates, the Ni-O hybridization does not play an important role in connection with doping – doped holes reside predominantly on the Ni sites. The physics of NdNiO2 described effectively by a single-band Hubbard model Karp et al. (2020a); Kitatani et al. (2020); Karp et al. (2020b) is consistent with the available core-level spectroscopies. While the present calculations provide a good description of the experimental core-level spectra of NdNiO2, we cannot explain the qualitative difference between the reported NdNiO2 and LaNiO2 XAS and RIXS spectra.
Acknowledgements.
We thank M. Kitatani, K. Yamagami, T. Uozumi, H. Ikeno, L. Si, M.-J. Huang and R.-P. Wang for valued discussions. A.H., M.W., and J.K. were supported by the European Research Council (ERC) under the European Union’s Horizon 2020 research and innovation program (Grant Agreement No. 646807-EXMAG). A.H. was supported by JSPS KAKENHI Grant No. 21K13884. The numerical calculations were performed at the Vienna Scientific Cluster (VSC).References
- Bednorz and Müller (1986) J. G. Bednorz and K. A. Müller, Z. Phys., B Condens. matter 64, 189 (1986).
- Imada et al. (1998) M. Imada, A. Fujimori, and Y. Tokura, Rev. Mod. Phys. 70, 1039 (1998).
- Dagotto (1994) E. Dagotto, Rev. Mod. Phys. 66, 763 (1994).
- Li et al. (2019) D. Li, K. Lee, B. Y. Wang, M. Osada, S. Crossley, H. R. Lee, Y. Cui, Y. Hikita, and H. Y. Hwang, Nature 572, 624 (2019).
- Botana and Norman (2020) A. S. Botana and M. R. Norman, Phys. Rev. X 10, 011024 (2020).
- Krishna et al. (2020) J. Krishna, H. LaBollita, A. O. Fumega, V. Pardo, and A. S. Botana, Phys. Rev. B 102, 224506 (2020).
- Lee and Pickett (2004) K.-W. Lee and W. E. Pickett, Phys. Rev. B 70, 165109 (2004).
- Zhang et al. (2020) G.-M. Zhang, Y.-f. Yang, and F.-C. Zhang, Phys. Rev. B 101, 020501 (2020).
- Hepting et al. (2020) M. Hepting, D. Li, C. J. Jia, H. Lu, E. Paris, Y. Tseng, X. Feng, M. Osada, E. Been, Y. Hikita, Y.-D. Chuang, Z. Hussain, K. J. Zhou, A. Nag, M. Garcia-Fernandez, M. Rossi, H. Y. Huang, D. J. Huang, Z. X. Shen, T. Schmitt, H. Y. Hwang, B. Moritz, J. Zaanen, T. P. Devereaux, and W. S. Lee, Nat. Mater. 19, 381 (2020).
- Zaanen et al. (1985) J. Zaanen, G. A. Sawatzky, and J. W. Allen, Phys. Rev. Lett. 55, 418 (1985).
- Kuneš et al. (2007a) J. Kuneš, V. I. Anisimov, S. L. Skornyakov, A. V. Lukoyanov, and D. Vollhardt, Phys. Rev. Lett. 99, 156404 (2007a).
- Fu et al. (2019) Y. Fu, L. Wang, H. Cheng, S. Pei, X. Zhou, J. Chen, S. Wang, R. Zhao, W. Jiang, C. Liu, M. Huang, X. Wang, Y. Zhao, D. Yu, F. Ye, S. Wang, and J.-W. Mei, (2019), arXiv:1911.03177 .
- Rossi et al. (2020) M. Rossi, H. Lu, A. Nag, D. Li, M. Osada, K. Lee, B. Y. Wang, S. Agrestini, M. Garcia-Fernand ez, Y. D. Chuang, Z. X. Shen, H. Y. Hwang, B. Moritz, K.-J. Zhou, T. P. Devereaux, and W. S. Lee, (2020), arXiv:2011.00595 .
- van Veenendaal and Sawatzky (1993) M. A. van Veenendaal and G. A. Sawatzky, Phys. Rev. Lett. 70, 2459 (1993).
- van Veenendaal (2006) M. van Veenendaal, Phys. Rev. B 74, 085118 (2006).
- Hariki et al. (2017) A. Hariki, T. Uozumi, and J. Kuneš, Phys. Rev. B 96, 045111 (2017).
- Taguchi and Panaccione (2016) M. Taguchi and G. Panaccione, “Depth-dependence of electron screening, charge carriers and correlation: Theory and experiments,” in Hard X-ray Photoelectron Spectroscopy (HAXPES), edited by J. C. Woicik (Springer International Publishing, Cham, 2016) pp. 197–216.
- Taguchi et al. (2008) M. Taguchi, M. Matsunami, Y. Ishida, R. Eguchi, A. Chainani, Y. Takata, M. Yabashi, K. Tamasaku, Y. Nishino, T. Ishikawa, Y. Senba, H. Ohashi, and S. Shin, Phys. Rev. Lett. 100, 206401 (2008).
- Taguchi et al. (2005a) M. Taguchi, A. Chainani, K. Horiba, Y. Takata, M. Yabashi, K. Tamasaku, Y. Nishino, D. Miwa, T. Ishikawa, T. Takeuchi, K. Yamamoto, M. Matsunami, S. Shin, T. Yokoya, E. Ikenaga, K. Kobayashi, T. Mochiku, K. Hirata, J. Hori, K. Ishii, F. Nakamura, and T. Suzuki, Phys. Rev. Lett. 95, 177002 (2005a).
- Horio et al. (2018) M. Horio, Y. Krockenberger, K. Yamamoto, Y. Yokoyama, K. Takubo, Y. Hirata, S. Sakamoto, K. Koshiishi, A. Yasui, E. Ikenaga, S. Shin, H. Yamamoto, H. Wadati, and A. Fujimori, Phys. Rev. Lett. 120, 257001 (2018).
- Okada and Kotani (1995) K. Okada and A. Kotani, Phys. Rev. B 52, 4794 (1995).
- van Veenendaal et al. (1994) M. A. van Veenendaal, G. A. Sawatzky, and W. A. Groen, Phys. Rev. B 49, 1407 (1994).
- Taguchi et al. (2005b) M. Taguchi, A. Chainani, N. Kamakura, K. Horiba, Y. Takata, M. Yabashi, K. Tamasaku, Y. Nishino, D. Miwa, T. Ishikawa, S. Shin, E. Ikenaga, T. Yokoya, K. Kobayashi, T. Mochiku, K. Hirata, and K. Motoya, Phys. Rev. B 71, 155102 (2005b).
- Metzner and Vollhardt (1989) W. Metzner and D. Vollhardt, Phys. Rev. Lett. 62, 324 (1989).
- Georges et al. (1996) A. Georges, G. Kotliar, W. Krauth, and M. J. Rozenberg, Rev. Mod. Phys. 68, 13 (1996).
- Kotliar et al. (2006) G. Kotliar, S. Y. Savrasov, K. Haule, V. S. Oudovenko, O. Parcollet, and C. A. Marianetti, Rev. Mod. Phys. 78, 865 (2006).
- Hariki et al. (2018) A. Hariki, M. Winder, and J. Kuneš, Phys. Rev. Lett. 121, 126403 (2018).
- Hariki et al. (2020) A. Hariki, M. Winder, T. Uozumi, and J. Kuneš, Phys. Rev. B 101, 115130 (2020).
- Ghiasi et al. (2019) M. Ghiasi, A. Hariki, M. Winder, J. Kuneš, A. Regoutz, T.-L. Lee, Y. Hu, J.-P. Rueff, and F. M. F. de Groot, Phys. Rev. B 100, 075146 (2019).
- Kolorenč (2018) J. Kolorenč, Physica B Condens. Matter. 536, 695 (2018).
- Wang et al. (2020) Y. Wang, C.-J. Kang, H. Miao, and G. Kotliar, Phys. Rev. B 102, 161118 (2020).
- Kang and Kotliar (2021) C.-J. Kang and G. Kotliar, Phys. Rev. Lett. 126, 127401 (2021).
- Petocchi et al. (2020) F. Petocchi, V. Christiansson, F. Nilsson, F. Aryasetiawan, and P. Werner, Phys. Rev. X 10, 041047 (2020).
- Lechermann (2020) F. Lechermann, Phys. Rev. X 10, 041002 (2020).
- Karp et al. (2020a) J. Karp, A. S. Botana, M. R. Norman, H. Park, M. Zingl, and A. Millis, Phys. Rev. X 10, 021061 (2020a).
- Kitatani et al. (2020) M. Kitatani, L. Si, O. Janson, R. Arita, Z. Zhong, and K. Held, npj Quantum Materials 5, 59 (2020).
- Karp et al. (2020b) J. Karp, A. Hampel, M. Zingl, A. S. Botana, H. Park, M. R. Norman, and A. J. Millis, Phys. Rev. B 102, 245130 (2020b).
- Karp et al. (2021) J. Karp, A. Hampel, and A. J. Millis, (2021), arXiv:2102.08522 .
- Kuneš et al. (2009) J. Kuneš, I. Leonov, M. Kollar, K. Byczuk, V. I. Anisimov, and D. Vollhardt, Eur. Phys. J. Spec. Top. 180, 5 (2009).
- Hayward et al. (1999) M. A. Hayward, M. A. Green, M. J. Rosseinsky, and J. Sloan, Journal of the American Chemical Society 121, 8843 (1999), https://doi.org/10.1021/ja991573i .
- (41) P. Blaha, K. Schwarz, G. Madsen, D. Kvasnicka, and J. Luitz, WIEN2k, An Augmented Plane Wave + Local Orbitals Program for Calculating Crystal Properties (Karlheinz Schwarz, Techn. Universitat Wien, Austria, 2001, ISBN 3-9501031-1-2).
- Note (1) The Nd 4 states in NdNiO2 are treated as partially-filled core states.
- Kuneš et al. (2010) J. Kuneš, R. Arita, P. Wissgott, A. Toschi, H. Ikeda, and K. Held, Comput. Phys. Commun. 181, 1888 (2010).
- Mostofi et al. (2014) A. A. Mostofi, J. R. Yates, G. Pizzi, Y.-S. Lee, I. Souza, D. Vanderbilt, and N. Marzari, Comput. Phys. Commun. 185, 2309 (2014).
- Ryee et al. (2020) S. Ryee, H. Yoon, T. J. Kim, M. Y. Jeong, and M. J. Han, Phys. Rev. B 101, 064513 (2020).
- Werner et al. (2006) P. Werner, A. Comanac, L. de’ Medici, M. Troyer, and A. J. Millis, Phys. Rev. Lett. 97, 076405 (2006).
- Boehnke et al. (2011) L. Boehnke, H. Hafermann, M. Ferrero, F. Lechermann, and O. Parcollet, Phys. Rev. B 84, 075145 (2011).
- Hafermann et al. (2012) H. Hafermann, K. R. Patton, and P. Werner, Phys. Rev. B 85, 205106 (2012).
- Hariki et al. (2015) A. Hariki, A. Yamanaka, and T. Uozumi, J. Phys. Soc. Jpn. 84, 073706 (2015).
- Jarrell and Gubernatis (1996) M. Jarrell and J. Gubernatis, Phys. Rep. 269, 133 (1996).
- Winder et al. (2020) M. Winder, A. Hariki, and J. Kuneš, Phys. Rev. B 102, 085155 (2020).
- Karolak et al. (2010) M. Karolak, G. Ulm, T. Wehling, V. Mazurenko, A. Poteryaev, and A. Lichtenstein, J. Electron. Spectrosc. Relat. Phenom. 181, 11 (2010).
- Haule (2015) K. Haule, Phys. Rev. Lett. 115, 196403 (2015).
- (54) See Supplementary Material for model-parameter dependence of Ni density of states, hybridization intensity, and Ni 2p XPS spectra.
- de Groot and Kotani (2014) F. de Groot and A. Kotani, Core Level Spectroscopy of Solids (CRC Press, Boca Raton, FL, 2014).
- Hirayama et al. (2020) M. Hirayama, T. Tadano, Y. Nomura, and R. Arita, Phys. Rev. B 101, 075107 (2020).
- Ghijsen et al. (1988) J. Ghijsen, L. H. Tjeng, J. van Elp, H. Eskes, J. Westerink, G. A. Sawatzky, and M. T. Czyzyk, Phys. Rev. B 38, 11322 (1988).
- Nomura et al. (2020) Y. Nomura, T. Nomoto, M. Hirayama, and R. Arita, Phys. Rev. Research 2, 043144 (2020).
- Nomura et al. (2019) Y. Nomura, M. Hirayama, T. Tadano, Y. Yoshimoto, K. Nakamura, and R. Arita, Phys. Rev. B 100, 205138 (2019).
- Kuneš et al. (2007b) J. Kuneš, V. I. Anisimov, A. V. Lukoyanov, and D. Vollhardt, Phys. Rev. B 75, 165115 (2007b).
- Lin et al. (2021) J. Q. Lin, P. Villar Arribi, G. Fabbris, A. S. Botana, D. Meyers, H. Miao, Y. Shen, D. G. Mazzone, J. Feng, S. G. Chiuzbăian, A. Nag, A. C. Walters, M. García-Fernández, K.-J. Zhou, J. Pelliciari, I. Jarrige, J. W. Freeland, J. Zhang, J. F. Mitchell, V. Bisogni, X. Liu, M. R. Norman, and M. P. M. Dean, Phys. Rev. Lett. 126, 087001 (2021).
- Zeng et al. (2021) S. W. Zeng, C. J. Li, L. E. Chow, Y. Cao, Z. T. Zhang, C. S. Tang, X. M. Yin, Z. S. Lim, J. X. Hu, P. Yang, and A. Ariando, (2021), arXiv:2105.13492 .
- Osada et al. (2021) M. Osada, B. Y. Wang, B. H. Goodge, S. P. Harvey, K. Lee, D. Li, L. F. Kourkoutis, and H. Y. Hwang, (2021), arXiv:2105.13494 .