Dancing in the Dark: Uncertainty in ultra-faint dwarf galaxy predictions from cosmological simulations
Abstract
The existence of ultra-faint dwarf (UFD) galaxies highlights the need to push our theoretical understanding of galaxies to extremely low mass. We examine the formation of UFDs by twice running a fully cosmological simulations of dwarf galaxies, but varying star formation. One run uses a temperature-density threshold for star formation, while the other uses an H2-based sub-grid star formation model. The total number of dwarf galaxies that forms is different by a factor of 2 between the two runs, but most of these are satellites, leading to a factor of 5 difference in the number of luminous UFD companions around more massive, isolated dwarfs. The first run yields a 47% chance of finding a satellite around a Mhalo M⊙ host, while the H2 run predicts only a 16% chance. Metallicity is the primary physical parameter that creates this difference. As metallicity decreases, the formation of H2 is slowed and relegated to higher-density material. Thus, our H2 run is unable to form many (and often, any) stars before reionization removes gas. These results emphasize that predictions for UFD properties made using hydrodynamic simulations, in particular regarding the frequency of satellites around dwarf galaxies, the slope of the stellar mass function at low masses, as well as the properties of ultra-faint galaxies occupying the smallest halos, are extremely sensitive to the subgrid physics of star formation contained within the simulation. However, upcoming discoveries of ultra-faint dwarfs will provide invaluable constraining power on the physics of the first star formation.
1 Introduction
How do galaxies populate low mass dark matter halos? Is there a lower limit to the halo mass that can form a galaxy? The lowest mass galaxies that we have observed are the ultra-faint dwarf (UFD) galaxies, which are typically defined to have M 105 M⊙. The lowest mass galaxy yet observed contains only a few hundred M⊙ in stars (Homma et al., 2018). To understand these extremely low mass systems, a few authors have simulated the formation of isolated UFD galaxies at high resolution (Read et al., 2016; Jeon et al., 2017; Corlies et al., 2018). Some cosmological simulations of classical dwarf galaxies have been able to resolve the formation of UFD satellite companions Wheeler et al. (2015, 2018); Munshi et al. (2017). In general, fully cosmological simulations of more massive galaxies like the Milky Way have not had sufficient resolution to resolve the formation of UFD companions, preventing direct predictions for UFD abundances and distributions that can be tested with the Large Synoptic Survey Telescope (LSST; Walsh et al., 2009; Tollerud et al., 2008). However, the next generation of cosmological simulations will achieve stellar mass resolutions of 1000 M⊙, allowing simulators to start pushing down into the UFD range. In this paper, we explore whether the prescriptions commonly adopted by simulators to create realistic Milky Way-mass and classical dwarf galaxies can be extrapolated down to UFD scales and the impact of prescription choice on observational predictions made using cosmological simulations.
Cosmological simulations of galaxies run to have recently been quite successful in matching a long list of observed scaling relations (Governato et al., 2010; Brook et al., 2012; Governato et al., 2012; Aumer et al., 2013; Munshi et al., 2013; Vogelsberger et al., 2013; Shen et al., 2014; Brooks & Zolotov, 2014; Hopkins et al., 2014; Wang et al., 2015; Schaye et al., 2015; Sawala et al., 2016; Christensen et al., 2016; Garrison-Kimmel et al., 2018; Santos-Santos et al., 2018; Nelson et al., 2018). This success is despite the fact that different simulators often adopt different physical prescriptions, particularly the prescriptions for star formation and energetic feedback from stars, supernovae, and AGN. It is generally agreed that different simulators can broadly reproduce the same observed trends despite different prescriptions because galaxies “self-regulate,” i.e., a change in the star formation prescription is counter-balanced by subsequent feedback (Saitoh et al., 2008; Hopkins et al., 2011, 2013; Christensen et al., 2014b; Benincasa et al., 2016; Hopkins et al., 2018; Pallottini et al., 2017). Previous studies found that self-regulation can occur as long as the resolution is high enough to capture the average densities in giant molecular clouds (GMCs), and therefore that the simulation is high enough resolution to have star formation limited to the scales of GMCs (Agertz & Kravtsov, 2016; Semenov et al., 2016; Buck et al., 2018).
Semenov et al. (2018) show that self-regulation is limited to the regime of strong feedback, which regulates the gas supply available to turn into stars. Star formation efficiency drops as halo mass decreases, so it is not clear that UFDs lie in the regime of strong feedback, or have the ability to self-regulate. In fact, some simulators have shown that low mass halos can completely shut off their own star formation via feedback (e.g., Fitts et al., 2017; Wright et al., 2018). UFDs are also thought to reside in halos that are susceptible to heating from the UV background, which cuts off gas accretion to the galaxy, removing fuel for star formation (e.g., Brown et al., 2014; Weisz et al., 2014a; Oñorbe et al., 2015; Wheeler et al., 2015). Taken together, these processes suggest that UFDs cannot self-regulate. Thus, the choice of prescriptions for star formation and feedback in cosmological simulations may strongly affect their resulting stellar mass, unlike in more massive galaxies. In this paper we isolate the effect of star formation prescriptions that vary across simulations both in terms of the details of the simulation and the consequences for observational predictions.
One of the key differences in star formation recipes between cosmological galaxy simulations is the threshold mass density at which star formation is allowed to occur. By definition, lower resolution simulations do not have the ability to resolve high density gas peaks. Thus, the density threshold must vary with resolution of the simulation. Star formation density thresholds vary from 1 cm-3, where is the mass of a hydrogen atom in grams, in lower resolution simulations (e.g., APOSTLE, Fattahi et al., 2016) to 10 cm-3 (e.g., NIHAO, Wang et al., 2015) to cm-3 (e.g., Governato et al., 2010; Shen et al., 2014; Hopkins et al., 2014, 2018; Read et al., 2016). A maximum temperature threshold for star formation is also usually applied. Many simulations adopt a temperature cap of 104 K because this is the peak of the cooling curve and gas is expected to rapidly cool to lower temperatures (e.g., see Saitoh et al., 2008).
Beyond this temperature-density model, some simulators also track the presence of molecular hydrogen, H2, requiring that it be present in order to form stars. The H2-based star formation models broadly break down into two categories, equilibrium (Krumholz et al., 2008, 2009; Kuhlen et al., 2012; Hopkins et al., 2014, 2018) or non-equilibrium (Robertson & Kravtsov, 2008; Gnedin et al., 2009a; Gnedin & Kravtsov, 2010, 2011; Christensen et al., 2012). Both models, by requiring the presence of H2, ensure that stars form from high density gas: generally star formation occurs in gas with cm-3 but it can be as high as cm-3 depending on metallicity and resolution. The temperature cap for star formation is also usually lowered in these models as additional cooling processes are captured. The equilibrium models do not explicitly track the formation and destruction of H2, but rather assume a two-phase interstellar medium in which formation and destruction are balanced. In the non-equilibrium model, the formation and destruction of H2 are instead explicitly followed. Thus, in the non-equilibrium models, star formation is dependent on the timescale of H2 formation, which is not the case in the equilibrium models.
Using an equilibrium H2 model, Kuhlen et al. (2012) showed that an H2-based star formation prescription could dramatically suppress star formation in low mass halos where metallicities are low (and thus H2 is unable to form). However, the suppression is weakened in H2 formation models if dense gas is able to shield and form H2 despite low metallicities when sufficiently high resolutions are achieved (e.g., Hopkins et al., 2013). In this paper, we show that adopting a non-equilibrium model leads to further changes. At low metallicities, there is a delay in H2 formation times in non-equilibrium models, leading to a quantitative difference in the ability of UFD galaxies to form stars compared to temperature-density threshold models.
The two star formation prescriptions that we explore in this paper were also adopted in Christensen et al. (2014b, “Metals” and “H2” in that work), where it was shown that both models produce dwarf galaxies with nearly identical structural parameters (rotation curves, dark matter density profiles, baryonic angular momentum distributions) for galaxies with 108 M⊙ in stellar mass. Only the mass in galactic winds varied, but by less than a factor of two. We show in this work that, although these star formation prescriptions lead to similar galaxies in the classical dwarf galaxy mass range, differences arise on the scale of UFDs.
The differences that star formation prescriptions introduce on UFD scales have important ramifications, e.g., for the slope and scatter at the faint-end of the Stellar Mass – Halo Mass (SMHM) relation and the slope of the stellar mass function in the ultra-faint regime (Lin & Ishak, 2016; Munshi et al., 2017). In this paper we also emphasize the impact on the expected number of UFD satellites in dwarf galaxies, as this has been an active area of investigation recently (Wheeler et al., 2015; Dooley et al., 2017b), particularly with respect to possible companions of the Magellanic Clouds (Dooley et al., 2017a; Deason et al., 2015; Yozin & Bekki, 2015; Jethwa et al., 2016; Sales et al., 2017; Kallivayalil et al., 2018; Li et al., 2018). The favored Cold Dark Matter (CDM) cosmological model predicts that structure formation is self-similar. All dark matter halos should contain an abundance of dark matter substructure, from the largest galaxy cluster halos, to the smallest halos containing observed dwarf galaxies, and beyond. The scale-free nature of the subhalo mass function in CDM suggests that groups of subhalos should be common (Li & Helmi, 2008; D’Onghia & Lake, 2008; Sales et al., 2011; Nichols et al., 2011). Because low-mass halos form earlier, are denser, and fall into smaller hosts before larger ones, it is likely that satellites of satellites or of low mass isolated halos have survived longer than their counterparts that fell directly into the Milky Way (Diemand et al., 2005). This suggests that one way to search for ultra-faint galaxies might be to search for satellites of known dwarf galaxies (Rashkov et al., 2012; Sales et al., 2013; Wheeler et al., 2015; Carlin et al., 2016; Patel et al., 2018). Dooley et al. (2017b) used a range of SMHM relations derived from abundance matching results combined with a model for reionization to show that isolated dwarfs in the Local Group are extremely interesting targets in the hunt for ever-fainter dwarfs.
This paper is organized as follows: we describe our simulations in Section 2. In Section 3 we quantify the occupation fraction of dark matter halos as a function of declining halo mass, and show that at the lowest halo masses there is a drastic difference in the number of luminous dwarf galaxy satellites in simulations with different star formation prescriptions. We find that the inability of low mass halos to form H2 in the reionization epoch suppresses star formation relative to the same halos run with a temperature-density threshold star formation model. In Section 4, we demonstrate how the choice of star formation implementation impacts various quantities (star formation histories, stellar mass function, and probability of a classical dwarf hosting UFD satellites) that have recently been studied using simulations of dwarf galaxies. We discuss our results, including limitations of our model, in Section 5. We summarize in Section 6.
2 The Simulations
The simulations used in this work are run with the N-Body + Smoothed Particle Hydrodynamics (SPH) code ChaNGa (Menon et al., 2015) in a fully cosmological CDM context using WMAP Year 3 cosmology: , =0.74, , =0.77, n=0.96. ChaNGa utilizes the charm++ run-time system for dynamic load balancing and computation/communication overlap in order to effectively scale up the number of cores. This improved scaling has allowed for the simulation of large, high-resolution volumes (e.g., Tremmel et al., 2017; Anderson et al., 2017) that were previously unattainable with ChaNGa’s predecessor code, Gasoline. We use this scaling here to simulate a volume of dwarf galaxies, twice, requiring a total of 10 million CPU hours.
ChaNGa adopts all the same physics modules (described below) as Gasoline, but has an improved SPH implementation that uses the geometric mean density to more realistically model the gas physics at the hot-cold interface (Wadsley et al., 2017). The developers of ChaNGa are part of the agora collaboration, which aims to compare the implementation of hydrodynamics across cosmological codes (Kim et al., 2014, 2016).
Our galaxy sample is drawn from a uniform dark matter-only simulation of a 25 Mpc per side cube. From this volume, we select a field–like region representing a cosmological “sheet” roughly 3 Mpc in diameter, containing almost 7000 isolated dark matter halos from 2 1010 M⊙ in halo mass down to our resolution limit of 4.3 105 M⊙ (64 particles). We then re-simulate this field at extremely high resolution using the “zoom-in” volume renormalization technique (Katz & White, 1993). The zoom-in technique allows for high resolution in the region of interest, while accurately capturing the tidal torques from large scale structure that deliver angular momentum to galaxy halos (Barnes & Efstathiou, 1987). These zoom-in simulations have a hydrodynamical smoothing length as small as 6 pc, a gravitational force softening of 60 pc, and an equivalent resolution to a 40963 particle grid. Dark matter particles have a mass of 6650 M⊙, while gas particles begin with a mass of 1410 M⊙, and star particles are born with 30% of their parent gas particle mass. The dark matter-only version of this volume was run in both a CDM and self-interacting dark matter (SIDM) model in Fry et al. (2015). Following the convention in that paper, we adopt the nickname “The 40 Thieves.”
Metal Cooling (MC): The “Metal Cooling (MC)” version of the 40 Thieves includes cooling of the gas via primordial and metal-line cooling, non-equilibrium abundances of H and He, and diffusion of metals to neighboring gas particles (Shen et al., 2010). Additionally, we adopt a simple model for self-shielding of the HI gas following Pontzen et al. (2008). Star formation occurs stochastically when gas particles become cold (TK) and when gas reaches a density threshold of 100 , comparable to the mean density of molecular clouds. The probability, , of spawning a star particle is a function of the local dynamical time :
| (1) |
where is the mass of the gas particle and is the initial mass of the potential star particle. A star formation efficiency parameter, , gives the correct normalization of the Kennicutt-Schmidt relation (Christensen et al., 2014b).
Molecular Hydrogen (H2): The “Molecular Hydrogen (H2)” version of the 40 Thieves includes the aforementioned metal line cooling and metal diffusion, with the addition of non-equilibrium H2 abundances and H2-based star formation. Our H2 abundance calculation includes a both a gas-phase and dust-dependent description of H2 creation and destruction. H2 forms via H- in the gas phase, and is collisionally dissociated. The dust phase is dominant as soon as a small amount of metals are present. A detailed discussion of the calculation of H2 formation on dust grains is given in Christensen et al. (2012, hereafter CH12). Destruction of H2 by Lyman-Werner (LW) radiation is calculated due to both the UV background and from nearby young stars. An extensive calculation of the photodissociation by LW radiation is found in CH12. Shielding of HI and H2 is based on particle metallicity (Gnedin et al., 2009b, CH12). As in CH12, the SFR in this simulation is set by the local gas density and the H2 fraction. The star formation probability is again given by equation 1, but is modified such that , where and is the fraction of baryons in . We restrict star formation to occur in gas particles with T K. With the inclusion of the H2 fraction term, gas in low-metallicity dwarfs tends to reach even higher densities (required for the gas to shield and form H2) than the MC model before it can form stars (Christensen et al., 2014b).
We apply a uniform, time-dependent UV field from Haardt & Madau (2012) to model photoionization and photoheating for both runs. Both simulations adopt the “blastwave” supernova feedback approach (Stinson et al., 2006), in which mass, thermal energy, and metals are deposited into nearby gas when massive stars evolve into supernovae. The thermal energy deposited amongst those nearby gas neighbors is 1051 ergs per supernova event. Following Stinson et al. (2010), we quantize the feedback so that supernovae only occur when whole stars have gone supernova, as opposed to slowly releasing fractions of supernova energy at every time step. Subsequently, gas cooling is turned off until the end of the momentum-conserving phase of the supernova blastwave. This model keeps gas hydrodynamically coupled at all times.
Our feedback model does not explicitly include processes such as cosmic rays, or those caused by young stars such as photoionization, momentum injection from stellar winds, and radiation pressure (e.g., Thompson et al., 2005; Wise et al., 2012; Murray et al., 2011; Hopkins et al., 2012; Sharma & Nath, 2012; Agertz et al., 2013; Booth et al., 2013; Simpson et al., 2016; Salem et al., 2016; Farber et al., 2018; Kannan et al., 2018). However, the physical prescriptions described above have been able to reproduce and explain properties of galaxies over a wide range of masses, regardless of which SF recipe is adopted. In addition to simulating the first bulgeless disk galaxy and dark matter cores (Governato et al., 2010; Brook et al., 2011), simulated galaxies match the observed mass – metallicity relation (Brooks et al., 2007; Christensen et al., 2016), the baryonic Tully-Fisher relation (Christensen et al., 2016; Brooks et al., 2017), the size – luminosity relation (Brooks et al., 2011), the stellar mass to halo mass relation determined from abundance matching (Munshi et al., 2013), and the sizes and fractions of HI in local galaxies (Brooks et al., 2017). They also match the abundance of DLA systems (Pontzen et al., 2008), and the numbers and internal velocities of dwarf Spheroidal satellites (Brooks & Zolotov, 2014). In what follows, we extend these successful models to lower masses and demonstrate for the first time that the differing star formation models impact galaxy formation on UFD scales.
3 Results
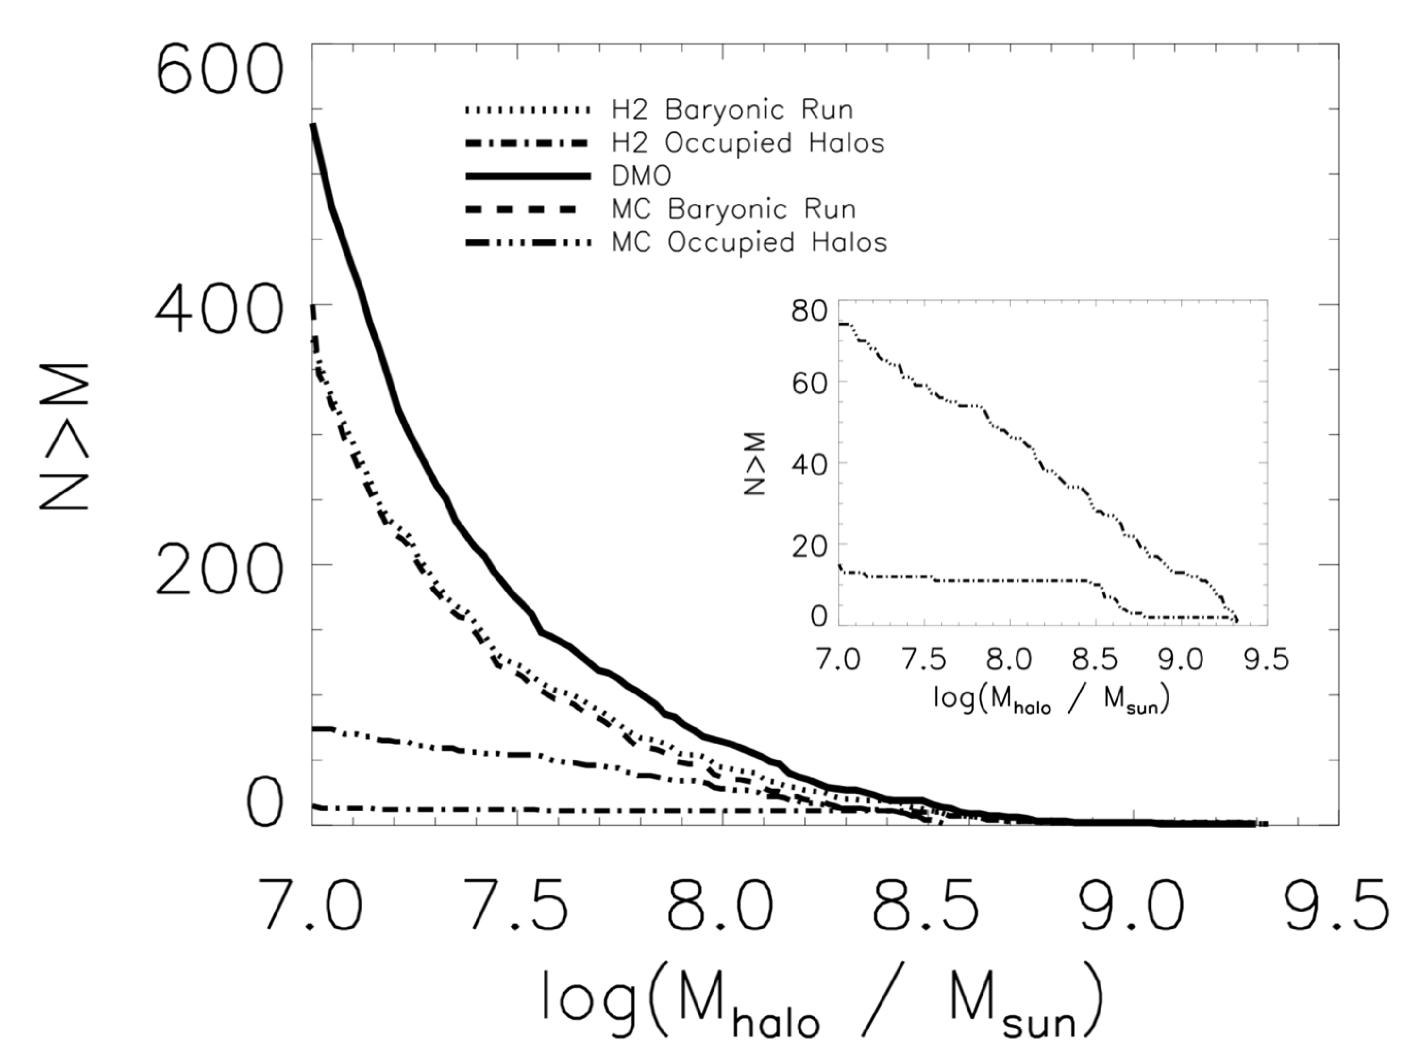
Figure 1 shows the cumulative halo mass functions for both of the baryonic (MC and H2) and dark matter-only versions of the 40 Thieves. The top three lines (solid, dashed, and dotted) include all dark matter halos (both isolated and satellite galaxies) down to 107 M⊙ in halo mass (corresponding roughly to the hydrogen cooling limit) at , regardless of whether they contain stars. The bottom two lines are only those halos that are “occupied” by stars, and are also shown separately in an inset for clarity. A given dark matter halo in a baryonic run is less massive than in the corresponding dark matter-only simulation (see also Sawala et al., 2013; Munshi et al., 2013). The root cause of this mismatch is baryon ejection from low mass halos (either by heating from the UV background and/or as a result of supernova feedback) which slows not only the galaxy growth rate, but the dark matter halo growth rate as well. As a direct result, the total number of dark matter halos with M107 M⊙ is reduced (75%) in the baryonic versions compared to the dark matter-only run.
The inset of Figure 1 shows in closer detail the cumulative halo mass function for only those halos that “host a galaxy,” i.e., contain a minimum of one star particle (see also Sawala et al., 2015) in both the MC and H2 runs. The number of luminous halos continues to rise toward lower halo masses in the MC run, but stops rising below Mhalo M⊙ in the H2 run. There are nearly five times as many occupied halos above M⊙ in the MC run than in the H2 run. If we focus only on the higher mass halos in our matched sample (defined next), the difference drops to about a factor of two (see Figures 2 and 3).
3.1 Matched Sample
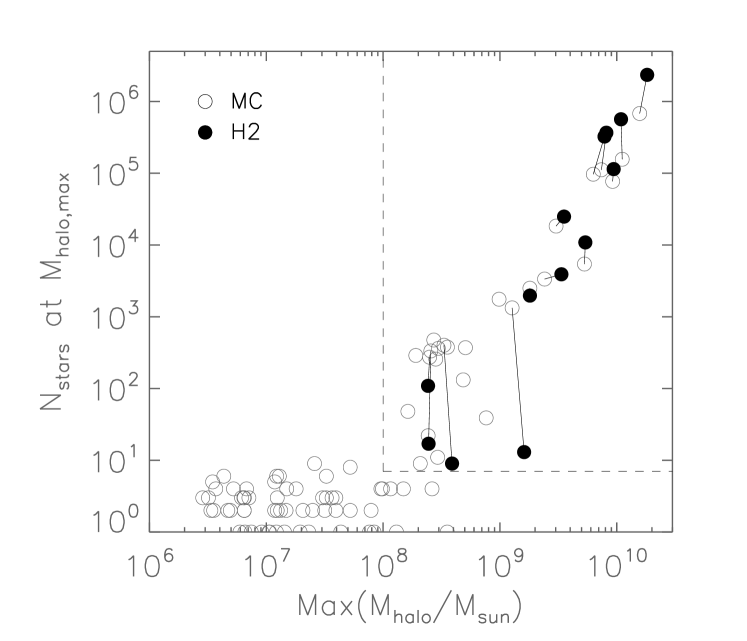
The galaxies with one star particles are, by definition, not resolved. In this section we set out to identify a set of halos that can be reliably compared against each other from each run. For every dark matter halo that contains a star particle at , we trace back the most massive progenitor halo and identify the time step in which it has the maximum number of dark matter particles. In Figure 2 we show the halo mass and number of star particles inside the halo at that step. Solid lines connect matched galaxies across the MC and H2 versions of the simulation. For halos above M⊙, halos are well-matched, with a one-to-one correspondence between formed galaxies. Below M⊙, however, it is clear that the MC run forms more galaxies than the H2 run, and even in the matched cases the H2 galaxies tend to form fewer stars at these low halo masses.
For halos with maximum halo mass above M⊙ and N, there are MC halos that contain galaxies but with matched counterparts in the H2 run that are completely dark. We have examined those dark halos in more detail to test whether their lack of star formation is expected for the H2 model given the resolution. We have approached this in two ways. First, similar to Kuhlen et al. (2013), we compare the surface densities of our gas particles to the critical surface density at which atomic H converts to molecular H. The metallicity of our non-star forming gas is or lower. At , M⊙ pc-2. The non-star forming gas in the dark matched H2 halos remains at surface densities M⊙ pc-2. Thus, it would not be capable of forming H2, and therefore should not form stars in the H2 run (see also Sternberg et al., 2014).
Second, we can examine the timescale, , for atomic H to convert to molecular H following Krumholz (2012). Following their equation 7:
| (2) |
where is the free-fall time, is the metallicity of the gas relative to solar, is a clumping factor equal to 10 in our simulations, and cm-3 where is the mean hydrogen density. For the non-star forming gas in our matched H2 halos, is about 10 cm-3. The free-fall time depends on as well, and is 13.6 Myr at 10 cm-3. The timescale for H2 formation, , is more than 10 Gyr for our gas with . Even at higher densities of cm-3, the timescale for H2 formation is over 1 Gyr.
Thus, significant amounts of H2 simply cannot form in these halos before reionization at this resolution (we discuss limitations of the resolution in Section 5). We conclude that our dark halos in the H2 run are behaving as expected. We therefore restrict the following analysis to matched halos with M M⊙ and N. It should be clear that we do not mean that these halos are “converged” across the two star formation recipes. The star formation in the two runs in the lowest mass halos is dramatically different, with the MC run forming stars while matched halos in the H2 run remain dark. Even when the H2 run forms stars there is a discrepancy in stellar mass with the matched halos in the MC run for halos with M M⊙. This is exactly the difference we wish to explore in this work.
3.2 The Formation of Dwarf Galaxies
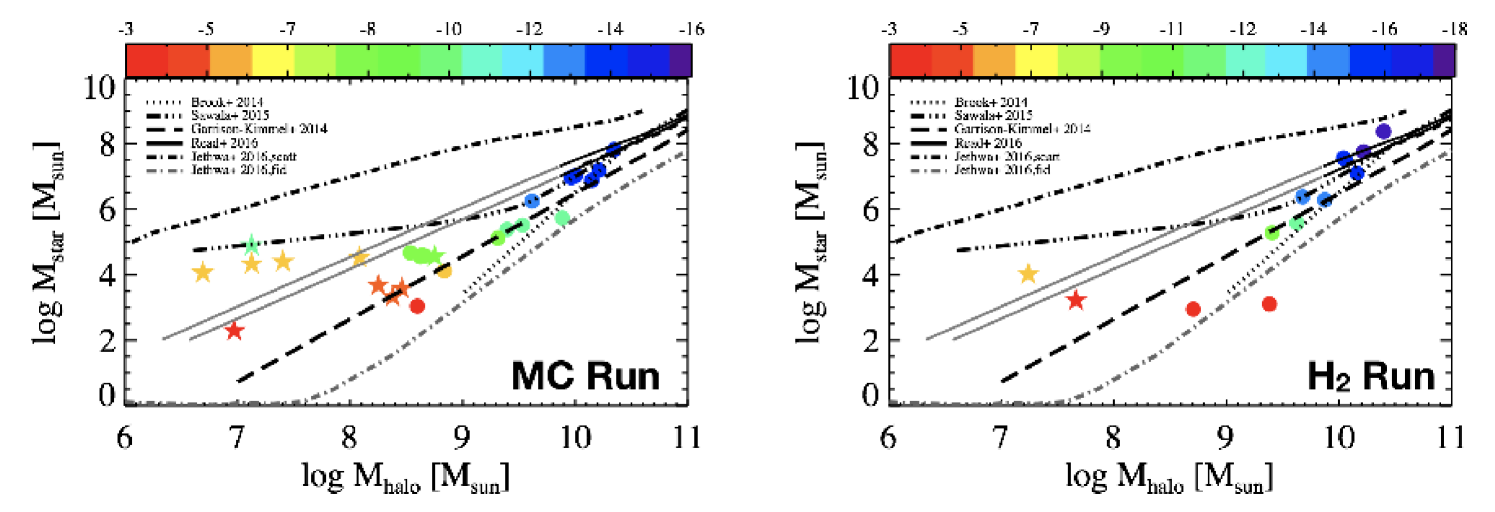
In Figure 3 we show the resulting stellar mass to halo mass relation for matched halos in both the MC (left panel) and H2 (right panel) versions of the 40 Thieves. Each galaxy is color coded by its -band magnitude at . Filled circles are central (isolated) galaxies, while stars are satellite galaxies. Four of the lines show results from abundance matching in dwarf galaxies (Brook et al., 2014; Garrison-Kimmel et al., 2014; Read et al., 2017; Jethwa et al., 2018), and the fifth line shows the simulation results of Sawala et al. (2015). The stellar masses have been calculated following Munshi et al. (2013), based on photometric colors. To be consistent with abundance matching, the halo masses are the mass in the corresponding dark matter-only run. Note that we plot halo masses, while the abundance matching results use maximum halo mass. Thus, the satellite results should not be compared directly to the lines (though we note that all satellites must have peak halo masses above 108 M⊙ to be included in the sample shown here).
Again, it is immediately obvious from Figure 3 that there are galaxies residing in halos above Mhalo 109 M⊙ that are produced in both runs. However, below 109 M⊙ the number of galaxies diverges, with twice as many halos containing galaxies in the MC run. We can now see from Figure 3 that many of these low mass halos are satellites (colored stars). There are five times as many satellites in the MC run than in the H2 run.
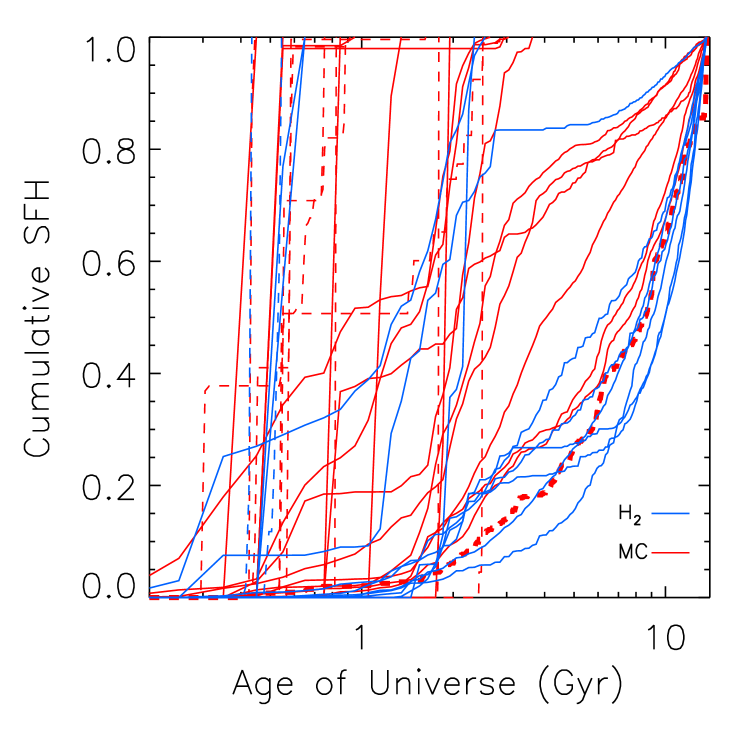
All of the satellites in these runs are in the ultra-faint luminosity range. Like observed UFDs (Brown et al., 2012, 2014; Weisz et al., 2014a, b), they tend to form the bulk of their stars early, with their star formation trickling off soon after reionization (see Figure 5, discussed further below). In Figure 4 we compare the phase diagram for gas that forms stars within the first 1 Gyr of both simulations (i.e., before the end of reionization at ). Although there is some overlap in the star formation temperatures and densities between the two runs, there is a clear offset in the regions where the majority of stars form. In the MC run (grey points), stars tend to form from gas that spans a range of temperatures (up to 104 K) but is near the threshold density (100 cm-3). In the H2 run (contours and black points), star-forming gas forms from colder, denser gas ( K and 1000 cm-3). This difference was also discussed in CH12 (see their Figure 13).
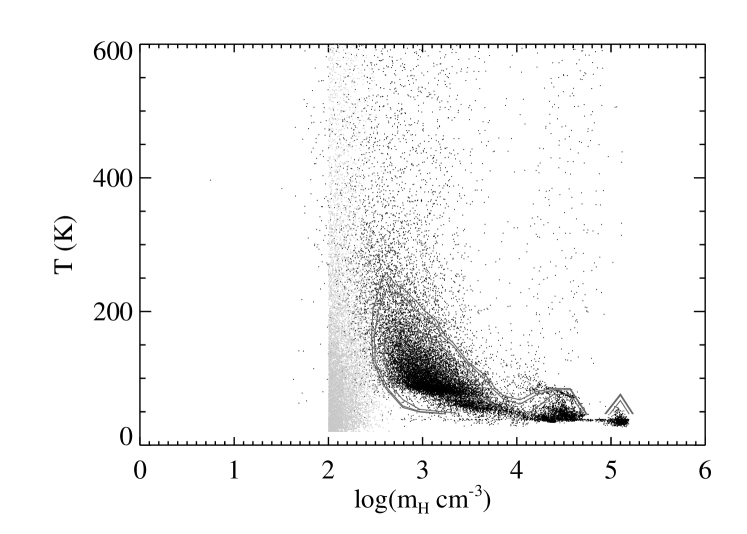
The higher densities that stars form from in the H2 model is tied directly to the subgrid H2 formation model. At solar metallicities, the two models form star particles at similar densities, but the models diverge as metallicity decreases. As described in CH12, when metals are present the formation of H2 is dominated by formation on dust grains. In the reionization epoch when metallicities are extremely low, formation may also proceed through gas-phase reactions. However, during the reionizaton epoch both of these processes are inefficient and slow. As a result, gas particles will frequently reach high densities through gravitational collapse prior to forming significant amounts of H2. At the same time, the low metallicities reduce the amount of dust-shielding, which means that H2 (and thus star formation) can only persist in high density gas. For most of the H2 subhalos, significant amounts of H2 can never be created before reionization removes the gas from the halos. In the MC run, because stars can form in lower density atomic gas, star formation can begin before reionization quenches it. This also explains why the MC run tends to form more stars in general for galaxies in halos with Mhalo 109 M⊙ (see Figure 2).
Even at , the most massive matched dwarfs in this work still show a difference in the effective star formation density threshold due to the impact of metallicity on dust-shielding (CH12; Christensen et al., 2014b). Despite this, dwarf galaxies in halos above 109 M⊙ generally still form similar numbers of star particles, due to their ability to self-regulate. This is consistent with the prior results discussed in the Introduction that found that the density threshold had little impact on the resulting SFR. However, a slight excess of stars seems to form in the H2 model relative to the MC model at these masses (see Figure 2). This excess is likely due to the ability of the gas to shield in the H2 model, protecting the gas from heating and leading to additional cold gas present in the H2 simulations. The excess cold gas results in slightly higher stellar masses in the H2 run in halos 1010 M⊙.
Kuhlen et al. (2012) were the first to show that a model for H2-based star formation could suppress star formation in dwarf galaxies primarily due to their lower metallicities. However, they found that their equilibrium H2 model suppressed all star formation in halos below about Mhalo 1010 M⊙, while our non-equilibrium H2 model forms stars in halos down to Mhalo 108.5. Reionization played no role in Kuhlen et al. (2012), since their lowest mass halo that was able to form stars was well above the halo mass thought to be impacted by reionization. On the other hand, the changes in stellar mass that we see in halos below 109 M⊙ are explicitly due to the fact that these are halos in which reionization can strongly affect the evolution. The MC halos are able to start forming stars at lower densities than their H2 counterparts, and thus are able to produce more stars before reionization removes their gas.
3.3 Delayed Merging
Early star formation is not the only reason why there are more satellites in the MC run than in the H2 run: more of the satellites survive. Three of the surviving subhalos in the MC run are completely disrupted in the H2 run after merging with a parent halo. Two of those halos had managed to form stars in the H2 run before being fully destroyed. In fact, a close examination of Figure 5 shows that there is a surviving satellite in the MC run with a very extended star formation history (SFH; bolded red dashed line in the left panel). This satellite had a counterpart in the H2 run with an extended SFH, but the subhalo is completely disrupted and part of the second largest halo in the H2 run at . All three of the surviving subhalos in the MC run are completely merged in the dark matter-only run as well.
Schewtschenko & Macciò (2011) showed that mergers occur later in simulations with baryonic feedback than in matched halos in an identical dark matter-only simulation. They hypothesized that the pressure of the hot halos found in baryonic simulations slows down accretion of subhalos. Our simulated dwarf galaxies do have hot halos of gas around them (Wright et al., 2018), with the mass in hot gas being up to an order of magnitude greater than the HI gas mass. Later infall of subhalos then leads to less tidal mass loss for subhalos simply due to the fact that there is less time for tidal stripping between infall and (Ahmed et al., in prep.). The end result should be that fewer satellites are fully destroyed at for a run with baryonic feedback. 111This assumes that additional tidal effects from the potential of the central galaxy are negligible. The disk potential is not negligible in Milky Way-mass galaxies (Peñarrubia et al., 2010; Zolotov et al., 2012; Arraki et al., 2014; Brooks & Zolotov, 2014; Garrison-Kimmel et al., 2017b), but is expected to be negligible in dwarf galaxies.
These results suggest that the feedback in the MC run is stronger, delaying mergers of subhalos. Indeed, another indication that feedback is stronger in the MC run is that the overall halo masses tend to be lower (see comparison of maximum Mhalo for matched halos in Figure 2). As mentioned previously, feedback reduces the growth of halos (Munshi et al., 2013; Sawala et al., 2013). Despite the fact that the feedback recipe is the same in both the MC and H2 runs, feedback is injected into lower density gas in the MC run because the MC run rarely reaches the higher densities found in the H2 run (see, e.g., figure 7 of Christensen et al., 2014b). When comparing the nine most massive isolated dwarfs at (where the stellar masses are similar), the H2 dwarf galaxies on average have 10% higher dark matter mass and more than twice the mass in hot gas within their virial radii (and more baryons generally) compared to their MC counterparts.222Since the hot gas mass of the MC galaxies is smaller than the H2 runs, the delayed merging of subhalos does not seem to be a direct result of pressure from the hot halo (as was proposed in Schewtschenko & Macciò, 2011), but rather a response to the ejection of the gas itself. Thus, it seems that the MC galaxies have been able to remove more baryonic material from their halos, delaying their growth in dark matter as well.
However, this result is seemingly at odds with previous comparisons of these two models (Christensen et al., 2014a), which found that the H2 model had more effective feedback and drove slightly more outflows. While the previous work used the Gasoline code, we use ChaNGa with an updated SPH treatment (Wadsley et al., 2017) and quantized feedback. It is not clear if these changes alter the feedback, making the MC run more effective at removing baryons. A full investigation is beyond the scope of this paper, but we find that all evidence points to stronger feedback in the current MC runs than in the H2 runs.
In summary, these results suggest that feedback can lead to delayed mergers of the UFD satellites. Combined with the ability to form stars at early times in more halos in the MC run, this makes the difference in satellite numbers even more stark at between the two runs.
4 Implications
The fact that star formation is restricted to different types of gas in these two commonly adopted models leads to some implications that should be considered when comparing predictions from different simulations. Here, we examine a few observables that are commonly predicted by simulators, demonstrate that future observations have the potential to pinpoint more accurate physical models.
4.1 Delayed Star Formation
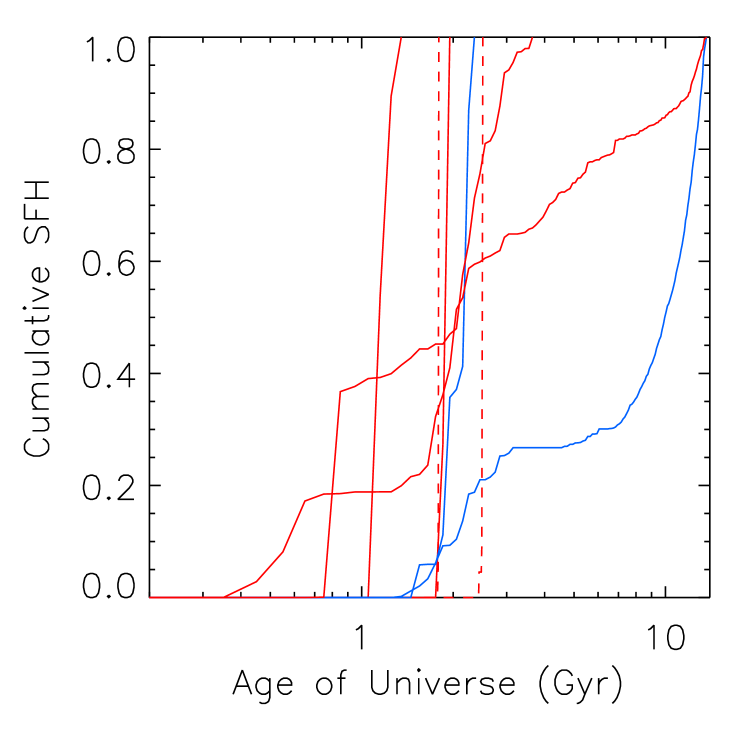
Consistent with the results presented in Section 3, we find that there is a delay in the onset of star formation in the H2 run compared to matched halos in the MC run. We highlight a few cases of this in the right panel of Figure 5. In general (as can be seen in the left panel of Figure 5), most of our galaxies begin to form stars before , i.e., in the first 1 Gyr after the Big Bang. However, there are two (central) galaxies in the H2 run that only begin to form stars after 1 Gyr (shown in blue). Because their counterparts in the MC run can form stars without first generating significant amounts of H2, the MC counterparts all begin star formation before the end of reionization (the counterparts are also shown in red in the right panel of Figure 5 – they are the two MC galaxies shown that begin star formation before 1 Gyr).
However, post-reionization onset of star formation cannot be attributed to only a single star formation model. There are four galaxies (two centrals and two satellites, shown in the right panel of Figure 5) in the MC run that do not begin to form their stars until after 1 Gyr. In each of the four cases, their counterparts in the H2 run are dark halos that never formed stars. In that case, we might say that the star formation is so delayed in the H2 run that it does not occur before .
In general, all observed galaxies have early star formation, though the error bars on the time of onset can be 1 Gyr or more depending on how far down the main-sequence resolved stars are detected (Brown et al., 2012, 2014; Weisz et al., 2014a, b). It is not clear if our galaxies that delay star formation until after reionization are consistent with observations. However, the dwarf galaxies in these simulated volumes are much further away from a massive galaxy than any observed galaxies with resolved star formation histories that have pushed below the oldest main-sequence turnoff. Our dwarf galaxies are 5 Mpc away from a Milky Way-mass galaxy. It remains to be seen if environment plays any role in onset of star formation.
In summary, while the H2 run has consistently later star formation (or none at all by ) compared to matched galaxies in the MC run, there is no obvious trend in onset time that could be used to discriminate models based on observations. Rather, it is the number of galaxies and stellar mass of those galaxies that discriminates the models (discussed in the next section).
4.2 Stellar Mass Function
The factor of two difference in the number of faint dwarf galaxies that form between our two models will lead to different faint ends of the stellar mass function (SMF). Additionally, the fact that the MC run forms higher stellar masses for matched galaxies with M M⊙ (see Figure 2) will also alter the SMF.
First, we demonstrate the difference in the SMF that arises due to the different number of low mass galaxies in each model alone. For both the MC and H2 models, we populate a SMF following the method outlined in Garrison-Kimmel et al. (2017a) in which the scatter, , in the stellar mass at a given halo mass grows as
| (3) |
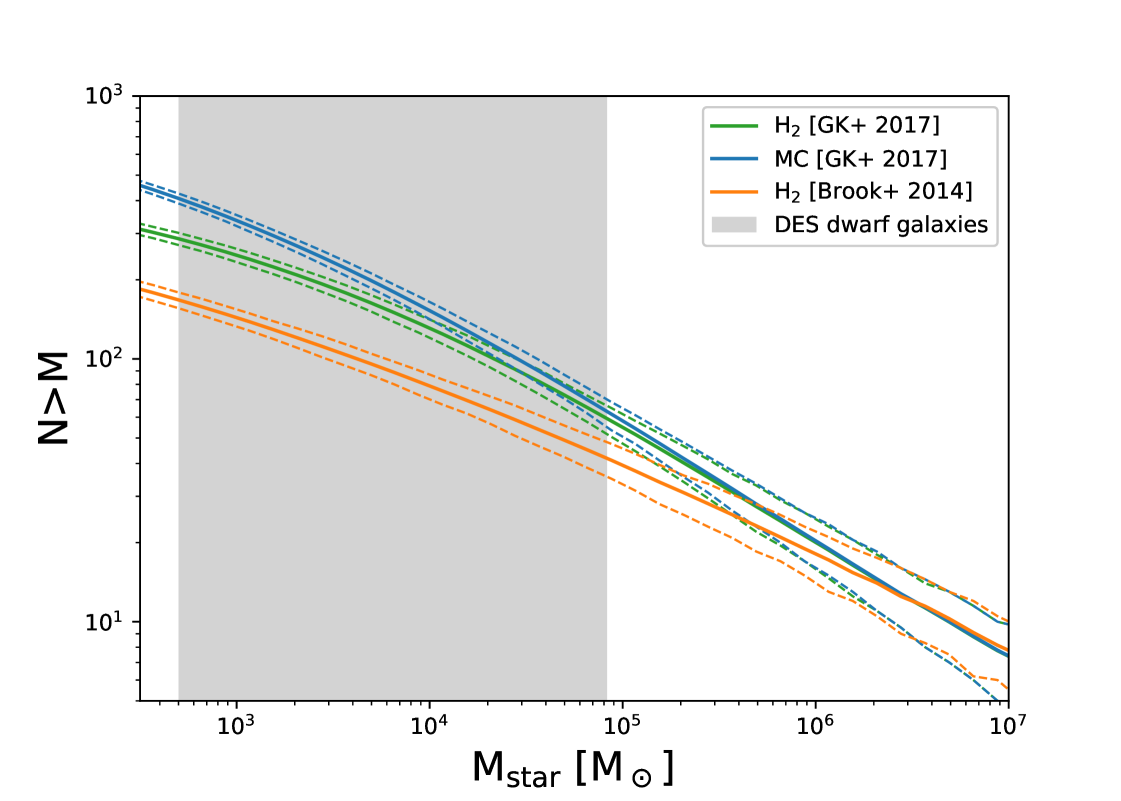
where is the rate as which the scatter grows, and M1 is a characteristic halo mass above which the scatter remains constant. We adopt the scatter model for field galaxies from Garrison-Kimmel et al. (2017a), where M M⊙ and . We populate the ELVIS catalogs (Garrison-Kimmel et al., 2014) with this SMHM relation, and then assign galaxies as “dark” based on the fraction of luminous to non-luminous halos shown in Figure 1 for each of our models. The resulting SMFs are shown in Figure 6 as the blue (MC) and green (H2) lines. We do this times in order to estimate our errors (dashed lines), and normalize the results so that each has 12 galaxies with stellar mass comparable to Fornax (this is roughly the number of Fornax-mass galaxies within 1 Mpc McConnachie, 2012). Figure 6 demonstrates that there is a difference in slope below M M⊙, with the H2 simulation predicting the shallower faint-end slope.
The blue and green lines adopt the same slope and scatter of the SMHM relation, and thus only reflect the change in the fraction of “occupied” dark matter halos shown in Figure 1. However, the H2 model tends to form fewer stars in matched halos at the low mass end, which will yield a steeper SMHM slope that will impact the SMF. As can be seen in Figure 3, the Garrison-Kimmel et al. (2017a) SMHM slope appears to be a decent fit to the central galaxies in the MC run (left panel). However, the Brook et al. (2014) SMHM slope appears to be a better match to the central galaxies in the H2 run. Our simulations do not have enough galaxies to independently define the slope and scatter of the SMHM relation for each prescription, so we adopt the slope and scatter of Garrison-Kimmel et al. (2017a) to describe the MC run, and Brook et al. (2014) to describe the H2 run, in order to show the additional affect that the steeper SMHM relation will have on the SMF. We assume the same growing scatter as in the Garrison-Kimmel et al. (2017a) relation but applied to the Brook et al. (2014) slope, and again adopt the galaxy occupation fraction for the H2 simulation. The result is shown as the orange line in Figure 6. It can now be seen that there is a dramatic difference in the number of expected UFD galaxies in the two models.
The SMF for the two runs is indistinguishable above M M⊙. Since this is the mass range that is currently best constrained, current observations cannot constrain the two models. However, galaxies at lower stellar masses are being discovered by surveys like DES and HSC-SSP, and potentially hundreds will be found near the Milky Way with the Large Synoptic Survey Telescope (LSST; Tollerud et al., 2008; Walsh et al., 2009; Newton et al., 2018), and out to greater distances using integrated light surveys (Danieli et al., 2018). The masses of the UFDs discovered in DES is highlighted by the grey region in Figure 6. It can be seen that pure number counts of faint dwarfs in LSST (i.e., UFDs found out to 1 Mpc) can help us to constrain how star formation proceeded at high redshift.
4.3 Satellites of Dwarf Galaxies
As discussed above, the MC simulation contains five times more satellites than the H2 run at . Here we use this result to estimate the predicted frequency of satellites around dwarfs in the Local Group in the two models.
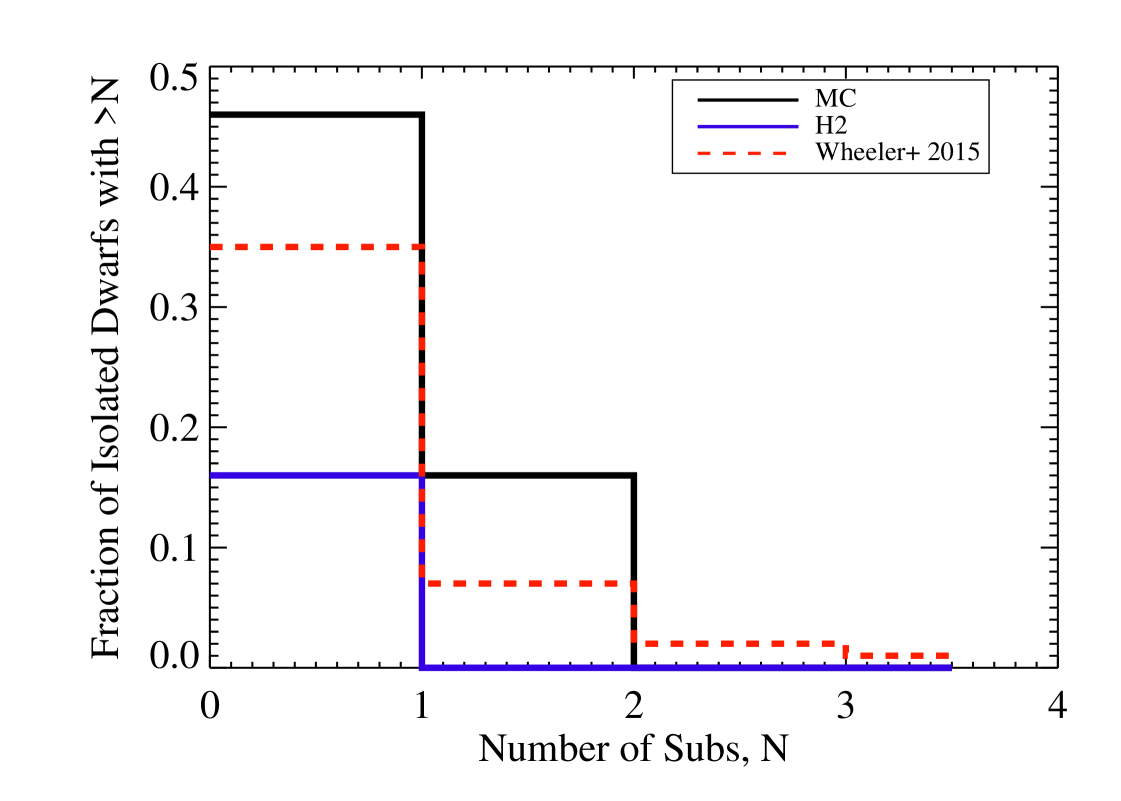
We follow the methodology in Wheeler et al. (2015) and use the ELVIS suite of collisionless zoom-in simulations of Local Group-like environments (Garrison-Kimmel et al., 2014) combined with the results of our two simulations to predict the frequency of a satellite around a dwarf galaxy with M M⊙. To summarize the procedure: (1) we select isolated dwarf galaxies from the ELVIS suite from both the isolated and paired Milky Way-mass halo simulations and (2) we estimate the frequency of subhalos with peak M⊙ within 50 kpc of the dwarf host. Figure 7 shows the results.
As expected, the MC model predicts that UFD satellites of dwarf galaxies are more abundant than the H2 model. The MC run produces non-negligible frequencies for finding at least one satellite around a dwarf host, 46%. The H2 model predictions are roughly a factor of 4 lower, at 16%. The H2 model also suppresses galaxy formation to the point that no Local Group dwarf with M M⊙ is expected to host more than one luminous satellite companion, while multiple UFD satellites are possible in the MC run.
The Wheeler et al. (2015) results adopt the FIRE 1 star formation and feedback prescription (Hopkins et al., 2014). FIRE 1 adopted a threshold for star formation of 100 cm-3, while the updated FIRE 2 adopts a higher density threshold of 1000 cm-3 (Hopkins et al., 2018). Both FIRE 1 and FIRE 2 use the equilibrium model from Krumholz & Gnedin (2011) to determine the H2 fraction in a given particle, which is used to calculate the self-shielding of the gas particle and the cooling rate. The presence of H2 for star formation is an explicit requirement, which is usually ensured by the simultaneous requirement of a high density threshold. However, because FIRE adopts the equilibrium model of H2, there is no delay in star formation due to the H2 formation time.
Figure 7 demonstrates that the predictions in Wheeler et al. (2015) are closer to our MC results than H2 results. This is in line with our expectations given the similarity in star formation threshold (and resolution) between the FIRE 1 model and the MC model. Of course, both the feedback and reionization models in FIRE are different than those used here, which may also play some role in the results. We note, though, that we have adopted a reionization model (Haardt & Madau, 2012) that is known to lead to earlier reionization than that used in FIRE (Faucher-Giguère et al., 2009), as was shown in Oñorbe et al. (2017). Despite the stronger, earlier heating in our MC model, we predict slightly more satellites than Wheeler et al. (2015).
The results presented in Figure 7 serve to underscore that current predictions for the number of UFD satellites expected around Local Group dwarfs should be approached with caution. This work highlights the range of values we expect to see in state-of-the-art zoom simulations that reach the UFD mass/luminosity range.333 Though we note that these results are all currently based off of simulations of classical field dwarfs, and no one has yet simulated UFDs around a Milky Way-mass galaxy in a cosmological context. However, we do not currently know what star formation physics model is “correct.” Until future observations better constrain the models, we must find independent constraints from existing observations.
5 Discussion
In this work, we have found that there is a significant delay in star formation and reduction in overall efficiency of star formation in simulated UFD galaxies when adopting a non-equilibrium H2-based star formation prescription relative to a prescription that adopts a commonly-used temperature-density threshold. We verified that the LW flux external to the galaxies in our H2 model (due to either the UV background or nearby star forming galaxies) is not high enough to dissociate H2 in the halos that fail to form stars. Rather, the reduction in star formation in the H2 model is due the long formation times of H2 at low metallicities in low mass halos. The delay in H2 formation prevents or suppresses star formation in UFD galaxies because reionization can heat their gas before significant star formation can occur. In contrast, the MC model allows star formation to occur as soon as gas reaches a high enough density threshold, and more stars form before reionization can remove the gas.
5.1 Limitations of the Simulations
It is unlikely that either of the explored models, MC or H2, is “correct.” The MC model does not take into account whether the gas can shield when forming stars, and shielding of the gas is likely to be a necessary ingredient for star formation to occur. Similarly, it has been argued that H2 is not necessary for star formation, but that its presence is correlated with the ability of the gas to shield (Glover & Clark, 2012; Mac Low & Glover, 2012; Krumholz et al., 2011; Krumholz, 2012; Clark & Glover, 2014). Hence, it is possible that neither model accurately reflects the physics of star formation in the first halos. Instead, a model that links star formation to shielding may be more appropriate (Byrne et al., 2019).
We emphasize that not all H2 models for star formation will behave in the same way as our adopted non-equilibrium H2 model. As discussed throughout this paper, some H2 models assume equilibrium between the formation and destruction of H2 in the interstellar medium. Because H2 formation is not explicitly followed, there will be no dependence on the formation time of H2 in equilibrium models. Thus, equilibrium H2 models may behave more like the MC model, though this remains to be tested.
5.1.1 Resolution
As seen in Equation 2, the time scale for H2 formation is density dependent. Resolution will limit the maximum densities that we are capable of reaching. Figure 4 shows that our dwarf galaxies in the H2 run that are able to form stars are able to reach gas densities of cm-3. Because lower mass halos will contain fewer gas particles (i.e., fewer resolution elements), this limits their ability to reach the same high densities. Thus, it is possible that some stars should be forming in our dark halos, but that we are unable to capture the process.
However, resolution is a limitation of all simulations, and our goal here is not to present the H2 model as correct. If we are missing star formation in lower mass halos, then we would recommend that simulators adopt a model that does not suppress star formation given their resolution (e.g., an equilibrium H2 model, or a temperature/density threshold model).
It is not clear, though, that we are missing star formation in lower mass halos. Our H2 model suppresses star formation in halos below 108.5 M⊙, and there is no indication to date that this is contrary to observations. Jethwa et al. (2018) used abundance matching to put a lower limit on the peak halo masses of Milky Way UFDs of 108 M⊙. Meanwhile, Tollerud & Peek (2018) suggest that reionization prevents galaxy formation in halos below 3108 M⊙ in peak halo mass. Their model is simple, with a sharp transition that has all halos hosting galaxies above this mass and none below it. This behavior is actually quite similar to our H2 model. Thus, both of our models are in reasonable agreement with current observational data.
5.1.2 Reionization model
Many of our low mass halos in the H2 model are not able to form stars before reionization prevents them from doing so. Hence, our results may be sensitive to reionization model. Reionization is expected to leave a visible imprint on the satellite luminosity function in the UFD range (Bose et al., 2018). We have adopted the same model in both simulations, following Haardt & Madau (2012). However, Haardt & Madau (2012) has been shown to heat the IGM earlier () than it should (Oñorbe et al., 2017), making the impact of reionization particularly strong on our results. We have left it to future work to quantify the impact of a gentler reionization model on the formation of ultra-faint dwarf galaxies, and restrict the focus of this paper to the role of star formation recipe alone.
However, the main limitation of our reionization model is the fact that it is uniform throughout the simulation volume. This is common for cosmological galaxy simulations, as the radiative transfer required to explicitly follow patchy reionization is too computationally expensive (and, as noted in Section 2, these runs already cost millions of CPU hours each). Our dwarf volumes are 5 Mpc away from a Milky Way-mass galaxy, meaning that they may be in a lower density region that was not ionized as early as the higher density regions surrounding massive galaxies. A more realistic reionization model for this region may then allow some of our dark halos to form stars. The early reionization of Haardt & Madau (2012) may be a better representation of what subhalos that fell into the Milky Way at early times experienced. Because the goal of UFD modeling is often to make predictions for LSST, a model somewhere between the two extremes of late and early reionization is probably more appropriate. However, an accurate study will require radiative transfer to follow the flux of LW radiation and the dissociation of H2.
5.2 Magellanic Cloud Satellites
Recently, the Dark Energy Survey (DES), has nearly doubled the number of known UFDs in the Milky Way (Bechtol et al., 2015; Drlica-Wagner et al., 2015; Kim & Jerjen, 2015; Kim et al., 2015; Koposov et al., 2015; Luque et al., 2017). Many of the DES dwarfs are thought to potentially be satellites of the Magellanic Cloud system (Deason et al., 2015; Yozin & Bekki, 2015; Jethwa et al., 2016; Sales et al., 2017; Kallivayalil et al., 2018; Li et al., 2018). We note that we do not have an LMC-mass galaxy in this simulation volume. The halo mass of the LMC is estimated to be at least M M⊙ (Besla, 2015; Dooley et al., 2017a; Peñarrubia et al., 2016; Laporte et al., 2018; Erkal et al., 2018). A lot of work has been done recently to determine if the DES dwarfs are satellites of the LMC or Magellanic System (e.g., Deason et al., 2015; Jethwa et al., 2016; Sales et al., 2017). The majority of studies find that 25-50% of the newly discovered DES dwarfs are likely to have come in with the Magellanic Clouds. Kallivayalil et al. (2018) and Pace & Li (2018) derive proper motions from Gaia data to test whether the UFD satellites have kinematics consistent with falling in with the Clouds. Between the two studies, seven UFDs are thought to be associated. It is not immediately clear if these high numbers are compatible with our predictions, given our lack of LMC-mass galaxies.
The models of Dooley et al. (2017a) predict 5-15 UFDs with M M⊙ (the lower limit for at least seven star particles in our well-matched galaxy sample) around an LMC-mass galaxy, and 2-9 around an SMC-mass galaxy. These results are consistent with the number of UFDs that are potentially associated with the Magellanic Cloud system. However, the abundance matching results of Dooley et al. (2017b) put the SMC in a halo with M M⊙, more massive than our most massive simulated galaxy. Based on their abundance matching results, a more direct comparison of our most massive simulated galaxies is to WLM, for which Dooley et al. (2017b) expect to find roughly one UFD companion. This suggests that our results are generally consistent with the estimates in Dooley et al. (2017b, a), as they should be as long as our simulation results are reasonably described by one of the SMHM relations that they explore. However, it is unlikely that even our MC model would predict seven satellite companions around an LMC-mass galaxy. To reach such high numbers, the satellites must be associated with the whole Magellanic system (SMC+LMC), rather than just the LMC.
6 Summary
In this work, we have used the highest resolution simulations to date of a cosmic volume of dwarf galaxies in order to examine the effect of star formation recipes on the formation of UFDs. We run our volume with two different star formation recipes that are common in the literature: one with a temperature/density threshold for star formation, and another that requires the presence of H2 for star formation. The main differences that manifest between the two models occur in extremely low metallicity gas and are 1) the timescale over which star formation takes place and 2) the effective gas densities at which star particles form (the first above 100 cm-3 and the H2 primarily above 1000 cm-3 due to gravitational collapse during H2 formation and reduced dust shielding). We find that these differences lead to drastically different results for galaxy formation in halos with M M⊙.
Broadly, the ability of the stars in the MC model to form earlier leads to more galaxies that can form in low mass halos. When the H2 dependency is introduced into the star formation model, however, gas in low-metallicity, low-mass halos is less likely to reach significant molecular fractions prior to reionization and gas may never reach densities high enough for dust-shielding to allow for substantial H2. As a result, many fewer low-mass halos in the H2 run produce stars. Even when they do produce stars, they form substantially less than their matched counterparts in the MC run, leading to a steeper SMHM relation and shallower faint-end SMF.
For the two models that we examine here, we find twice as many resolved galaxies form in the lower threshold (MC) run. However, most of these are satellites. We also find that more satellites survive in the MC run, and we conjecture that feedback in the satellites somehow contributes to the delayed mergers/disruption of these satellites. The combined effect leads to five times as many satellites in the MC run than in the H2 run.
We have convolved our results with the halos in the ELVIS simulation suite (Garrison-Kimmel et al., 2014) in order to make predictions for the number of UFD satellites around Local Group dwarf galaxies. We find that the MC model predicts four times as many dwarfs should host at least one luminous satellite compared to the H2 model, while the H2 model predicts that no Local Group dwarfs should host more than one UFD satellite. Our MC model produces a similar prediction to that of Wheeler et al. (2015), where the density threshold for star formation was also 100 cm-3.
Our goal in this paper is not to figure out which model is correct. Rather, our goal is to stress the need for caution in interpreting simulated UFD results. As simulations push to ever-higher resolution and UFDs begin to be modeled for the first time in fully cosmological simulations run to , the predictions for UFDs are likely to vary from model to model due to the assumptions adopted by varying modelers. This is in contrast to model predictions in the classical dwarf galaxy mass range because classical dwarf galaxies are capable of self-regulating their star formation, reducing dependency on the adopted prescriptions in their resulting stellar masses. As we push into the UFD mass range, we are simulating galaxies for the first time that can no longer self-regulate.
However, we have highlighted a few future observables that will help to pinpoint the conditions for star formation in the first low mass halos. Specifically, we have shown that the SMF and the number of UFD satellites around classical dwarf galaxies will be strongly impacted by star formation in UFDs during the reionization epoch. The predicted SMF that can be probed by LSST is shallower in the UFD range for the model that restricts star formation to gas that has H2. This suggests that pure number counts of UFDs that we discover in the future can help to pinpoint the conditions required for the first star formation in low mass halos. A better constraint on the slope and scatter of the SMHM relation at low masses will also help to constrain the models.
References
- Agertz & Kravtsov (2016) Agertz, O., & Kravtsov, A. V. 2016, ApJ, 824, 79, doi: 10.3847/0004-637X/824/2/79
- Agertz et al. (2013) Agertz, O., Kravtsov, A. V., Leitner, S. N., & Gnedin, N. Y. 2013, ApJ, 770, 25, doi: 10.1088/0004-637X/770/1/25
- Anderson et al. (2017) Anderson, L., Governato, F., Karcher, M., Quinn, T., & Wadsley, J. 2017, MNRAS, 468, 4077, doi: 10.1093/mnras/stx709
- Arraki et al. (2014) Arraki, K. S., Klypin, A., More, S., & Trujillo-Gomez, S. 2014, MNRAS, 438, 1466, doi: 10.1093/mnras/stt2279
- Aumer et al. (2013) Aumer, M., White, S. D. M., Naab, T., & Scannapieco, C. 2013, MNRAS, 434, 3142, doi: 10.1093/mnras/stt1230
- Barnes & Efstathiou (1987) Barnes, J., & Efstathiou, G. 1987, ApJ, 319, 575, doi: 10.1086/165480
- Bechtol et al. (2015) Bechtol, K., Drlica-Wagner, A., Balbinot, E., et al. 2015, ApJ, 807, 50, doi: 10.1088/0004-637X/807/1/50
- Benincasa et al. (2016) Benincasa, S. M., Wadsley, J., Couchman, H. M. P., & Keller, B. W. 2016, MNRAS, 462, 3053, doi: 10.1093/mnras/stw1741
- Besla (2015) Besla, G. 2015, ArXiv e-prints. https://arxiv.org/abs/1511.03346
- Booth et al. (2013) Booth, C. M., Agertz, O., Kravtsov, A. V., & Gnedin, N. Y. 2013, ApJ, 777, L16, doi: 10.1088/2041-8205/777/1/L16
- Bose et al. (2018) Bose, S., Deason, A. J., & Frenk, C. S. 2018, ApJ, 863, 123, doi: 10.3847/1538-4357/aacbc4
- Brook et al. (2014) Brook, C. B., Di Cintio, A., Knebe, A., et al. 2014, ApJ, 784, L14, doi: 10.1088/2041-8205/784/1/L14
- Brook et al. (2012) Brook, C. B., Stinson, G., Gibson, B. K., Wadsley, J., & Quinn, T. 2012, MNRAS, 424, 1275, doi: 10.1111/j.1365-2966.2012.21306.x
- Brook et al. (2011) Brook, C. B., Governato, F., Roškar, R., et al. 2011, MNRAS, 415, 1051, doi: 10.1111/j.1365-2966.2011.18545.x
- Brooks et al. (2007) Brooks, A. M., Governato, F., Booth, C. M., et al. 2007, ApJ, 655, L17, doi: 10.1086/511765
- Brooks et al. (2017) Brooks, A. M., Papastergis, E., Christensen, C. R., et al. 2017, ApJ, 850, 97, doi: 10.3847/1538-4357/aa9576
- Brooks & Zolotov (2014) Brooks, A. M., & Zolotov, A. 2014, ApJ, 786, 87, doi: 10.1088/0004-637X/786/2/87
- Brooks et al. (2011) Brooks, A. M., Solomon, A. R., Governato, F., et al. 2011, ApJ, 728, 51, doi: 10.1088/0004-637X/728/1/51
- Brown et al. (2012) Brown, T. M., Tumlinson, J., Geha, M., et al. 2012, ApJ, 753, L21, doi: 10.1088/2041-8205/753/1/L21
- Brown et al. (2014) —. 2014, ApJ, 796, 91, doi: 10.1088/0004-637X/796/2/91
- Buck et al. (2018) Buck, T., Dutton, A. A., & Macciò, A. V. 2018, arXiv e-prints. https://arxiv.org/abs/1812.05613
- Byrne et al. (2019) Byrne, L., Christensen, C., Tsekitsidis, M., Brooks, A., & Quinn, T. 2019, arXiv e-prints, arXiv:1901.00864. https://arxiv.org/abs/1901.00864
- Carlin et al. (2016) Carlin, J. L., Sand, D. J., Price, P., et al. 2016, ApJ, 828, L5, doi: 10.3847/2041-8205/828/1/L5
- Christensen et al. (2012) Christensen, C., Quinn, T., Governato, F., et al. 2012, MNRAS, 425, 3058, doi: 10.1111/j.1365-2966.2012.21628.x
- Christensen et al. (2014a) Christensen, C. R., Brooks, A. M., Fisher, D. B., et al. 2014a, MNRAS, 440, L51, doi: 10.1093/mnrasl/slu020
- Christensen et al. (2016) Christensen, C. R., Davé, R., Governato, F., et al. 2016, ApJ, 824, 57, doi: 10.3847/0004-637X/824/1/57
- Christensen et al. (2014b) Christensen, C. R., Governato, F., Quinn, T., et al. 2014b, MNRAS, 440, 2843, doi: 10.1093/mnras/stu399
- Clark & Glover (2014) Clark, P. C., & Glover, S. C. O. 2014, MNRAS, 444, 2396, doi: 10.1093/mnras/stu1589
- Corlies et al. (2018) Corlies, L., Johnston, K. V., & Wise, J. H. 2018, MNRAS, 475, 4868, doi: 10.1093/mnras/sty064
- Danieli et al. (2018) Danieli, S., van Dokkum, P., & Conroy, C. 2018, ApJ, 856, 69, doi: 10.3847/1538-4357/aaadfb
- Deason et al. (2015) Deason, A. J., Wetzel, A. R., Garrison-Kimmel, S., & Belokurov, V. 2015, MNRAS, 453, 3568, doi: 10.1093/mnras/stv1939
- Diemand et al. (2005) Diemand, J., Madau, P., & Moore, B. 2005, MNRAS, 364, 367, doi: 10.1111/j.1365-2966.2005.09604.x
- D’Onghia & Lake (2008) D’Onghia, E., & Lake, G. 2008, ApJ, 686, L61, doi: 10.1086/592995
- Dooley et al. (2017a) Dooley, G. A., Peter, A. H. G., Carlin, J. L., et al. 2017a, MNRAS, 472, 1060, doi: 10.1093/mnras/stx2001
- Dooley et al. (2017b) Dooley, G. A., Peter, A. H. G., Yang, T., et al. 2017b, MNRAS, 471, 4894, doi: 10.1093/mnras/stx1900
- Drlica-Wagner et al. (2015) Drlica-Wagner, A., Bechtol, K., Rykoff, E. S., et al. 2015, ApJ, 813, 109, doi: 10.1088/0004-637X/813/2/109
- Erkal et al. (2018) Erkal, D., Belokurov, V., Laporte, C. F. P., et al. 2018, arXiv e-prints, arXiv:1812.08192. https://arxiv.org/abs/1812.08192
- Farber et al. (2018) Farber, R., Ruszkowski, M., Yang, H.-Y. K., & Zweibel, E. G. 2018, ApJ, 856, 112, doi: 10.3847/1538-4357/aab26d
- Fattahi et al. (2016) Fattahi, A., Navarro, J. F., Sawala, T., et al. 2016, MNRAS, 457, 844, doi: 10.1093/mnras/stv2970
- Faucher-Giguère et al. (2009) Faucher-Giguère, C.-A., Lidz, A., Zaldarriaga, M., & Hernquist, L. 2009, ApJ, 703, 1416, doi: 10.1088/0004-637X/703/2/1416
- Fitts et al. (2017) Fitts, A., Boylan-Kolchin, M., Elbert, O. D., et al. 2017, MNRAS, 471, 3547, doi: 10.1093/mnras/stx1757
- Fry et al. (2015) Fry, A. B., Governato, F., Pontzen, A., et al. 2015, MNRAS, 452, 1468, doi: 10.1093/mnras/stv1330
- Garrison-Kimmel et al. (2014) Garrison-Kimmel, S., Boylan-Kolchin, M., Bullock, J. S., & Lee, K. 2014, MNRAS, 438, 2578, doi: 10.1093/mnras/stt2377
- Garrison-Kimmel et al. (2017a) Garrison-Kimmel, S., Bullock, J. S., Boylan-Kolchin, M., & Bardwell, E. 2017a, MNRAS, 464, 3108, doi: 10.1093/mnras/stw2564
- Garrison-Kimmel et al. (2017b) Garrison-Kimmel, S., Wetzel, A., Bullock, J. S., et al. 2017b, MNRAS, 471, 1709, doi: 10.1093/mnras/stx1710
- Garrison-Kimmel et al. (2018) Garrison-Kimmel, S., Hopkins, P. F., Wetzel, A., et al. 2018, arXiv e-prints. https://arxiv.org/abs/1806.04143
- Gill et al. (2004) Gill, S. P. D., Knebe, A., & Gibson, B. K. 2004, MNRAS, 351, 399, doi: 10.1111/j.1365-2966.2004.07786.x
- Glover & Clark (2012) Glover, S. C. O., & Clark, P. C. 2012, MNRAS, 421, 116, doi: 10.1111/j.1365-2966.2011.20260.x
- Gnedin & Kravtsov (2010) Gnedin, N. Y., & Kravtsov, A. V. 2010, ApJ, 714, 287, doi: 10.1088/0004-637X/714/1/287
- Gnedin & Kravtsov (2011) —. 2011, ApJ, 728, 88, doi: 10.1088/0004-637X/728/2/88
- Gnedin et al. (2009a) Gnedin, N. Y., Tassis, K., & Kravtsov, A. V. 2009a, ApJ, 697, 55, doi: 10.1088/0004-637X/697/1/55
- Gnedin et al. (2009b) —. 2009b, ApJ, 697, 55, doi: 10.1088/0004-637X/697/1/55
- Governato et al. (2010) Governato, F., Brook, C., Mayer, L., et al. 2010, Nature, 463, 203, doi: 10.1038/nature08640
- Governato et al. (2012) Governato, F., Zolotov, A., Pontzen, A., et al. 2012, MNRAS, 422, 1231, doi: 10.1111/j.1365-2966.2012.20696.x
- Haardt & Madau (2012) Haardt, F., & Madau, P. 2012, ApJ, 746, 125, doi: 10.1088/0004-637X/746/2/125
- Homma et al. (2018) Homma, D., Chiba, M., Okamoto, S., et al. 2018, PASJ, 70, S18, doi: 10.1093/pasj/psx050
- Hopkins et al. (2014) Hopkins, P. F., Kereš, D., Oñorbe, J., et al. 2014, MNRAS, 445, 581, doi: 10.1093/mnras/stu1738
- Hopkins et al. (2013) Hopkins, P. F., Narayanan, D., & Murray, N. 2013, MNRAS, 432, 2647, doi: 10.1093/mnras/stt723
- Hopkins et al. (2011) Hopkins, P. F., Quataert, E., & Murray, N. 2011, MNRAS, 417, 950, doi: 10.1111/j.1365-2966.2011.19306.x
- Hopkins et al. (2012) —. 2012, MNRAS, 421, 3522, doi: 10.1111/j.1365-2966.2012.20593.x
- Hopkins et al. (2018) Hopkins, P. F., Wetzel, A., Kereš, D., et al. 2018, MNRAS, 480, 800, doi: 10.1093/mnras/sty1690
- Jeon et al. (2017) Jeon, M., Besla, G., & Bromm, V. 2017, ApJ, 848, 85, doi: 10.3847/1538-4357/aa8c80
- Jethwa et al. (2016) Jethwa, P., Erkal, D., & Belokurov, V. 2016, MNRAS, 461, 2212, doi: 10.1093/mnras/stw1343
- Jethwa et al. (2018) —. 2018, MNRAS, 473, 2060, doi: 10.1093/mnras/stx2330
- Kallivayalil et al. (2018) Kallivayalil, N., Sales, L., Zivick, P., et al. 2018, ArXiv e-prints. https://arxiv.org/abs/1805.01448
- Kannan et al. (2018) Kannan, R., Marinacci, F., Simpson, C. M., Glover, S. C. O., & Hernquist, L. 2018, arXiv e-prints. https://arxiv.org/abs/1812.01614
- Katz & White (1993) Katz, N., & White, S. D. M. 1993, ApJ, 412, 455
- Kim & Jerjen (2015) Kim, D., & Jerjen, H. 2015, ApJ, 808, L39, doi: 10.1088/2041-8205/808/2/L39
- Kim et al. (2015) Kim, D., Jerjen, H., Mackey, D., Da Costa, G. S., & Milone, A. P. 2015, ApJ, 804, L44, doi: 10.1088/2041-8205/804/2/L44
- Kim et al. (2014) Kim, J.-h., Abel, T., Agertz, O., et al. 2014, ApJS, 210, 14, doi: 10.1088/0067-0049/210/1/14
- Kim et al. (2016) Kim, J.-h., Agertz, O., Teyssier, R., et al. 2016, ApJ, 833, 202, doi: 10.3847/1538-4357/833/2/202
- Knollmann & Knebe (2009) Knollmann, S. R., & Knebe, A. 2009, ApJS, 182, 608, doi: 10.1088/0067-0049/182/2/608
- Koposov et al. (2015) Koposov, S. E., Belokurov, V., Torrealba, G., & Evans, N. W. 2015, ApJ, 805, 130, doi: 10.1088/0004-637X/805/2/130
- Krumholz (2012) Krumholz, M. R. 2012, ApJ, 759, 9, doi: 10.1088/0004-637X/759/1/9
- Krumholz & Gnedin (2011) Krumholz, M. R., & Gnedin, N. Y. 2011, ApJ, 729, 36, doi: 10.1088/0004-637X/729/1/36
- Krumholz et al. (2011) Krumholz, M. R., Leroy, A. K., & McKee, C. F. 2011, ApJ, 731, 25, doi: 10.1088/0004-637X/731/1/25
- Krumholz et al. (2008) Krumholz, M. R., McKee, C. F., & Tumlinson, J. 2008, ApJ, 689, 865, doi: 10.1086/592490
- Krumholz et al. (2009) —. 2009, ApJ, 693, 216, doi: 10.1088/0004-637X/693/1/216
- Kuhlen et al. (2012) Kuhlen, M., Krumholz, M. R., Madau, P., Smith, B. D., & Wise, J. 2012, ApJ, 749, 36, doi: 10.1088/0004-637X/749/1/36
- Kuhlen et al. (2013) Kuhlen, M., Madau, P., & Krumholz, M. R. 2013, ApJ, 776, 34, doi: 10.1088/0004-637X/776/1/34
- Laporte et al. (2018) Laporte, C. F. P., Gómez, F. A., Besla, G., Johnston, K. V., & Garavito-Camargo, N. 2018, MNRAS, 473, 1218, doi: 10.1093/mnras/stx2146
- Li et al. (2018) Li, T. S., Simon, J. D., Pace, A. B., et al. 2018, ApJ, 857, 145, doi: 10.3847/1538-4357/aab666
- Li & Helmi (2008) Li, Y.-S., & Helmi, A. 2008, MNRAS, 385, 1365, doi: 10.1111/j.1365-2966.2008.12854.x
- Lin & Ishak (2016) Lin, W., & Ishak, M. 2016, J. Cosmology Astropart. Phys, 10, 025, doi: 10.1088/1475-7516/2016/10/025
- Luque et al. (2017) Luque, E., Pieres, A., Santiago, B., et al. 2017, MNRAS, 468, 97, doi: 10.1093/mnras/stx405
- Mac Low & Glover (2012) Mac Low, M.-M., & Glover, S. C. O. 2012, ApJ, 746, 135, doi: 10.1088/0004-637X/746/2/135
- McConnachie (2012) McConnachie, A. W. 2012, AJ, 144, 4, doi: 10.1088/0004-6256/144/1/4
- Menon et al. (2015) Menon, H., Wesolowski, L., Zheng, G., et al. 2015, Computational Astrophysics and Cosmology, 2, 1, doi: 10.1186/s40668-015-0007-9
- Munshi et al. (2017) Munshi, F., Brooks, A. M., Applebaum, E., et al. 2017, ArXiv e-prints. https://arxiv.org/abs/1705.06286
- Munshi et al. (2013) Munshi, F., Governato, F., Brooks, A. M., et al. 2013, ApJ, 766, 56, doi: 10.1088/0004-637X/766/1/56
- Murray et al. (2011) Murray, N., Ménard, B., & Thompson, T. A. 2011, ApJ, 735, 66, doi: 10.1088/0004-637X/735/1/66
- Nelson et al. (2018) Nelson, D., Pillepich, A., Springel, V., et al. 2018, MNRAS, 475, 624, doi: 10.1093/mnras/stx3040
- Newton et al. (2018) Newton, O., Cautun, M., Jenkins, A., Frenk, C. S., & Helly, J. C. 2018, MNRAS, 479, 2853, doi: 10.1093/mnras/sty1085
- Nichols et al. (2011) Nichols, M., Colless, J., Colless, M., & Bland-Hawthorn, J. 2011, ApJ, 742, 110, doi: 10.1088/0004-637X/742/2/110
- Oñorbe et al. (2015) Oñorbe, J., Boylan-Kolchin, M., Bullock, J. S., et al. 2015, MNRAS, 454, 2092, doi: 10.1093/mnras/stv2072
- Oñorbe et al. (2017) Oñorbe, J., Hennawi, J. F., & Lukić, Z. 2017, ApJ, 837, 106, doi: 10.3847/1538-4357/aa6031
- Pace & Li (2018) Pace, A. B., & Li, T. S. 2018, ArXiv e-prints. https://arxiv.org/abs/1806.02345
- Pallottini et al. (2017) Pallottini, A., Ferrara, A., Bovino, S., et al. 2017, MNRAS, 471, 4128, doi: 10.1093/mnras/stx1792
- Patel et al. (2018) Patel, E., Carlin, J. L., Tollerud, E. J., Collins, M. L. M., & Dooley, G. A. 2018, MNRAS, 480, 1883, doi: 10.1093/mnras/sty1946
- Peñarrubia et al. (2010) Peñarrubia, J., Benson, A. J., Walker, M. G., et al. 2010, MNRAS, 406, 1290, doi: 10.1111/j.1365-2966.2010.16762.x
- Peñarrubia et al. (2016) Peñarrubia, J., Gómez, F. A., Besla, G., Erkal, D., & Ma, Y.-Z. 2016, MNRAS, 456, L54, doi: 10.1093/mnrasl/slv160
- Pontzen et al. (2008) Pontzen, A., Governato, F., Pettini, M., et al. 2008, MNRAS, 390, 1349, doi: 10.1111/j.1365-2966.2008.13782.x
- Rashkov et al. (2012) Rashkov, V., Madau, P., Kuhlen, M., & Diemand, J. 2012, ApJ, 745, 142, doi: 10.1088/0004-637X/745/2/142
- Read et al. (2016) Read, J. I., Agertz, O., & Collins, M. L. M. 2016, MNRAS, 459, 2573, doi: 10.1093/mnras/stw713
- Read et al. (2017) Read, J. I., Iorio, G., Agertz, O., & Fraternali, F. 2017, MNRAS, 467, 2019, doi: 10.1093/mnras/stx147
- Robertson & Kravtsov (2008) Robertson, B. E., & Kravtsov, A. V. 2008, ApJ, 680, 1083, doi: 10.1086/587796
- Saitoh et al. (2008) Saitoh, T. R., Daisaka, H., Kokubo, E., et al. 2008, PASJ, 60, 667. https://arxiv.org/abs/0802.0961
- Salem et al. (2016) Salem, M., Bryan, G. L., & Corlies, L. 2016, MNRAS, 456, 582, doi: 10.1093/mnras/stv2641
- Sales et al. (2011) Sales, L. V., Navarro, J. F., Cooper, A. P., et al. 2011, MNRAS, 418, 648, doi: 10.1111/j.1365-2966.2011.19514.x
- Sales et al. (2017) Sales, L. V., Navarro, J. F., Kallivayalil, N., & Frenk, C. S. 2017, MNRAS, 465, 1879, doi: 10.1093/mnras/stw2816
- Sales et al. (2013) Sales, L. V., Wang, W., White, S. D. M., & Navarro, J. F. 2013, MNRAS, 428, 573, doi: 10.1093/mnras/sts054
- Santos-Santos et al. (2018) Santos-Santos, I. M., Di Cintio, A., Brook, C. B., et al. 2018, MNRAS, 473, 4392, doi: 10.1093/mnras/stx2660
- Sawala et al. (2013) Sawala, T., Frenk, C. S., Crain, R. A., et al. 2013, MNRAS, 431, 1366, doi: 10.1093/mnras/stt259
- Sawala et al. (2015) Sawala, T., Frenk, C. S., Fattahi, A., et al. 2015, MNRAS, 448, 2941, doi: 10.1093/mnras/stu2753
- Sawala et al. (2016) —. 2016, MNRAS, 457, 1931, doi: 10.1093/mnras/stw145
- Schaye et al. (2015) Schaye, J., Crain, R. A., Bower, R. G., et al. 2015, MNRAS, 446, 521, doi: 10.1093/mnras/stu2058
- Schewtschenko & Macciò (2011) Schewtschenko, J. A., & Macciò, A. V. 2011, MNRAS, 413, 878, doi: 10.1111/j.1365-2966.2010.18179.x
- Semenov et al. (2016) Semenov, V. A., Kravtsov, A. V., & Gnedin, N. Y. 2016, ApJ, 826, 200, doi: 10.3847/0004-637X/826/2/200
- Semenov et al. (2018) —. 2018, ApJ, 861, 4, doi: 10.3847/1538-4357/aac6eb
- Sharma & Nath (2012) Sharma, M., & Nath, B. B. 2012, ApJ, 750, 55, doi: 10.1088/0004-637X/750/1/55
- Shen et al. (2014) Shen, S., Madau, P., Conroy, C., Governato, F., & Mayer, L. 2014, ApJ, 792, 99, doi: 10.1088/0004-637X/792/2/99
- Shen et al. (2010) Shen, S., Wadsley, J., & Stinson, G. 2010, MNRAS, 407, 1581, doi: 10.1111/j.1365-2966.2010.17047.x
- Simpson et al. (2016) Simpson, C. M., Pakmor, R., Marinacci, F., et al. 2016, ApJ, 827, L29, doi: 10.3847/2041-8205/827/2/L29
- Sternberg et al. (2014) Sternberg, A., Le Petit, F., Roueff, E., & Le Bourlot, J. 2014, ApJ, 790, 10, doi: 10.1088/0004-637X/790/1/10
- Stinson et al. (2006) Stinson, G., Seth, A., Katz, N., et al. 2006, MNRAS, 373, 1074, doi: 10.1111/j.1365-2966.2006.11097.x
- Stinson et al. (2010) Stinson, G. S., Bailin, J., Couchman, H., et al. 2010, MNRAS, 408, 812, doi: 10.1111/j.1365-2966.2010.17187.x
- Thompson et al. (2005) Thompson, T. A., Quataert, E., & Murray, N. 2005, ApJ, 630, 167, doi: 10.1086/431923
- Tollerud et al. (2008) Tollerud, E. J., Bullock, J. S., Strigari, L. E., & Willman, B. 2008, ApJ, 688, 277, doi: 10.1086/592102
- Tollerud & Peek (2018) Tollerud, E. J., & Peek, J. E. G. 2018, ApJ, 857, 45, doi: 10.3847/1538-4357/aab3e4
- Tremmel et al. (2017) Tremmel, M., Karcher, M., Governato, F., et al. 2017, MNRAS, 470, 1121, doi: 10.1093/mnras/stx1160
- Vogelsberger et al. (2013) Vogelsberger, M., Genel, S., Sijacki, D., et al. 2013, MNRAS, 436, 3031, doi: 10.1093/mnras/stt1789
- Wadsley et al. (2017) Wadsley, J. W., Keller, B. W., & Quinn, T. R. 2017, MNRAS, 471, 2357, doi: 10.1093/mnras/stx1643
- Walsh et al. (2009) Walsh, S. M., Willman, B., & Jerjen, H. 2009, AJ, 137, 450, doi: 10.1088/0004-6256/137/1/450
- Wang et al. (2015) Wang, L., Dutton, A. A., Stinson, G. S., et al. 2015, MNRAS, 454, 83, doi: 10.1093/mnras/stv1937
- Weisz et al. (2014a) Weisz, D. R., Dolphin, A. E., Skillman, E. D., et al. 2014a, ApJ, 789, 147, doi: 10.1088/0004-637X/789/2/147
- Weisz et al. (2014b) —. 2014b, ApJ, 789, 148, doi: 10.1088/0004-637X/789/2/148
- Wheeler et al. (2015) Wheeler, C., Oñorbe, J., Bullock, J. S., et al. 2015, MNRAS, 453, 1305, doi: 10.1093/mnras/stv1691
- Wheeler et al. (2018) Wheeler, C., Hopkins, P. F., Pace, A. B., et al. 2018, arXiv e-prints. https://arxiv.org/abs/1812.02749
- Wise et al. (2012) Wise, J. H., Abel, T., Turk, M. J., Norman, M. L., & Smith, B. D. 2012, MNRAS, 427, 311, doi: 10.1111/j.1365-2966.2012.21809.x
- Wright et al. (2018) Wright, A. C., Brooks, A. M., Weisz, D. R., & Christensen, C. R. 2018, ArXiv e-prints. https://arxiv.org/abs/1802.03019
- Yozin & Bekki (2015) Yozin, C., & Bekki, K. 2015, MNRAS, 453, 2302, doi: 10.1093/mnras/stv1828
- Zolotov et al. (2012) Zolotov, A., Brooks, A. M., Willman, B., et al. 2012, ApJ, 761, 71. https://arxiv.org/abs/1207.0007