Delocalization for the 3–D discrete random Schrödinger operator at weak disorder
Abstract.
We apply a recently developed approach [18] to study the existence of extended states for the three dimensional discrete random Schrödinger operator at small disorder. The conclusion of delocalization at small disorder agrees with other numerical and experimental observations (see e.g. [17]). Further the work furnishes a verification of the numerical approach and its implementation.
Not being based on scaling theory, this method eliminates problems due to boundary conditions, common to previous numerical methods in the field. At the same time, as with any numerical experiment, one cannot exclude finite-size effects with complete certainty. Our work can be thought of as a new and quite different use of Lanczos’ algorithm; a posteriori tests to show that the orthogonality loss is very small.
We numerically track the “bulk distribution” (here: the distribution of where we most likely find an electron) of a wave packet initially located at the origin, after iterative application of the discrete random Schrödinger operator.
Key words and phrases:
Discrete random Schrödinger operator, Anderson localization, Extended states, Lanczos algorithm2010 Mathematics Subject Classification:
47A16, 47B80, 81Q101. Introduction
Consider the discrete three dimensional Schrödinger operator, given by:
| (1) |
when is of the form , and consider an element of given by
Let the random variables be i.i.d. with uniform distribution in , i.e. according to the probability distribution .
The 3–D random discrete Schrödinger operator, formally given by
is the main object of study.
This operator has been studied extensively, see e.g. [16, 25] and the references therein. The first part of the operator describes the movement of an electron inside a crystal with atoms located at all integer lattice points . The perturbation can be interpreted as having the atoms randomly displaced around the lattice points. It is important to notice that the perturbation is almost surely non-compact, so that classical perturbation theory (e.g. Kato–Rosenblum Theorem, which states the invariance of the absolutely continuous spectrum under compact perturbations) cannot be applied almost surely. It is known that the absolutely continuous spectrum is deterministic, i.e. it occurs with probability one or zero, see e.g. [19]. Localization in the sense of exponentially decaying eigenfunctions was proved analytically for disorders above some threshold (see e.g. [2], [9], and [25]). Currently, the smallest threshold in 3 dimensions is (see Table 1 in [21]).
Diffusion is expected but not proved for small disorder . We numerically determine a regime of disorders for which the three dimensional discrete random Schrödinger operator does not exhibit localization. Our calculations are based on the Lanczos algorithm [13] for determining orthogonal bases for Krylov spaces [27]. Although we are not the first to use this method (see e.g. [17, 23] and the references therein), our application of it is quite different. In particular, our method is not based on scaling theory (for further discussion see [18]). In [20], the Lanczos algorithm is employed to compute a set of eigenvalues and eigenvectors. However, we test for localization without computing eigenvalues or eigenvectors, but only compute the distance between and the orbit of . The orbit is the span of , which is exactly a Krylov subspace. At each step of the Lanczos iteration, we use the orthogonality of the generated vectors to update the distance of interest. In this way, we maintain the low memory cost of a three-term recurrence, bypassing the need to store any eigenvectors at all. In addition to this, we have performed some a posteriori tests of the Lanczos algorithm on smaller cases to measure the degree to which orthogonality may be lost.
Besides computational advantages, our approach also offers a different mathematical perspective. By utilizing eigenvectors, it is (tacitly) assumed that all spectral points are in fact eigenvalues, while our approach merely generates an orbit without attempting to rule out other kinds of spectral points.
While the contributions of this paper are numeric, the method (see [18]) provides an explicit analytic expression, which may yield a proof of the following numerically supported Main Result.
Main Result 1.1.
For disorder , numerical experiments indicate that the three dimensional discrete random Schrödinger operator does not exhibit Anderson localization with positive probability, in the sense that it has non-zero absolutely continuous spectrum with probability 1. (In particular, we do not have what is usually referred to as “strong dynamical localization” implying delocalization in most or even all of the other senses, see [12].)
The key analytical tool to our method is stated in Proposition 2.1 below. Section 3 is devoted to a description of the numerical experiment. The numerical testing criterion we applied is given by Numerical Criterion 3.1 below. Our numerical findings and the conclusions can be found in Section 4. In Subsections 4.1 and 4.2, we study the averaged data and find further numerical validation of our method. In Section 5 we verify the performance of the method in many examples. In Subsection 5.3, we present the distribution of energies after repeated application of the random operator of a wave packet initially located at the origin. We briefly remark on computing and memory requirements in Section 6.
2. Preliminaries
2.1. Singular and absolutely continuous parts of normal operators
Recall that an operator in a separable Hilbert space is called normal if . By the spectral theorem operator is unitarily equivalent to , multiplication by the independent variable , in a direct sum of Hilbert spaces
where is a scalar positive measure on , called a scalar spectral measure of .
If is a unitary or self-adjoint operator, its spectral measure is supported on the unit circle or on the real line, respectively. Via Radon decomposition, can be decomposed into a singular and absolutely continuous parts . The singular component can be further split into singular continuous and pure point parts. For unitary or self-adjoint we denote by the restriction of to its absolutely continuous part, i.e. is unitarily equivalent to Similarly, define the singular, singular continuous and the pure point parts of , denoted by , and , respectively.
2.2. Key tool
As mentioned above delocalization is deterministic. Therefore demonstrating that it does not occur with probability zero is sufficient to determine delocalization.
This following result makes our numerical experiment possible as it suffices to check the evolution of only one vector through repeated operations by the Anderson Hamiltonian and 3 dimensional random Schrödinger operator.
Fix the vectors and , i.e. 3–tensors with zero entries, except for the position and the position, respectively, which equal .
Notice that
| (2) |
describes the distance between the unit vector and the subspace obtained taking the closure of the span of the vectors .
In numerical linear algebra, this space is called a Krylov subspace, and the Lanczos algorithm [13] provides a classical approach for finding an orthonormal basis. Our distance calculation (2) relies on the orthogonality of these vectors, iteratively updating the distance with each new Krylov vector.
Proposition 2.1.
Consider the discrete random Schrödinger operator given by equation (1). Let , , be i.i.d. random variables with uniform (Lebesgue) distribution on , . To prove delocalization (i.e. the existence of absolutely continuous spectrum with positive probability), it suffices to find for which the distance
| (3) |
with non-zero probability. (Notice that the limit exists by the monotone convergence theorem.)
The proposition follows immediately from Theorems 1.1 and 1.2 of [14] and is stated in more generality in [18].
Remark 2.2.
The converse of Proposition 2.1 is not true. And we cannot draw any conclusions, if the distance between a fixed (unit) vector and the subspace generated by the orbit of another vector tends to zero. In particular, we cannot conclude that there must be localization. Even if we show (3) for many or ‘all’ vectors (instead of just ), it could be possible that the absolutely continuous part has multiplicity one and that is cyclic, that is, .
3. Method of numerical experiment
Consider the discrete Schrödinger operator given by (1) with random variable distributed according to the hypotheses of Proposition 2.1.
By Proposition 2.1, we obtain delocalization if we can find for which (3) happens with non-zero probability. Let us now explain precisely how we verify delocalization numerically, leading up to the Numerical Criterion 3.1 below.
In the numerical experiment, we initially fix and fix one computer-generated realization of the random variable (with distribution in accordance to the hypotheses of Proposition 2.1). We then calculate the distances for .
Assuming that we know for , let us find a lower estimate for the limit
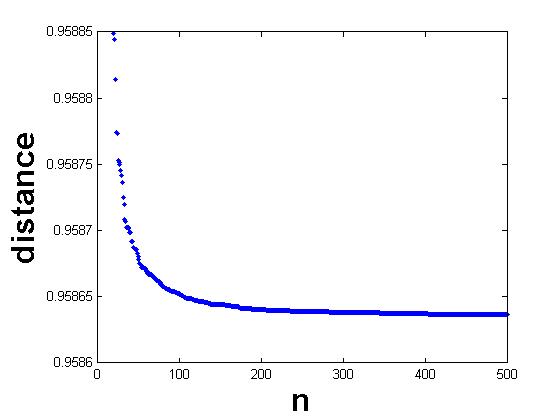
Figure 1 displays a typical trend for the distance as increases. Because the first points were irregular and do not contribute to the above limit, they were omitted. Notice that the graph is decreasing, as is expected. Although it certainly appears that the limit does not go to 0, the graph could have logarithmic decay, approaching zero very slowly. To attain an estimate for , which excludes the case of such slow decay, we re-scaled the graph by , , so that the x-axis is inverted and the intercept, , of a line of best fit will estimate .
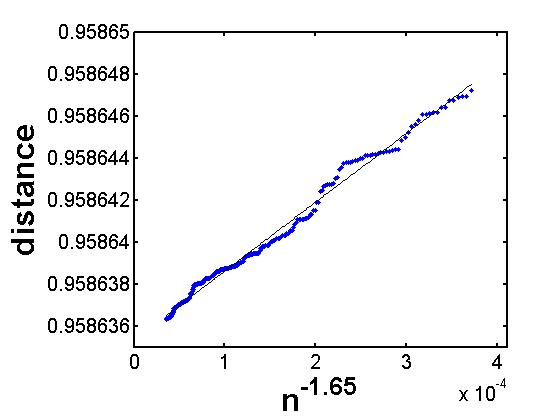
Figure 2 shows the re-scaled graph for . Subsection 3.1 describes the choice of and why, for small values of , does not decay to 0.
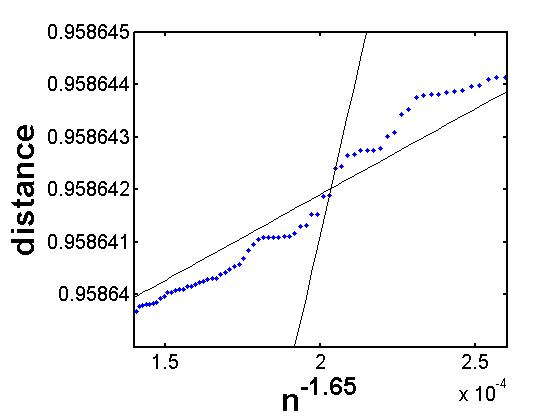
Since an approximating line is only an estimate, for further confidence in our results, we also calculated the minimum intercept of all lines through two consecutive points and call it (see the steep line in Figure 3). This is essentially the “worst case,” and ought to underestimate , yielding the relationship
We repeated this process for many values of and multiple, different, computer-generated instances of the random variable . We took the minimum of and across all instances of , with the intent to demonstrate that is above 0 for many different .
In order to give confidence to our calculations to account for random error occurring in the computer, we introduce the following restrictions even though Proposition 2.1 only requires that .
Numerical Criterion 3.1.
3.1. Choice of the re-scaling parameter
For each fixed and , the re-scaling exponent is chosen so that the re-scaled graph of the distance function (see Figure 2) satisfies the least square property; that is, the error with respect to square–norm when approximating the graph by a line is minimal. With this exponent we then find the corresponding linear approximation for the re-scaled distance function.
To find optimal , we used the mesh . Below is a table, see equation (8), for many values of , giving the percentage of usable trials (those for which an optimal was found) for each value of . Trials are not usable if the re-scaling parameter yields a concave graph. If this happens, we do not obtain any information (according to Remark 2.2). See Figure 4 below. Note that a small value () of is “bad”, since the graph rescaled with will be concave, and thus it is not expected for a line of best fit to underestimate the limit of the distance.
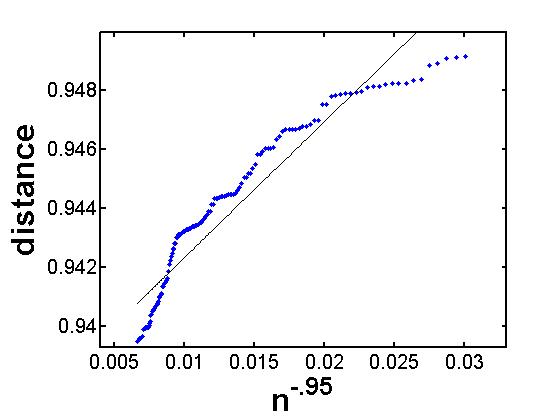
A positive re-scaling factor implies that the graph in Figure 1 will not decay to zero. Indeed, using a re-scaling factor smaller than the optimal one will result in a convex graph for the distances . And the intercept of the line lies below the value expected for .
4. Conclusions
As mentioned in Section 3, for a fixed we chose many realizations . For every value of , we took the minimum of the resulting quantities for and (the intercept of the approximating line and the minimum intercept of the lines passing through any two consecutive points, respectively).
We present our observations for the Numerical Criterion 3.1 for . For fixed disorder, we will comment in Subsection 4.1 on the re-scaling parameters of averages over the distances , and .
The following tables (8) document the data obtained for n=200 by taking 15 realizations for each between and , and 4 realizations for each and . By we denote the probability of finding a re-scaling factor .
| (8) |
While for some , we have the difference between and is relatively large, which means that the line from taking the least square approximation is likely not a good approximation for the distances.
We also repeated the experiment for and the tables in equation (13) below documents the findings. In these trials, the first 119 entries were removed instead of the first 44, as in the case. This larger crop makes the data more stable by giving better estimates for and and by more consistently finding a usable rescaling factor . We ran 13 trials for and 4 trials for all other values.
| (13) |
A good rescaling factor was found for all 143 of the trials for and all satisfy Criterion 3.1, an improvement from the case. Hence the final conclusion of this numerical experiment is precisely the Main Result 1.1. According to Remark 2.2 and Criterion 3.1, for , we do not have any conclusion.
4.1. Averages
In the tables in equation (18) below, for each fixed , we averaged the distances , , of all our realizations. For those averaged distances, we determined the re-scaling parameters , as well as and in analogy. The significance of our findings is that the re-scaling factors are “roughly” decreasing and rather well-behaved for . For larger disorder, becomes even less stable, and can’t even be found for large enough disorder.
| (18) |
In equation (23) below we document the analogous quantities for the trials. Note that there is no rescaling factor for , while there is for that in the trials. The data sets are not related to each other, aside from sharing the same disorder .
| (23) |
4.2. Comparing with .
The data gave better results than the data. The probability of finding a useable rescaling factor for was higher than that of for all but two values of . The average rescaling factor was similar between the two data sets. Finally, was smaller for the data for small , suggesting that the approximation given by is better.
5. Further validation of the method and the numerical experiments
Apart from the usual tests (the program is running stably, checking all subroutines, many verifications for small ), we have conducted the following tests. Most important is the a posteriori test of orthogonality in the Lanczos algorithm in subsection 5.4.
5.1. Free discrete three dimensional Schrödinger operator
When we apply the free discrete Schrödinger operator to the vector , it immediately becomes clear that as well as all vectors , , are symmetric with respect to the origin. In dimension , it is not hard to see that the distance between and the orbit of under is at least . Indeed, we have
where
the eight vertices of the length 2 cube centered at .
In the experiments for the free discrete two dimensional Schrödinger operator we obtained a intercept of the approximating line approximately equals . The re-scaled graph of distances still had a convex shape, so the actual distance as would be bigger. In fact, we have extracted our data an upper estimate of . Therefore, the distance must lie in the interval .
5.2. Orthogonalization Process
The case shows a decrease in distance on only every other step. The symmetry caused by the absence of random perturbations means the 3-tensor after orthogonalization has alternating diamonds of zero and nonzero entries radiating from the origin, meaning the distance decreases every second application of the operator, when there is a nonzero entry in the position.
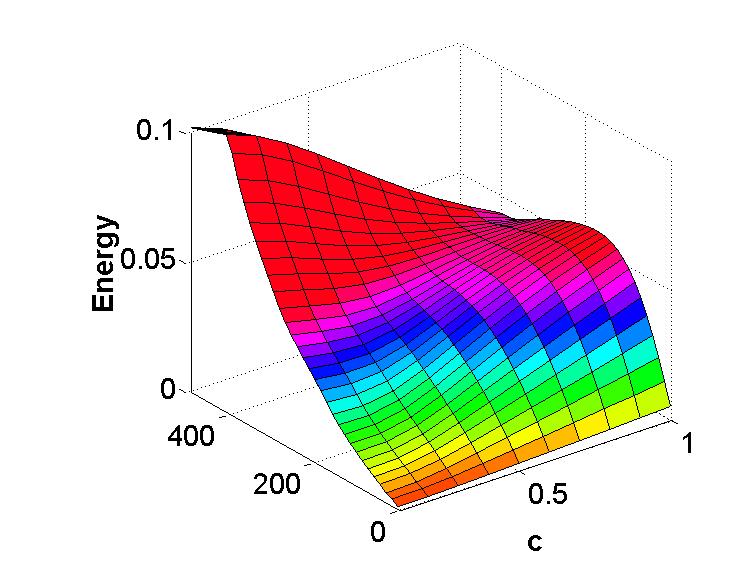
5.3. Evolution under of the bulk for small values of
We observe the bulk distribution which determines the distance from the origin where we are most likely to find an electron. Here, distance is measured by the taxicab method, so elements of the same distance form a diamond in the 3-D integer lattice. The bulk at this distance is the Euclidean norm of the elements constituting the diamond.
To be precise, we consider the elements of the vector and define
| (24) |
for the bulk of the vector at taxicab distance from the origin. Here refers to the entry of the tensor . Slightly abusing notation, we normalize and use the same notation for the normalized sequence of vectors.
Figure 5 is the result of averaging four sets of data for values of ranging from to . As expected, the energy remains closer to the origin as disorder increases.
5.4. Lanczos and orthogonality
The Lanczos algorithm is known to lose orthogonality in many instances, which could cast doubt on our distance calculations. To test the accuracy for our problem, we stored the entire Krylov subspace generated on a smaller problem instance () and stored these as columns of a matrix . The quantity should deviate with zero in proportion to the loss of orthogonality. In Tables (27) and (30), we measure the matrix norm for realizations for several cases of near the critical value. We see that the Krylov vectors in these cases are in fact quite close to orthogonal especially for , although the orthogonality seems to decrease as grows.
| (27) |
| (30) |
6. On computing and memory requirements
Using methodology similar to that in [18], all of the information contained in the 3-tensor is stored in one information vector. For this method, because of how the Hamiltonian acts, it is important for computing purposes that each point in the 3-tensor is stored in a position such that its neighbors along a coordinate axis are a consistent distance from that point in the vector. This methodology allows the vector to be half the size necessary for containing every point in a 3-tensor, but still approximately twice as large as is necessary. In order to explore localization in higher dimensions, a more efficient method is needed since a generalization of this code for dimension has time complexity .
After prototyping our approach in MATLAB, we translated the code into FORTRAN90. This allowed us a smaller memory footprint and hence larger and more efficient runs. We then wrapped this routine into Python using the f2py package [22]. By doing so, we were able to run several cases concurrently on our workstation by using Python’s multiprocessing module.
Our simulations were run on a Dell Precision workstation with dual
eight-core Intel Xeon E5-2680 processors running at 2.7GHz with 128GB of
RAM. We used gfortran version 4.4.7 with flags
-O3 -ftree-vectorizer-verbose=2 -msse2 -funroll-loops
-ffast-math,
which, among other optimizations, enables
instruction-level superscalar parallelism.
7. Further Projects
An immediate area for further exploration would be to consider various geometries, rather than simply the n-dimensional lattice. One geometry of interest is the Sierpinski gasket, starting at one corner and building the various triangles as increases. Preliminary results indicate that a program modeling the free random Schrödinger operator on this geometry should run with time complexity
References
- [1] M. Aizenamn, G. M. Graf, Localization bounds for an electron. J. Phys. A: Math. Gen. 31 (1998), 6783–6806.
- [2] M. Aizenman, S. Molchanov, Localization at large disorder and at extreme energies: An elementary derivation, Comm. Math. Phys. 157 (1993), no. 2, 245–278.
- [3] P. W. Anderson, Absence of Diffusion in Certain Random Lattices, Phys. Rev., 109 (1958), 1492–1505.
- [4] M. S. Birman, M. Z. Solomjak, Spectral theory of self-adjoint operators in Hilbert space, 1986.
- [5] R. Carmona, J. Lacroix, Spectral theory of random Schrödinger operators, Birkhäuser, 1990.
- [6] H. Cycon, R. Froese, W. Kirsh, B. Simon, Topics in the Theory of Schrödinger Operators, Springer Verlag, 1987.
- [7] R. del Rio, S. Jitomirskaya, Y. Last, B. Simon, Operators with singular continuous spectrum. IV. Hausdorff dimensions, rank-one perturbations, and localization, J. Anal. Math. 69 (1996), 153–200. MR 1428099 (97m:47002)
- [8] A. Figotin, L. Pastur, Spectral properties of disordered systems in the one-body approximation, Springer Verlag, 1991.
- [9] J. Fröhlich, T. Spencer, Absence of Diffusion in the tight binding model for large disorder of low energy, Commun. Math. Phys. 88 (1983), 151–184.
- [10] F. Germinet, A. Klein, J. H. Schenker, Dynamical delocalization in random Landau Hamiltonians, Ann. of Math. (2) 166 (2007), no. 1, 215–244. MR 2342695 (2008k:82060)
- [11] F. Ghribi, P. D. Hislop, F. Klopp, Localization for Schrödinger operators with random vector potentials, 447 (2007), 123–138. MR 2423576 (2009d:82067)
- [12] D. Hundertmark, A short introduction to Anderson localization, Analysis and stochastics of growth processes and interface models, 194–218, Oxford Univ. Press, Oxford, 2008. MR 2603225 (2011c:82038)
- [13] C. Lanczos, An iteration method for the solution of the eigenvalue problem of linear differential and integral operators, United States Governm. Press Office 1950.
- [14] by same author, Simplicity of singular spectrum in Anderson-type Hamiltonians, Duke Math. J. 133 (2006), no. 1, 185–204. MR 2219273 (2007g:47062)
- [15] T. Kato, Perturbation theory for linear operators, Classics in Mathematics, Springer Verlag, Berlin, 1995, Reprint of the 1980 edition. MR 1335452 (96a:47025)
- [16] W. Kirsh, An invitation to random Schrödinger operators, Panoramas et synthèses 25 (2008), 1–119.
- [17] A. Lagendijk, B. van Tigglen, D.S. Wiersma, Fifty years of Anderson localization, Physics Today 82 Featured article (August 2009) no. 8, 24–29.
- [18] C. Liaw, Approach to the Extended States Conjecture. Journal of Statistical Physics, 153 (2013) no. 6, 1022–1038.
- [19] C. Liaw, Deterministic spectral properties of Anderson-type Hamiltonians. For preprint see arXiv:1009.1353.
- [20] O. Schenk, M. Bollhöfer, R.A. Römer, On large-scale diagonalization techniques for the Anderson model of localization. SIAM review 50.1 (2008) 91–112.
- [21] J. Schenker, How large is large? Estimating the critical disorder for the Anderson model. For preprint see arXiv-math:1305.6987v1.
- [22] P. Peterson, F2PY: a tool for connecting Fortran and Python programs, International Journal of Computational Science and Engineering 4 (2009), no. 4, 296–305.
- [23] J. Stein, U. Krey, Numerical Studies on the Anderson Localization Problem, Zeitschrift Für Physik B 34 (1979), 287–296.
- [24] B. Simon, Cyclic vectors in the Anderson model, Rev. Math. Phys. 6 (1994), no. 5A, 1183–1185, Special issue dedicated to Elliott H. Lieb. MR 1301372 (95i:82058)
- [25] by same author, Spectral analysis of rank-one perturbations and applications, Mathematical Quantum Theory I: Field Theory and Many-Body Theory (1994).
- [26] B. Simon and T. Wolff, Singular continuous spectrum under rank-one perturbations and localization for random Hamiltonians, Comm. Pure Appl. Math., 39 (1986), no. 1, 75–90. MR 820340 (87k:47032).
- [27] L. N. Trefethen and D. Bau, Numerical linear algebra, SIAM (1997).