Detecting Priming News Events
Abstract
We study a problem of detecting priming events based on a time series index and an evolving document stream. We define a priming event as an event which triggers abnormal movements of the time series index, i.e., the Iraq war with respect to the president approval index of President Bush. Existing solutions either focus on organizing coherent keywords from a document stream into events or identifying correlated movements between keyword frequency trajectories and the time series index. In this paper, we tackle the problem in two major steps. (1) We identify the elements that form a priming event. The element identified is called influential topic which consists of a set of coherent keywords. And we extract them by looking at the correlation between keyword trajectories and the interested time series index at a global level. (2) We extract priming events by detecting and organizing the bursty influential topics at a micro level. We evaluate our algorithms on a real-world dataset and the result confirms that our method is able to discover the priming events effectively.
1 Introduction
With the increasing text information published on the news media and social network websites, there are lots of events emerging every day. Among these various events, there are only a few that are priming and can make significant changes to the world. In this paper, we measure the priming power of the events based on some popular index that people are usually concerned with.
Governor’s Approval Index Every activity of the governor can generate reports in the news media and discussions on the web. However only a few of them will change people’s attitude towards this governor and pose impacts on his/her popularity, i.e., approval index [12]. Since these approval indices are the measures of the satisfaction of citizens and crucial for the government, people would be more interested in knowing the events that highly affect the approval index than those with little impact.
Financial Market Index There are a lot of events related to the company or the stock market happening while only some of them would change the valuation of the company in investors’ mind. The greedy/fear will drive them to buy/sell the stock and eventually change the stock index. Therefore, the investors will be eager to know and monitor these events as they happen.
These real world cases indicate that there is a need to find out the priming events which drive an interested time series index. Such priming events are able to help people understand what is going on in the world. However, the discovery of such priming events poses great challenges: 1) with the tremendous number of news articles over time, how could we identify and organize the events related to a time series index; 2) several related events may emerge together at the same time, how can we distinguish their impact and discover the priming ones; 3) as time goes by, how could we track the life cycle of the priming events, as well as their impact on the evolving time series index.
Some existing work has focused on discovering a set of topics/events from the text corpus [1, 6] and tracking their life cycle [13]. But these methods make no effort to guarantee these events are influential and related to the index that people are concerned with. There is another stream of work considering the relationship between the keyword trajectory and interested time series [9, 22, 18]. However, these work can only identify a list of influential keywords for users and do not consider to organize these words into some high level meaningful temporal patterns (i.e., events).
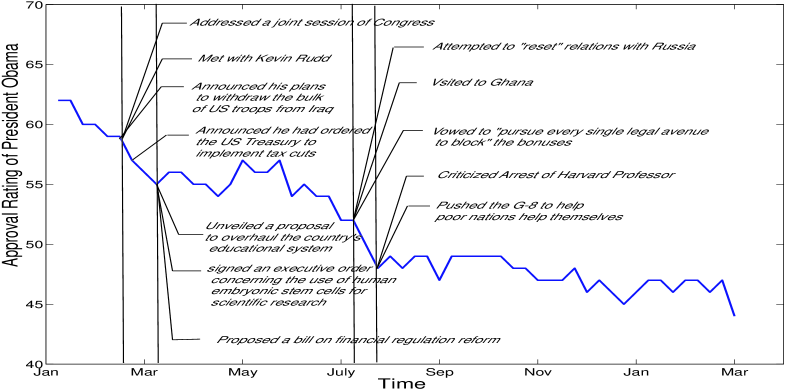
In this paper, we study the problem of detecting priming events from a time series index and an evolving document stream. In Figure 1, we take the weekly approval index of US President Obama from Jan 20, 2009 to Feb 28, 2010 as an example to illustrate the difficulty of this problem. In Figure 1, the approval index (blue line) evolves and drops from 67% to 45% in the last 56 weeks. Particularly, in July, 2009, the index dropped from 54% to 48%. For a user who is interested in politics and wants to know what event trigger this significant change, he/she may issue a query “President Obama” to the search engine. But the result will only be a list of news articles indicating the events that President Obama participates in during these periods. In Figure 1, we tag a small part of them on the index. As we can see, in July, 2009, there are 5 events including his attempt to reset relationship with Russia, help pool nations, visit Ghana etc. Only with this information, we cannot fulfill the user’s need since we cannot differentiate the role that each event plays to change the approval index in that time period. This urges us to think about the following questions. What makes an event priming? Does it contain some elements which will attract public eyes and change their mind? Besides, if such elements do exist, could we find their existence evidence from other time period and use them to justify the importance of the local event containing them?
In this paper, we call such elements influential topics and use them as basic units to form a priming event. Specifically, we identify the influential topics at a global level by integrating information from both a text stream and an index stream. Then at a micro level, we detect such evidences and organize them into several topic clusters to represent different events going on at each period. After that, we further connect similar topic clusters in consecutive time periods to form the priming events. Finally, we rank these priming events to identify their influence to the index.
The contributions of this paper are highlighted as follows.
-
•
To the best of our knowledge, we are the first to formulate the problem of detecting priming events from a text stream and a time series index. A priming event is an object which consists of three components: (1) Two timestamps to denote the beginning and ending of the event; (2) A sequence of local influential topic groups identified from the text stream; (3) a score representing its influence on the index.
-
•
We design an algorithm that first discovers the influential topics at a global level and then drills down to local time periods to detect and organize the priming events based on the influential topics.
-
•
We evaluate the algorithm on a real world dataset and the result shows that our method can discover the priming events effectively.
The rest paper is organized as follows. Section 2 formulates the problem and gives an overview to our approach. Section 3 discusses how we detect bursty text features and measure the change of time series index. Section 4 describes the influential topic detection algorithm and Section 5 discusses how we use the influential topics to detect and organize priming events. Section 6 presents our experimental result. Section 7 reviews some related work and Section 8 concludes this paper.
2 Problem Formulation
Let be a text corpus, where each document is associated with a timestamp. Let be the interested index, which consists of consecutive and non-overlapping time windows . is then partitioned into sets according to the timestamp of the documents. Let be a set containing all different features in , where a feature is a word in the text corpus.
Given the interested index and the text corpus , our target is to detect the priming events that trigger the movement of the index. As discussed in Section 1, the first step is to discover the influential topics. A possible approach [6, 10] is to first retrieve all the topics from the documents using the traditional approach in topic detection and tracking (TDT). Then we detect the influential topics by comparing the strength of the topic with the change of the index over time. We argue that this approach is inappropriate because the topic detection is purely based on the occurrence of the words and ignores the behaviors of the index. Consider the feature worker. Typical TDT approach would consider its co-occurrences with other features when deciding to form a topic. By enumerating all the possibilities, it will form a topic with features such as union because worker union frequently appears in news documents. However, if we take the presidential approval index into consideration, the most important event about worker related to the index would be that President Bush increased the Federal Minimum Wage rate for workers ever since 1997. This event helped him to stop the continuous drop trend of the approval index and make it stay above 30%. Therefore, it is more favorable to group worker with wage rather than with union. This example urges us to consider how to leverage the information from the index to help us organize the features into influential topics. These influential topics take in not only the feature occurrence information but also the changing behavior of the index. We formally define such topics as follows.
Definition 1
(Influential Topics) An influential topic is represented by a set of semantically coherent features with a score indicating its influence on the time series index .
Based on the definition of influential topics, the next step is to represent priming events using these topics. One simple and direct way is to take each occurrence of a topic as a priming event. However, this approach has one major problem. We observe multiple topics at a time window and these topics are actually not independent but correlated and represent the same on-going event. Our topic detection algorithm may not merge them into a single topic because they only co-occur at that certain window but separate in other windows. For example, the topic of {strike target} would appear together with the topic {force troop afghanistan} in 2001. But in 2003, when the Iraq war starts, it co-occurs with the topic {gulf war} instead. Therefore, in order to capture such merge-and-separate behavior of topics, we define the local topic cluster as follows.
Definition 2
(Local Topic Cluster) A local topic cluster in consists of a set of topics which occur in highly overlapped documents to represent the same event.
Based on the definition of local topic cluster, we further define a priming event as follows.
Definition 3
(Priming Event) A priming event consists of three components: (1) Two timestamps to denote the beginning and the ending of the event in the window ; (2) A sequence of local topic clusters ; (3) a score representing its priming effect.
Our algorithm is designed to detect event with high priming event score and there are three major steps: (1) Data Transformation, (2) Global Influential Topic Detection, (3) Local Topic Cluster Path Detection and 4) Event extraction by grouping similar topic cluster paths. Details are given in the following sections.
3 Data Transformation
In this section, we present how we transform and normalize the features and the index .
3.1 Bursty Period Detection
We first discuss how to select features in window to represent on-going events. Given the whole feature set , we find that the emergence of an important event is usually accompanied with a “burst of words”: some words suddenly appear frequently when an event emerges, and their frequencies drop when the event fades away. Hence, by monitoring the temporal changes of the word distributions in the news articles, we can determine whether there is any new event appearing. Specifically, if a feature suddenly appears frequently in a window , we say that an important event emerges.
In order to determine which of the intervals the feature “suddenly appears frequently”, we compute the “probability of bursty” for each window, . Let be the probability that the feature is bursty in window according to , where is the probability that would appear in any arbitrary windows given that it is not bursty. The intuition is that if the frequency of appearing in is significantly higher than the expected probability , then is regarded as a bursty period [22, 4]. We compute according to the cumulative distribution function of the binomial distribution:
| (1) |
where is the total number of words appearing in window , and is the frequency of appearing in . is a cumulative distribution function of the binomial distribution, and is the corresponding probability mass function. Therefore, represents the bursty rate of in window . The bursty periods of are identified by setting a specific threshold such that is larger than the threshold. With the transformation, we obtain the bursty probability time series for each feature as and the bursty windows of are denoted as .
3.2 Volatility Transformation and Discretization
We now discuss how to monitor the change of the index to reflect the effect of priming events. In this paper, instead of looking at the rise/fall of solely, we study the change of volatility of time series [19, 8]. Volatility is the standard deviation of the continuously compounded returns of a time series within a specific time horizon and is used to measure how widely the time series values are dispersed from the average as follows:
| (2) |
where is the possible rate of return, is the expected rate of return, and is the probability of . We can transform the index time series to the volatility of time series, .
Given the volatility index , we observe that there are some abnormal behavior at certain time windows. For example, in the 911 event, there is a volatility burst for President Bush’s approval index. Such phenomena will bring tremendous bias to the events happening in these volatility bursty windows. In order to avoid such bias, we further transform the volatility index to obtain a discrete representation with equal probability [14]. According to our experiment, the volatility index can fit into a logistic distribution. Therefore, we can produce a equal-sized area under the logistic curve [16] and transform the index volatility time series into a probabilistic time series .
4 Global Influential Topic Detection
Given the feature set and the probability volatility index , our task here is to identify a set of influential topics , where each topic is formed by a set of keywords . The problem can be solved by finding the optimal such that the probability of the influential bursty features grouped together is maximum for the text stream and . Below, we formally define the probability of :
Definition 4
(Influential Topic Probability) The probability of an influential topic is given by
| (3) |
Since is independent of , we only consider the numerator of Eq. (3). We use the topic to account for the dependency between and . Therefore, given , and are independent. Our objective function then becomes:
| (4) |
Some observations can be made on Eq. (4). The second component represents the probability that the influential topic generates the documents. And intuitively, we expect the document overlap of the features from the same topic to be high. The third component of represents the probability of the features to be grouped together. And two features should be grouped together if they usually co-occur temporally. Therefore, these two components basically require the features of to be coherent at both the document level and the temporal level. So generally, if more features are grouped together, the values of the second and the third components will decrease. And the first component represents the probability that the influential topic triggers the volatility of the time series index. Obviously, if the features in the group cover more windows with high volatility probability, the value of the first component will be higher. This will make the algorithm look for the features with high potential impact on the index. Below, we show how we estimate these three components.
First, we define the document similarity of two features using Jaccard Coefficient [3].
| (5) |
where is the document set containing feature . Then the can be estimated as below:
| (6) |
Second, in order to compute , we estimate the temporal similarity of two features by comparing their co-occurrence over the whole set of windows as below:
| (7) |
where is the bursty probability time series of computed in Section 3.1. Then the probability of a set of features belonging to can be estimated by the average similarity for each pair of features:
| (8) |
Finally, in order to estimate the , we define the influence probability for a feature as:
| (9) |
Since the denominator of Eq.(9) holds the same for all the features, we just take the numerator for computation. And can be estimated as
| (10) |
Finally, the topic can be extracted using a greedy algorithm by maximizing Eq. (4) for each topic in a similar way as in [6].
However, Eq. (4) is different from the objective function defined in [6] since we extract topics with respect to an interested time series index rather than purely based on text documents. Consider the worker example again. The document similarity and the temporal similarity of worker and union are 0.31 and 0.25, while those of worker and wage are 0.35 and 0.1. If we do not consider the index by setting , by Eq. (9), and . As a result, the algorithm would combine worker and union. However, since and , by considering the feature influence to the index , we have and . In this way, the algorithm will instead group and together to make an influential topic with respect to .
As shown above, since influential topics carry the volatility index information, it brings benefits to the priming event detection. In the above example, if we detect a new event containing the common topic {worker, union}, the event may be trivial since the topic has a low influence probability in the history. But if we detect an event with {worker, wage} instead, this event has a higher probability to be a priming event. This is because the high influence probability of the topic indicates that the events with such topic attracted the public attention and changed people’s mind in the past.
After extracting each , the bursty rate of in a window can be computed as below:
| (11) |
The bursty period of is determined in a similar way to detecting the bursty period of features in Section 3.1. And we use to denote all the bursty topics in window .
5 Micro Priming Event Detection
A priming event consists of three components: (1) Two timestamps to denote the beginning and the ending of the event in the window ; (2) A sequence of local correlated topic clusters ; (3) A score representing its influence on the index which is defined by considering the following three aspects of information:
-
1.
High event intensity : The event contains high bursty topics. The intensity at each window is estimated as follows:
(12) And the intensity over the whole period is measured by where means taking 2-norm on the vector.
-
2.
High index volatility: The index must have high volatility during the bursty period of this event which is measured by .
-
3.
High index and event co-movement rate: The index and event intensity time series should be highly correlated which is measured by their linear correlation .
We combine these three measures and define the priming event score as below:
| (13) |
In this section, we proposed a two-phase algorithm to detect events with high priming event score. We first look for potential important topic cluster at each local time period by extracting and grouping bursty topics. (High event intensity). We then take the topic cluster at the period with most significant index volatility as seed and probe the whole priming event path (High index volatility and High index and event Co-movement rate). Below, we discuss the two phases of the algorithm in detail.
5.1 Local Topic Cluster Detection
As discussed in Section 2, we usually observe multiple correlated bursty topics at a time window representing the same event. Therefore, we first group the correlated topics into topic clusters at each time window .
Intuitively, if two topics and belong to the same event, the reporter usually discusses them in the same news article and they would have a high degree of document overlap. We first define the document frequency vector for a topic at a window .
Let be a set of bursty topics in window and be the set of documents in window . We define be the term frequency vector for feature in the documents in window .
Then, the document frequency vector for a topic at a window is computed by the average of the term frequency vector as below:
| (14) |
Then the similarity between two topics and at window can be estimated by the cosine similarity:
| (15) |
In order to cluster the set of topics into several topic clusters, we use the K-Means clustering algorithm [3]. We determine the optimal cluster number by examining the quality of the clustering result under different cluster number . And the quality of the clustering is measured based on the ratio of the weighted average inter-cluster to the weighted average intra-cluster similarity [17]. After clustering, for a window , we obtain a set of topic clusters .
5.2 Composite Topic Cluster Path Detection
The detected topic cluster at each window represents a snapshot of an event. And the remaining question is how could we utilize these topics clusters and connect them into a topic cluster path to represent a complete priming event.
Intuitively, the time period with high index volatility would have better chance to contain the right priming event. Therefore, we sort the time periods according to the index volatility probability in Section 3 and start from topic clusters in the time period with the highest volatility probability. Figure 2 illustrates the idea where the bottom part is the volatility index and the upper part is the detected topic clusters at three consecutive windows. As we can see, window has the highest volatility and therefore the two topic clusters in will be taken as seed topic clusters. Then, we will start to construct the priming event from these two topic clusters. Specifically, we will probe forward/backward and associate similar and appropriate topic clusters into a topic cluster path .
Here, we measure the similarity between two topic clusters in two consecutive windows, and by looking at their intersection of influential topics. More specifically, the similarity of two topic clusters can be computed by adding the topic probability as a weight to the Jaccard Coefficient.
| (16) |
Eq. (16) assigns a higher similarity score to two topic clusters whose overlapping topics have higher topic probability, i.e., the topics are more coherent and influential.
However, even if two cluster have a high similarity score, we still can not link them directly since the topic cluster path with the new topic may have worse quality compared to the origin one. Here, we measure the quality of a topic cluster path using the same measure as for the priming event, which is defined in Eq. 13. For example, in Figure 2, the link between and means that they have a high similarity with each other. however, we found if we extend the path to by connecting with , then event intensity is still very high at window but the index volatility has decreased. This results lower correlation value between the topic cluster path and volatility index and eventually reduces the priming event score. Therefore, we will only connect two topic clusters if 1) they have a similarity score higher than a predefined threshold . 2) the topic cluster path score improves by integrating the new topic cluster.
After connecting appropriate topic clusters, the algorithm form a directed acyclic graph (DAG) of topic clusters between windows and we formally define a Path in this graph as follows.
Definition 5
(Topic Cluster Path) A topic cluster path of length in a topic cluster graph is a sequence of clusters: , such that are consecutive windows and there is an edge between two consecutive clusters in the graph.
In addition, the topic cluster path may have overlap between each other which they may express different aspects of the same priming event. For example, in the gulf war event, one topic cluster path may show the progress of the battle in Iraq, while another path may record the actions from US’s allay. Therefore, we measure the similarity between two overlapping paths as follows:
| (17) |
If the similarity between two paths is high, then we group these two paths and form a priming event. Here we explore the agglomerative hierarchical clustering [3] to conduct grouping and extract events.
Input: News document stream and index
Output: priming events
Input: Topic Cluster , Topic Cluster Path , Seed Inverted Path List , seed window ,
Output: updated Topic Cluster Path
Algorithm 1 describes the whole process of how we detect priming events. First of all, for each time window , we retrieve the bursty influential topics in Line 2. Then Line 3 groups the topic into topic clusters as described in Section 5.1. Here we keep a to indicate whether the topic has been used to construct priming event. And Line 6-14 is the key process to construct the priming events by connecting the topic clusters in consecutive windows. As discussed before, it will start from the window with highest index volatility. In Line 8-12, for each seed window , we check the unused topic cluster and generate a new path for each of them. Here, we also maintain the inverted path list for , . With this preparation, in Line 13, we probe event path which is described in detail in Algorithm 2. After we discover all the paths, we compute the topic cluster path similarity by Eq. 17 in Line 15 and group them together according to hierarchy clustering algorithm in Line 16.
Algorithm 2 shows how to probe the whole event path starting from a seed window . The algorithm is conducted both forward and backward. Let’s take the forward situation as an example where we try to see whether we can extend a path to window . And for each cluster in , , we compare with all the topic cluster with an entry in (i.e., it is a path to be extended) by computing cluster similarity according to Eq. (16) in Line 5. If their similarity is higher than , then in Lines 7-15, we check all the paths in the path inverted list of and decide whether to extend the path by checking whether the priming event score would increases by integrating into each path. Besides, we also maintain the new inverted path list of , . Finally, in Lines 19-20, we use the new inverted list to replace the previous one and move the window forward. The same will apply for the back-ward topic cluster path probing operation. The algorithm will return a list of update topic cluster path .
6 Experimental Results
In this section, we evaluate our algorithm on real-world dataset from political and finance domain.
We archive the news articles from the ProQuest database111http://www.proquest.com/. In ProQuest, for political news, we take “President Bush” and “President Obama” as the query keywords and extract and news articles respectively from Jan. 1, 2001 to June. 1, 2010. For the financial news, we want to study the priming events during the financial crisis period, so we take “Finance” as the query keywords and extract news articles from June. 1, 2007 to June. 30, 2010.
For the preprocessing of these news articles, all features are stemmed using the Porter stemmer. Features are words that appear in the news articles, with the exception of digits, web page address, email address and stop words. Features that appear more than 80% of the total news articles in a day are categorized as stop words. Features that appear less than 5% of the total news articles in a day are categorized as noisy features. Both the stop words and noisy features are removed.
For the time series index, we archive the President Approval rating index from the Gallup Poll222http://www.gallup.com And the poll is taken every 10 days approximately. And for President Obama, we take a weekly average rating based on the Gallup daily tracking. For the financial index, we use the popular U.S. market index, the S&P 500 index and also take a weekly sample based on its daily index. We further identify the bursty probability time series and volatility time series according to the methods introduced in Section 3.1 and Section 3.2.
After these preprocessing, we have three real datasets.
-
•
Bush. It contains 1186 bursty feature probability streams and 1 volatility time series with equal length of 281 in the 8 years of Bush’s administration.
-
•
Obama. It contains 1197 bursty feature probability streams and 1 volatility time series with equal length of 56 in the 13 months of Obama’s administration.
-
•
Tsunami. It contains 961 bursty feature probability streams and 1 volatility time series with equal length of 156 in the 3 years of financial crisis.
We implemented our framework using C# and performed the experiments on a PC with a Pentium IV 3.4GHz CPU and 3GB RAM.
6.1 Identifying Influential Topics
| Bush | Obama | Finance |
|---|---|---|
| bin laden | oil Mexico | Moody Triple mature |
| north Korean | civil movement equal | Merrill lynch |
| Israel palestinian | immigration illegal | legman brother |
| immigration illegal | police arrest | barrack obama primary |
| destruct mass | small business lend | Germany |
With the algorithm in Section 4, for political domain, we identify 385 and 207 influential topics from Bush and Obama, respectively. And for finance domain, we identify 100 influential topics from Tsunami. Table 1 gives the top 5 influential topics and the rank is based on the influential topic probability in Eq. (3). As shown in the second column of the table, {bin laden}, {north Korea} are 2-gram names which are regarded as the largest threaten for Bush’s administration from 2001-2008. Each of the other three topics consists of a set of features which are not 2-gram names but coherent and influential keywords in the document stream. The third column of the table shows the influential topics from Obama. Compared with Bush’s where 4 out of 5 topics are about international affairs, there are significant evolution of the influential topics of Obama’s topics. In particular, only first topic of Obama is about the international issue, i.e., the oil slick in Mexico Gulf . Others are all about how he deals with domestic affairs. The fourth column shows the influential topics we detect from Tsunami. The first topic {Moody Triple } shows the common triggering reason for the market crash, i.e., when the Moody changes the Triple for the big and matured financial institutions, the investors got panic and cleaned their position quickly. The second and third topics shows two big investment banks where the Legman Brother went bankruptcy while Merrill Lynch was acquired by Bank of America after losing a lot in the financial crisis. Their destinies are watched by all the investors in the market and therefore made into influential topics. The forth and fifth topics are two parties whose actions are critical to the direction of the market. The first one is President Obama who leads the policy of United States and the second one is Germany which influence the decision on bailout plan of Europe.
As discussed before, these influential topics detected at a global level give us evidences in detecting priming events at a micro level.
6.2 Priming Events in Politics
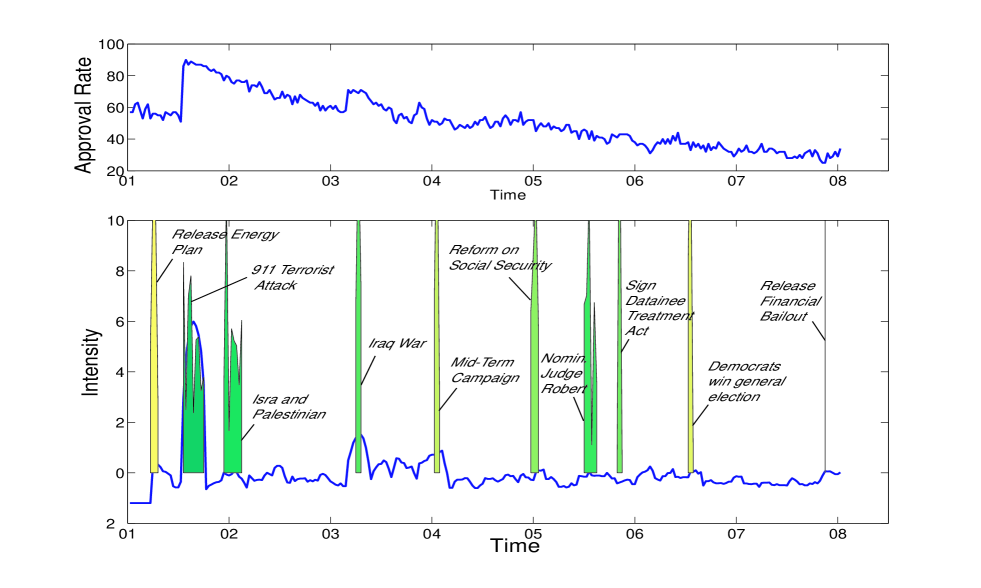
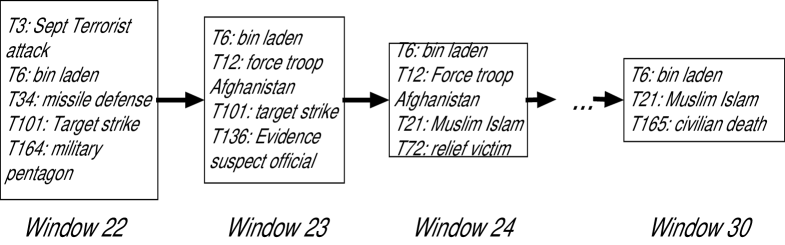
With the influential topics, we can identify the priming events with by the algorithm in Section 5. Figure 3 shows the approval index of President Bush and the top 10 priming events automatically detected over his eight years administration. As shown in the upper part of Figure 3, the approval index starts from 57% and has a big jump up to 90% in Sep 2001. Then it drops quickly until a rebound back to 70% in 2003. After that, it continues dropping with some small rebound in the middle and eventually reaches 34% in 2008. In the lower part, the blue line shows the volatility index according to Section 3.2 and the colored waves represent the ranked priming events (we normalize the value of these two time series and plot them in same graph). The rank is based on the score given by Eq. (13) and the wave with deeper color represents the priming event with a higher rank. The magnitude of the wave represents the intensity of the event according to Eq. (12). From the figure, we have two obvious observations: 1) the value of the volatility index increased when a significant trend change happened for the approval index. 2) During the periods when the volatility index increased significantly, we detect a burst of priming events. For example, after September 2001, we observe a significant increase of the volatility index reflecting the big jump of the approval index. At the same time, we detect the top 1 priming event about the 911 terrorist attack. Figure 4 further shows its structure which contains a composite topic cluster path with a length of 9 starting from window 22 to window 30. In each window, the path contains a topic cluster with a set of topics lying in a highly overlapped document set. For example, in window 22, the cluster consists of 5 bursty topics including the influential topics of {bin laden} and {Sept Terrorist Attack} that indicate the start of the 911 event. After that, in window 23, we observe another cluster containing {bin laden} and we connect it with the previous one since {bin laden} has a high influential topic probability and dominates the topic similarity measure according to Eq. (16). We can also see a certain degree of evolution between these two topic clusters since the second cluster contains a new topic {force troop Afghanistan} that is about U.S. sending troop to start the war. In the following windows, we can see the topic clusters evolute but all contain the influential topic {bin laden}. This event ends in window 30 with a topic {civilian death} indicating that the war results in the civilian death of the country. From this priming event, we can see that the attack makes the U.S. people united and support their President. Similarly, the volatility index also reflects the rebounding of the approval index in 2003. And the priming event covering that period is about the Iraq war with the ending of U.S. victory which increased the public support of President Bush. Other periods with significant increasing volatility such as those in Mar 2001 and Jul 2004 can also be explained by the detected priming events, i.e., President Bush released the energy plan and won the mid-term campaign over John Kerry.
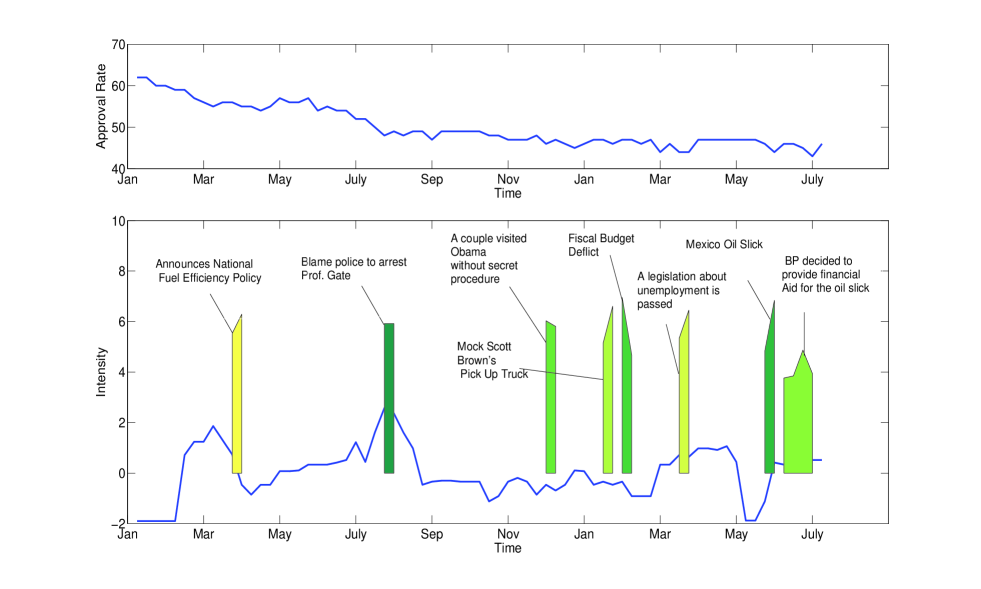
Figure 5 shows the approval index of President Obama and the 8 priming events detected over his 16 months administration. As discussed in Section 1, users may be curious about what happened in the quick drop periods in July, 2009. In the lower part of Figure 5, when the volatility increased, we detect the priming event that he criticized on the police who arrested Prof. Gate. On the other hand, the algorithm also detects that his effort to pass the legislation on unemployment in April, 2010 helped to improve his approval rate.
6.3 Priming Events in Finance
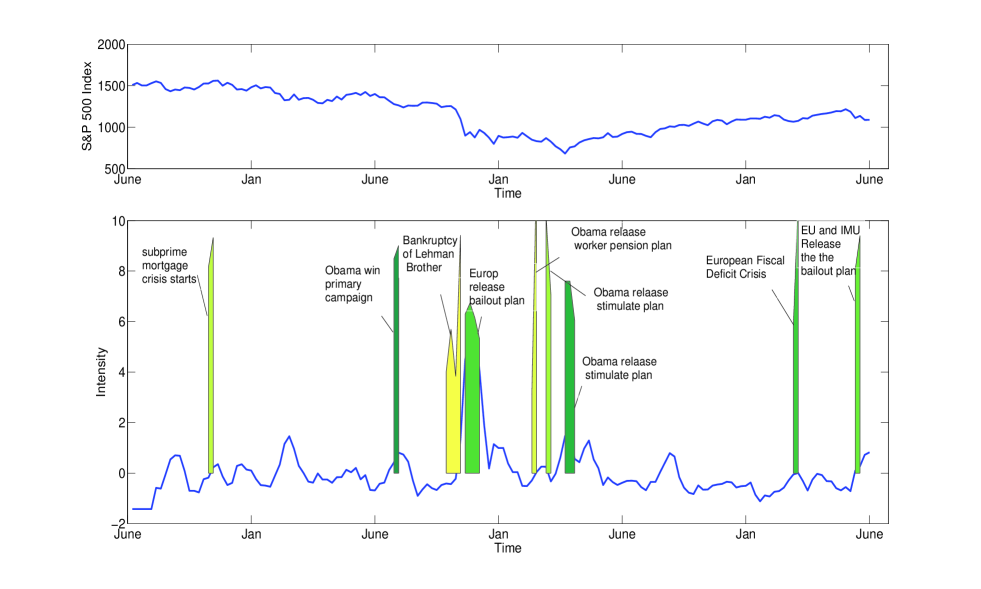
Figure 6 shows the S&P 500 index and the top 10 priming events detected over the three years of financial crisis period.
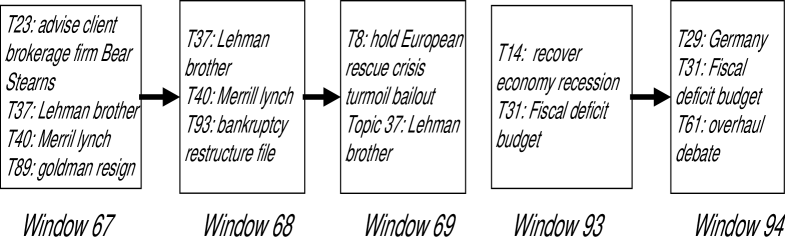
In the upper part of Figure 6, we can see the S&P 500 index reached the top of 1562 in Oct., 2007 and started to turn down. At the same time, In the lower part, the volatility increased and we detect the event that subprime mortgage crisis started to emerge. As the crisis developing, the biggest index drop of 300 points is achieved in Oct., 2008 before which we detected the bankruptcy event of the legman brother. The left part of Figure 7 shows its structure. In its three evolving windows, the influential topic {Lehman Brother} always exists. And at the first window, it mentioned its possibility to fall down as Bear Stearns. In the following two windows, it integrated the bankruptcy topic as well as a topic about reaction from Europe. After this event, the index kept dropping and achieved the bottom of 683 in March, 2009. And it started to rebound with the detected event that President Obama released the stimulation plan to re-build the confidence of investors. Recently, we also observed two priming events which are about the European Fiscal Deficit Crisis. The right part of Figure 7 shows its structure which has a length of 2. At the first window, we detected the event of European Fiscal Deficit and at the second window we integrate a new topic cluster of {Germany} indicating that Germany played a major role in saving the crisis.
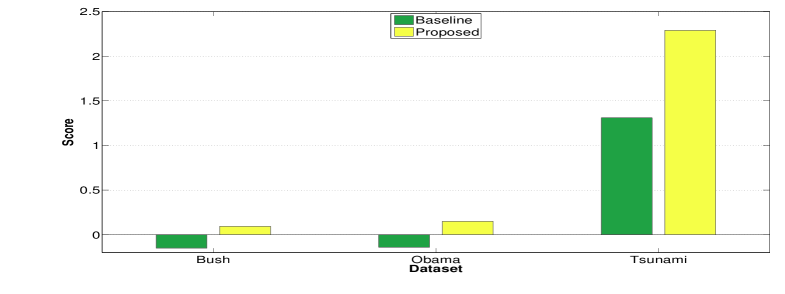
6.4 Event Quality Comparison
In order to further evaluate the performance, we implement a baseline approach as comparison which is based on the bursty events directly [6]. According the approach, the bursty period of the event is decided by:
| (18) |
where is similar to the influential topic identified in this paper but it do not consider integrating the index volatility into the detection process. Given events detected by the baseline approach and the proposed approach, we compared their average priming event scores. Figure 8 shows the result and our proposed approach outperforms the baseline approach for the three datasets. And we also note that for the Bush and Obama dataset, the baseline approach shows negative value which means the detected event can not match well with the volatility index and therefore produce a lot of events with negative priming event score. Besides, we can see the average score of events on Tsunami dataset is much larger than the average score on Bush and Obama dataset. This is because the volatility of financial index is much larger than the volatility of President approval index which leads to a larger priming score according to Eq. 13.
7 Related Work
The problem of Topic Detection and Tracking (TDT) [1] is a classical research problem for many years. The first stream of work used graphical probabilistic models to capture the generation process of document stream [2, 7]. [20] extended the LDA model and incorporated location information. [21] analyzed multiple coordinated text streams and detected correlated bursty topics. [15] added the social network information as a regulation into the topic detection framework. On the other hand, there are another stream of work which detected topic based on the bursty features [11]. [6] detected bursty features and clustered them into bursty events. [4] further built an event hierarchy based on the bursty features. [10] analyzed the characteristics of bursty features (power and periodicity) and detected various types of events based on it. [13] proposed an algorithm to track short phrased and organized them into different news threads. Although these work can detect topics and track event efficiently. They can not tell the users which topics/events are changing the real world’s interested time series, President Approval Rating, Stock Market Index.
In contrast, there are some work studying the relationship between the text stream and interested time series. [12] studied the relationship between various topics over the volatility of presidential approval index. [9] attempted to find out the relationship between the online query and its related sales rank. [5] proposed a model for mining the impact of news stories on the stock prices, by using a -test based split and merge segmentation algorithm for time series preprocessing and SVM for impact classification. [19] studied the relationship between the news arrival and the change of volatility of stock market index. [18] further explored this relationship to rank the risk of stocks. However, these work are either relying on analysts to extract topics manually or just identifying a list of influential keywords. In our work, we attempt automatically identify these events by first organizing these words into high level influential topics and then detect priming events based on them.
8 Conclusion
In this paper, we study the problem of detecting priming events based on a time series index and an evolving document stream. We measure the effect of the priming events by the volatility rate of the time series index. We propose a two-step framework to detect the priming events by first detecting influential topics at a global level and then forming priming events using detected influential topics at a micro level. The experimental results on the political and finance domains show that our algorithm is able to detect the priming events that trigger the movement of the time series index effectively.
References
- [1] J. Allan. Topic Detection and Tracking: Event-based Information Organization. Kluwer, 2002.
- [2] D. M. Blei, A. Y. Ng, and M. I. Jordan. Latent dirichlet allocation. Journal of Machine Learning Research, 3:993–1022, 2003.
- [3] M. S. DPang-Ning Tan and V. Kumar. Introduction to Data Mining. Addison-Wesley, 2006.
- [4] G. P. C. Fung, J. X. Yu, H. Liu, and P. S. Yu. Time-dependent event hierarchy construction. In KDD, pages 300–309, 2007.
- [5] G. P. C. Fung, J. X. Yu, and H. Lu. The predicting power of textual information on financial markets. IEEE Intelligent Informatics Bulletin, 5(1):1–10, 2005.
- [6] G. P. C. Fung, J. X. Yu, P. S. Yu, and H. Lu. Parameter free bursty events detection in text streams. In Proc. of VLDB’05, pages 181–192, 2005.
- [7] T. L. Griffiths, M. Steyvers, D. M. Blei, and J. B. Tenenbaum. Integrating topics and syntax. In NIPS, 2004.
- [8] P. Gronke and J. Brehm. History, heterogeneity, and presidential approval: a modified arch approach. Electoral Studies, 21(3):425 – 452, 2002.
- [9] D. Gruhl, R. V. Guha, R. Kumar, J. Novak, and A. Tomkins. The predictive power of online chatter. In KDD, pages 78–87, 2005.
- [10] Q. He, K. Chang, and E.-P. Lim. Analyzing feature trajectories for event detection. In SIGIR, pages 207–214, 2007.
- [11] J. M. Kleinberg. Bursty and hierarchical structure in streams. In KDD, pages 91–101, 2002.
- [12] D. Kriner and L. Schwartz. Partisan dynamics and the volatility of presidential approval. British Journal of Political Science, 39(03):609–631, 2009.
- [13] J. Leskovec, L. Backstrom, and J. M. Kleinberg. Meme-tracking and the dynamics of the news cycle. In KDD, pages 497–506, 2009.
- [14] J. Lin, E. J. Keogh, S. Lonardi, and B. Y. chi Chiu. A symbolic representation of time series, with implications for streaming algorithms. In DMKD, pages 2–11, 2003.
- [15] Q. Mei, D. Cai, D. Zhang, and C. Zhai. Topic modeling with network regularization. In WWW, pages 101–110, 2008.
- [16] D. C. Montogomery and G. C. Runger. Applied Statistics and Probability for Engineers. John Wiley & Sons, Inc., second edition, 1999.
- [17] T. Özyer, R. Alhajj, and K. Barker. Clustering by integrating multi-objective optimization with weighted k-means and validity analysis. In IDEAL, pages 454–463, 2006.
- [18] D. W. Qi Pan, Hong Cheng and J. X. Yu. Stock risk mining by news. In Proc. ADC’10.
- [19] C. Robertson, S. Geva, and R. C. Wolff. Can the content of public news be used to forecast abnormal stock market behaviour? In ICDM, pages 637–642, 2007.
- [20] X. Wang and A. McCallum. Topics over time: a non-markov continuous-time model of topical trends. In KDD, pages 424–433, 2006.
- [21] X. Wang, C. Zhai, X. Hu, and R. Sproat. Mining correlated bursty topic patterns from coordinated text streams. In KDD, pages 784–793, 2007.
- [22] D. Wu, G. P. C. Fung, J. X. Yu, and Z. Liu. Integrating multiple data sources for stock prediction. In WISE, pages 77–89, 2008.