Development and characterization of a laser-induced acoustic desorption source
Abstract
A laser-induced acoustic desorption source, developed for use at central facilities, such as free-electron lasers, is presented. It features prolonged measurement times and a fixed interaction point. A novel sample deposition method using aerosol spraying provides a uniform sample coverage and hence stable signal intensity. Utilizing strong-field ionization as a universal detection scheme, the produced molecular plume is characterized in terms of number density, spatial extend, fragmentation, temporal distribution, translational velocity, and translational temperature. The effect of desorption laser intensity on these plume properties is evaluated. While translational velocity is invariant for different desorption laser intensities, pointing to a non-thermal desorption mechanism, the translational temperature increases significantly and higher fragmentation is observed with increased desorption laser fluence.
Introduction
Recent years have seen the development of several techniques to control isolated neutral molecules in the gas-phase. Molecular beams of polar molecules can be dispersed with strong inhomogeneous electric fields, producing pure samples of individual conformers, cluster stoichiometries or even single quantum-states Filsinger et al. (2008, 2009); Trippel et al. (2012); Nielsen et al. (2011); Horke et al. (2014); van de Meerakker et al. (2012); Chang et al. (2015). We can, furthermore, control the alignment and orientation of complex gas-phase molecules in space Holmegaard et al. (2009); Filsinger et al. (2009); Trippel et al. (2013); Stapelfeldt and Seideman (2003), allowing one to extract molecular-frame information, such as nuclear or electronic structures, from these samples Bisgaard et al. (2009); Holmegaard et al. (2010). In combination with the technological developments in free-electron laser (FEL) ultrafast x-ray sources, now providing millijoule-level pulses of hard x-rays with sub-100 fs pulse durations, these control techniques open up the potential to image isolated biomolecules and particles with femtosecond temporal and picometer spatial resolution Seibert et al. (2011); Neutze et al. (2000); Boll et al. (2013); Küpper et al. (2014).
The realization of these experiments crucially depends on a high-density source of intact molecules in the gas-phase, ready for further manipulation and experiments. While for many small stable compounds this is easily achieved using thermal vaporization and seeding into a molecular beam, this approach is not feasible for thermally labile or non-volatile species – such as most larger biochemically relevant molecules, and biological species in general. Therefore, these samples require the development of gentle vaporization techniques, that still produce a pure and high-density sample of molecules in the gas-phase. Furthermore, technical requirements for central-facility experiments, such as a well-defined and fixed interaction point and capabilities for long uninterrupted measurement times, need to be fulfilled.
One approach to achieve relatively dense ensembles of labile neutral molecules is laser-induced acoustic desorption (LIAD), which has been introduced over 30 years ago Lindner and Seydel (1985), but received relatively little attention since. What sets LIAD apart from other laser-based vaporization techniques, such as laser desorption de Vries and Hobza (2007), is that it avoids any direct interaction between the desorption laser and the molecular sample, making this technique applicable to light-sensitive and labile compounds. The basic principle of LIAD is that samples get deposited on one side of an opaque substrate – often a thin metal foil – while the other side of this substrate gets irradiated with a laser pulse. This laser pulse induces acoustic and thermal waves within the substrate, which travel through the material and lead to desorption of molecules on the front side. The physical mechanism behind this desorption process is currently very poorly understood, i. e., even the nature of the desorption process (thermal, acoustic, stress-induced) is not clearly established and, furthermore, it is highly dependent on the employed substrate and sample preparation method Zinovev et al. (2007).
Nonetheless, the LIAD technique has been used in a number of mass spectrometry studies Golovlev et al. (1997); Peng et al. (2006); Nyadong et al. (2012). Notably, the Kenttämaa group coupled LIAD to a Fourier transform ion cyclotron mass spectrometer Pérez et al. (2000); Shea et al. (2007, 2006) and a quadrupole linear time-of-flight mass spectrometer Habicht et al. (2010); Gao et al. (2011). They used this source to study peptides and large organic compounds up to mass u. Recently, the LIAD methodology has also been applied to study the dynamics of intact aminoacids on the femtosecond and attosecond timescale using ion-yield and photoelectron spectroscopy Calvert et al. (2012); Belshaw et al. (2012); Calegari et al. (2014). In a seminal paper in 2006, Peng et al. showed the applicability of LIAD to significantly larger systems and particles, successfully desorbing viruses, bacteria and cells and storing them in a quadrupole ion trap for precise mass measurements Peng et al. (2006); Zhang et al. (2016). The Campbell group furthermore established a closely related technique, termed “laser-induced forward transfer” for the gentle vaporization of large nanoparticles Bulgakov et al. (2014); Goodfriend et al. (2016).
Here, we present our new LIAD-source setup, designed for use in central facilities. It allows for prolonged measurement times through automatic sample replenishment, whilst keeping the interaction point fixed. This is realized through the use of a long metal tape as the LIAD substrate, which is constantly forwarded – akin to an old-fashioned cassette tape – to provide fresh sample. A reproducible layer of molecules is prepared on this foil by spraying aerosolized samples onto the band. This technique yields a stable and reproducible signal for many hours of measurement time. As a test system we use the amino acid phenylalanine and characterize the produced molecular plume using strong-field ionization, evaluating the number density, spatial extend and temporal distribution. By convoluting the initial plume temporal distribution with a Maxwell-Boltzmann velocity distribution, the forward velocity and the translational temperature in the moving frame were derived. While the velocity does not increase with desorption laser intensity, the translational temperature does increase and, furthermore, we observe enhanced fragmentation. These observations are consistent with a desorption model based on surface stress between the foil band and islands of deposited molecules, which was previously proposed Zinovev et al. (2007).
Experimental method
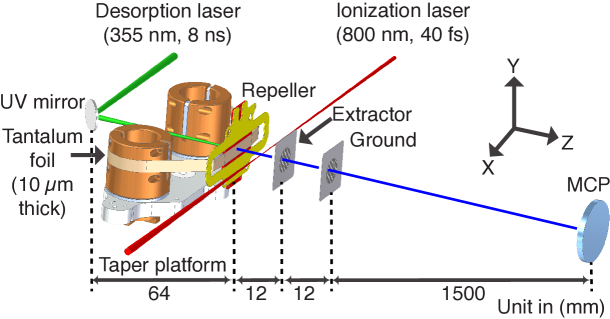
A schematic of our new LIAD setup is shown in Figure 1; further details regarding the setup and sample preparation are given in the supplementary information. Briefly, sample is deposited on the front side of a tantalum foil band of 10 µm thickness and 10 mm width, while the backside gets irradiated with a pulsed desorption laser. We use tantalum as a substrate due to its very high melting point of K and hence its ability to withstand higher desorption laser intensities. During data collection the foil band is constantly moved across the desorption laser spot to provide fresh sample, as further discussed below. In order to create a stable coverage of sample on the foil, we aerosolized samples using a gas-dynamic virtual nozzle (GDVN) DePonte et al. (2008); Beyerlein et al. (2015) to create and deposit an aerosol on the foil, where it sticks and rapidly dries out. Full details of the sample preparation and deposition process, including details regarding sample concentration, spray rate, speed of the foil band, and an estimate of total deposited material are given in the supplementary information.
Molecules are desorbed using ns duration laser pulses at 355 nm, focused to a 300 µm (FWHM) spot on the foil. Desorbed molecules are strong-field ionized by 40 fs pulses from a Ti:Sapphire laser, with typical field strengths of W/cm2. Produced cations are detected by a conventional linear time-of-flight mass spectrometer (TOF-MS), with a typical mass resolution .
Results and Discussion
Characterizing LIAD by strong-field ionization
We characterize the desorbed molecular plume using strong-field ionization (SFI) from a focused femtosecond Ti:Sapphire laser as a universal probe Calvert et al. (2012); Teschmit et al. (2017).
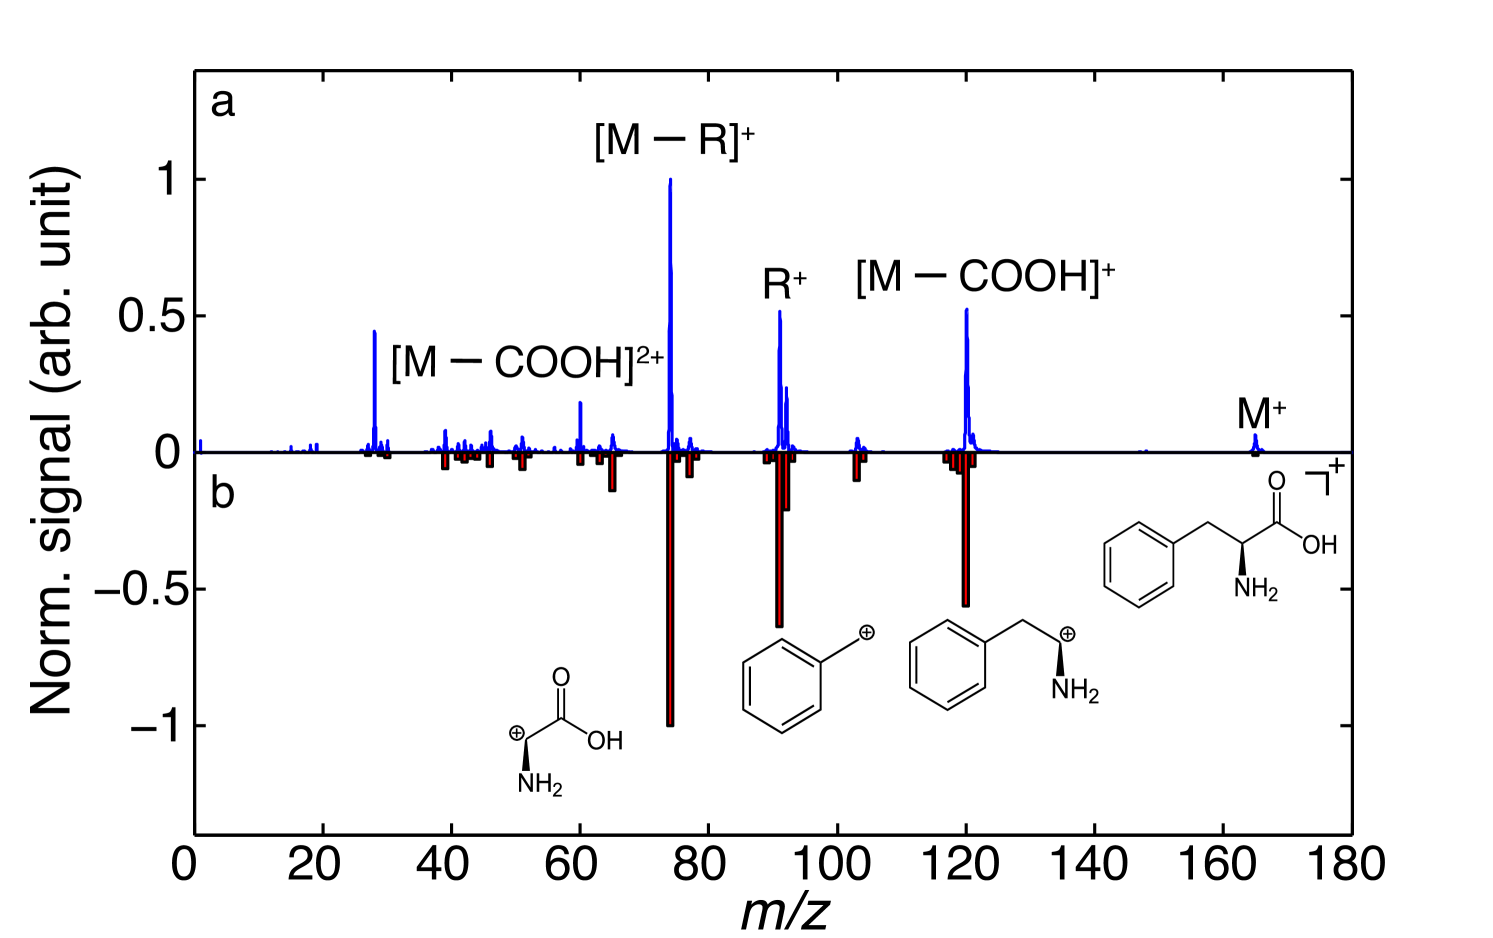
The observed TOF-MS of phenylalanine (PA) is shown in Figure 2 and compared to a literature spectrum obtained using electron-impact ionization (EI) Linstrom and Mallard (2017). Both spectra are normalized to the most abundant fragment ion at mass 74 u, corresponding to loss of a benzyl-radical fragment. It is evident that both ionization schemes strongly induce fragmentation, however, we note that using SFI a significant contribution from intact PA is observed at 165 u; this could even be enhanced using shorter duration laser pulses Calvert et al. (2012). We observe no evidence for the production of larger clusters of PA, and hence attribute this channel to desorption of intact PA monomers. Furthermore, we observe an additional fragmentation peak at 28 u in the SFI data, corresponding to CNH2, e. g., C-NH or HC=NH+, fragment ions, which is absent in the EI mass spectrum. These spectra clearly demonstrate the production of intact PA following desorption from the foil band. We do not observe the emission of any tantalum atoms or clusters, which would easily be ionized by the SFI probe, since the ionization potential of tantalum is lower than of PA. This indicates that the desorption laser does not penetrate through the foil band nor ablate metal from the foil by other means.
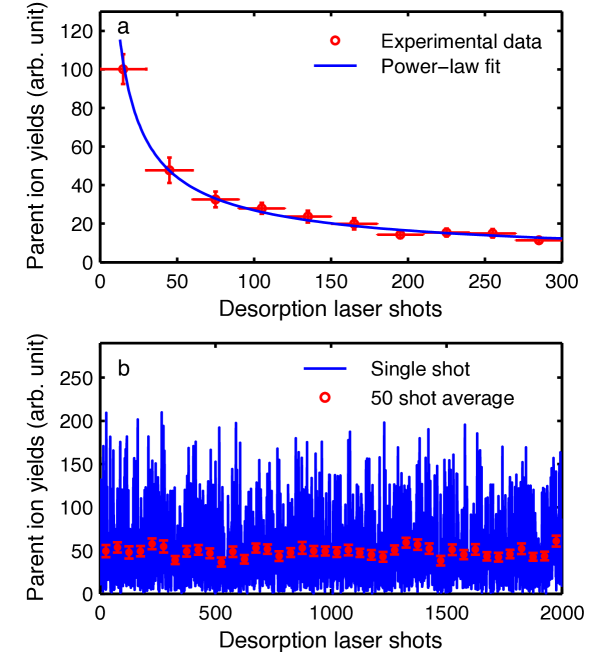
To assess the depletion of sample from the foil and determine the required moving speed for sample replenishment, we measured the parent ion yield as a function of the number of desorption laser shots onto the same spot. The resulting abundances are shown in Figure 3 a, where the solid line represent a power-law fit of the form , with an exponent of n = . We observe a rapid decay of signal, reaching around 10% after 330 desorption laser shots. Similar power-law behavior has previously been observed and rationalized with the existence of several isolated desorption centers on the foil Zinovev et al. (2007). This is consistent with our observation of many large crystalline islands, see supplementary information, many of which fall within the desorption laser spot size.
During further data collection the foil band is continuously moved at 50 µm/s, corresponding to a movement to a new sample spot every desorption laser shots. The corresponding shot-to-shot signal stability for the moving foil band is shown in Figure 3 b. The signal exhibits large fluctuations with a single shot standard deviation of 70% of the mean value. No long-term drift of the overall signal levels is observed. Averaging over 50 desorption laser shots reduces the standard deviation to below 10%, as indicated by the red markers and error bars in Figure 3. Further data points in this manuscript are typically averaged over 1200 desorption laser shots, resulting in a standard deviation of %.
Molecular plume properties
In the following we investigate the spatial extent, density, velocity, and translational temperature of the “plume” of molecules desorbed from the foil band. We estimate absolute number densities from ion counting measurements and the known interaction volume as defined by our ionization laser. In Figure 4 a we show the measured number density of parent ions in the center of the desorbed plume as a function of distance from the foil band. We note that the shown densities are lower limits, since their calculation assumes an ionization efficiency of 1 for SFI and considers the measured intact parent ions only, such that any fragmentation induced by the SFI probe will reduce the derived density. The obtained densities exhibit approximately an inverse-square-law behavior with distance from the foil, since the expansion along the laser propagation direction is not reflected in the measurements due to the large Rayleigh length of the ionization laser ( mm). We note that the data point closest to the foil band for the measurement at 0.64 J/cm2 shows a significantly lower than expect density, which we can only explain with a lower density of molecules attached on the desorption foil band for this measurement, due to some instability during the aerosolization process.
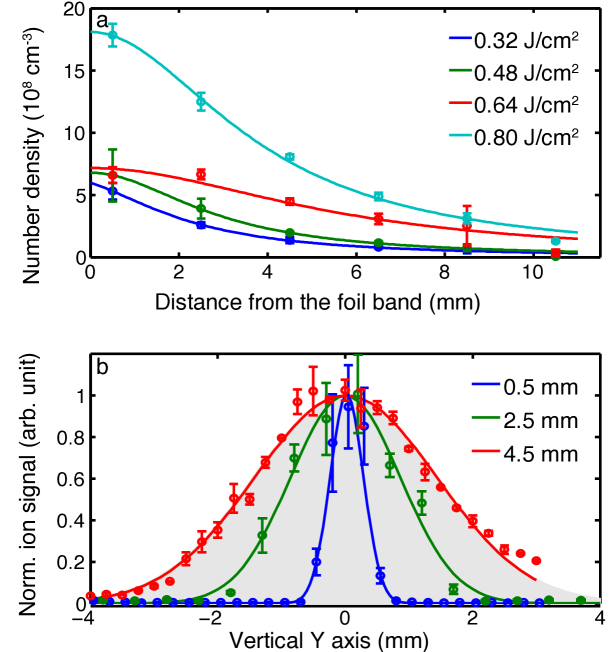
We assess the spatial extent of the plume, i. e., the transverse profile, by translating the ionization laser in height along the -axis (Figure 1), across the plume of molecules. This is shown in Figure 4 b for three distances between the foil band surface and interaction point. The initial profile close to the foil band is very narrow, with a FWHM of mm after 0.5 mm of free flight. The plume then rapidly spreads out, reaching a FWHM of around 2 mm after 2.5 mm propagation and within 4.5 mm of free flight the extent of the plume exceeds the spatial acceptance of the TOF ion optics (indicated by the gray shading in Figure 4 b), such that no accurate data can be measured at larger separations. This rapid diffusion of the plume in space is consistent with the fast drop in density observed as the distance between the foil band and the interaction point is increased, Figure 4 a, and indicates rapid diffusion of the molecular plume in space following desorption from a well-defined spot defined by the desorption laser profile.
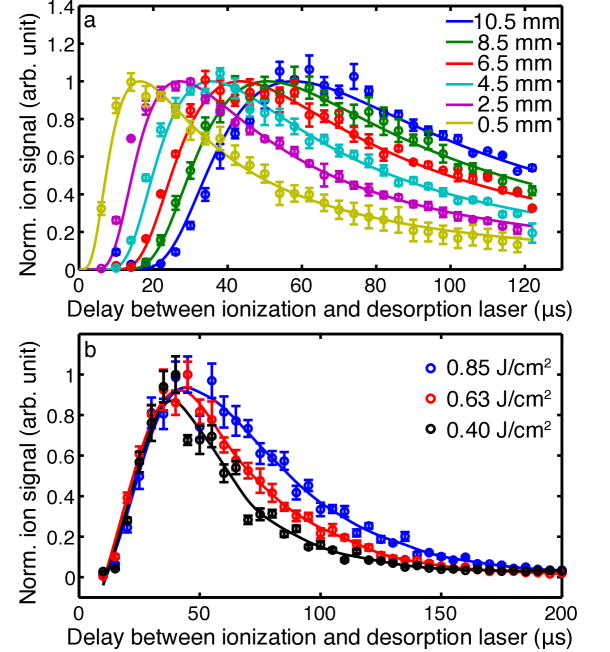
To investigate the longitudinal extend and velocity of the plume of desorbed molecules we measure mass spectra as a function of delay between the desorption and ionization lasers, and at different distances from the foil band. Results for the intact-parent-ion yield following desorption with a fluence of 0.8 J/cm2 are shown in Figure 5 a. Similar data for other desorption fluences are shown in the supplementary data. It is very clear that even when the interaction point is very close to the foil band a broad temporal profile is observed, lasting several tens of µs, much broader than the 8 ns duration of the desorption-laser pulse. At larger distances from the foil band these distributions widen considerable more, demonstrating that during free flight through the vacuum chamber the plume spreads out also in the longitudinal direction. We identify two physical origins for the observed profiles and their temporal evolution; (i) the desorption process itself that does not release molecules at one instant in time, but with a certain temporal and kinetic energy distribution and (ii) the propagation of molecules in free flight with a certain finite translational velocity distribution. Whereas (i) contains information about the physical desorption mechanism from the foil, the translational velocity spread from (ii) corresponds to the translational temperature in the moving frame of the molecules.
In order to accurately fit the measured data, one needs to convolute the initial desorption time distribution from the foil band with the Maxwell-Boltzmann free-flight propagation. Since so far no quantitative model is available to describe this desorption process accurately, we take the experimental data measured closest to the foil band, i. e., 0.5 mm, as a measure of the initial desorption time distribution and numerically convolute this with the Maxwell-Boltzmann model of the free-flight propagation. Details of this convolution procedure and the Maxwell-Boltzmann model are given in the supplementary information. We then perform a global fit of the data for all propagation distances simultaneously using a common temperature and offset velocity , while we introduce only a single linear scaling parameter for the different data sets. The latter essentially accounts for the drop in intensity along the probed center-line of the plume. The results of this fit for a desorption laser fluence of 0.8 J/cm2 are shown as solid lines in Figure 5 a, data for other fluences is provided in the supplementary information. The obtained translational temperatures and forward velocities are summarized in Table 1.
| Desorp. Fluence (J/cm2) | (K) | (m/s) |
|---|---|---|
| 0.32 | ||
| 0.48 | ||
| 0.64 | ||
| 0.80 |
We observe a strong, nearly linear, dependence of the translational temperature of the molecular plume on the fluence of the desorption laser. Even at the lowest fluence used a translational temperature of nearly 600 K is obtained. In the current experimental setup using SFI we cannot measure the internal (vibrational or rotational) temperature directly. However, given the large density of states in systems such as phenylalanine, and the microsecond timescales of the desorption process, we can assume a large degree of thermalization between the different degrees of freedom. Thus the measured translational temperatures can be considered as a good indicator of the internal temperature of desorbed molecules.
Unlike the temperature, the observed forward velocity appears to be approximately constant for the different desorption laser fluences. The slightly elevated velocity for the measurement at 0.64 J/cm2 could be due to instabilities in the sample preparation for this measurement, as mentioned above. Similar observations of identical forward velocity have been previously reported Zinovev et al. (2007); Shea et al. (2007). This invariability of the velocity with desorption laser fluence suggests that this might be determined by material properties of the substrate and the molecular sample.
Figure 5 b shows the yield of intact parent ions as a function of desorption laser-ionization laser delay for different desorption fluences. While the peaks of the distribution overlap in time, the distribution is significantly broader for higher fluences. These observations fully support our finding of a constant translational velocity, but increasing translational temperature as the desorption laser fluence is increased (vide supra).
Molecular fragmentation
In how far the observed fragmentation is due to the desorption or the SFI process is hard to assess from the mass spectra in Figure 2 alone. In order to disentangle these contributions, we collect mass spectra for different ionization and desorption laser intensities.
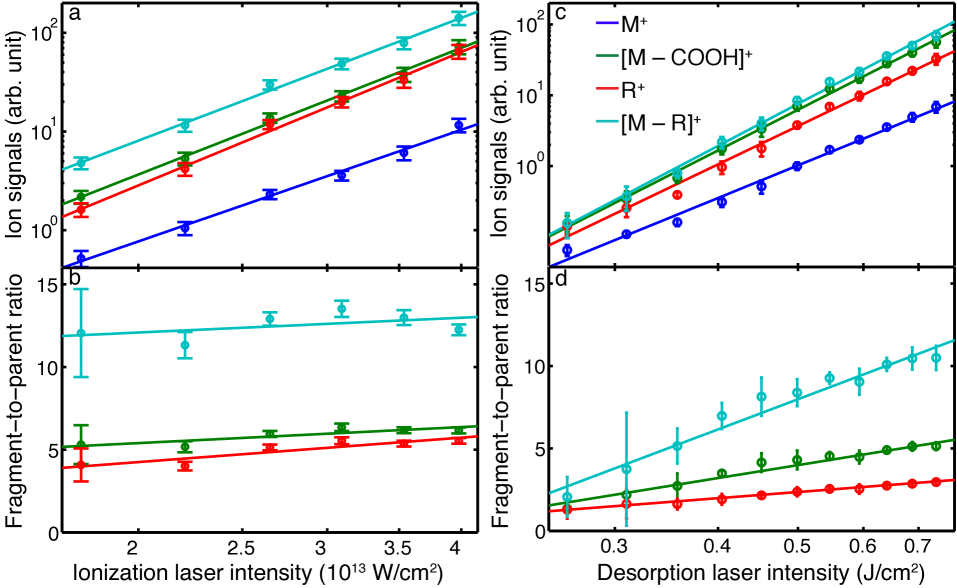
Figure 6 a shows the ion yield for the PA parent and the three dominant fragment ions as a function of ionization laser intensity, with all ion channels showing a steep increase with increasing laser intensity. These data were fit with a power-law dependence of the form . Figure 6 b further shows the ratio of fragment-to-parent ion abundances for the three dominant fragment ions, i. e., comparing the relative abundances of the two respective channels. We observe only a very slight increase in fragmentation as the laser intensity increases, in good agreement with previous studies suggesting that SFI induced fragmentation is very sensitive to the employed pulse duration, but not the intensity Calvert et al. (2012).
Figure 6 c shows the dependence of ion yields on the intensity of the desorption laser and Figure 6 d the corresponding fragment-to-parent ratios. The overall measured ion abundances are again well described by a power-law fit and show a steep increase for higher intensities, especially noticeable for fragment ions. This is confirmed by the fragment-to-parent ratios, which also significantly increase with laser intensity, indicating enhanced fragmentation. Thus, the desorption-laser interaction clearly induces fragmentation, either directly during the desorption process or thereafter, but prior to ionization, i. e., as molecules travel through the vacuum chamber toward the interaction point. To test the latter, we recorded mass spectra at different distances behind the foil band, changing the laser-laser delay such that we always probe the highest density part of the molecular plume, i. e., we follow the center of the plume as it travels through the vacuum chamber.
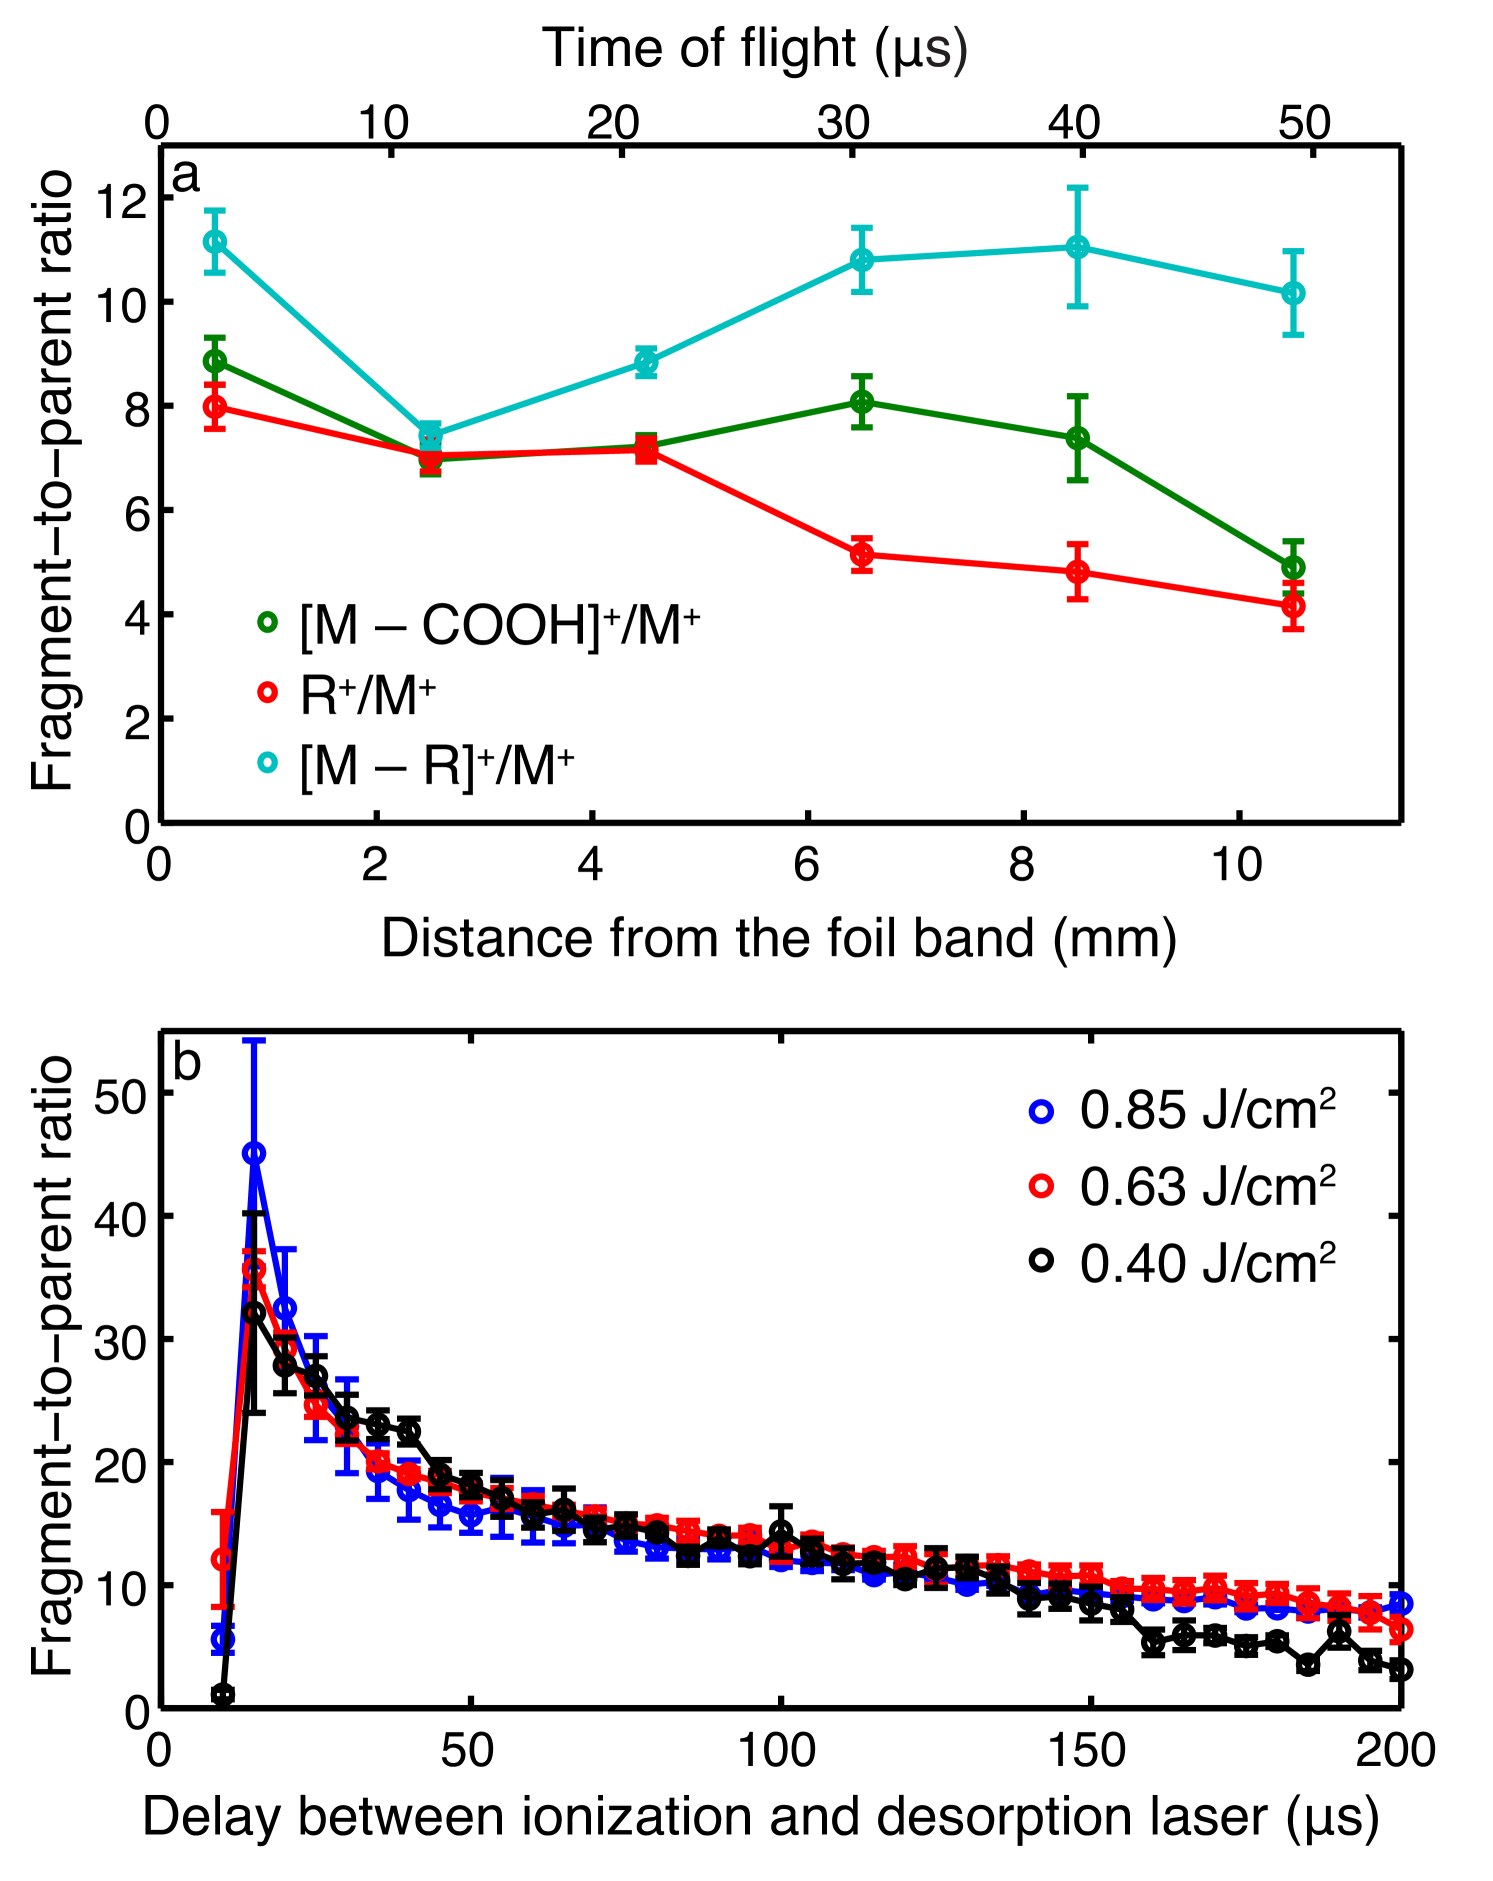
This data is shown in Figure 7 a, collected for distances of 0.5–10.5 mm between the foil band and the interaction point, which corresponds to flight times of around 0–50 µs. Over this distance we observe no significant increase in fragmentation, indicating that fragmentation occurs on much faster timescales, i. e., most likely during the desorption process itself, either while molecules are still attached to the metal substrate or very shortly after desorption into the gas-phase.
We now consider the distribution of fragments within a single plume coming from the foil band, i. e., if the fragmentation changes depending on which part of the plume is observed. This is shown in Figure 7 b, where we plot the fragment-to-parent ratio for the most abundant molecular fragment ion as a function of desorption-laser-to-ionization-laser delay for a fixed distance from the foil band, i. e., 6.5 mm. We observe an initial peak in the fragment-to-parent ratio at the onset of desorption, i. e., the “front” part of the molecular plume, which then decreases on a timescale of tens of microseconds. These timescales are consistent with thermal processes, in particular we associate the observed distribution with the rapid heating of the foil band by the nanosecond laser pulse, causing increased fragmentation, followed by slow dissipation of the thermal energy, i. e., cooling down of the front surface and, hence, reduced fragmentation. Further evidence that the fragmentation occurs during the desorption process and that it is of a thermal nature comes from the comparison of the fragment-to-parent ratios throughout the plume for different desorption laser fluences, also shown in Figure 7 b. These clearly show that the highest degree of fragmentation occurs for the most intense desorption laser pulse. This is also consistent with the higher translational temperatures derived for these conditions. Once the foil band cools down, i. e., at longer desorption-laser-to-ionization-laser delays, the fragment-to-parent ratio approaches an asymptotic value independent of initial desorption conditions.
Nature of the desorption process
Several possible mechanisms have been suggested in the literature for the underlying physical processes occurring in the LIAD process Lindner (1991); Golovlev et al. (1997); Zinovev et al. (2007); Goodfriend et al. (2016). It is important to note that the experimental conditions for the different published LIAD-based molecule sources are very different; pulsed Calvert et al. (2012); Zinovev et al. (2007) and continuous Calegari et al. (2014, 2015) desorption lasers are used and sample preparation methods vary greatly, from the thick sample layer used here of 500 nmol/cm2 Calegari et al. (2015); Borton et al. (2013), to intermediate thicknesses of tens of nmol/cm2 Shea et al. (2006, 2007), to near-monolayer coverage in other studies Zinovev et al. (2007). As such, we do not aim to provide a general model for the LIAD mechanisms, but seek to explain our observations and compare these with previous studies where applicable.
One of the suggested desorption mechanisms, and indeed the origin of the term “acoustic desorption” Lindner (1991); Golovlev et al. (1997), is the direct momentum transfer from a shock wave induced by the desorption laser in the foil band to the sample molecules. Our data firmly rules out this mechanism for our molecule source. We observe a slow rise in molecular signal on the order of , see Figure 5, which is not compatible with molecules being “shaken off” by an impulse traveling through the foil, as this should lead to a sharp sudden onset of signal as the impulse reaches the front surface, followed by an immediate drop as the impulse is reflected on the surface. Additionally one might expect to observe a periodic revival of signal as the impulses bounces back and forth within the metal foil. We observe no evidence for this behavior. Furthermore, the travel time for a mechanical wave through a 10 µm tantalum foil is approximately 2 ns Rigg et al. (2014), significantly shorter than the delay we observe between the desorption laser impacting on the foil and molecules being desorbed. A purely acoustic desorption mechanism would, furthermore, not explain the observed increase in fragmentation for increased desorption laser fluences. Similar observations have been made previously for a pulsed LIAD setup, and the “shake off” mechanism similarly discredited Zinovev et al. (2007).
The other conceptually simple mechanism is a simple thermal one; the incident laser pulse heats up the material from the backside and this thermal energy then diffuses to the front of the foil where it heats up molecules and they eventually desorb. However, the observation that the velocity and, therefore, the kinetic energy of desorbed molecules is independent of the incident desorption laser power and thus surface temperature is not compatible with a purely-thermal desorption model.
The observation that the kinetic energy of desorbed molecules is independent of desorption laser fluence indicates that this is determined by material properties of the foil substrate and/or the molecular sample. This observation, along with the increase in translational temperature in the moving frame, is consistent with a desorption model proposed by Zinovev et al. Zinovev et al. (2007). They explain the LIAD process by an introduction of surface stress between the substrate and the molecular sample – located in isolated islands on the substrate – due to the acoustic and/or thermal wave created by the desorption laser. This surface stress can lead to elastic deformation, decomposition, and cracking of sample islands on the foil band and, eventually, to desorption of molecules. In this conceptual model the kinetic energy transferred to a desorbing molecule is independent of the total incident laser power, and rather depends on the intrinsic characteristics of a given sample island and substrate. A higher laser fluence leads to the introduction of more surface stress and the formation of more cracks and deformation sites, leading to an increase in molecular signal, but does not influence the amount of kinetic energy per molecule. At the same time we note that due to thermal conductivity the higher temperature of the substrate reached for higher desorption laser fluences will also heat up deposited sample molecules due to thermal conduction, leading to internally hotter molecules, increased fragmentation as well as higher translational temperatures.
While it is difficult to theoretically model the amount of energy transferred to each desorbed molecule, Zinovev et al. provide a simple formula to estimate the energy per analyte molecule based on material properties and thermal stress theory Zinovev et al. (2007). Based on this we estimate 25–100 meV of energy per molecule for temperature differences of –200 K. 111We evaluated the energy release per molecule based on the known physical constants for anthracene Bondi (1966), since data for PA was not available. The thermal expansion coefficient of the film is assumed to be . This is well within the range of the measured kinetic energy per molecule which is, based on the average velocity observed, around 50 meV. Thus, our data is fully supportive of the proposed surface stress model.
Conclusion
We presented an advanced LIAD source for the preparation of gas-phase samples of labile molecules, designed for the use at central-facility light sources such as free-electron lasers. It features a prolonged continuous measurement time through automatic sample replenishment, as well as a fixed interaction point. Uniform sample preparation on the long substrate was achieved using an aerosol spraying method based on thin liquid jets. We have characterized the new source using phenylalanine as a sample molecule and SFI as a universal probe method. We observe a significant fraction of intact molecules being desorbed from the foil, with number densities around cm-3 close to the foil band. Due to fragmentation processes induced by the probe, this should be treated as a lower limit. The spatial extend of the molecular plume rapidly spreads out from the point of desorption, leading to a corresponding drop in density. The plume forward translational velocity and temperature in the moving frame are derived by convoluting a Maxwell-Boltzmann velocity distribution with the initial temporal profile near the foil band. The forward velocity, and hence kinetic energy, of molecules desorbed from the foil does not depend on the desorption laser intensity. In contrast to this, the translational temperature clearly increases with increasing desorption intensity. We investigated the fragmentation processes and observe increased fragmentation at higher desorption laser intensity, consistent with the translational temperature behavior. Furthermore, we show that the amount of fragmentation depends on the time of desorption from the foil: shortly after the laser pulse molecules are observed to be hottest, and subsequently they cool down on thermal timescales (10s of µs) as the substrate itself cools down. These observations are fully supported by the previously proposed surface-stress model of the LIAD process.
Our characterization measurements show that our new source produces a stable high-density signal of intact molecules in the gas-phase. With automatic sample replenishment it provides very long continuous measurement times. The produced molecular plume is well suited for further gas-phase experiments and manipulation, and work is currently underway towards integrating this source into a buffer-gas-cooling setup for the production of cold molecules Hutzler et al. (2012), which can then be further manipulated using electric fields Chang et al. (2015). One could also envision to make use of this desorption technique for the entrainment of molecules into supersonic beams, similar to matrix-assisted laser desorption approaches Teschmit et al. (2017).
Supporting Information
The supporting information contains details regarding the
-
•
Experimental setup
-
•
Sample preparation and deposition
-
•
Derivation of Maxwell-Boltzmann velocity distributions
-
•
Temporal profiles at different desorption intensities
Acknowledgements.
In addition to DESY, this work has been supported by the European Research Council under the European Union’s Seventh Framework Programme (FP7/2007-2013) through the Consolidator Grant COMOTION (ERC-614507-Küpper), by the excellence cluster “The Hamburg Center for Ultrafast Imaging – Structure, Dynamics and Control of Matter at the Atomic Scale” of the Deutsche Forschungsgemeinschaft (CUI, DFG-EXC1074), and by the Helmholtz Gemeinschaft through the “Impuls- und Vernetzungsfond”. Z. H. gratefully acknowledges a scholarship of the Joachim-Herz-Stiftung and support by the PIER Helmholtz Graduate School.References
- Filsinger et al. (2008) Filsinger, F.; Erlekam, U.; von Helden, G.; Küpper, J.; Meijer, G. Phys. Rev. Lett. 2008, 100, 133003.
- Filsinger et al. (2009) Filsinger, F.; Küpper, J.; Meijer, G.; Hansen, J. L.; Maurer, J.; Nielsen, J. H.; Holmegaard, L.; Stapelfeldt, H. Angew. Chem. Int. Ed. 2009, 48, 6900–6902.
- Trippel et al. (2012) Trippel, S.; Chang, Y.-P.; Stern, S.; Mullins, T.; Holmegaard, L.; Küpper, J. Phys. Rev. A 2012, 86, 033202.
- Nielsen et al. (2011) Nielsen, J. H.; Simesen, P.; Bisgaard, C. Z.; Stapelfeldt, H.; Filsinger, F.; Friedrich, B.; Meijer, G.; Küpper, J. Phys. Chem. Chem. Phys. 2011, 13, 18971–18975.
- Horke et al. (2014) Horke, D. A.; Chang, Y.-P.; Długołęcki, K.; Küpper, J. Angew. Chem. Int. Ed. 2014, 53, 11965–11968.
- van de Meerakker et al. (2012) van de Meerakker, S. Y. T.; Bethlem, H. L.; Vanhaecke, N.; Meijer, G. Chem. Rev. 2012, 112, 4828–4878.
- Chang et al. (2015) Chang, Y.-P.; Horke, D. A.; Trippel, S.; Küpper, J. Int. Rev. Phys. Chem. 2015, 34, 557–590.
- Holmegaard et al. (2009) Holmegaard, L.; Nielsen, J. H.; Nevo, I.; Stapelfeldt, H.; Filsinger, F.; Küpper, J.; Meijer, G. Phys. Rev. Lett. 2009, 102, 023001.
- Filsinger et al. (2009) Filsinger, F.; Küpper, J.; Meijer, G.; Holmegaard, L.; Nielsen, J. H.; Nevo, I.; Hansen, J. L.; Stapelfeldt, H. J. Chem. Phys. 2009, 131, 064309.
- Trippel et al. (2013) Trippel, S.; Mullins, T.; Müller, N. L. M.; Kienitz, J. S.; Długołęcki, K.; Küpper, J. Mol. Phys. 2013, 111, 1738.
- Stapelfeldt and Seideman (2003) Stapelfeldt, H.; Seideman, T. Rev. Mod. Phys. 2003, 75, 543–557.
- Bisgaard et al. (2009) Bisgaard, C. Z.; Clarkin, O. J.; Wu, G.; Lee, A. M. D.; Geßner, O.; Hayden, C. C.; Stolow, A. Science 2009, 323, 1464–1468.
- Holmegaard et al. (2010) Holmegaard, L.; Hansen, J. L.; Kalhøj, L.; Kragh, S. L.; Stapelfeldt, H.; Filsinger, F.; Küpper, J.; Meijer, G.; Dimitrovski, D.; Abu-samha, M.; Martiny, C. P. J.; Madsen, L. B. Nat. Phys. 2010, 6, 428.
- Seibert et al. (2011) Seibert, M. M. et al. Nature 2011, 470, 78.
- Neutze et al. (2000) Neutze, R.; Wouts, R.; van der Spoel, D.; Weckert, E.; Hajdu, J. Nature 2000, 406, 752–757.
- Boll et al. (2013) Boll, R. et al. Phys. Rev. A 2013, 88, 061402(R).
- Küpper et al. (2014) Küpper, J. et al. Phys. Rev. Lett. 2014, 112, 083002.
- Lindner and Seydel (1985) Lindner, B.; Seydel, U. Anal. Chem. 1985, 57, 895–899.
- de Vries and Hobza (2007) de Vries, M. S.; Hobza, P. Annu. Rev. Phys. Chem. 2007, 58, 585–612.
- Zinovev et al. (2007) Zinovev, A. V.; Veryovkin, I. V.; Moore, J. F.; Pellin, M. J. Anal. Chem. 2007, 79, 8232–8241.
- Golovlev et al. (1997) Golovlev, V. V.; Allman, S. L.; Garrett, W. R.; Taranenko, N. I.; Chen, C. H. Int. J. Mass Spectrom. Ion Proc. 1997, 169–170, 69–78.
- Peng et al. (2006) Peng, W.-P.; Yang, Y.-C.; Kang, M.-W.; Tzeng, Y.-K.; Nie, Z.; Chang, H.-C.; Chang, W.; Chen, C.-H. Angew. Chem. Int. Ed. 2006, 45, 1423–1426.
- Nyadong et al. (2012) Nyadong, L.; Quinn, J. P.; Hsu, C. S.; Hendrickson, C. L.; Rodgers, R. P.; Marshall, A. G. Anal. Chem. 2012, 84, 7131–7137.
- Pérez et al. (2000) Pérez, J.; Ramírez-Arizmendi, L. E.; Petzold, C. J.; Guler, L. P.; Nelson, E. D.; Kenttämaa, H. I. Int. J. Mass Spectrom. 2000, 198, 173–188.
- Shea et al. (2007) Shea, R. C.; Habicht, S. C.; Vaughn, W. E.; Kenttämaa, H. I. Anal. Chem. 2007, 79, 2688–2694.
- Shea et al. (2006) Shea, R. C.; Petzold, C. J.; Campbell, J. L.; Li, S.; Aaserud, D. J.; Kenttämaa, H. I. Anal. Chem. 2006, 78, 6133–6139.
- Habicht et al. (2010) Habicht, S. C.; Amundson, L. M.; Duan, P.; Vinueza, N. R.; Kenttämaa, H. I. Anal. Chem. 2010, 82, 608–614.
- Gao et al. (2011) Gao, J.; Borton, D. J.; Owen, B. C.; Jin, Z.; Hurt, M.; Amundson, L. M.; Madden, J. T.; Qian, K.; Kenttämaa, H. I. J. Am. Soc. Mass. Spectrom. 2011, 22, 531–538.
- Calvert et al. (2012) Calvert, C. R. et al. Phys. Chem. Chem. Phys. 2012, 14, 6289–6297.
- Belshaw et al. (2012) Belshaw, L.; Calegari, F.; Duffy, M. J.; Trabattoni, A.; Poletto, L.; Nisoli, M.; Greenwood, J. B. J. Phys. Chem. Lett. 2012, 3, 3751–3754.
- Calegari et al. (2014) Calegari, F.; Ayuso, D.; Trabattoni, A.; Belshaw, L.; De Camillis, S.; Anumula, S.; Frassetto, F.; Poletto, L.; Palacios, A.; Decleva, P.; Greenwood, J. B.; Martín, F.; Nisoli, M. Science 2014, 346, 336–339.
- Zhang et al. (2016) Zhang, N.; Zhu, K.; Xiong, C.; Jiang, Y.; Chang, H.-C.; Nie, Z. Anal. Chem. 2016, 88, 5958–5962.
- Bulgakov et al. (2014) Bulgakov, A. V.; Goodfriend, N.; Nerushev, O.; Bulgakova, N. M.; Starinskiy, S. V.; Shukhov, Y. G.; Campbell, E. E. B. J. Opt. Soc. Am. B 2014, 31, C15–C21.
- Goodfriend et al. (2016) Goodfriend, N. T.; Starinskiy, S. V.; Nerushev, O. A.; Bulgakova, N. M.; Bulgakov, A. V.; Campbell, E. E. B. Appl. Phys. A 2016, 122, 154.
- DePonte et al. (2008) DePonte, D. P.; Weierstall, U.; Schmidt, K.; Warner, J.; Starodub, D.; Spence, J. C. H.; Doak, R. B. J. Phys. D 2008, 41, 195505.
- Beyerlein et al. (2015) Beyerlein, K. R.; Adriano, L.; Heymann, M.; Kirian, R.; Knoska, J.; Wilde, F.; Chapman, H. N.; Bajt, S. Rev. Sci. Instrum. 2015, 86, 125104–12.
- Teschmit et al. (2017) Teschmit, N.; Gusa, D.; Rubinsky, I.; Horke, D. A.; Küpper, J. J. Chem. Phys. 2017, 147, 144204.
- Linstrom and Mallard (2017) Linstrom, P. J., Mallard, W. G., Eds. NIST Chemistry WebBook, NIST Standard Reference Database Number 69; National Institute of Standards and Technology: Gaithersburg MD, 20899, 2017.
- Lindner (1991) Lindner, B. Int. J. Mass Spectrom. Ion Proc. 1991, 103, 203–218.
- Golovlev et al. (1997) Golovlev, V. V.; Allman, S. L.; Garrett, W. R.; Chen, C. H. Appl. Phys. Lett. 1997, 71, 852–854.
- Calegari et al. (2015) Calegari, F.; Ayuso, D.; Trabattoni, A.; Belshaw, L.; De Camillis, S.; Frassetto, F.; Poletto, L.; Palacios, A.; Decleva, P.; Greenwood, J. B.; Martín, F.; Nisoli, M. IEEE Journal of Selected Topics in Quantum Electronics 2015, 21, 1–12.
- Borton et al. (2013) Borton, D. J.; Amundson, L. M.; Hurt, M. R.; Dow, A.; Madden, J. T.; Simpson, G. J.; Kenttämaa, H. I. Anal. Chem. 2013, 85, 5720–5726.
- Rigg et al. (2014) Rigg, P. A.; Scharff, R. J.; Hixson, R. S. J. Phys.: Conf. Ser. 2014, 500, 032018.
- Note (1) We evaluated the energy release per molecule based on the known physical constants for anthracene Bondi (1966), since data for PA was not available. The thermal expansion coefficient of the film is assumed to be .
- Hutzler et al. (2012) Hutzler, N. R.; Lu, H.-I.; Doyle, J. M. Chem. Rev. 2012, 112, 4803–4827.
- Bondi (1966) Bondi, A. J. Appl. Phys. 1966, 37, 4643–4647.